
Abstract
It is well known that aging leads to a degeneration of the vascular system. Hence, one may hypothesize that spontaneous oscillations decrease in the cerebral microvasculature with aging. Accordingly, the authors investigated the age dependency of spontaneous oscillations in the visual cortex during rest and functional activation. Functional near-infrared spectroscopy was used because it is particularly sensitive to the microvasculature. Visual stimulation led to an increase of oxyhemoglobin, total hemoglobin, and a decrease of deoxyhemoglobin, without any influence of age. Peaks of normalized power spectral density were detected for spontaneous low-frequency (0.07 to 0.11 Hz) and very-low-frequency (0.01 to 0.05 Hz) oscillations, with a higher amplitude for oxyhemoglobin than for deoxyhemoglobin. Spontaneous low-frequency oscillations of oxyhemoglobin and deoxyhemoglobin declined strongly with aging during both rest and visual stimulation. Reduction of spontaneous low-frequency oscillations might indicate a declining spontaneous activity in microvascular smooth muscle cells, in conjunction with an increased vessel stiffness with aging.
Aging leads to a degeneration of the vascular system, probably beginning as early as the fourth decade of life (D'Esposito et al., 2003; Farkas and Luiten, 2001; Kalaria, 1996; Marin, 1995; Shimokawa, 1999). Regional cerebral blood flow decreases, especially in cortical areas, which is related to a shift in vasoregulatory capacity towards the domination of vasoconstrictive processes may be due to the decline of vasodilatory mechanisms. Further, vessel stiffness is enhanced with aging. These phenomena are accompanied by a reduction in the cerebral metabolic rate for oxygen, cerebral glucose utilization, and cellular energy status. Interestingly, the aging brain also shows a compromised microvascular anatomy, which may interact with cerebral brain perfusion and metabolism, contributing to a suboptimal cognitive performance in the elderly. More precisely, aging leads to a decrease in capillary density, thickening of the basement membrane of cerebral microvessels, and microvascular fibrosis. Further, endothelial function and responsiveness of vascular smooth muscle cells are altered. These changes may hinder nutrient and electrolyte transport through the blood–brain barrier.
It is well known that slow oscillations occur in cerebral hemodynamics and metabolism (Intaglietta, 1990; Mayhew et al., 1996; Obrig et al., 2000). Although their origin is controversial, (1) they are characterized by their spontaneity (i. e., they occur without any overt stimulus); (2) they can be differentiated from other oscillatory phenomena called high-frequency oscillations (e.g., the heartbeat at approximately 1 Hz, respiratory cycles at approximately 0.2 or 0.3 Hz) because of their slowness; and (3) they are influenced by pharmacologic (inhibitor of the NO synthase), pathologic conditions (ischemia, large and small artery disease), hypercapnia, and by functional stimulation (reviewed in Obrig et al., 2000). Particularly, spontaneous low-frequency oscillations (LFOs) occurring at approximately 0.1 Hz might be distinguished from spontaneous very-low-frequency oscillations (VLFOs) centered at approximately 0.04 Hz. These spontaneous oscillations were observed with functional near-infrared spectroscopy, laser-Doppler-flowmetry, transcranial Doppler-sonography, and functional magnetic resonance imaging. Hudetz et al. (1998) suggested that spontaneous oscillations in cerebral hemodynamics may represent autoregulatory processes of cerebral blood flow, and that they be of myogenic origin.
Taken together, one may hypothesize that spontaneous oscillations decrease in the cerebral microvasculature with aging. Accordingly, we investigated the age dependency of spontaneous oscillations during rest and visual activation with a checkerboard. We applied functional near-infrared spectroscopy because it is particularly sensitive to the microvasculature (Boushel et al., 2004; Liu et al., 1995a, b), and can measure specifically changes in the concentration of oxyhemoglobin and deoxyhemoglobin, although it has a relatively low spatial resolution (Hoshi et al., 2003; Obrig and Villringer, 2003; Schroeter et al., 2002, 2004b; Strangman et al., 2002).
MATERIALS AND METHODS
Subjects
Fourteen young (mean age, 23.9 ± 3.1 years; range, 19 to 29 years; 7 females) and 14 elderly (65.3 ± 2.9 years; range, 62 to 71 years; 7 females) subjects participated in the study. Written informed consent was obtained from all subjects after complete description of the study was given before the session. The research protocol was approved by the ethics committee of the University of Leipzig, and was in accordance with the latest version of the Declaration of Helsinki. All subjects had normal or corrected-to-normal vision, and were native German speakers. No subject had a history of neurologic or psychiatric disorders. Young subjects did not suffer from any other diseases and did not take any medications. Elderly subjects suffered from arterial hypertension (six subjects), ischemic heart disease (two subjects), hypercholesterolemia, diabetes, thyroid dysfunction, pancreatitis in history, trigeminal neuralgia, arthrosis, and prostate hyperplasia (one subject, respectively). Accordingly, they received angiotensin-converting enzyme inhibitors/receptor blockers (five subjects), beta-adrenergic blockers, calcium channel blockers, estrogens (two subjects, respectively), isosorbide dinitrate, digitoxin, acetyl salicylic acid, statins, salbutamol, L-thyroxin, pancreatin, carbamazepine, tamsulosin (one subject, respectively).
Data acquisition by functional near-infrared spectroscopy
Changes in the concentration of oxyhemoglobin and deoxyhemoglobin as well as the redox state of the cytochrome c oxidase* were measured by a NIRO-300 spectrometer (Hamamatsu Photonics K.K., Hamamatsu, Japan; four wavelengths 775, 810, 850, and 910 nm) and expressed in nanomoles per liter. Values were calculated according to Cope and Delpy (1988). Moreover, we calculated changes in the concentration of total hemoglobin (sum of oxyhemoglobin and deoxyhemoglobin) as a measure for changes in regional cerebral blood volume. Two channels were measured at a sampling frequency of 6 Hz. The distance between emitter and detector was 4 or 5 cm, depending on specific light attenuation. Although depth penetration of light depends on several factors (Okada et al., 1997; Okada and Delpy, 2003), concentration changes of oxyhemoglobin and deoxyhemoglobin can be detected in cortical regions (Germon et al., 1999). It is known from the literature that differential pathlength factors (DPF) are age dependent (Duncan et al., 1996). Accordingly, DPFs were calculated by the formula 5.13 + 0.07 x (age0.81) in the young subjects. Precise formulas for DPFs in subjects older than age 50 years are currently unknown. Therefore, we set the DPF to 6.79 in the elderly subjects, representing the DPF of the oldest age group examined by Duncan et al. (1996). For all experiments, subjects were seated in an electroencephalography chair in a quiet, dimmed room. The standard silicon holders of the NIRO-300 for emitter/detector were fixed with a bandage to the head after removing hair, and were protected from ambient light by a black cloth. For both experiments, optodes were placed at O1/2 of the international 10/20 system localized over the calcarine fissure (Homan et al., 1987; Steinmetz et al., 1989).
Psychophysical procedures and data analysis
Visual stimulation was performed with a full-field checkerboard alternating at 1.8 Hz presented on a computer screen. The resting condition consisted of a black screen. Fixation was maintained by instructing subjects to fixate a gray point in the screen center that was shown during the whole experiment. Each stimulation period lasted 18 seconds, the period known to elicit a maximal hemodynamic response (Panczel et al., 1999), and was preceded by a resting period of 17 seconds. As illustrated in Fig. 1, eight cycles were performed in each block and all subjects underwent two blocks in one session (total time of 13.3 minutes). The mean of the signal intensity during the “baseline” (8 seconds before trial onset) and the “vascular response” (5 to 23 seconds after trial onset) was calculated for each subject and parameter, because the vascular response appeared 5 to 23 seconds after the beginning of visual stimulation (Fig. 2). Differences between the mean of the vascular response and the baseline revealed a measure of the hemodynamic response. Significance of concentration changes of the several chromophores was tested with one-sample Student's t-tests against 0 for both age groups separately. Thereafter, both age groups were compared with unpaired Student's t-tests. Moreover, subjects were examined during rest without undergoing any stimulation with closed eyes for 6 minutes.
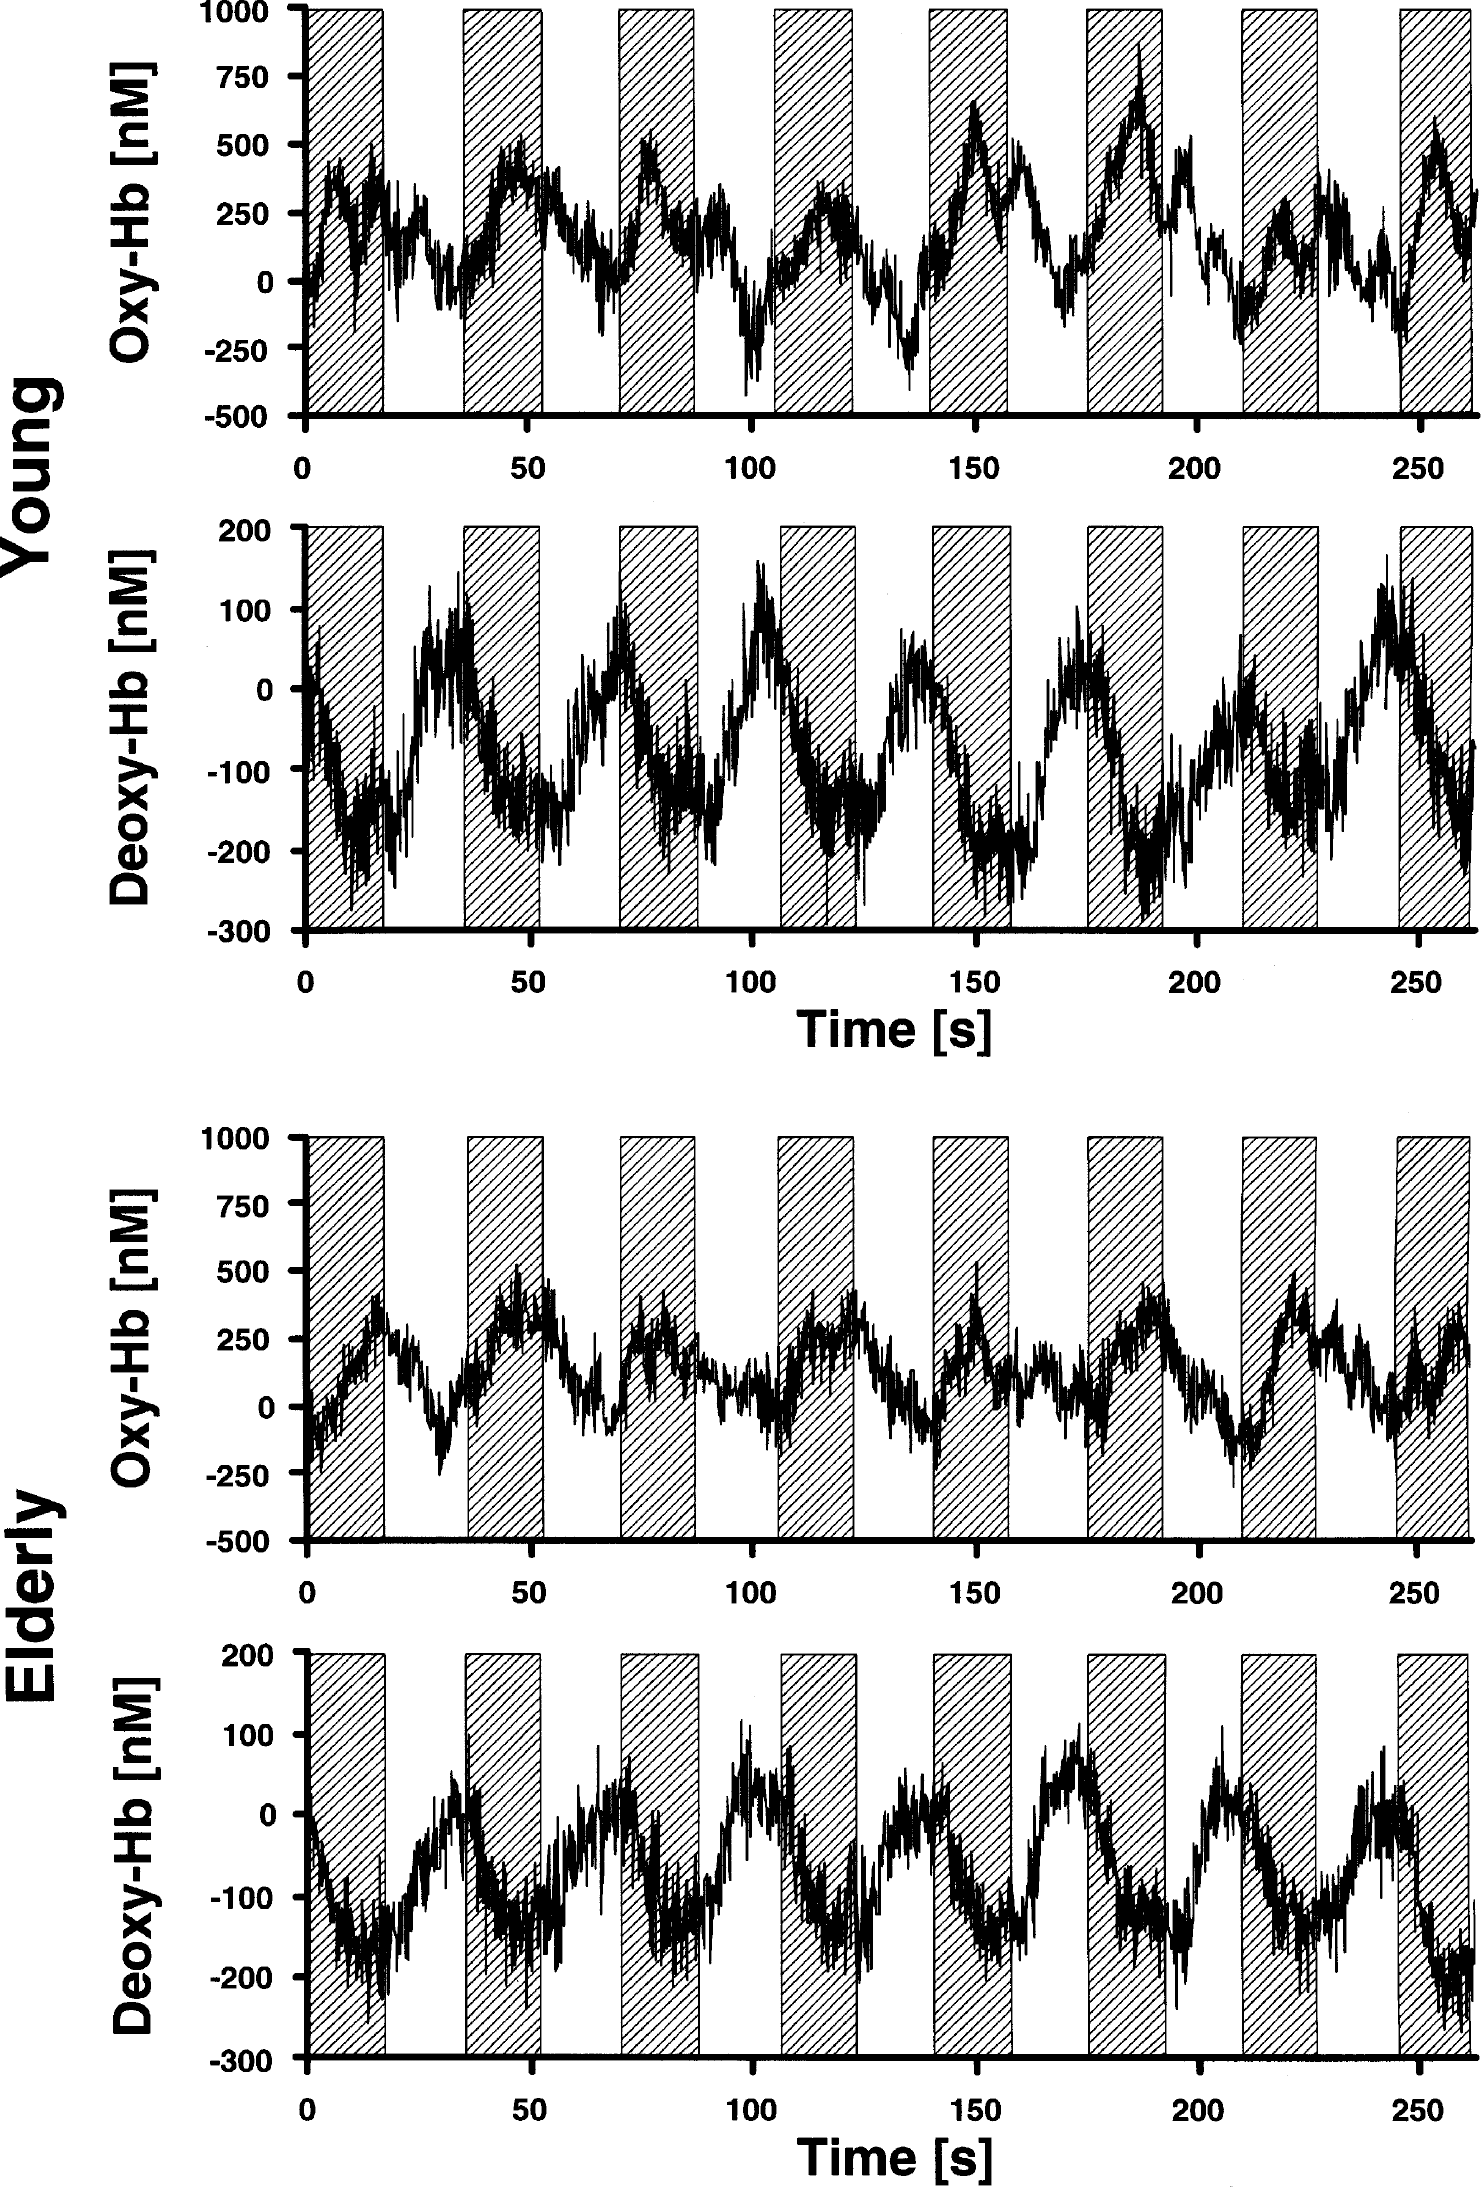
Concentration changes of oxyhemoglobin and deoxyhemoglobin (Hb) in the right visual cortex in 14 young and 14 elderly subjects during the second block of stimulation with a checkerboard (marked by gray boxes).
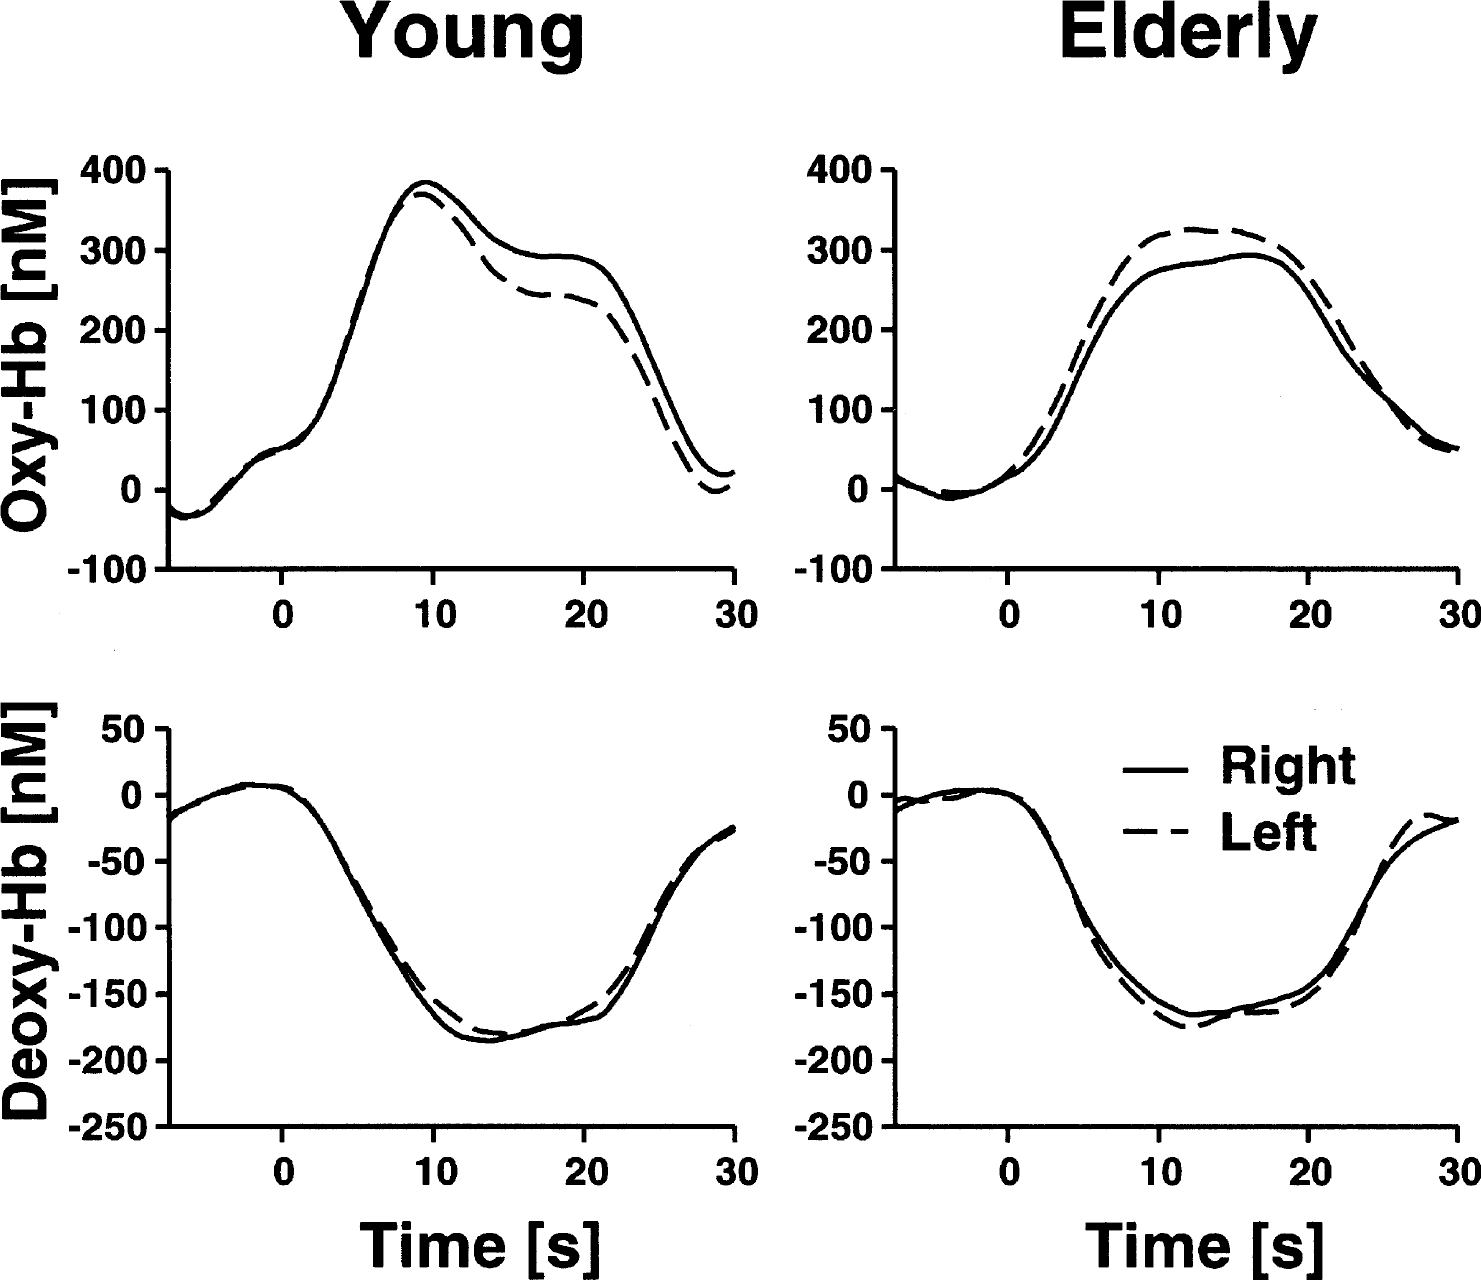
Epoch-related concentration changes of oxyhemoglobin and deoxyhemoglobin (Hb) in the right and left visual cortex during stimulation with a checkerboard. Stimulation lasted from 0 to 18 seconds. Running averages over 5 seconds, after averaging across 14 young and 14 elderly subjects and the several stimulation epochs. Each subject completed two blocks of eight stimulation cycles.
For analysis in the frequency domain, power spectral density (PSD) was calculated using a Hanning window of 512 data points with an overlap of 256 data points (corresponding to a period of 85.3 seconds and 42.7 seconds, respectively). The resulting frequency range of 0.018 to 3 Hz was chosen because peaks appeared in that range in our study and previous studies (Obrig et al., 2000). PSD was normalized for every subject to 1 (integral normalization) as proposed by Schroeter et al. (2004a). This procedure matches with normalization by dividing the absolute amplitude of the PSD at particular frequencies by the mean amplitude of the entire spectrum (Kvandal et al., 2003; Kvernmo et al., 1998). Because both the numerator and denominator contain the same (age-dependent) DPFs as factors, it may be canceled. Hence, results are almost independent from the assumed DPF (Schroeter et al., 2004a). Thereafter, means of PSD were calculated across all young and elderly subjects during stimulation and rest. Repeated-measure analyses of variance (ANOVAs) and post hoc Student's t-tests were performed to investigate effects of age and stimulation for different spectral windows.
To exclude the possibility of diagnoses or medication biasing our results, we investigated their influence as additional between-subject factors in the ANOVA procedure. Factors were included only if an effect on the vascular system was assumed and at least three subjects were affected. Hence, one diagnosis (arterial hypertension) and one group of drugs (angiotensin-converting enzyme inhibitors/receptor blockers) were involved (Levy et al., 2001; Rizzoni et al., 2003). Results are generally given as means ± SD.
RESULTS
The concentration of deoxyhemoglobin decreased, whereas the concentration of oxyhemoglobin increased, in young and elderly subjects during visual stimulation with the checkerboard (Figure 1 and 2). For statistical analysis, concentration changes on the right and left side were averaged (full-field stimulation). Concentration changes were significant for all parameters in both young and elderly subjects (oxyhemoglobin: 304 ± 212 nmol/L, 273 ± 181 nmol/L; deoxyhemoglobin: −156 ± 83 nmol/L, −150 ± 102 nmol/L; total hemoglobin: 147 ± 186 nmol/L, 125 ± 113 nmol/L; P < 0.001 for oxyhemoglobin and deoxyhemoglobin; P < 0.01 for total hemoglobin in young subjects and P < 0.001 for total hemoglobin in elderly subjects; one-tailed, one-sample Student's t-test against 0). To assess the influence of age, concentration changes of the parameters were compared between young and elderly subjects with a two-tailed, unpaired Student's t-test. There was no significant impact of age on oxyhemoglobin, deoxyhemoglobin, and total hemoglobin (P < 0.05). Diagnosis and medication did not influence concentration changes as examined by an ANOVA, including, bedside age, hypertension and angiotensin-converting enzyme inhibitors/receptor blockers as additional between-subject factors (oxyhemoglobin: F = 1.6, 1.1; deoxyhemoglobin: F = 1.3, 1.4; total hemoglobin: F = 0.8, 0.4; df = 1, P > 0.05, respectively).
Figure 3 shows the averaged normalized PSD for oxyhemoglobin in the visual cortex of young subjects during rest. Obviously, peaks were obtained for spontaneously VLFOs and LFOs (0.023 Hz and 0.094 Hz, respectively). As illustrated in Fig. 4, almost the same pattern was observed for the VLFOs of deoxyhemoglobin in the young and elderly subjects during rest (peak, 0.023 Hz). For LFOs during rest, peaks were found for oxyhemoglobin (0.094 Hz) in the young subjects only, whereas PSD declined continuously in the elderly with an increasing frequency and, therefore, no LFO peak was observed. Stimulation led to a peak at 0.023 Hz in all chromophores and in both age groups in accordance with a stimulation cycle of 35 seconds, corresponding to 0.028 Hz. The slight difference between peak and stimulation frequency was related to a limited spectral resolution of the PSD. A second peak was detected again for the LFOs at 0.094 Hz (oxyhemoglobin in the young subjects) or 0.082 Hz (deoxyhemoglobin in the young subjects; both chromophores in the elderly subjects). To quantify spontaneous oscillations, means were calculated for a spectral window of 0.01 to 0.05 Hz for VLFOs and of 0.07 to 0.11 Hz for LFOs, as concluded from the location of the peaks (Fig. 4).
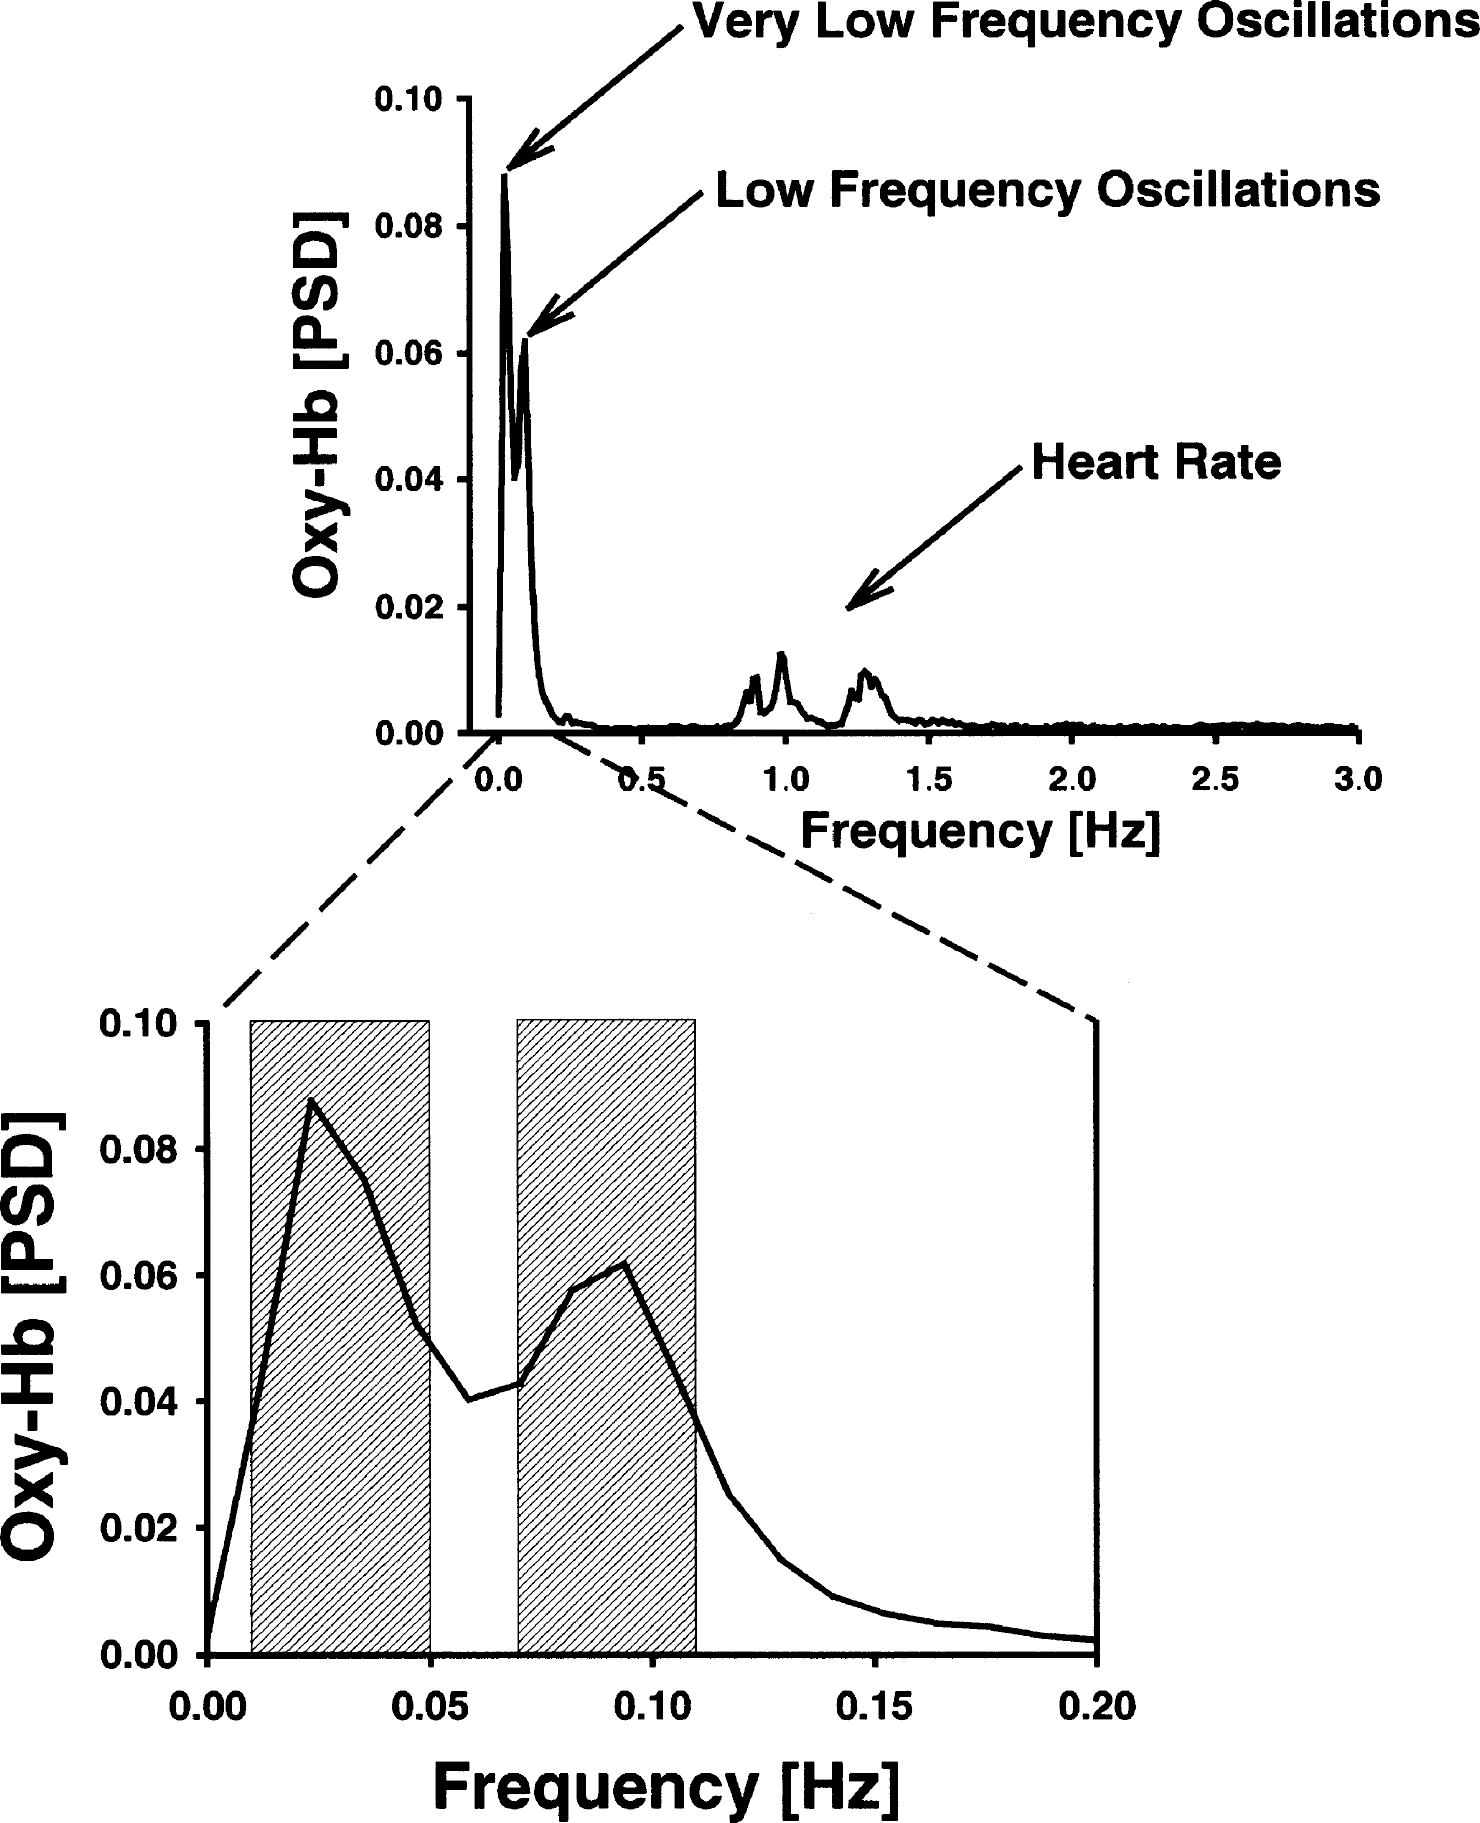
Normalized power spectral density (PSD) of oxyhemoglobin (Oxy-Hb) in young subjects during rest. Spontaneous very low and low frequency oscillations were analyzed as mean in the spectral windows of 0.01 to 0.05 Hz and 0.07 to 0.11 Hz, respectively.
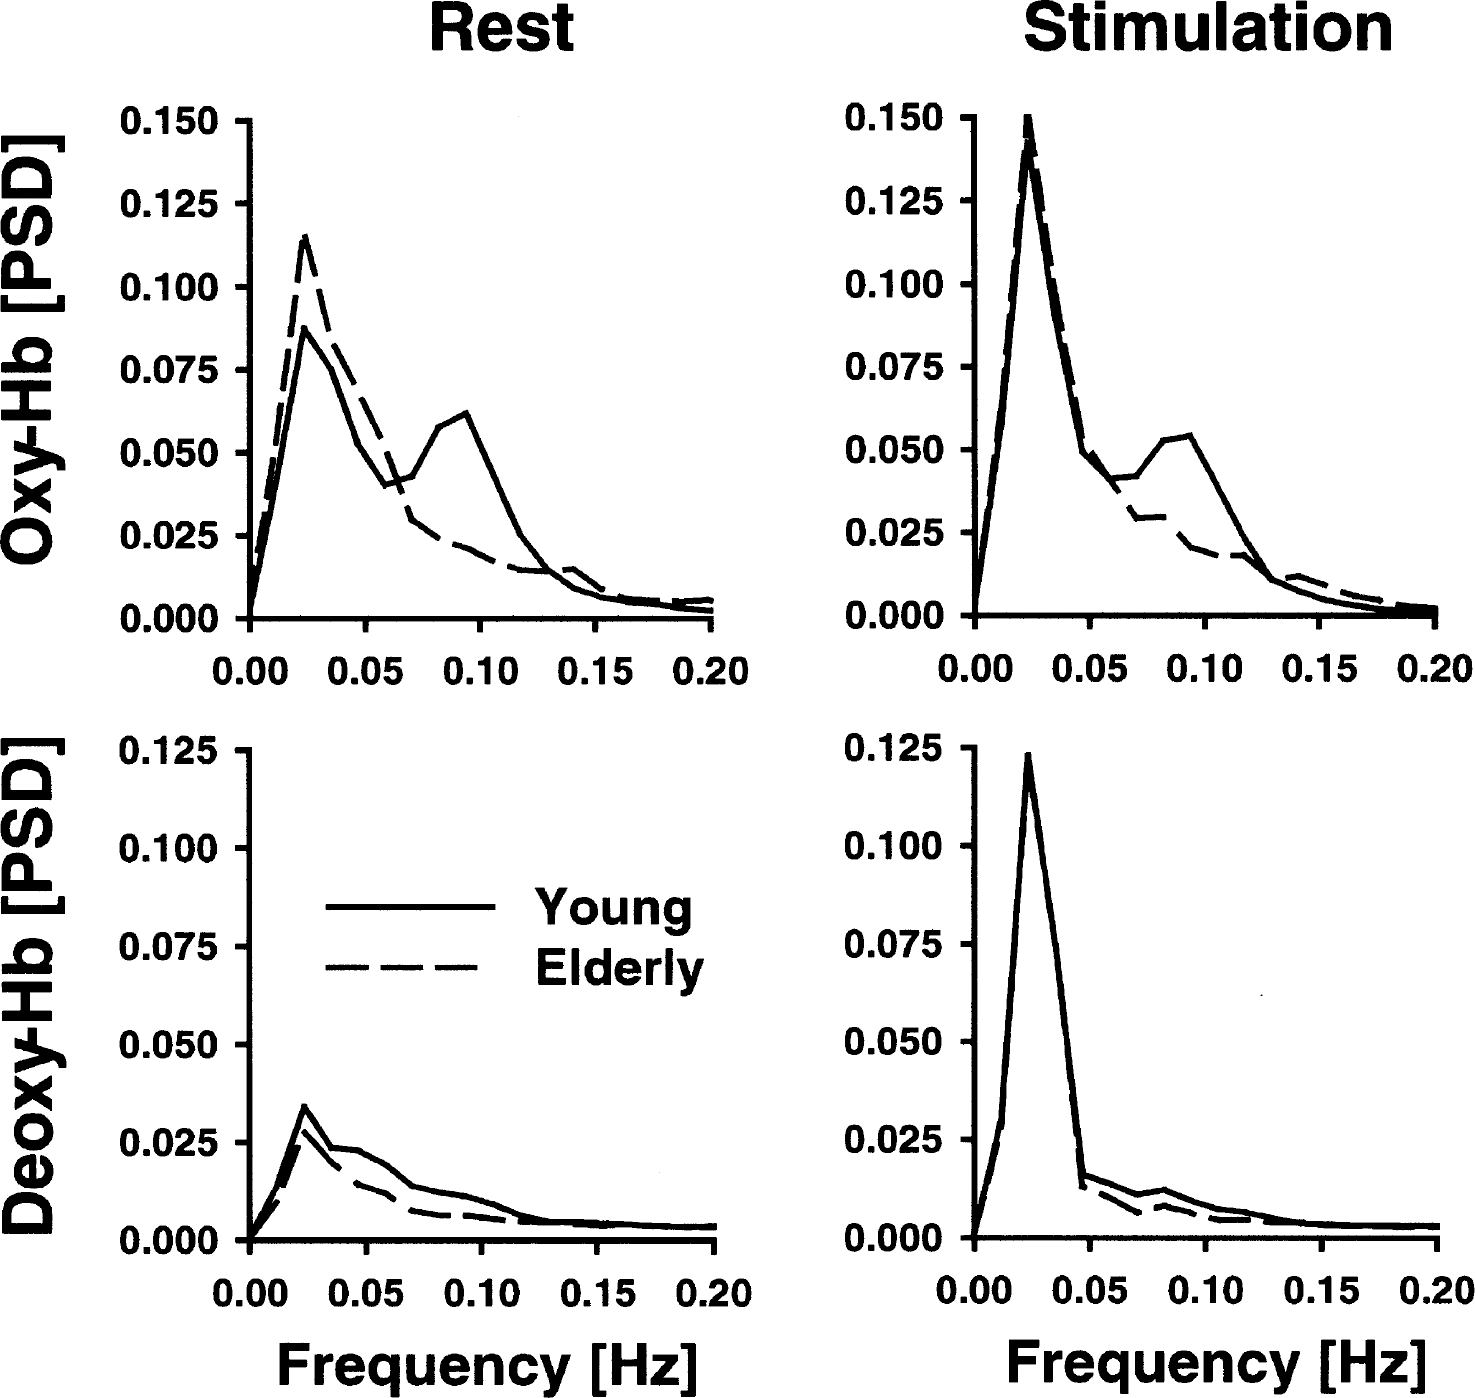
Normalized power spectral density (PSD) between 0 and 0.2 Hz in young versus elderly subjects in the visual cortex during rest and stimulation with a checkerboard. The frequency range includes spontaneous very-low-frequency and low-frequency oscillations and the stimulation frequency. Hb, hemoglobin.
As illustrated in Fig. 5, the PSD of VLFOs and LFOs was generally stronger for oxyhemoglobin than for deoxyhemoglobin. For every chromophore, a repeated-measure ANOVA was performed for the VLFOs and LFOs, including stimulation (stimulation vs. rest) as a within-subject factor and age (young vs. elderly) as a between-subjects factor (Table 1). Data were again averaged between the right and left side (full-field stimulation).
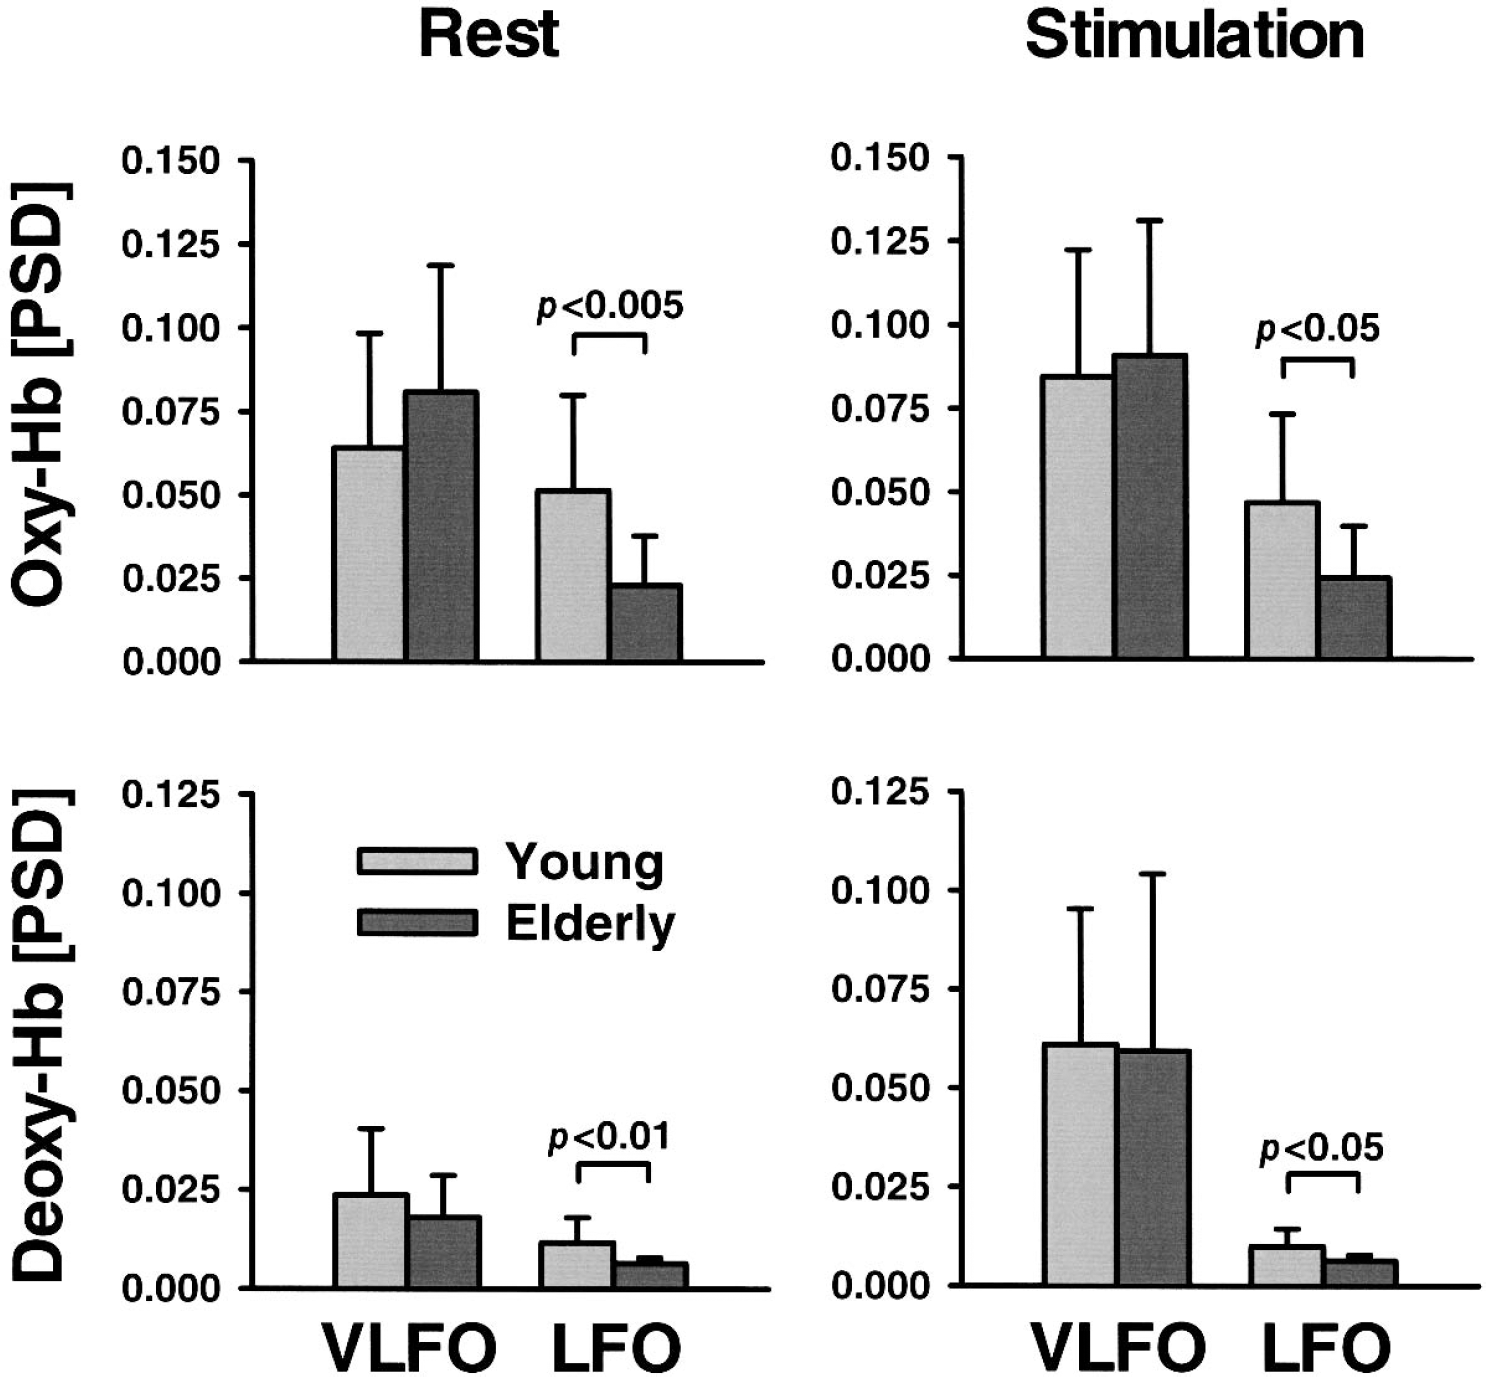
Normalized power spectral density (PSD) of spontaneous very-low-frequency oscillations (VLFO) and low-frequency oscillations (LFO) in young versus elderly subjects in the visual cortex during rest and stimulation with a checkerboard. Note that stimulation frequency is contained in the VLFO range. Hb, hemoglobin. Data are means ± SD. Significance values were tested with a two-tailed, unpaired Student's t-test.
Effects of age and visual stimulation on normalized power spectral density of spontaneous very-low-frequency oscillations (VLFO) (0.01 to 0.05 Hz) and low-frequency oscillations (LFO) (0.07 to 0.11 Hz)
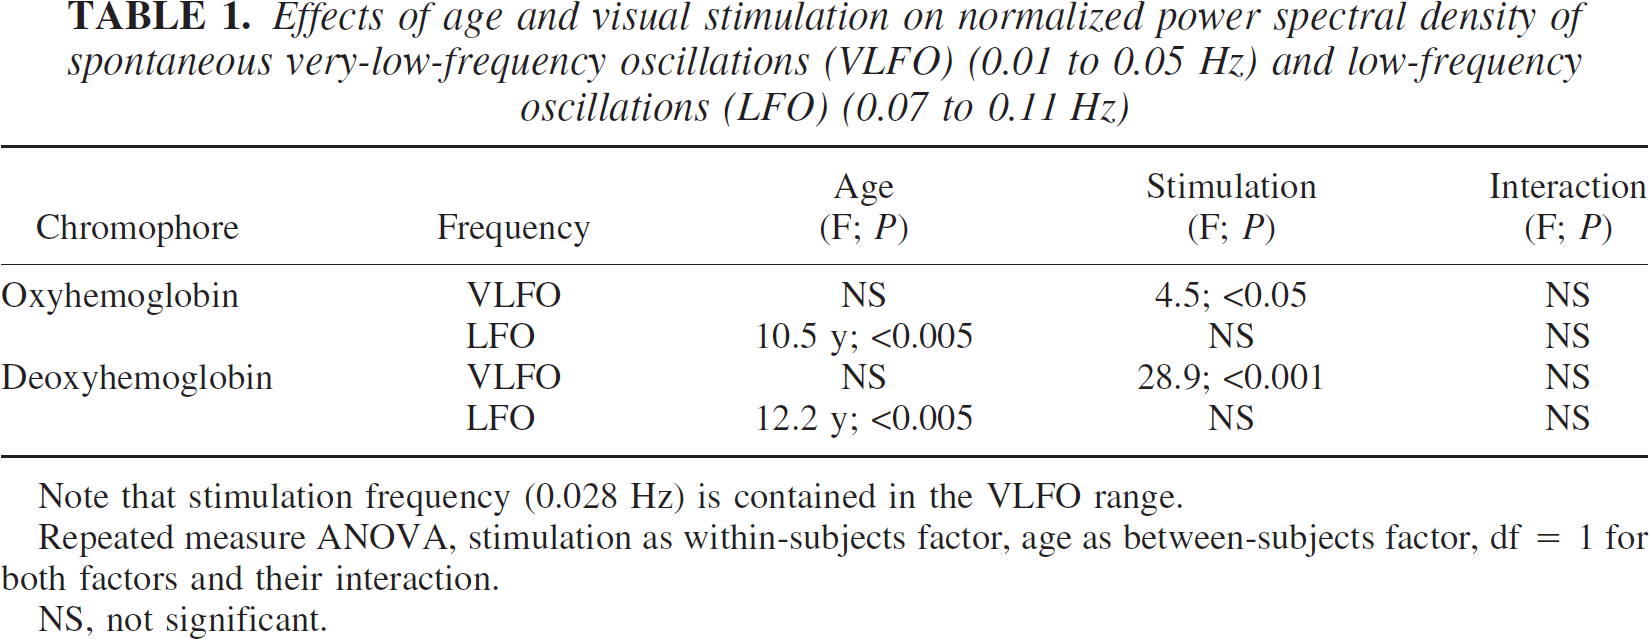
Note that stimulation frequency (0.028 Hz) is contained in the VLFO range.
Repeated measure ANOVA, stimulation as within-subjects factor, age as between-subjects factor, df = 1 for both factors and their interaction.
NS, not significant.
Age significantly influenced the LFOs of oxyhemoglobin and deoxyhemoglobin. The mean PSD of the LFOs was higher in the young subjects than in the elderly subjects for both chromophores during rest and stimulation as revealed by post-hoc Student's t-tests (Fig. 5). Stimulation generally had no impact on the LFOs. The interaction between age and stimulation was generally not significant. The impact of diagnosis and medication on LFOs was investigated with a repeated-measure ANOVA, including stimulation as a within-subject factor and, beside age, hypertension and angiotensin-converting enzyme inhibitors/receptor blockers as additional between-subjects factors. Neither hypertension nor medication influenced LFOs (oxyhemoglobin: F = 1.6, 0.0; deoxyhemoglobin: F = 0.3, 0.0; df = 1, P > 0.05, respectively).
Further, the ANOVA revealed that stimulation significantly influenced the VLFOs of all chromophores (Table 1, Fig. 5). Visual stimulation was performed with a frequency of 0.028 Hz. Accordingly, we hypothesized that mean PSD in the VLFO range was generally higher during stimulation compared with the resting condition. Post hoc analysis revealed a significant effect for all chromophores except oxyhemoglobin in the elderly subjects when differences between rest and stimulation were compared for young and elderly subjects separately (young: oxyhemoglobin P < 0.01, deoxyhemoglobin P < 0.001; elderly: oxyhemoglobin P < 0.05, deoxyhemoglobin P < 0.005; one-tailed, paired Student's t-test). The impact of diagnosis and medication on VLFOs was again investigated with a repeated-measure ANOVA including stimulation as a within-subject factor, and, beside age, hypertension, and angiotensin-converting enzyme inhibitors/receptor blockers as additional between-subjects factors. Neither hypertension, nor medication had any significant impact on VLFOs (oxyhemoglobin: F = 1.1, 0.5; deoxyhemoglobin: F = 2.6, 1.3; df = 1, P > 0.05, respectively).
DISCUSSION
We detected peaks of the PSD at approximately the same frequencies as other functional near-infrared spectroscopy or optical studies investigating spontaneous oscillations in the cortex (Elwell et al., 1999; Mayhew et al., 1996; Obrig et al., 2000; Taga et al., 2000). Further, the PSD of LFOs and VLFOs was much higher in oxyhemoglobin than in deoxyhemoglobin, especially during rest, in accordance with previous reports (Obrig et al., 2000). As illustrated in Fig. 3, we detected also oscillations at approximately 0.25 Hz and several peaks between 0.8 and 1.4 Hz representing the influence of respiration and heartbeat on cerebral blood flow.
Most strikingly, our results show that aging influences spontaneous slow oscillations in the cerebral microvasculature. LFOs (0.07 to 0.11 Hz) decreased for all chromophores during both stimulation and rest, whereas VLFOs remained unaltered (0.01 to 0.05 Hz). Our data fit well with the results of Hutchins et al. (1996) showing that the amplitude of vasomotions in the cerebral arterioles of sedated rats decreased with aging. Several mechanisms might influence spontaneous oscillations. Vascular smooth muscle cells constitute, together with elastic laminae, the medial vessel layer (Lundberg and Crow, 1999). They are highly specialized contractile cells that control lumen diameter, and thereby regulate blood flow in response to nervous, hormonal, and local influences. Interestingly, the LFOs range corresponds well with the spontaneous activity recorded in microvascular smooth muscle cells (Golenhofen, 1970). Meyer et al. (1988) and Schmidt et al. (1992) concluded that this myogenic pacemaker mechanism causes vasomotion in terminal arterioles, and, hence, regulates capillary perfusion (Harrison et al., 2002). The intrinsic smooth muscle activity of resistance vessels was also shown for the skin at approximately 0.1 Hz with laser-Doppler-flowmetry (Kvandal et al., 2003; Kvernmo et al., 1998).
It is well known that aging leads to stiffening of the vascular wall by fibrosis (Lundberg and Crow, 1999). More precisely, the volume density of collagen increases, whereas that of elastin decreases. Collagen fibrils become organized into multibranched bundles, whereas elastin fibers become disorganized, thinner, and often fragmented with age. Further, smooth muscle elements of vascular structures diminish (Hutchins et al., 1996). Hence, reduction of LFOs with aging, as observed in our study, may indicate a declining spontaneous activity in microvascular smooth muscle cells, presumably due to an increased stiffness.
The vascular tonus might also be modulated by nervous influences. Sympathetic stimulation may alter LFOs in cerebral microvasculature as shown by laser-Doppler-flowmetry (Deriu et al., 1996). Moreover, VLFOs in the skin may originate from neurogenic stimulation of resistance vessels (Kvandal et al., 2003; Kvernmo et al., 1998). In our study, VLFOs were generally independent of age. Intaglietta (1990) proposed that slow vasomotions (VLFOs) occur in larger vessels, whereas fast vasomotions (LFOs) originate from terminal arterioles. Neurogenic innervation was shown for larger cerebral vessels, whereas it is negligible in small ones (Farkas and Luiten, 2001; Ursino, 1991). Hence, our data suggest that neurogenic stimulation is almost unaltered in aging.
Visual stimulation led to an increase of oxyhemoglobin, total hemoglobin, and to a decrease of deoxyhemoglobin due to neurovascular coupling (Villringer and Dirnagl, 1995; Villringer and Chance, 1997). Amounts of concentration changes were in agreement with previous functional near-infrared spectroscopy studies (Heekeren et al., 1999; Obrig et al., 2000; Schroeter et al., 2004a; Wobst et al., 2001; Wolf et al., 2002). Although the hemodynamic response declines with aging in association cortices starting from roughly 50 years of age, it is said to decline in primary cortices after 65 years of age (Buckner et al., 2000; D'Esposito et al., 1999; Hock et al., 1995; Huettel et al., 2001; Mehagnoul-Schipper et al., 2002; Ross et al., 1997; Schroeter et al., 2003). Accordingly, we did not find age-related differences in the mean hemodynamic response of oxyhemoglobin, deoxyhemoglobin, and total hemoglobin during visual stimulation. Taking together results of both approaches, spectral analysis and time-line analysis of the functional hemodynamic response, one may conclude that the former method is much more sensitive to age-related changes in the microvasculature than the latter one, and enables an earlier detection of such alterations.
In conclusion, spontaneous low-frequency oscillations decrease with aging in the microvasculature of the human visual cortex during both rest and functional activation. Our findings suggest a decline in spontaneous activity in microvascular smooth muscle cells in conjunction with an increase in vessel stiffness.
Footnotes
*
We used a spectrometer with four wavelengths. Although this approach enables a small cross-talk of oxyhemoglobin and deoxyhemoglobin, data for cytochrome c oxidase might have been mimicked by cross-talk effects (i.e., a change in hemoglobin concentration might yield an artifactual change in the cytochrome c oxidase signal) (Heekeren et al., 1999; Strangman et al. 2003; Uludag et al., 2002). Hence, results for cytochrome c oxidase are generally not shown.