
Abstract
The study aims to assess the spontaneous oscillations in elderly subjects based on the wavelet transform of cerebral oxygenation (CO) and arterial blood pressure (ABP) signals. Continuous recordings of near-infrared spectroscopy (NIRS) and ABP signals were obtained from simultaneous measurements in 20 young subjects (age: 27.3 ± 7.1 years) and 15 elderly subjects (age: 70.8 ± 5.1 years) at rest. Using spectral analysis based on wavelet transform, five frequency intervals were identified (I, 0.005 to 0.02 Hz; II, 0.02 to 0.06 Hz; III, 0.06 to 0.15 Hz; IV, 0.15 to 0.40 Hz; and V, 0.40 to 2.0 Hz). The average amplitudes of the Δ[HbO2] and tissue oxygenation index in intervals I to V and the relative amplitudes in intervals IV and V were significantly lower in elderly subjects than in young subjects (P < 0.05). In addition, the relative amplitudes of the ABP in interval I were significantly lower in elderly subjects than in young subjects (P = 0.016). The present findings suggest the presence of a cerebrovascular degenerative process caused by aging. Spontaneous oscillations in the CO could be used as an indicator of cerebrovascular changes and could be used to identify the risk for cerebrovascular degenerative processes.
INTRODUCTION
Aging is associated with marked structural and functional alterations in the cerebrovascular and cardiovascular systems.1–3 Age-correlated alterations in cerebral vasculature and autoregulatory mechanisms are the subject of interest in many studies.4–7
Near-infrared spectroscopy (NIRS) is particularly sensitive to the microvasculature and can measure changes specifically in the concentration of oxyhemoglobin (HbO2) and deoxy-hemoglobin (Hb).8–11 Mehagnoul-Schipper et al 12 showed a decreased cortical HbO2 concentration and increased cortical Hb concentration in elderly subjects after posture change, and these findings indicate that regulation of cerebral oxygenation (CO) alters with increasing age. Safonova et al 4 used frequency-domain NIRS to measure changes in cerebral tissue oxygenation and in HbO2 and Hb concentrations caused by hypoxia during breath holding and observed age-correlated changes in the cerebral hemodynamics of normal subjects at rest.
The spectral analysis of signals, oxygenated [HbO2] and deoxygenated [Hb], deals with the dynamics of tissue oxygenation.10,11 Spontaneous oscillations are often found in the spectral analysis of CO signals measured using NIRS.5,10,11,13–15 The power spectrum of CO signals shows oscillations in various frequency bands. Obrig et al 9 showed low frequency (LF) oscillations centered at ~0.1 Hz and slower oscillations at ~0.04 Hz in the human brain using NIRS. Tachtsidis et al 16 showed oscillations in various frequency bands including very low frequency, 0.02 to 0.04 Hz, LF 0.04 to 0.15 Hz, and high frequency 0.15 to 0.4 Hz.
Spectral analyses were performed using Fourier transform or autoregressive methods. However, Fourier transformation fails either in following up the time evolution of high frequency events or the estimation of the frequency content of the LF band.17,18 Wavelet transform provides windows of adjustable length, thereby offering the benefit of showing high revolution in both high frequency and LF components. 18 Compared with autoregressive estimation, wavelet transform is calculated directly from data, and the limitations of linear modeling and the choice of model order are thus avoided. 18 Using wavelet transform, Stefanovska and co-authors studied blood flow oscillations in cardiovascular system with five frequency intervals (I, 0.0095 to 0.02 Hz; II, 0.02 to 0.06 Hz; III, 0.06 to 0.15 Hz; IV, 0.15 to 0.4 Hz; V, 0.4 to 1.6 Hz).17,18 In our previous studies, similar intervals were identified using the wavelet transform of NIRS signals recorded from the prefrontal lobe.10,11
Spontaneous LF oscillations of HbO2 and Hb decline strongly with aging at rest. 5 The correlation values in the interaction of cerebral and cardiovascular LF oscillations exhibit significant increases under orthostatic stress in young subjects but not in old subjects. 19 In this study, we hypothesize that spontaneous oscillations in CO and arterial blood pressure (ABP) change in elderly subjects because of aging. Accordingly, this study aims to analyze the spectral power of CO and ABP signals, and determine age-related changes in spontaneous oscillations in CO and ABP at rest.
MATERIALS AND METHODS
SUBJECTS
A total of 35 subjects were recruited from Shandong university to participate in this study, among whom 20 were young subjects (age: 27.3 ± 7.1 years; Group Young) and 15 were elderly subjects (age: 70.8 ± 5.1 years; Group Old). Table 1 shows the characteristics of the participants.
Characteristics of the participants
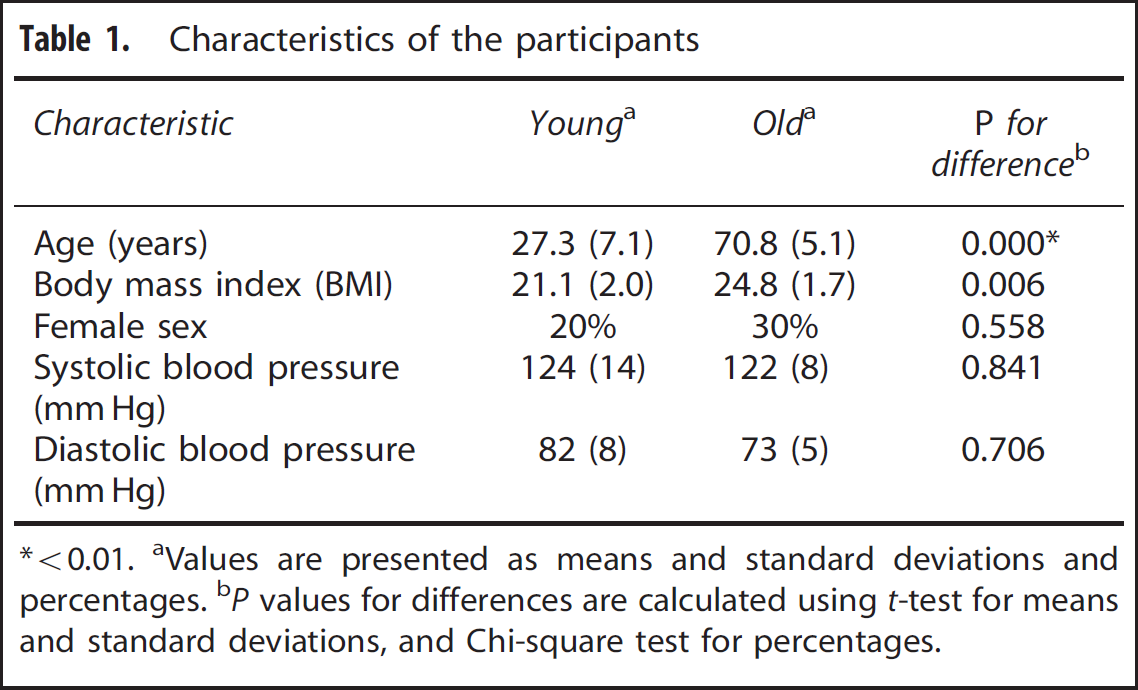
<0.01.
Values are presented as means and standard deviations and percentages.
P values for differences are calculated using t-test for means and standard deviations, and Chi-square test for percentages.
Excluded from the study were subjects with (1) hypertension; (2) diabetes mellitus; (3) subarachnoid hemorrhage; (4) insufficiency of the heart, lungs, kidneys, and liver; (5) smoking or drinking habits, and (6) additional medications (angiotensin-converting enzyme, inhibitors/angiotensin II receptor blockers, and calcium channel blockers). A diagnosis of hypertension was made if systolic blood pressure (BP) ≥140 mm Hg or diastolic BP ≥90 mm Hg. 20 A diagnosis of diabetes mellitus was based on clinical assessment or fasting serum glucose level. Hypercholesterolemia was defined as a total fasting serum cholesterol level of ≥220 mL/dL.
Before the experiment, basic subject information, including age, weight, height, BP, and brief medical history, was recorded (Table 1). Informed consent was obtained from all subjects. The experimental procedures were approved by the Human Ethics Committee of Shandong University and were in accordance with the ethical standards specified by the Helsinki Declaration of 1975 (revised in 1983).
Measurement
Data for NIRS signal and ABP were obtained from simultaneous measurements. The NIRS method depends on the differential absorption properties of hemoglobin in the NIR region between 700 and 1,000 nm.
8
At 760 nm, the absorption spectrum of Hb is greater than that of HbO2; the opposite is true at 850 nm. The Tissue Saturation An Heng monitor (TSAH-100) uses the difference in absorbance between these two wavelengths to measure the change in regional blood volume (or change in total hemoglobin). Tissue absorbency measurements were recorded and converted into optical density (OD) units using the modified Beer–Lambert law.
21
Based on the modified Beer–Lambert law, we have
22


The difference in OD between these two wavelengths was considered as an index of tissue oxygenation, whereas the sum signal reflected the relative change in blood volume, which is proportional to [tHb]. The relative changes in concentration including Δ[Hb], Δ[HbO2], and Δ[tHb] were calculated in real time using the modified Beer–Lambert law and the tissue oxygenation index (TOI) was calculated in real time using the spatially resolved spectroscopy (SRS) algorithm. 21
After the age, height and body mass of the subjects were recorded, NIRS measurements were obtained using the TSAH-100 developed by Tsinghua University, China. The eyes of the subjects were open during data acquisition. To minimize head movements, the subjects were in comfortable sitting posture, and their gaze was controlled by presenting a crosshair on the computer monitor. The sensor consisted of a two-wavelength light-emitting diode and two PIN diodes. The former component served as the source and emitted light at wavelengths of 760 and 850 nm, whereas the latter components served as the detectors. Photons could penetrate the overlying tissues into the cerebral cortex (gray matter) when the distance between the detector and the source is ≥30 mm, and the penetration depth could reach its maximum value when the distance is 40 mm. 21 Therefore, the distances between the light source and the two detectors were set to 30 mm (S1) and 40 mm (S2), respectively. The differential signal (S1 – S2) in the OD recorded by the two detectors was used to obtain the cortical signal. This configuration was validated by Teng et al 21 . The forehead of each subject was cleaned using medical alcohol and then the sensors were carefully fixed using a flexible and adhesive fixation pad and an elastic band. A sensor was placed on the left forehead, 1.5 cm lateral to the cerebral midline to avoid the sagittal sinus, and at least 2 cm above the eyebrow to avoid the frontal sinus. The sensor was secured with a tensor bandage wrapped around the forehead, taking sufficient care to ensure there would be no admission of background light. The sampling rate of the NIRS-derived signals was set to 10 Hz. The CO signal was monitored for 10 minutes at the frontal lobe using NIRS.
The continuous BP waveform was monitored noninvasively with a transducer attached to the wrist using a BP analysis system (FDP-I, Shanghai Science Teaching Co., Shanghai, China) at a sampling of 250 Hz. The measured BP data were resampled to 10 Hz using the spline interpolation method provided by Matlab (The Mathworks, Inc, Natick, MA, USA).
Preprocessing of Data for Spectral Analysis
In this study, wavelet transform was used to detect and remove movement-related artifacts. In particular, wavelet transform was applied to the NIRS time series to decompose them into signal and uncorrelated noise components in distinct scales. Using the default threshold criterion, unknown artifacts in NIRS data were removed. This method was showed in detail in our recent paper. 23 In addition, the average of whole recorded segment in ODs was used for signal normalization to avoid systematic differences between subjects and groups.
Spectral Analysis
The method of wavelet transform was described previously in detail.
24
A continuous wavelet transform projects a signal s on a family of zero-mean functions, called the wavelets, deduced from an elementary function, called the mother wavelet Ψ(u), through translations and dilations.
17
The continuous wavelet transform of a signal s is defined as
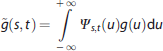
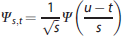
The continuous wavelet transform is a mapping of the function g(u) onto the time-frequency plane. Through adjustment of the window used in wavelet transform, slower and faster events can be categorized accordingly. 17 In this study, Morlet wavelet was selected for the wavelet transform analysis. Morlet wavelet is a product of a sine wave and a bell-shaped Gaussian distribution function that allows the best time–frequency localization within the limits provided by the uncertainty principle. 17 The wavelet transform was calculated in the frequency interval of 0.005 to 2 Hz. The upper limit of 2 Hz was set to include the heart rate frequency, whereas the lower limit was selected to include possible regulatory mechanisms of the tissue oxygenation signal.17,18 The wavelet transform was calculated using a logarithmic frequency resolution, and the frequency axes were thus presented logarithmically. This procedure is particularly appropriate for the estimation of the LF component.
Quantitative measures were introduced to enable comparisons among sets of signals.
17
Given that an oscillatory component in a signal can be characterized by its instantaneous frequency and corresponding amplitude, the average amplitude within a given frequency interval can be determined as
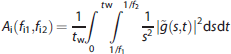
The relative or normalized amplitude is expressed as
Statistical Analysis
The values were expressed as the median (standard deviations) or percentages. The data of each subject were tested for the normality (Kolmogorov–mirnov test) at the group level and homogeneity of variance (Levene test) to ensure that they fulfilled the assumption required by the parameter analysis. Significant differences in characteristics between young and elderly subjects were determined using t-test for means and standard deviations, and Chi-square test for percentages. Two-way ANOVA with factors group and frequency band was used to study the main effects of group (age) on the spontaneous oscillations. Post hoc analyses between the two groups were performed using adjusted Bonferroni comparison tests (the number of comparisons being corrected is 50). The Bonferroni correction controls the experiment-wise alpha well, but this correction is very conservative and results in greatly diminished power to detect differentiation among pairs of sample collections. 26 There were 50 post hoc comparisons in this study. With an alpha = 0.05, the new significant level for all multiple comparisons should be 0.05/50 = 0.001. However, by using such a small alpha, the acceptance range becomes too wide and a large number of type II errors would occur and the tests would have limited statistical power. As a potential solution, Chandler 27 suggested that the sacrificial loss of power can be avoided by choosing an experiment-wise error rate higher than the usually accepted 5%, which results in a balance between different types of errors. Chandler 27 recommended that error rates of 10% to 15% are appropriate levels of control on experiment-wise error (especially for large numbers of tests). In this study, the experiment-wise error rate was set at 15% and the P-critical value could be adjusted to 0.003. Here, we adjusted the P values for post comparisons at the level of 0.003 instead of the P threshold. The adjusted P value was equal to unadjusted P value × (0.05/0.003). Pearson correlation analysis was performed to test the general correlation between the means of variables at the group level (SPSS version 11.0, SPSS Inc., Chicago, IL, USA). A difference with P < 0.05 was considered as statistically significant.
RESULTS
Spontaneous Oscillations in Cerebral Oxygenation and Arterial Blood Pressure
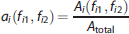
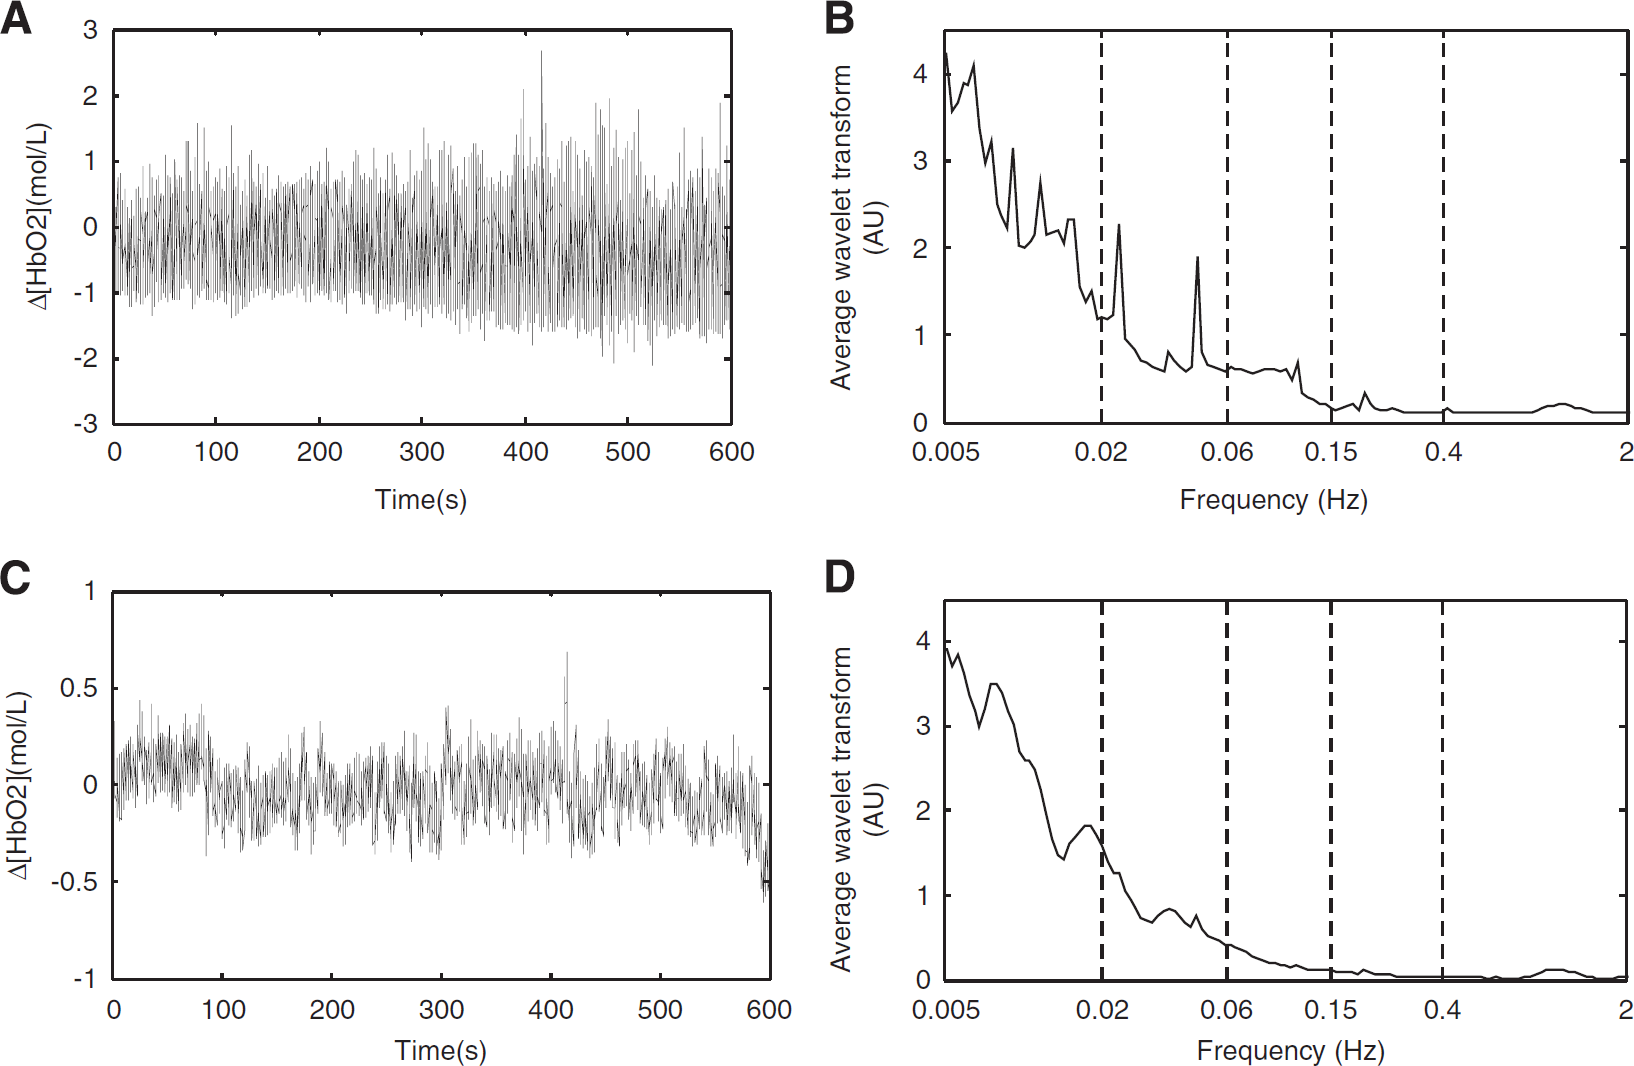
In this study, periodic oscillations with five frequencies intervals in ABP and CO were identified (Figures 1 and 2): I (0.005 to 0.02 Hz), II (0.02 to 0.06 Hz), III (0.06 to 0.15 Hz), IV (0.15 to 0.5 Hz), and V (0.5 to 2 Hz). Figures 3A and 3B show a comparison of the absolute (A) and relative amplitudes (B) of ABP for the five frequency intervals between the young and elderly subjects. Two-way ANOVA showed that the group (age) has significant effects on the relative amplitudes of ABP oscillations (F = 5.914, P = 0.016). The relative amplitudes of the ABP in frequency interval I were significantly lower by 12% (P = 0.016) in the elderly subjects than in the young subjects.
Typical time series of simultaneous recordings of arterial blood pressure (ABP) for one young subject (
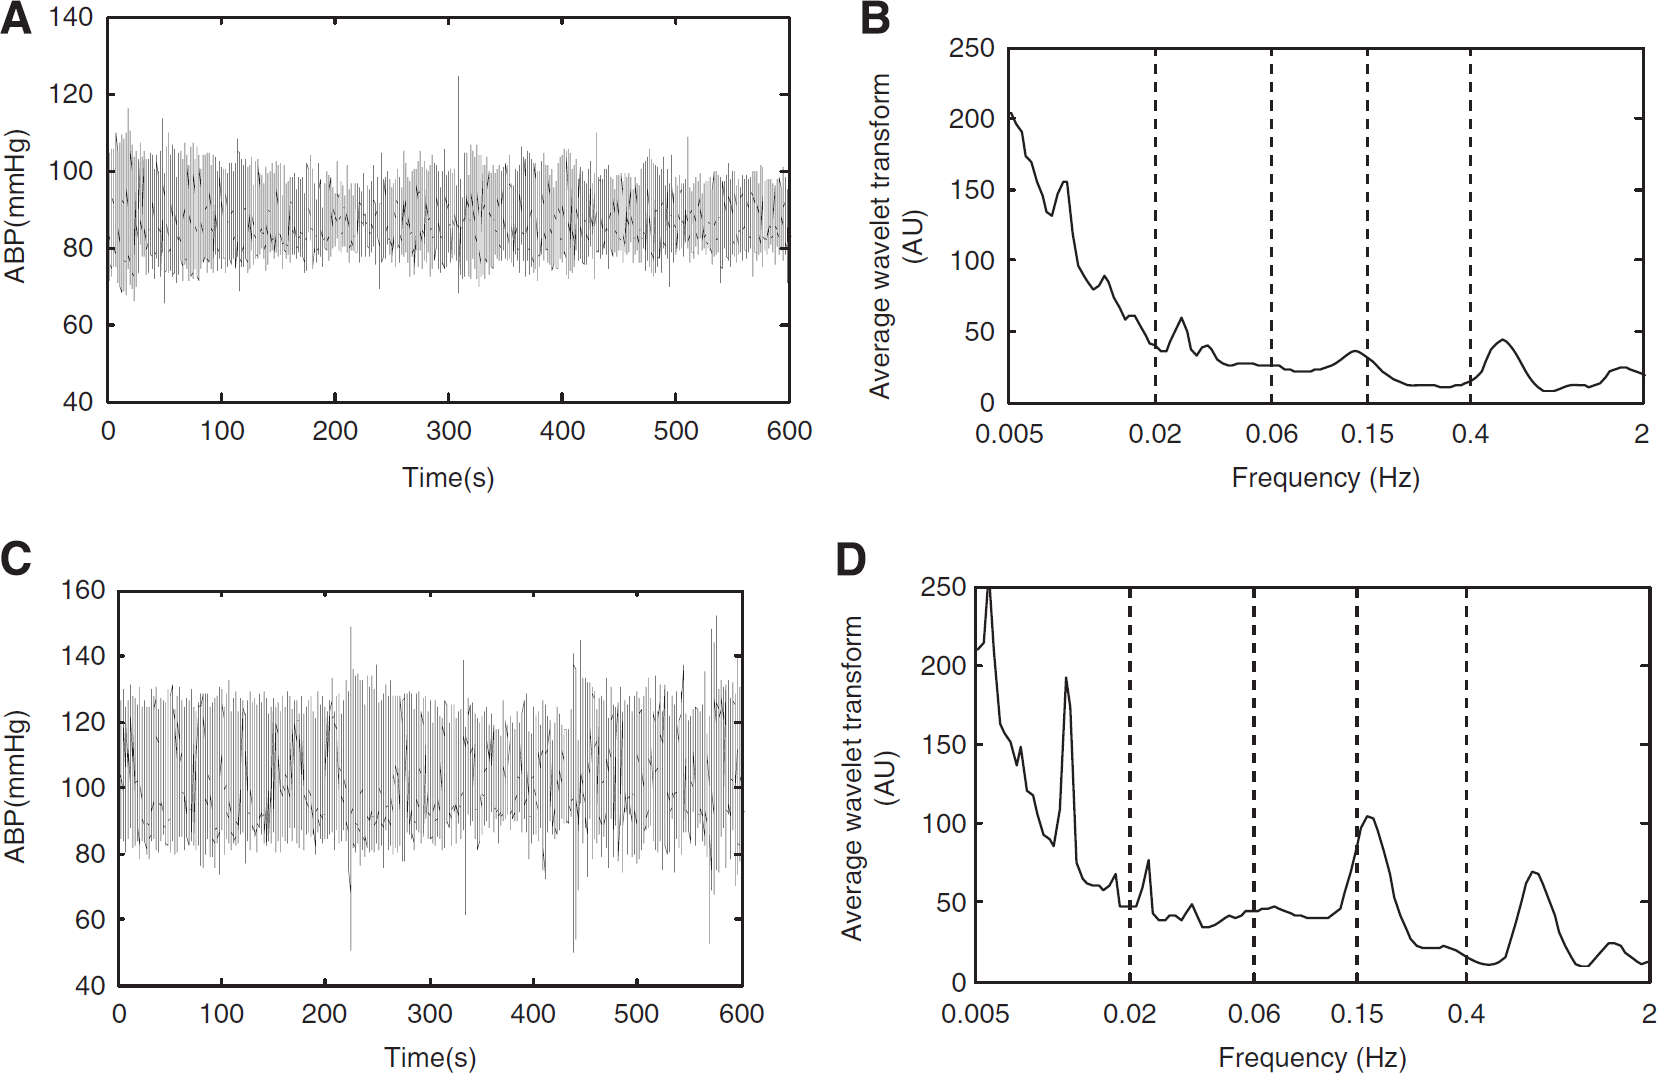
Typical time series of simultaneous recordings of cerebral oxygenation (Δ[HbO2]) for one young subject (
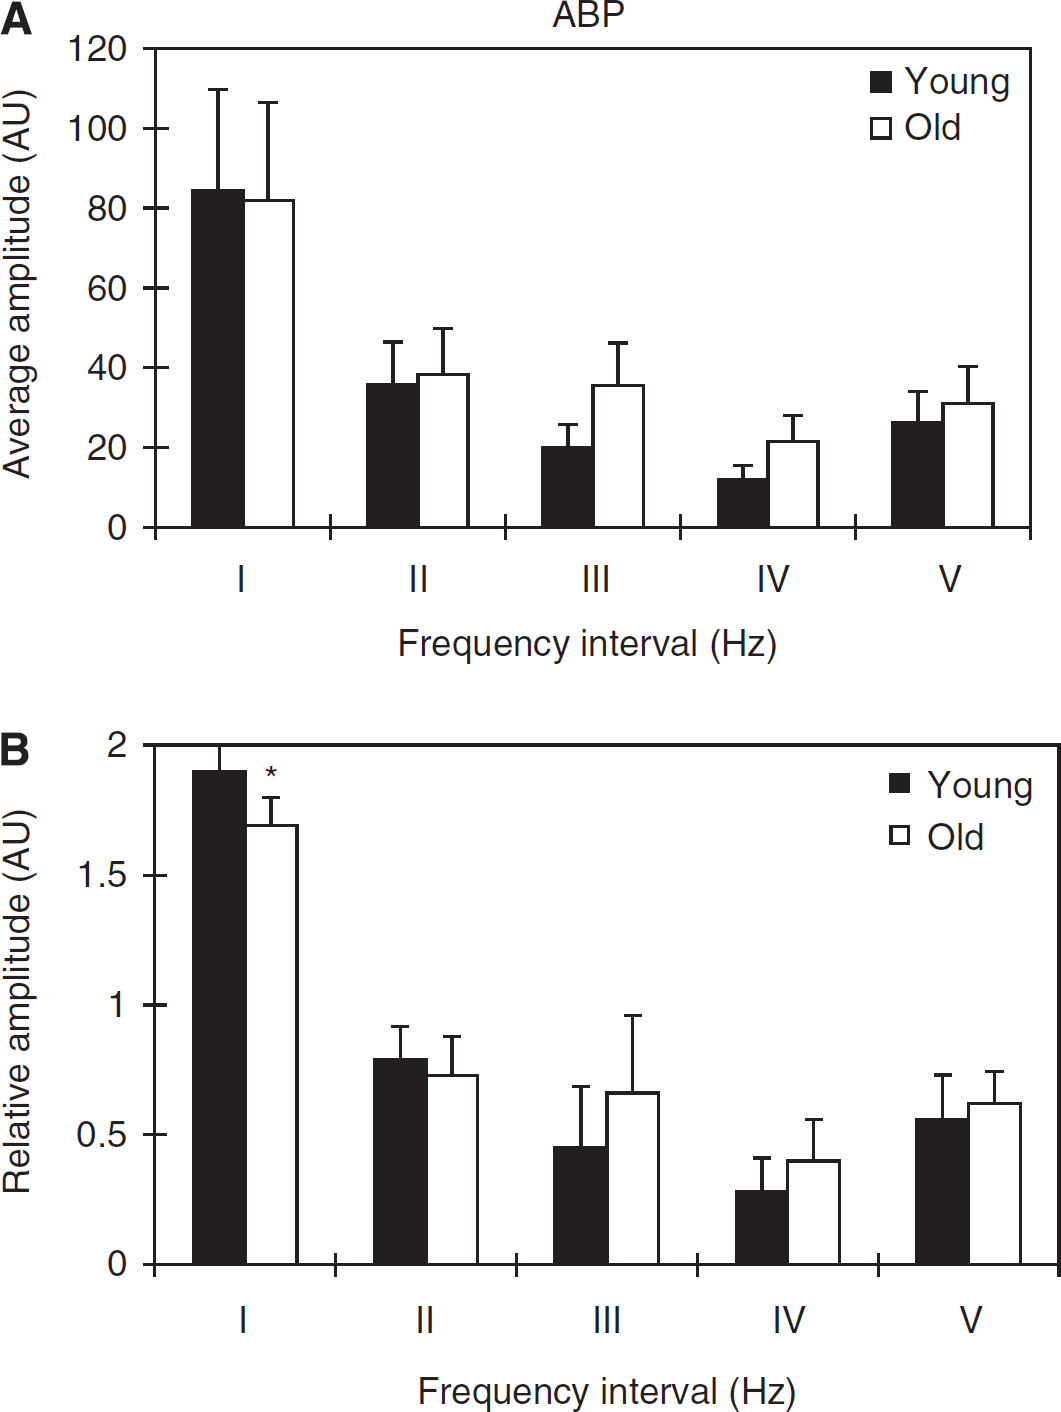
Comparison of the amplitudes of arterial blood pressure (ABP) signal (
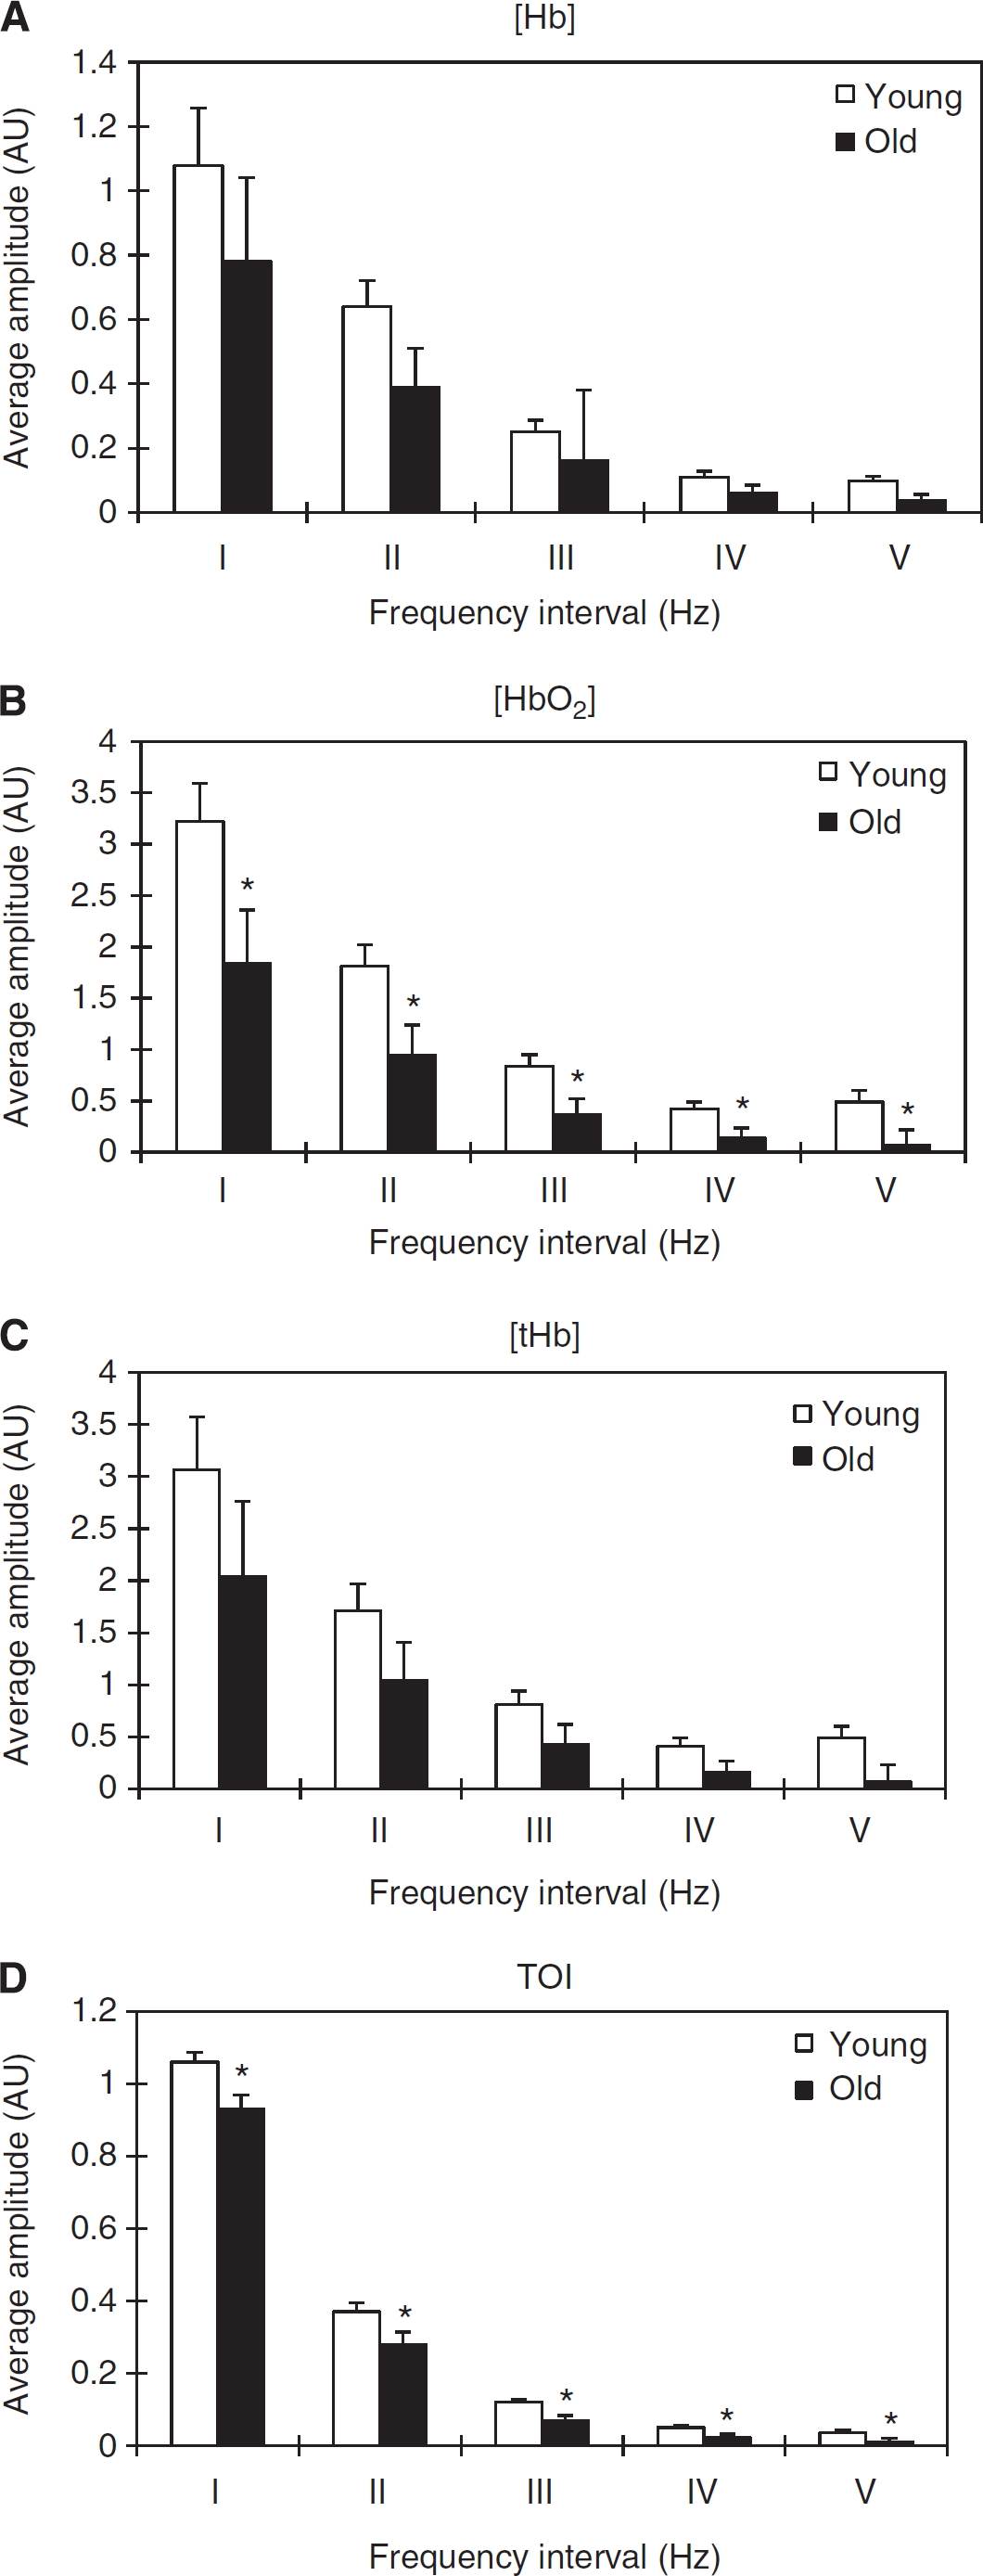
Two-way ANOVA showed that the group has significant effects on the average amplitudes of CO oscillations (for Δ[Hb], F = 6.340, P = 0.013; Δ[HbO2], F = 14.249, P < 0.001; Δ[tHb], F = 7.653, P = 0.006; and TOI, F = 36.727, P < 0.001). Figure 4 shows a comparison of the average amplitudes of the CO signal for the five frequency intervals between the young and elderly subjects. The amplitude of the Δ[Hb] in frequency interval V in the elderly subjects was found to be significantly lower by 64% (P = 0.032) than that in the young subjects (Figure 4A). The amplitudes of Δ[HbO2] in frequency intervals I to V were significantly lower by 42% (P = 0.046), 47% (P = 0.022), 56% (P = 0.025), 66% (P = 0.029), and 85% (P = 0.021), respectively, in the elderly subjects than in the young subjects (Figure 4B). The amplitude of the TOI in intervals I to V was significantly lower by 12% (P = 0.012), 24% (P = 0.017), 41% (P = 0.024), 54% (P = 0.032), and 69% (P = 0.038), respectively, in the elderly subjects than in the young subjects (Figure 4D).
Comparison of the amplitudes of cerebral near-infrared (NIR) signal (
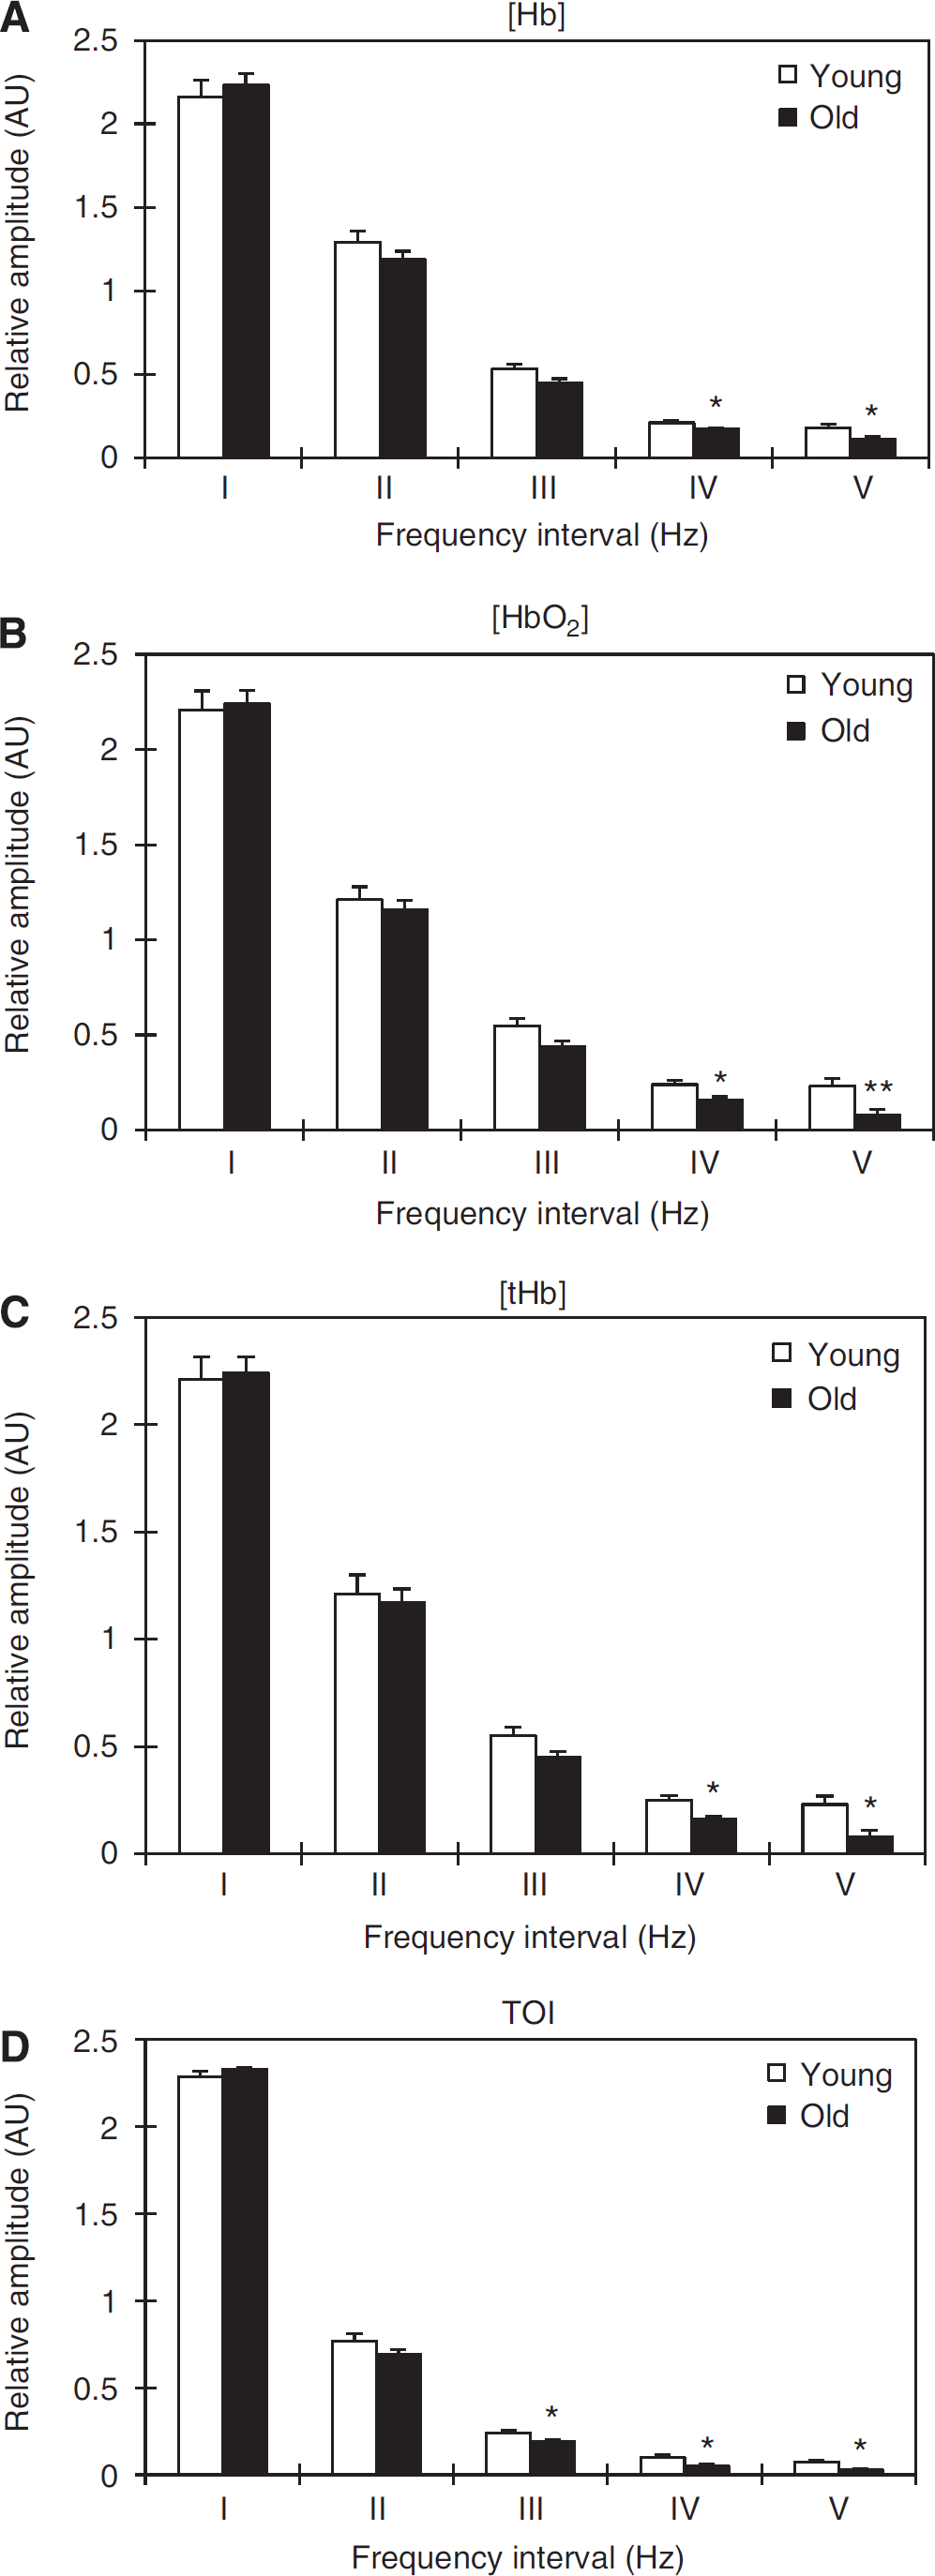
Two-way ANOVA showed that the group has significant effects on the relative amplitudes of Δ[Hb] (F = 9.478, P = 0.002), Δ[HbO2] (F = 12.201, P = 0.001), Δ[tHb] (F = 10.698, P = 0.001), and TOI (F = 24.263, P < 0.001). Figure 5 shows a comparison of the relative amplitudes of CO signals for the five frequency intervals between the young and elderly subjects. The relative amplitude of the Δ[Hb] in frequency intervals IV and V was significantly lower by 19% (P = 0.011) and 38% (P = 0.026) in the elderly subjects than in the young subjects (Figure 5A). The amplitude of the Δ[HbO2] in intervals IV and V was significantly lower by 33% (P = 0.049) and 65% (P < 0.01), respectively, in the elderly subjects than in the young subjects (Figure 5B). The amplitude of the Δ[tHb] in intervals IV and V was significantly lower by 27% (P = 0.042) and 28% (P = 0.017), respectively, in the elderly subjects than in the young subjects (Figure 5C).The amplitude of the TOI in frequency intervals III to V was significantly lower by 22% (P = 0.041), 77% (P = 0.032), and 80% (P = 0.02), respectively, in the elderly subjects than in the young subjects at rest (Figure 5D).
Comparison of the relative amplitudes of cerebral near-infrared (NIR) signal (
Correlation Between Spontaneous Oscillations in the CO and Arterial Blood Pressure
Table 2 shows the correlations between spontaneous oscillations in CO (Δ[HbO2]) and ABP in the young and elderly subjects. In the young subjects, significant correlations were found between the ABP oscillations in interval II and the cerebral oscillations in intervals I to V (P = 0.013, P = 0.023, P = 0.013, P = 0.041, and P = 0.008, respectively), as well as between ABP oscillations in interval II and the cerebral oscillations in intervals I to V (P = 0.046, P = 0.022, P = 0.012, P = 0.014, and P = 0.030, respectively). However, no significant correlation was found in spontaneous oscillations between CO (Δ[HbO2]) and ABP in the elderly subjects.
Correlations between spontaneous oscillations in cerebral oxygenation (Δ[HbO2]) and arterial blood pressure (ABP) in the young and old subjects
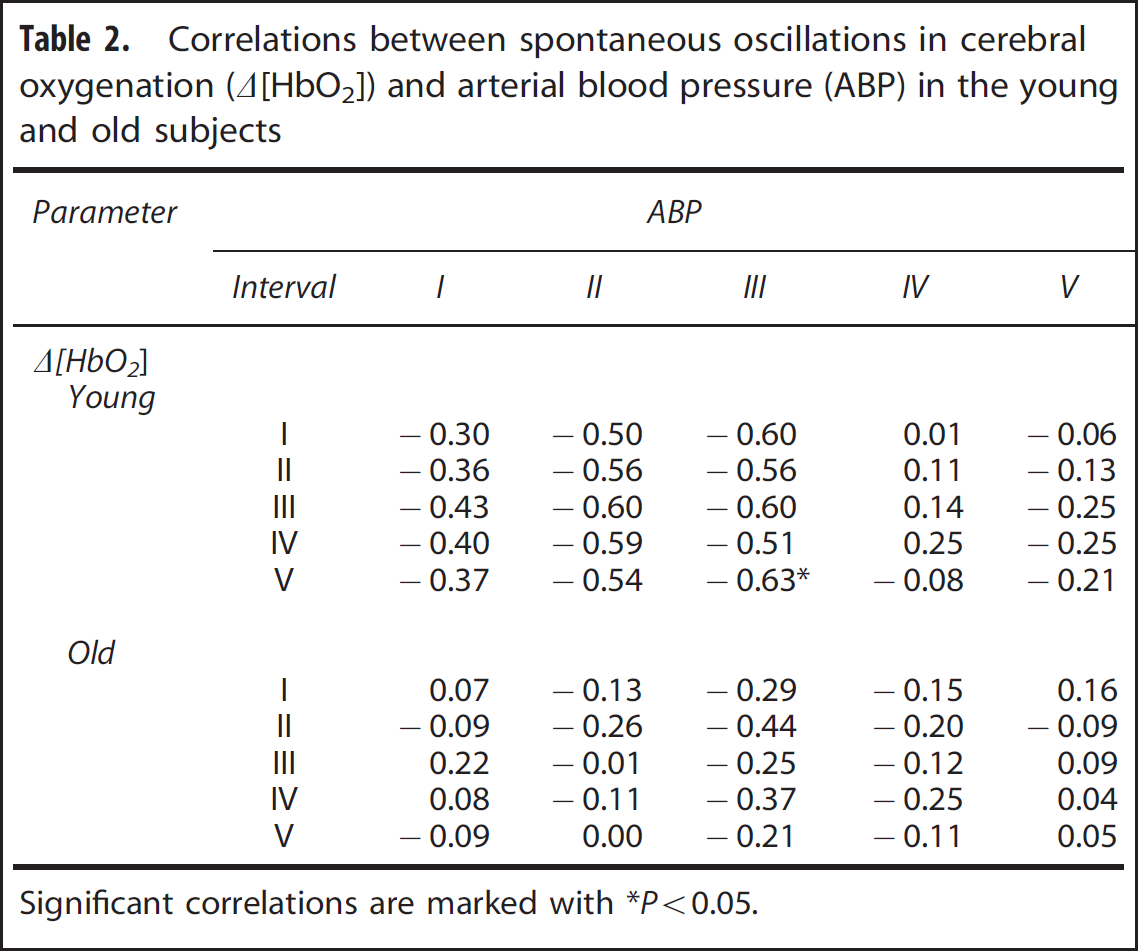
Significant correlations are marked with ∗P<0.05.
DISCUSSION
In this study, spontaneous oscillations in CO and ABP were assessed using wavelet transform in young and elderly subjects. Spontaneous oscillations with five characteristic frequencies were found in the cortex and ABP based on the wavelet transform of NIRS and ABP signals. Our results show that the CO oscillations were significantly lower in the elderly subjects than in the young subjects. In addition, the elderly subjects had lower spontaneous ABP oscillation in the relative amplitudes in interval I compared with the young subjects at rest.
Explaining the source of an oscillation at a given frequency is often controversial in the literature. The oscillations in frequency interval I (0.005 to 0.02 Hz) were identified and investigated by Stefanovska et al.17,18 Stefanovska et al17,18 performed a simultaneous iontophoretic application of acetylcholine (an endothelial-dependent vasodilator) and sodium nitroprusside (endothelial independent), and revealed that oscillations at ~0.01 Hz originate from endothelial-related metabolic activity. Although the functional and structural characteristics of blood vessels change with successive branching, a smooth single-celled layer of endothelial cells or endothelium that lines the inner surface of the vessels, is commonly found in the entire cardiovascular system. 18 Capillaries consist only of endothelium, whereas all other vessels have additional layers of connective tissue and smooth muscle. 18 Metabolic regulation is the process by which blood flow is controlled based on the concentrations of metabolites. 18 The most important role of such metabolic regulation is to adjust the blood flow to satisfy the oxygen requirement of cells. 25 In the present study, CO oscillations (Δ[HbO2] and TOI) in the elderly subjects declined in this interval. The lower amplitude of the oscillations in this frequency interval indicates that the dilatatory ability of cerebral vessels may decline with age.
In this study, the spontaneous oscillations in ABP exhibited relatively lower spontaneous activities in interval I in the elderly subjects. Aging per se is associated with structural and functional changes that can take place at the level of the vascular smooth muscle and the endothelium of blood vessels. 26 Endothelial dysfunction is one of the characteristic changes that occur with age, independently of other known cardiovascular risk factors. 28 The decreased amplitude in endothelial component suggests that the vasodilatory capability of the vessels in the elderly subjects was decreased compared with that of the vessels in the young subjects. Vasodilation mechanism involves stimuli resulting from the release of mediators from the endothelium.29,30 Endothelial cells act as a source of several vasoactive substances that control the contraction and relaxation of smooth muscles by releasing vasodilators such as nitric oxide and vasoconstrictors. 31 Therefore, a decrease in spontaneous oscillations could be the result of the endothelial layer stiffening.
Within the brain, hemodynamic parameters are closely regulated through tight neurovascular coupling and partial autonomic control in frequency interval II (0.02 to 0.06 Hz). 32 The peak at ~0.03 Hz was observed in BP, skin blood flow, and CO signals.16,17 Kastrup et al 33 found that the oscillation at ~0.03 Hz disappeared after local and ganglionic nerve blockade in chronically sympathectomized human tissue. After ganglion blockade, Zhang et al 32 found that the transfer function gain between beat-to-beat changes in arterial pressure and cerebral blood flow velocity increased and that the phase lead of cerebral blood flow velocity to arterial pressure diminished at very low frequency <0.07 Hz. These results suggest that the oscillation in interval II is a vascular reaction of neurogenic origin. The continuous activity of the autonomous nervous system serves to maintain the basal level of vessel contraction. The nerves release substances that affect the activities of smooth muscles, leading to changes in the vessel radii and resistance. 18 In the present study, reduced cerebrovascular response in this interval might suggest changes in neurovascular regulatory in elderly persons.
The LF oscillations at ~0.1 Hz in HbO2 in concentration are associated with vasomotion in an intact adult brain.34,35 Spontaneous activity recorded in microvascular smooth muscle cells was shown to lie in this range (0.07 to 0.1 Hz). 33 The vascular smooth muscles contract or relax in response to an increase or a decrease in intravascular pressure, respectively. 18 The cerebral oscillations in interval III were suggested to originate locally from the intrinsic myogenic activity of smooth muscle cells in resistance vessels and this myogenic mechanism may be partly under autonomic control.14,18,36,37 Spontaneous LF oscillations of HbO2 and Hb decline strongly with aging at rest and in cerebral microangiopathy.5,13 Reduction in spontaneous LF oscillations might indicate a declining spontaneous activity in microvascular smooth muscle cells and increased vessel stiffness with aging. 5 In the present study, the decreased amplitude in this interval might indicate a reduced contractility of the smooth muscle layer of the arteriole in the elderly subjects.
The link between spectral features and heart rate and respiration is well established.10,38 The relative amplitude of Δ[HbO2] or TOI in intervals IV (0.15 to 0.4 Hz) and V (0.4 to 2 Hz) was significantly lower in the elderly subjects than in the young subjects. The oscillations in intervals IV and V reflected the influence of respiratory and cardiac activities, which serve as pumps that drive blood through the vessels. 18 The effect of the cardiac and respiratory pumping is manifested in the vessels. The decrease in these oscillations might be partly attributed to the degeneration of lung and heart function in elderly subjects. The average amplitudes in Hb or tHb were also higher in the young subjects than in elderly subjects (Figures 4A and 4C). Considering that the amplitude in [Hb] was lower than that in [HbO2] at rest, the average amplitudes in [Hb] or [tHb] did not show significant difference in the present sample size.
In this study, significant negative correlations between the CO and ABP oscillations were found in the young subjects but not in elderly subjects. Interestingly, CO was significantly negatively correlated with ABP oscillations in intervals II and III in the young subjects but not in the elderly subjects. The results of the present study may be explained by the physiology of the oscillations. The observed correlations reflect neural control of the cerebral circulation. The negative correlations might indicate the non-synchronization of the CO and ABP oscillations under observation. The present results suggest that the coupling between the cerebrovascular and cardiovascular systems is impaired with aging at rest. Further studies should focus on the phase difference of CO and ABP oscillations in time series using wavelet analysis.
Methodological Considerations
The NIR light must first pass through the superficial tissue layers (scalp and skull) before reaching the cortex. Therefore, these superficial layers may cause noise and nonspecific hemodynamic variations, which could contaminate the measured signal. Interferences from superficial layers are often referred to as ‘global interference’ . 39 Therefore, the contribution of skin blood flow to NIR measurements of tissue oxygenation might potentially confound interpretation of the NIR-derived signal. Previous studies reported that depth-resolved measurements can be effectively achieved using detectors at short (~1 cm) and long (>3 cm) distances from the source. 40 In the present study, we used one light source and two detectors placed at 30 and 40 mm from the source to separate extracerebral (scalp and skull) and brain hemodynamic signals. For such configurations, the differences in the OD as detected by the two detectors were mainly attributed to the tissue (cortex) absorption. In the present study, we attempted to prevent the entry of background light using an elastic bandage to attach the probes firmly on the forehead. Considering that spontaneous oscillations are posture dependent, 16 NIRS and ABP measurements were performed in the subjects in a comfortable sitting posture, and the NIRS sensors were set up in predefined position.
Summary
In summary, the decrease observed in the spontaneous oscillations in the cerebral Δ[HbO2] and TOI signals suggests the presence of a cerebrovascular degenerative process because of aging. In particular, the contribution of respiratory and cardiac activities in the regulation of cerebral perfusion was lower in the elderly subjects than in the young subjects. The relatively lower amplitudes in frequency interval I in ABP suggest the existence of a stiffening endothelial layer because of aging in elderly subjects. These findings indicate that spontaneous oscillations in CO could be used as an indicator of cerebrovascular changes and could be used to identify the risk for cerebrovascular degenerative processes.
DISCLOSURE/CONFLICT OF INTEREST
The authors declare no conflict of interest.