
Abstract
Small-vessel disease or cerebral microangiopathy (CMA) is a common finding in elderly people. It is related to a variety of vascular risk factors and may finally lead to subcortical ischemic vascular dementia. Because vessel stiffness is increased, we hypothesized that slow spontaneous oscillations are reduced in cerebral hemodynamics. Accordingly, we examined spontaneous oscillations in the visual cortex of 13 patients suffering from CMA, and compared them with 14 agematched controls. As an imaging method we applied functional near-infrared spectroscopy, because it is particularly sensitive to the microvasculature. Spontaneous low-frequency oscillations (LFOs) (0.07 to 0.12 Hz) were specifically impaired in CMA in contrast to spontaneous very-low-frequency oscillations (0.01 to 0.05 Hz), which remained unaltered. Vascular reagibility was reduced during visual stimulation. Interestingly, changes were tightly related to neuropsychological deficits, namely executive dysfunction. Vascular alterations had to be attributed mainly to the vascular risk factor arterial hypertension. Further, results suggest that the impairments might be, at least partly, reversed by medical treatment such as angiotensin-converting enzyme inhibitors/angiotensin II receptor blockers. Results indicate that functional near-infrared spectroscopy may detect changes in the microvasculature due to CMA, namely an impairment of spontaneous LFOs, and of vascular reagibility. Hence, CMA accelerates microvascular changes due to aging, leading to impairments of autoregulation.
Keywords
Introduction
Vascular dementia is the second most common type of dementia (Roman et al, 2002). The subcortical ischemic form, which constitutes 36% to 67% of all vascular dementias, frequently causes cognitive impairment in elderly people. It is clinically homogenous, and results from small-vessel disease, or cerebral microangiopathy (CMA). Two main pathophysiological pathways are involved (Figure 1). In the first, occlusion of the arteriolar lumen leads to the formation of lacunes, resulting in a lacunar state. In the second, critical stenosis and hypoperfusion of multiple medullary arterioles cause widespread incomplete infarction of deep (periventricular) white matter, leading to leukoaraiosis with a clinical picture of Binswanger's disease. In practice, the two clinical pathways overlap, and lead to a variety of clinical symptoms and neuropsychological abnormalities, which are dominated by a dysexecutive syndrome (McPherson and Cummings, 1996). The main risk factors contributing to the development of CMA are arterial hypertension and diabetes, which even reinforce each other (Caplan, 1995; Corry and Tuck, 2002; Roman et al, 2002). Etiologically, CMA is characterized by a degeneration of the cerebral microcirculation (Roman et al, 2002). Walls of the small penetrating arteries and arterioles are thickened and often hyalinized (Caplan, 1995). Fibrosis, loss of smooth muscle cells, and splitting of the internal elastic membrane can lead to increased vessel stiffness (Tanoi et al, 2000). Consequently, vasomotor reactivity is reduced, as shown by positron emission tomography (Roman et al, 2002), near-infrared spectroscopy (NIRS), transcranial Doppler sonography (Terborg et al, 2000), and functional magnetic resonance imaging (MRI; Hund-Georgiadis et al, 2003).
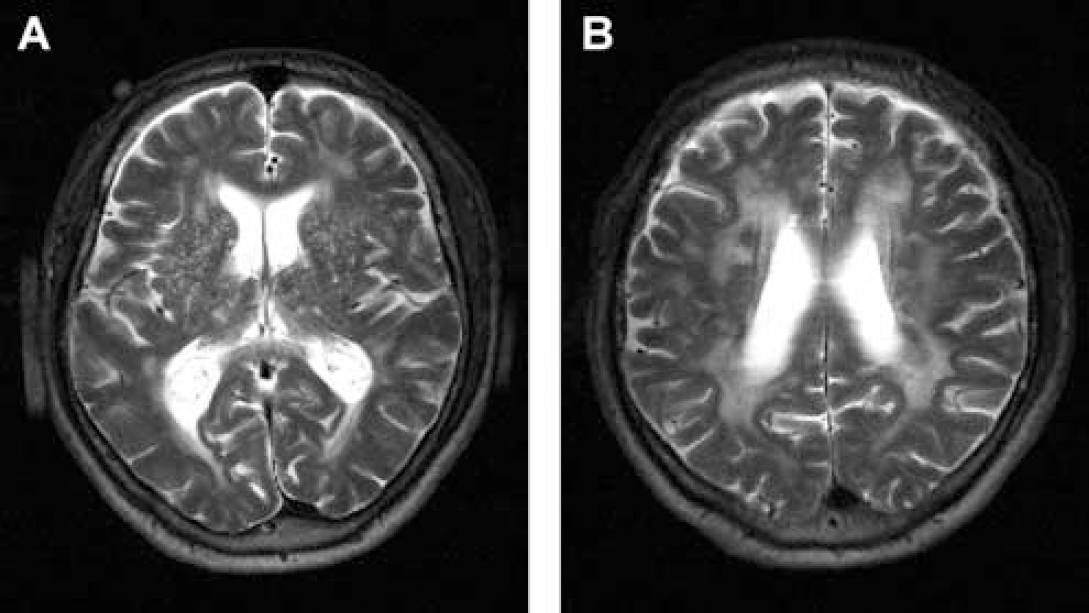
Structural changes in CMA visualized with highresolution magnetic-resonance tomography at 3T in T2-weighted sequence. Characteristic abnormalities are (
It is well known that slow oscillations happen in cerebral hemodynamics and metabolism (Intaglietta, 1990; Mayhew et al, 1996; Obrig et al, 2000). Although their origin is controversial, they are characterized by their spontaneity, and they can be differentiated from other oscillatory phenomena such as the heart beat at approximately 1Hz, and respiratory cycles at 0.2 to 0.3Hz called high-frequency oscillations. Further, slow oscillations are influenced by pharmacological interventions (inhibitor of the NO synthase), and by pathological conditions (ischemia, large- and small-artery disease) (reviewed in Obrig et al, 2000). More specifically, spontaneous low-frequency oscillations (LFOs) occurring at approximately 0.1Hz might be distinguished from spontaneous very-low-frequency oscillations (VLFOs) centered at approximately 0.04Hz. These oscillations were observed with functional NIRS (fNIRS), laser-Doppler flowmetry, transcranial Doppler sonography, and functional MRI. Hudetz et al (1998) discuss that spontaneous oscillations in cerebral hemodynamics may represent autoregulatory processes of cerebral blood flow, and might be of myogenic origin.
Recently, we showed that aging leads to a specific reduction of LFOs in the cerebral microvasculature (Schroeter et al, 2004b). Interestingly, spectral analysis was more sensitive to age-related microvascular alterations than time-line analysis of the functional hemodynamic response in that study. As discussed above, CMA accelerates development of vessel stiffness (Caplan, 1995; Roman et al, 2002; Tanoi et al, 2000). Hence, one may hypothesize that spontaneous oscillations further decline in CMA (Bäzner et al, 1995). Accordingly, we investigated spontaneous oscillations during rest, and visual activation. We applied fNIRS, because it is particularly sensitive to the microvasculature (Liu et al, 1995a, b), and can measure changes in the concentration of oxy- and deoxy-hemoglobin (Hb) specifically (Hoshi et al, 2003; Obrig and Villringer, 2003; Schroeter et al, 2003, 2004c, d ; Strangman et al, 2002).
Materials and methods
Subjects
In all, 13 Caucasian patients with CMA and 14 Caucasian healthy controls participated in the study (Table 1). There were no significant differences regarding mean age and sex (P > 0.05; 2-tailed Student's t-test). Patients were treated in the Day Clinic of Cognitive Neurology of the University of Leipzig. They had previously been diagnosed with CMA on the basis of anatomical MRI or computer tomography scans and a comprehensive clinical examination. Further, they were controlled for cerebral macroangiopathy and related lesions. Controls had no history of neurological or psychiatric disorders. Written informed consent was obtained from all subjects after complete description of the study before the session. The research protocol was approved by the ethics committee of the University of Leipzig, and was in accordance with the latest version of the Declaration of Helsinki. All subjects had normal or corrected-to-normal vision, and were native German speakers.
Clinical characteristics and therapy of the patients with CMA and controls
CMA, cerebral microangiopathy.
Magnetic Resonance Imaging Scoring for Structural Abnormalities in CMA
Imaging was performed at 3T on a Bruker Medspec 30/100 system (Bruker Medical, Ettlingen, Germany) (Hund-Georgiadis et al, 2002). For staging CMA, an MRI score was calculated on the basis of T2-weighted axial scans as proposed by Hund-Georgiadis et al (2002). Criteria for scoring were the presence of lacunar infarctions and periventricular white matter lesions (Figure 1). The presence and severity were graded according to their extent and their uni- or bilateral distribution. The maximum theoretical score was 21 points and ranged in the patient group from 4 to 18 (mean 12.1 ± 4.5).
Neuropsychological Test Battery
The neuropsychological battery assessed cognitive performance for attention, executive functions, and memory in the patient group. Alertness and divided attention were tested by the test battery for the assessment of attention (TAP) (Zimmermann and Fimm, 1993). Impairment in executive functions was assessed by the behavioral assessment of the dysexecutive syndrome (BADS) and a modified Stroop paradigm (Wilson et al, 1996; Wolfram et al, 1986). Memory functions were assessed by digit span and block span of the Wechsler memory scale (WMS-R) (Haerting et al, 2000), for short-term, and by the verbal and visual memory quotient (WMS-R) and by the California verbal learning test (CVLT) (Delis et al, 1987) for long-term memory, respectively. A score (0 ‘unimpaired’ to 3 ‘severely impaired’) was calculated for each domain (attention, executive functions, learning and spans). Hence, the sum score ranged from 0 to 12 points. Mean scores for neuropsychological impairments were 0.75 ± 0.97 (attention), 1.17 ± 1.19 (executive function), 0.75 ± 1.22 (learning), 0.83 ± 0.84 (span), and 3.5 ± 3.4 for the sum score.
Data Acquisition by fNIRS
Changes in the concentration of oxy- and deoxy-Hb, as well as in the redox state of the cytochrome-c-oxidase, were measured by a NIRO-300 spectrometer (Hamamatsu Photonics KK, Japan; four wavelengths 775, 810, 850, and 910 nm) and expressed in nmol/L. Values were calculated according to Cope and Delpy (1988). Moreover, we calculated changes in the concentration of total Hb (sum of oxy- and deoxy-Hb) as a measure of changes in regional cerebral blood volume. Although we detected significant effects for cytochrome-c-oxidase, we generally did not report these results because crosstalk effects might have mimicked them, that is, a change in Hb concentration may yield an artifactual change in the cytochrome-c-oxidase (Heekeren et al, 1999; Uludag et al, 2002). Two channels were measured at a sampling frequency of 6Hz. The emitter–detector spacing was 4 or 5cm, depending on specific light attenuation. It is known from literature that differential pathlength factors are age-dependent and can be calculated by the formula 5.13 ± 0.07*(age0.81) (Duncan et al, 1996). Precise formulas for differential pathlength factors in subjects over 50 years of age are currently unknown. Because our study included subjects with an age range from 50 to 67 years, we generally set the differential pathlength factor to 6.79, representing the differential pathlength factor of the oldest age group examined by Duncan et al (1996). For all experiments, subjects were seated in an electroencephalography chair in a quiet dimmed room. The probes were protected from ambient light by a black cloth. For both experiments, optodes were placed at O1/2 of the international 10/20 system localized over the calcarine fissure (Schroeter et al, 2002).
Psychophysical Procedures and Data Analysis
Visual stimulation was performed with a full-field checkerboard alternating at 1.8Hz presented on a computer screen. The resting condition consisted of a black screen. Fixation was maintained by instructing subjects to fixate a gray point in the screen center that was shown during the whole experiment. Each stimulation period lasted 18secs, and was preceded by a resting period of 17 secs. In all 16 cycles were performed, with a pause after 8 cycles (total time 13.3 mins). The mean of the signal intensity during the ‘baseline’ (8secs before trial onset) and the ‘vascular response’ (5–23 secs after trial onset) was calculated for each subject and parameter, as the vascular response appeared 5 to 23 secs after the beginning of visual stimulation (Figure 3). Differences between the mean of the ‘vascular response’ and the ‘baseline’ revealed a measure of the hemodynamic response. Significance of concentration changes of the parameters was tested with one-sample Student's t-tests against 0 for patients and controls separately. Thereafter, both groups were compared with unpaired Student's t-tests. Moreover, subjects were examined during rest without undergoing any stimulation with closed eyes for 6 mins.
Analysis in the frequency domain was performed as previously described (Schroeter et al, 2004b). Power spectral density (PSD) was calculated using a Hanning window of 512 data points with an overlap of 256 data points (corresponding to time periods of 85.3 and 42.7 secs, respectively). The resulting frequency range from 0.018 to 3 Hz was chosen as peaks appeared in that range in our and previous studies (Obrig et al, 2000). Power spectral density was normalized for every subject to 1 (integral normalization), as proposed by Schroeter et al (2004a, b ). Hence, results are almost independent from the assumed differential pathlength factors. Thereafter, means of PSD were calculated across patients and controls, for stimulation and rest, respectively. Repeated-measure analysis of variances (ANOVAs) and post hoc Student's t-tests were performed to investigate the effects of CMA and stimulation for different spectral windows.
To exclude that additional medical diagnoses or medications (Table 1) biased our results, we reanalyzed data in the repeated-measure ANOVAs with medical diagnoses (arterial hypertension, diabetes, hypercholesterolemia), and medications (angiotensin-converting enzyme inhibitors/angiotensin II receptor blockers, beta-adrenergic blockers, calcium channel blockers, statins) as covariates, because these factors may influence microcirculation (Bernardi et al, 1997; Harrison and Ohara, 1995; Levy et al, 2001; Meyer et al, 2003; Scalia and Stalker, 2002). The ANOVAs were followed by post hoc Student's t-tests. Correlation analysis was performed according to Pearson. Results are generally given as mean ± standard deviation (s.d.).
Results
The concentration of deoxy-Hb decreased, whereas the concentration of oxy-Hb increased in the visual cortex of patients and controls during stimulation with the checkerboard (Figures 2 and 3) in agreement with previous fNIRS studies (Heekeren et al, 1999; Obrig et al, 2000; Schroeter et al, 2004a, b ). For statistical analysis, individual concentration changes on the right and left sides were averaged (full-field stimulation; no significant differences of the hemodynamic response between the right and left sides, as examined with paired Student's t-tests). Concentration changes were significant for the parameters in both patients and controls (oxy-Hb 198 ± 108, 271 ± 166 nmol/L; deoxy-Hb −133 ± 65, −156 ± 98 nmol/L; total Hb 65 ± 81, 114 ± 107 nmol/L; P < 0.001, for total Hb in patients and controls P < 0.01; 1-tailed 1-sample Student's t-test against 0). Hemodynamic responses due to visual stimulation did not significantly differ between patients and controls, as analyzed with 2-tailed unpaired Student's t-tests (P > 0.1).
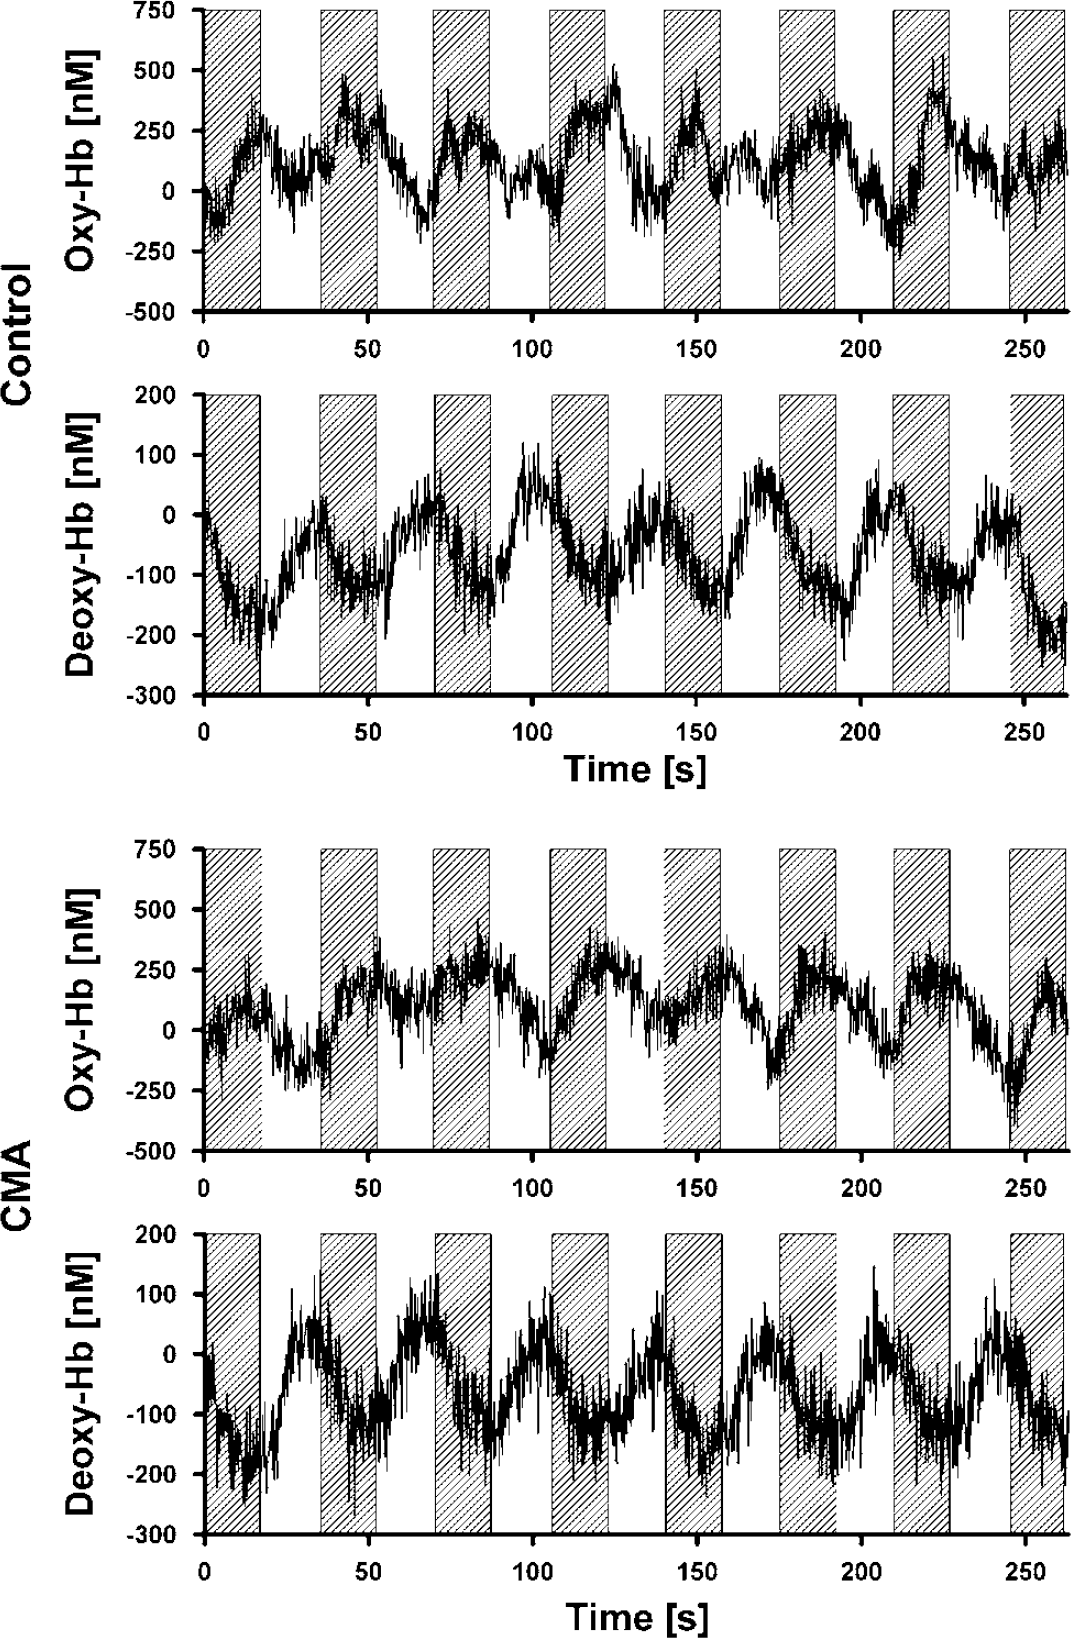
Concentration changes of oxy- and deoxy-Hb in the right visual cortex across 14 healthy controls and 13 patients with CMA during the last eight blocks of stimulation with a checkerboard (marked by gray boxes).
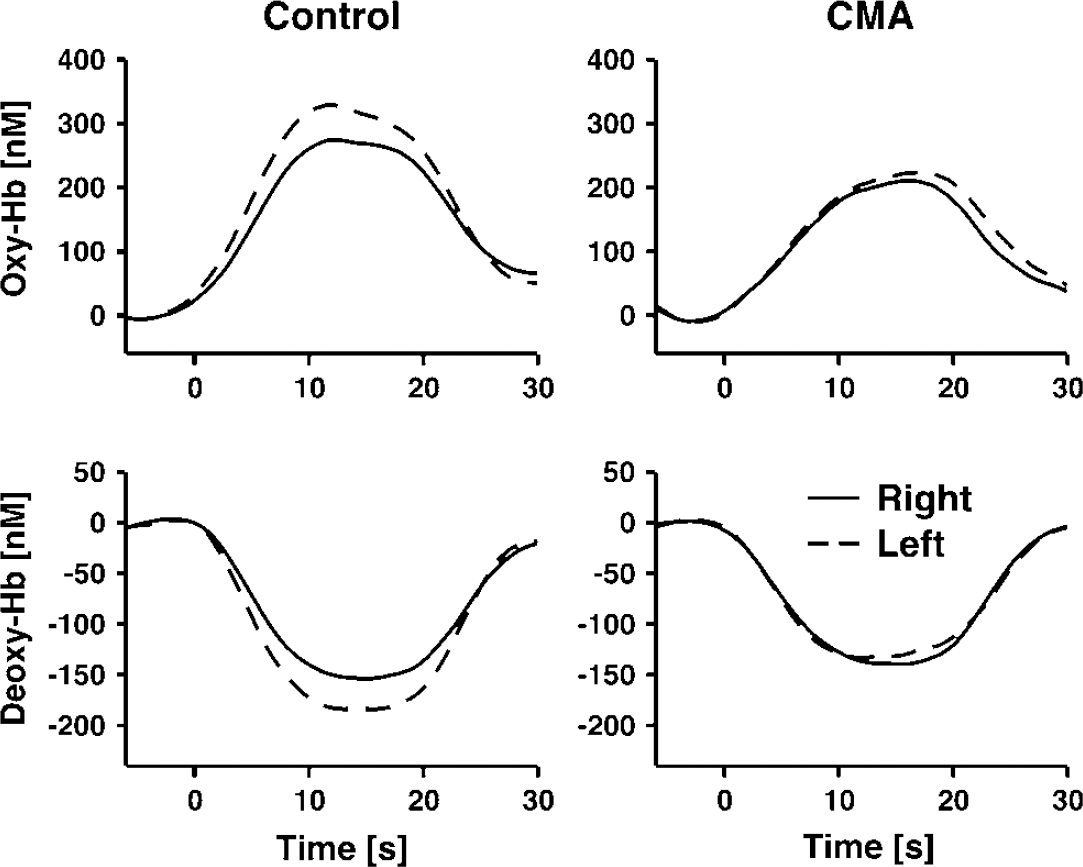
Epoch-related concentration changes of oxy- and deoxy-Hb in the right and left visual cortex during stimulation with a checkerboard. Stimulation lasted from 0 to 18 secs. Running averages over 8 secs, after averaging across 14 healthy controls and 13 patients with CMA and the several stimulation epochs. Each subject completed 16 stimulation cycles.
Reanalysis with an ANOVA including CMA (CMA versus control) as a between-subjects factor, and the additional medical diagnoses, and medications as covariates confirmed the results of the latest analysis (no difference between patients and controls). However, angiotensin-converting enzyme inhibitors/angiotensin II receptor blockers influenced concentration changes of oxy-, and deoxy-Hb (df = 1; F = 7.8, 9.7; P = 0.01, < 0.01). One may hypothesize a stronger vascular response in subjects receiving this medication than in drug-free subjects (Clozel et al, 1989; Levy et al, 2001), which was confirmed by post hoc unpaired 1-tailed Student's t-tests (oxy-Hb 280 ± 152, 189 ± 121 nmol/L; deoxy-Hb −167 ± 95, −123 ± 63 nmol/L; P = 0.05, 0.09). The other covariates had no impact. If concentration changes elicited by visual stimulation were related to neuropsychological scores and the morphological MRI score, no significant results were obtained. Only deoxy-Hb tended to correlate with impairment of executive functions (r = 0.41, P = 0.09; correlation analysis according to Pearson, 1-tailed P).
Figure 4 shows the averaged normalized PSD for oscillations of oxy-Hb in the visual cortex across all controls during rest. Peaks were obtained for spontaneous slow oscillations at approximately 0.03 Hz (VLFOs), and 0.09 Hz (LFOs), as well as for respiration at 0.3 Hz, and heart rate at ~1 Hz. As illustrated in Figure 5, the peak for VLFOs at approximately 0.03 Hz was obtained for both parameters in patients and controls. Stimulation increased VLFOs particularly of deoxy-Hb, because the stimulation cycle of 35 secs, corresponding to 0.028 Hz, was contained in the VLFOs frequency range. For LFOs, peaks at around 0.09 Hz were found in controls for both parameters, whereas PSD declined continuously in the patient group with an increasing frequency and, therefore, no LFO peak was observed except for deoxy-Hb. As illustrated in Figures 5 and 6, PSD of VLFOs and LFOs was generally stronger for oxy-Hb compared with deoxy-Hb.
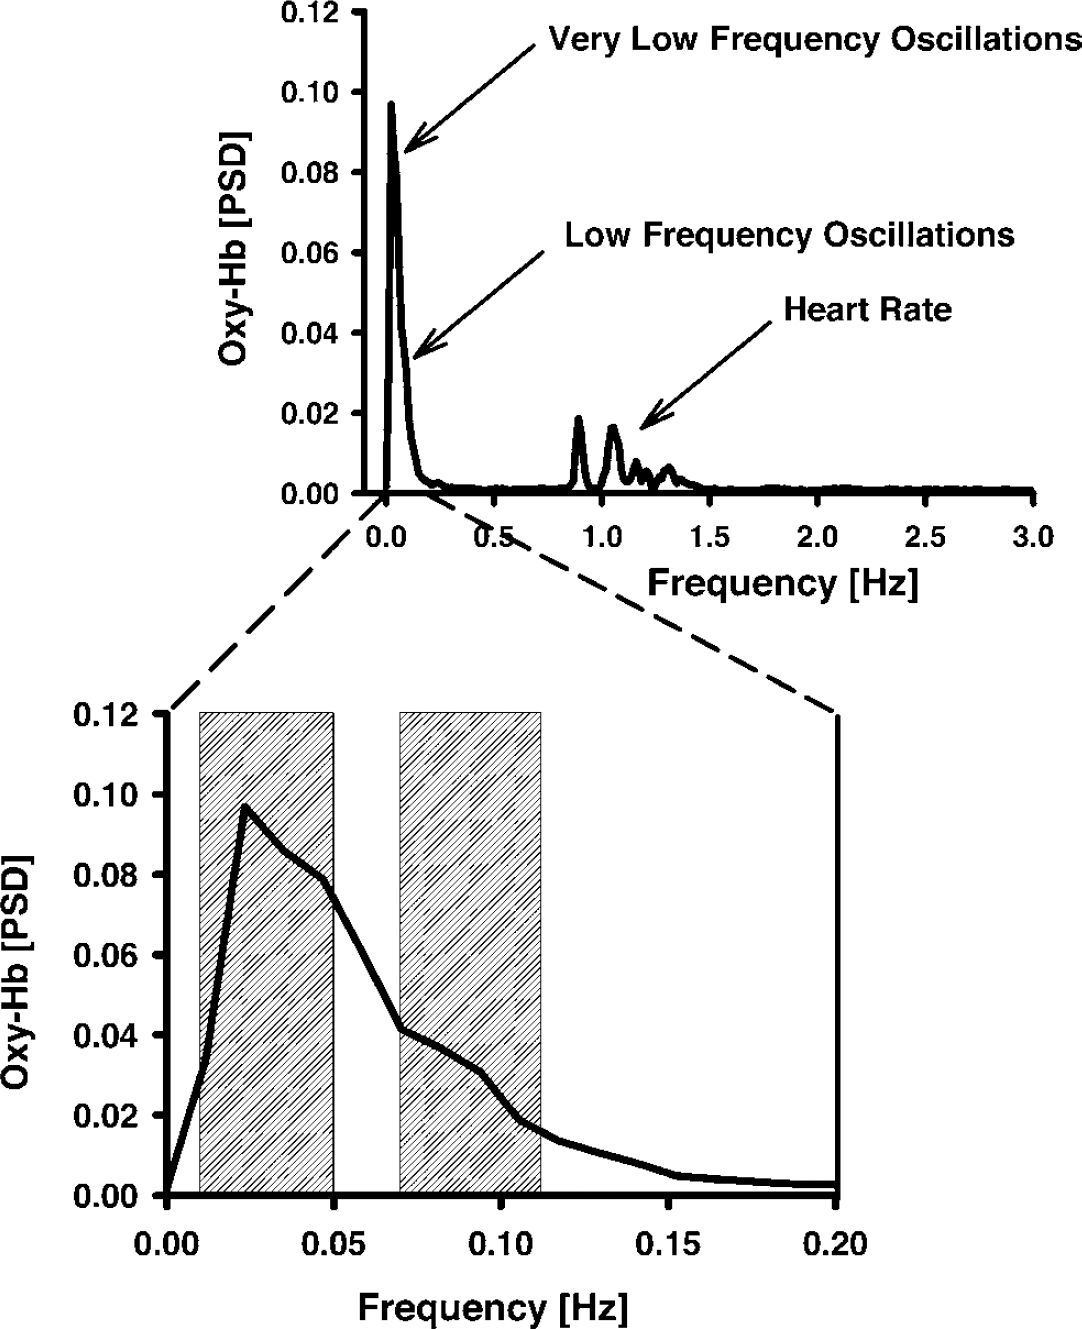
Normalized PSD of oxy-Hb in controls during rest. Spontaneous VLFOs and LFOs were analyzed as means in the spectral windows of 0.01 to 0.05 Hz, and 0.07 to 0.12 Hz, respectively.
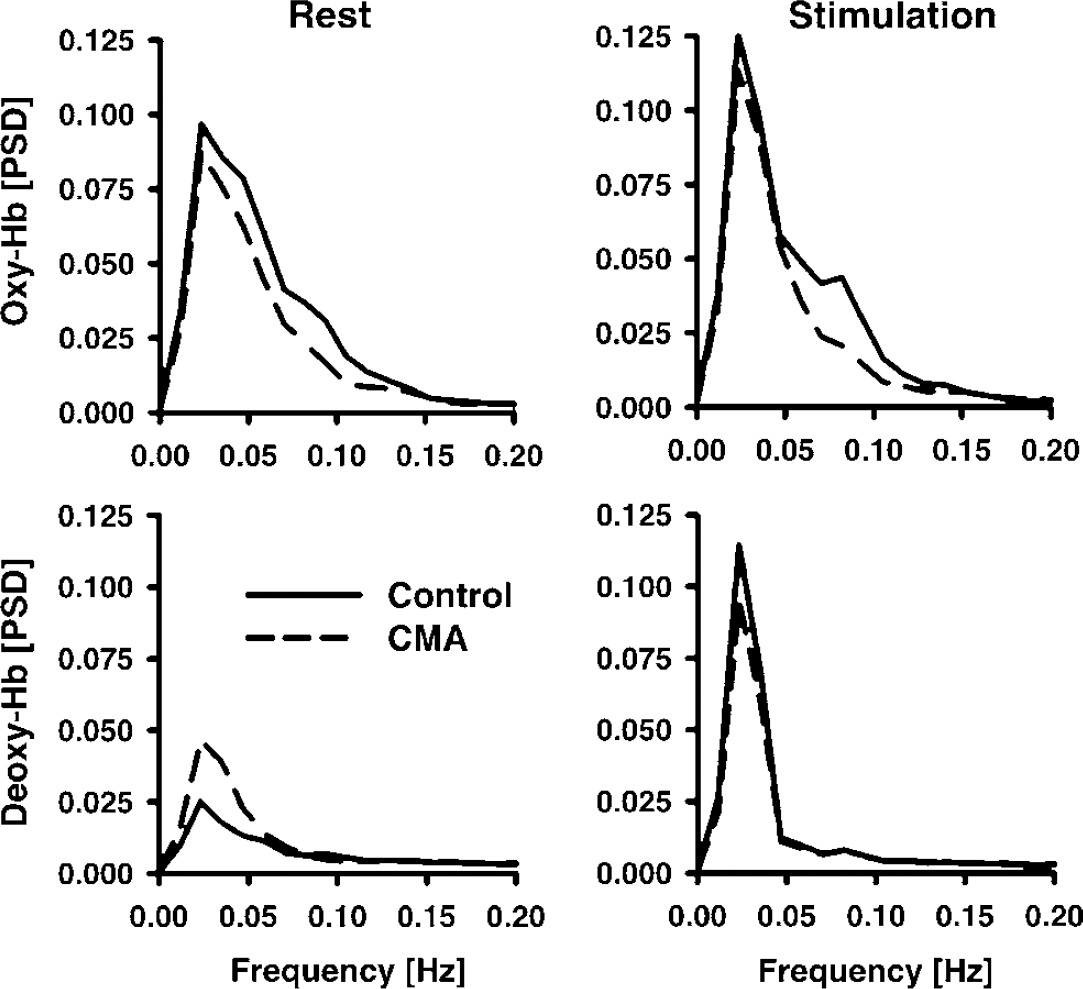
Normalized PSD between 0 and 0.2Hz in comparison between patients with CMA and controls in the visual cortex during rest, and stimulation with a checkerboard. The frequency range includes spontaneous VLFOs and LFOs, and the stimulation frequency.
To quantify spontaneous oscillations, means were calculated for a spectral window of 0.01 to 0.05 Hz for VLFOs, and of 0.07 to 0.12Hz for LFOs, as concluded from the peak locations (Figures 4 and 5). Individual values were again averaged between the right and left sides (full-field stimulation). Results of the repeated-measure ANOVAs analyzing influences of CMA (CMA versus controls; between-subjects factor) and stimulation (rest versus stimulation; within-subjects factor) on PSDs are shown in Table 2. Stimulation had a significant impact on the VLFOs of deoxy-Hb. There was a significant interaction between CMA and stimulation for deoxy-Hb. One may suppose that stimulation increases VLFOs, because the stimulation frequency was obviously contained in the VLFO band. As illustrated in Figure 6, post hoc analysis revealed that, accordingly, VLFOs of deoxy-Hb were significantly higher during stimulation than rest (controls and patients). Stimulation led also to an increase of VLFOs of oxy-Hb, although it was not significant. Vascular reagibility is reduced in CMA (Hund-Georgiadis et al, 2003; Terborg et al, 2000). Hence, with respect to interaction, one may expect a higher vascular reagibility and elevation of VLFOs due to stimulation in healthy controls compared with the patient group. This was indeed the case for deoxy-Hb (0.04 ± 0.036 versus 0.016 ± 0.022; P < 0.05) without significant effects for oxy-Hb (0.006 ± 0.034 versus 0.009 ± 0.036; P> 0.05; 1-tailed Student's t-test). Additional medical diagnoses and medications did not influence VLFOs (not shown).
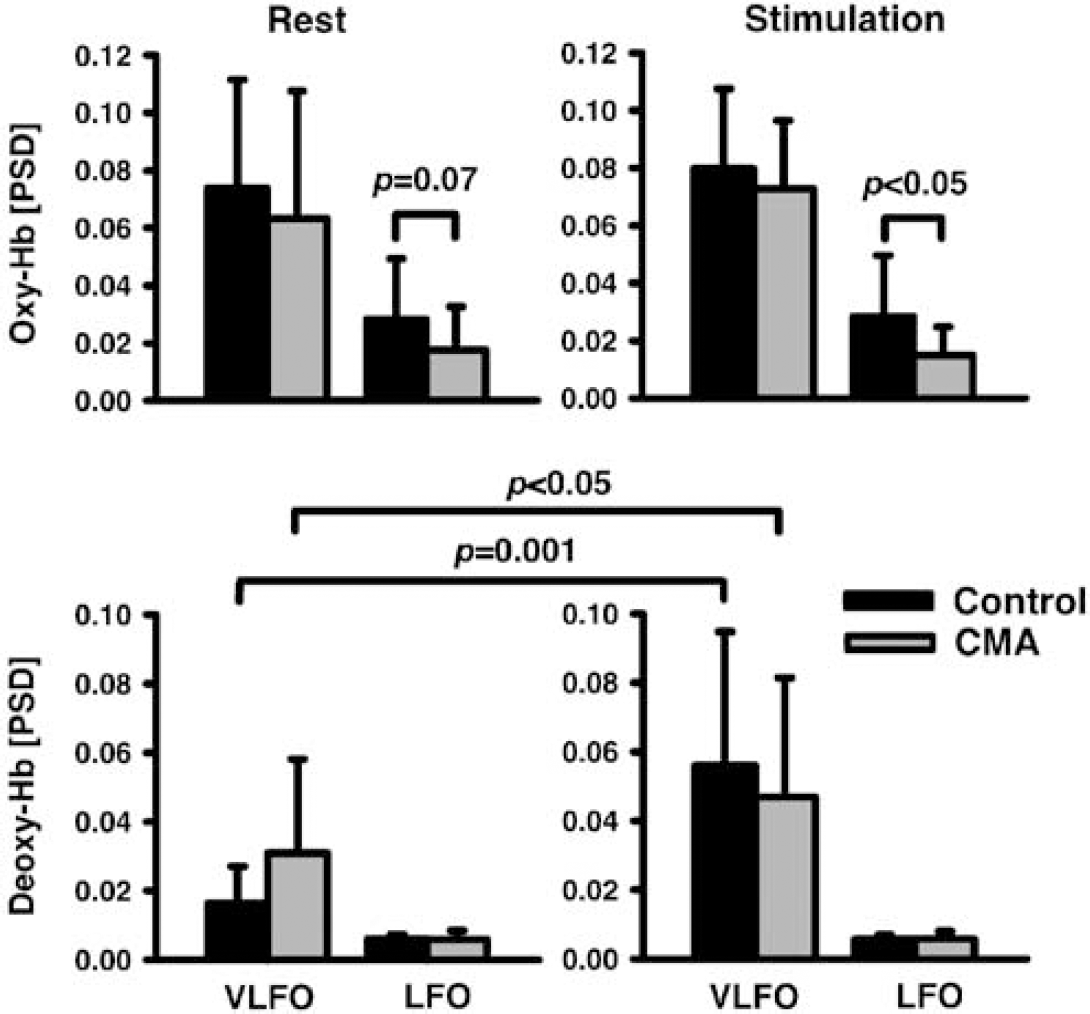
Normalized PSD of LFOs and VLFOs in the visual cortex during rest and visual stimulation in patients with CMA and controls. One-tailed paired (rest versus stimulation) and unpaired (patients versus controls) Student's t-test. Mean ± s.d.
Influences of CMA and stimulation on the PSD of spontaneous low-frequency oscillations
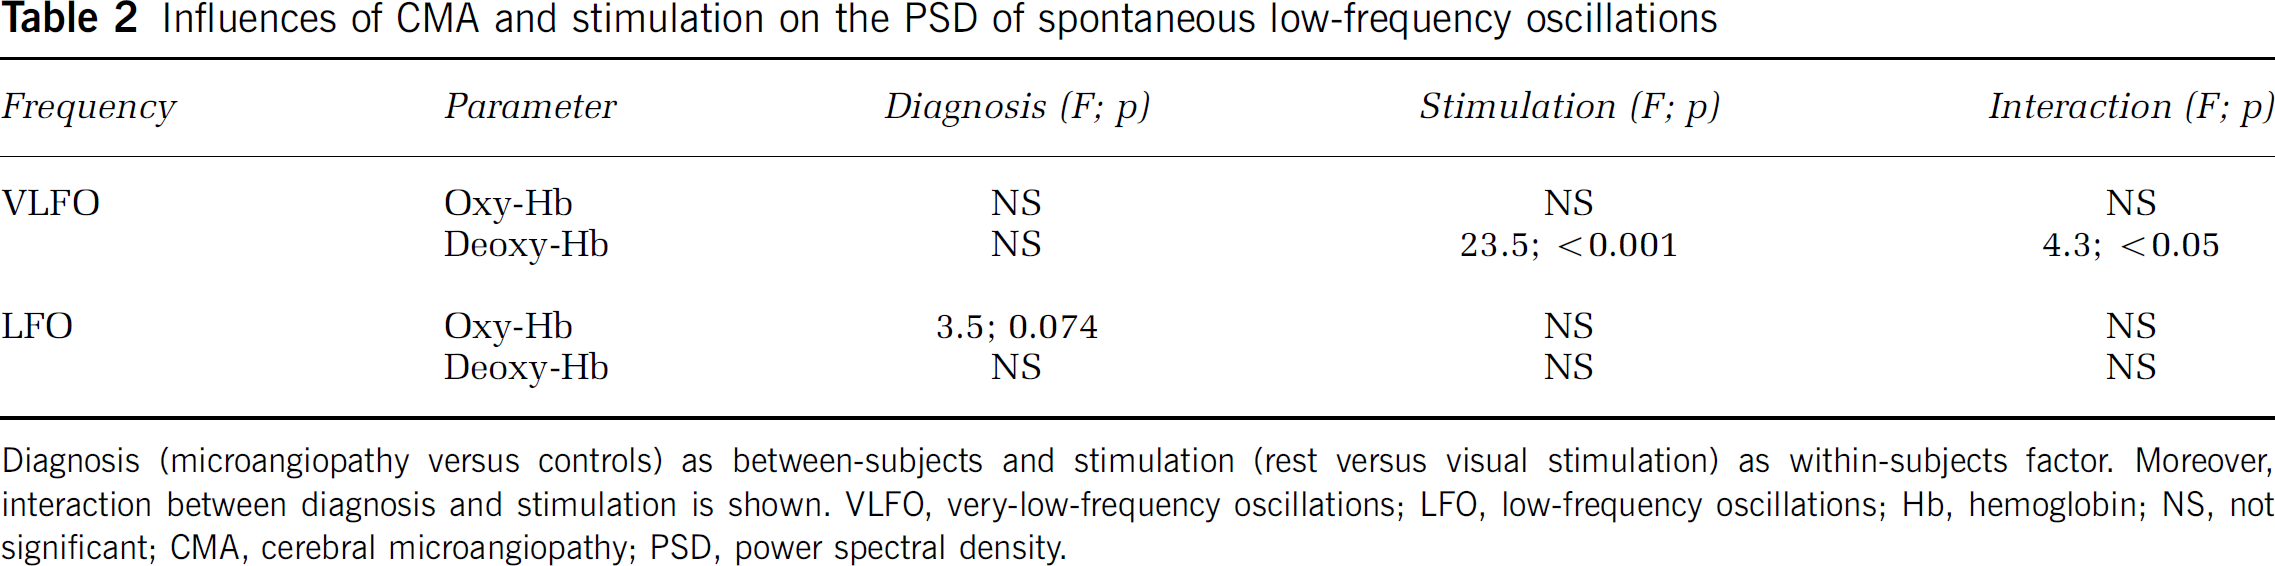
Diagnosis (microangiopathy versus controls) as between-subjects and stimulation (rest versus visual stimulation) as within-subjects factor. Moreover, interaction between diagnosis and stimulation is shown. VLFO, very-low-frequency oscillations; LFO, low-frequency oscillations; Hb, hemoglobin; NS, not significant; CMA, cerebral microangiopathy; PSD, power spectral density.
For LFOs, the repeated-measure ANOVA revealed a ‘trend’ for the factor CMA without any effects of stimulation or interaction (Table 2). Because LFOs decline with aging (Schroeter et al, 2004b), one may assume that CMA leads to a further reduction. Post hoc analysis confirmed such an effect for the LFOs of oxy-Hb (Figure 6). If the several medical diagnoses and medications were included in the ANOVA procedure as covariates, the effect of CMA disappeared. Rather, hypertension had a significant influence on LFOs of oxy-Hb (df = 1, F = 4.8, P < 0.05). One may assume that LFOs are impaired by hypertension (Levy et al, 2001). Post hoc Student's t-tests confirmed this assumption (rest w/o hypertension 0.035 ± 0.0224, with hypertension 0.015 ± 0.0104, P < 0.01; stimulation w/o hypertension 0.035670.0194, with hypertension 0.025 ± 0.0081, P < 0.005; unpaired 1-tailed Student's t-tests). For LFOs of deoxy-Hb, diabetes and statins had a significant effect in the ANOVA (df = 1, F = 4.5, 10.7; P < 0.05, < 0.005). One may assume that diabetes reduces LFOs of deoxy-Hb (Bernardi et al, 1997; Meyer et al, 2003), which was confirmed with post hoc tests (rest w/o diabetes 0.0063 ± 0.002, with diabetes 0.0049 ± 0.001, P < 0.05; stimulation w/o diabetes 0.0061 ± 0.002, with diabetes 0.0047 ± 0.0008, P < 0.05; unpaired 1-tailed Student's t-tests). Although we hypothesized that statins increase LFOs of deoxy-Hb (Scalia and Stalker, 2002), post hoc tests revealed the opposite effect (rest w/o statins 0.0064 ± 0.0019, with statins 0.0046 ± 0.0012, P < 0.05; stimulation w/o statins 0.0061 ± 0.0019, with statins 0.0046 ± 0.0008, P < 0.05).
A correlation analysis was performed relating results of the spectral analysis to the severity of CMA and neuropsychological deficits (Table 3). We hypothesized a negative correlation between PSD of the hemodynamic parameters and the severity of CMA as scored in MRI scans, which was confirmed only for VLFOs of oxy-Hb during stimulation (r = −0.74, P < 0.05; correlation analysis according to Pearson, 1-tailed P). There was no significant correlation between neuropsychological deficits and severity of CMA as scored in MRI scans (Table 3).
Correlation between the PSD of spontaneous low-frequency oscillations, severity of CMA as assessed with MRI scans, and neuropsychological deficits
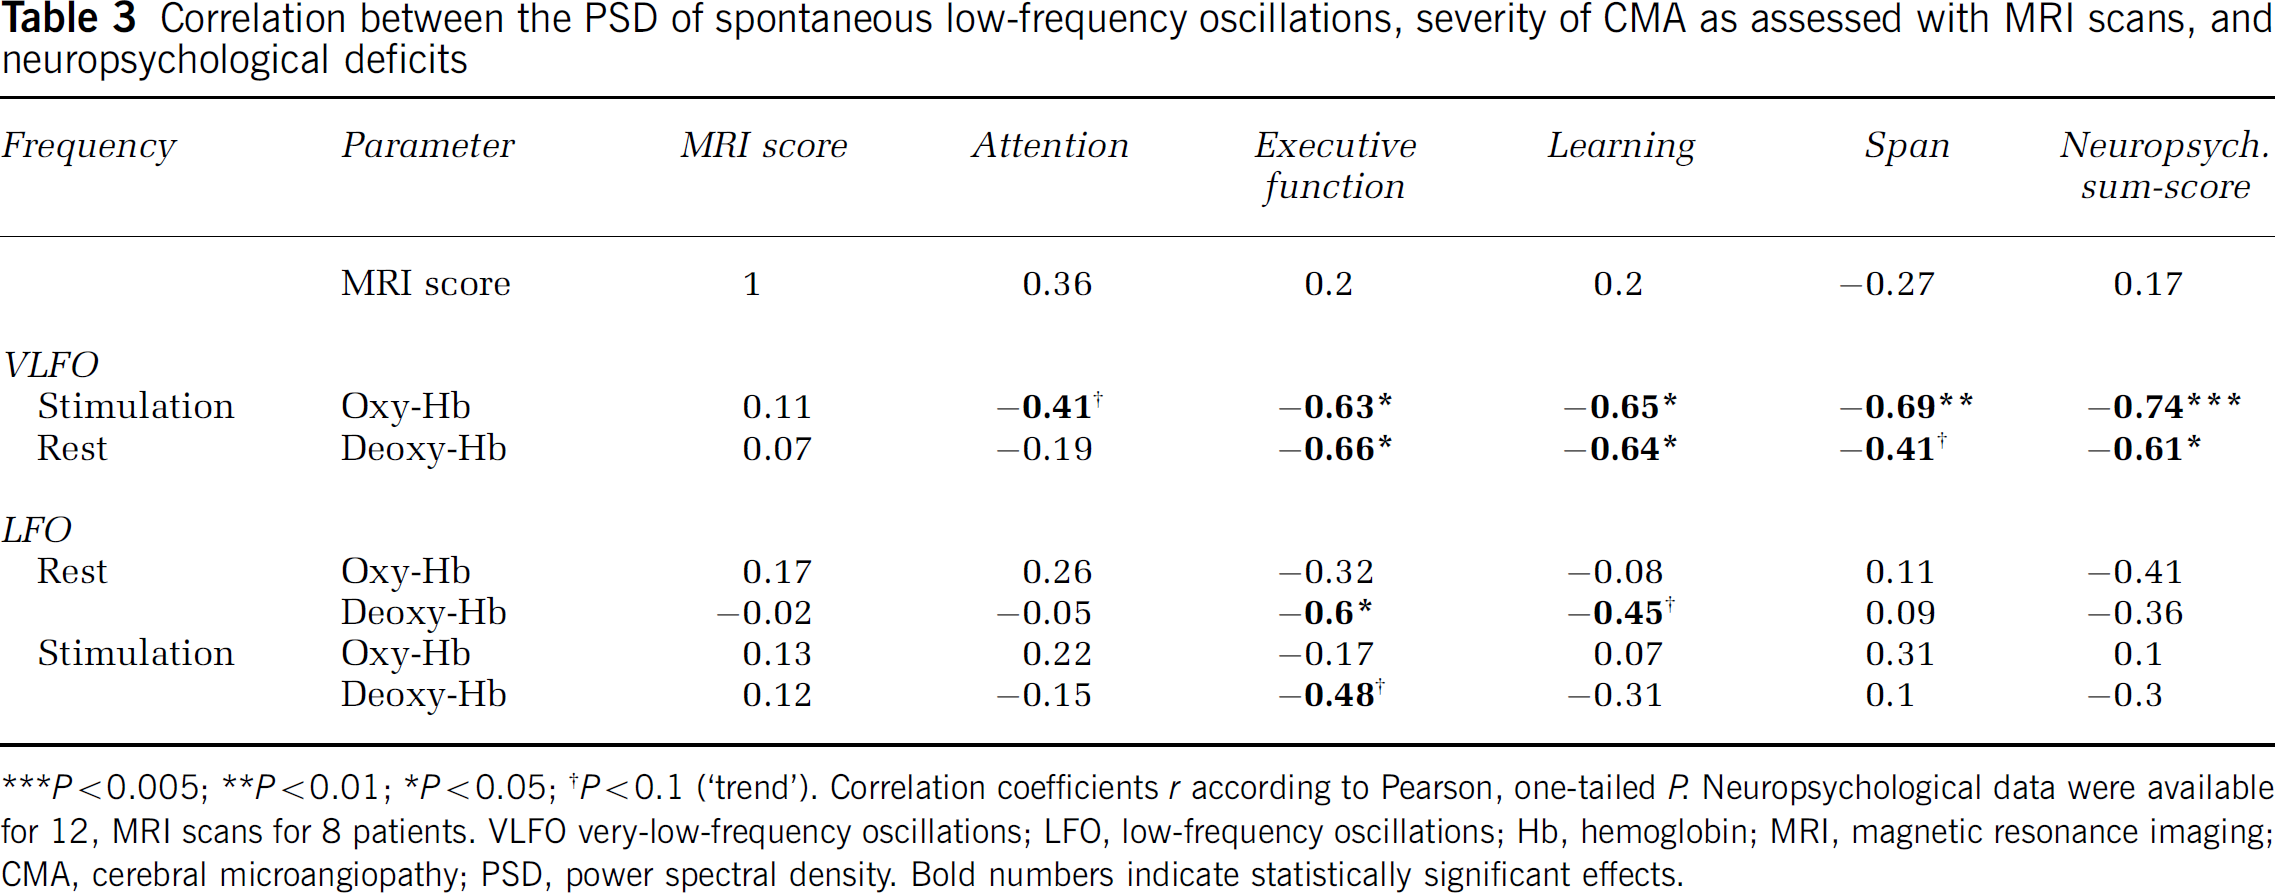
***P < 0.005; **P < 0.01; *P < 0.05; †P < 0.1 (‘trend’). Correlation coefficients r according to Pearson, one-tailed P. Neuropsychological data were available for 12, MRI scans for 8 patients. VLFO very-low-frequency oscillations; LFO, low-frequency oscillations; Hb, hemoglobin; MRI, magnetic resonance imaging; CMA, cerebral microangiopathy; PSD, power spectral density. Bold numbers indicate statistically significant effects.
Further, with respect to the results of the repeated-measure ANOVAs, we supposed that neuropsychological deficits are negatively correlated with vascular reactivity, and hence the difference of VLFOs between stimulation and rest. Indeed, mainly the subscores for executive dysfunction, learning, span, and the sum-score predicted the increase in the PSD due to stimulation for oxy- and deoxy-Hb (Table 3). For LFOs, CMA impaired PSDs, as shown with the repeated-measure ANOVA (see Table 2). Accordingly, one may suppose that neuropsychological deficits are negatively correlated with the LFOs of the hemodynamic parameters, which was proved for executive dysfunction with deoxy-Hb during rest and stimulation, and for learning deficits with deoxy-Hb during rest (Table 3).
Discussion
We detected peaks of the PSD at around the same frequencies like other fNIRS or optical studies investigating spontaneous oscillations in the cortex (Elwell et al, 1999; Mayhew et al, 1996; Obrig et al, 2000; Schroeter et al, 2004b). Further, in accordance with these reports, PSD was generally higher in oxy-Hb compared with deoxy-Hb. Most strikingly, our results show that spontaneous slow hemodynamic oscillations are reduced in the cerebral microvasculature of patients with CMA during both stimulation and rest. Particularly, LFOs of oxy-Hb (0.07 to 0.12 Hz) were weaker in CMA compared with healthy controls. These results agree with Bäzner et al (1995) who reported generally reduced spontaneous LFOs in CMA as assessed with transcranial Doppler monitoring. If additional diagnoses and medications were taken into account, the difference was related solely to arterial hypertension. Hence, data suggest that arterial hypertension decreases the LFOs of oxy-Hb. Interestingly, the LFO range corresponds well with the spontaneous activity recorded in microvascular smooth muscle cells (Golenhofen, 1970). Schmidt et al (1992) concluded that this myogenic pacemaker mechanism causes vasomotion in terminal arterioles, and regulates capillary perfusion (Harrison et al, 2002). Cerebral microangiopathy is related to loss of smooth muscle cells, and increased vessel stiffness (Caplan, 1995; Roman et al, 2002; Tanoi et al, 2000). Arterial hypertension, one risk factor of CMA, also alters the structure and function of the microvasculature (Levy et al, 2001). Namely, it increases the wall-to-lumen ratio in precapillary resistance vessels, may enhance vasoconstriction, and may impair vasodilator responses. In summary, reduction of LFOs of oxy-Hb as observed in our study may indicate structural and functional alterations in the cerebral microvasculature in CMA, mainly due to arterial hypertension.
We detected significant effects of CMA, and arterial hypertension on LFOs of oxy-Hb only, whereas LFOs of deoxy-Hb were unaltered. Oxy-Hb is mainly related to the arterial compartment, whereas deoxy-Hb has to be attributed mainly to the venous part. Because hypertension alters specifically precapillary resistance vessels (Levy et al, 2001), this compartment effect may explain the different results for both chromophores.
Interestingly, our study indicates that antihypertensive drugs, namely angiotensin-converting enzyme inhibitors/angiotensin II receptor blockers, may improve the vascular response during functional stimulation. These results fit very well with literature reports. Brain microvessels contain components of the renin–angiotensin system (Brecher et al, 1978; Bunnemann et al, 1992) that is overactive in arterial hypertension (Unger et al, 1988). Several recent studies (reviewed in Levy et al, 2001) showed that angiotensin-converting enzyme inhibition or angiotensin II receptor blockers can reduce the media-to-lumen ratio of resistance vessels, and, hence, reverse the alterations due to hypertension. These drug effects on microvessel structure were even independent of the lowering of arterial blood pressure and of the renin–angiotensin system, which may explain the dissociation of the factors arterial hypertension and antihypertensive drugs in our study. Moreover, Clozel et al (1989) showed that angiotensin-converting enzyme inhibitors normalize the vascular reserve that is severely reduced in hypertension.
Cerebral microangiopathy, additional medical diagnoses, or drugs had no direct effects on VLFOs in our study. However, stimulation increased VLFOs of deoxy-Hb (0.01 to 0.05 Hz) in healthy controls more than in the patient group. Because the stimulation frequency is obtained in the VLFO range, data indicate that vascular reagibility as elicited by functional stimulation is reduced in CMA in accordance with literature reports (Hund-Georgiadis et al, 2003; Roman et al, 2002; Terborg et al, 2000). Generally, slow spontaneous vasomotions (VLFOs) occur in larger vessels that are rich in neurogenic innervation, whereas fast spontaneous vasomotions (LFOs) originate from terminal arterioles, where neurogenic innervation is negligible (Intaglietta, 1990; Kvandal et al, 2003; Ursino, 1991). Because CMA did not directly influence VLFOs, our data indicate that neurogenic autoregulation is almost unaltered by CMA, the additional medical diagnoses, and drugs.
Furthermore, our study shows that LFOs of deoxy-Hb (0.07 to 0.12 Hz) are reduced in diabetes, in agreement with recent studies with cutaneous laser Doppler flowmetry (Bernardi et al, 1997; Meyer et al, 2003). Reduction in LFOs might be explained by thickening of the basement membrane, endothelial dysfunction, and, consequently, loss of normal autoregulatory function in diabetes (Pallas and Larson, 1996). Data suggest that fNIRS might be applied to diagnose cerebral microvascular changes due to diabetes. Unexpectedly, statins reduced LFOs of deoxy-Hb (0.07 to 0.12 Hz) in our study, without any effect of hypercholesterolemia. Recent studies suggest that the vasoprotective effects of statins are, at least partially, independent of its cholesterol-lowering actions (Scalia and Stalker, 2002). Statins exert additionally antiinflammatory and immunomodulatory effects, and modulate vascular remodeling even under normocholesterolemic conditions. Sterzer et al (2001) showed that statins increase vasoreactivity as elicited by acetazolamide in subcortical small-vessel disease, which seems to contradict our results. However, they applied transcranial Doppler sonography to the middle cerebral artery, and examined consequently the macrovasculature. Together with our results, one may assume that statins induce opposite changes in the micro- and macrovasculature. This compartment effect might also explain why we did not detect any effects of hypercholesterolemia, as it induces atherosclerosis only in the macrovasculature (Harrison and Ohara, 1995). Significant effects of diabetes and statins were detected only for LFOs of deoxy-Hb, leading to the assumption that they are related mainly to the venous compartment (see above).
Noteworthy, impairments of LFOs and vascular reagibility in CMA were tightly correlated with neuropsychological deficits in our study, in contrast to morphological severity of CMA. The highest correlation coefficients were found for executive functions, which are known to be particularly impaired in CMA (McPherson and Cummings, 1996; Roman et al, 2002). These results are in agreement with Hund-Georgiadis et al (2002), who reported that morphological changes were not related to neuropsychological impairment in CMA. Further, Sabri et al (1998, 1999) showed that, in CMA, neuropsychological deficits correlate with functional imaging parameters such as regional cerebral blood flow and glucose utilization during rest, but not with lacunar infarctions and deep white matter lesions. One may conclude that the latter ones are epiphenomena that may morphologically characterize CMA but do not themselves indicate cognitive impairment. Neuropsychological deficits are reflected exclusively by functional imaging parameters that might be used for early diagnosis.
Conclusion
Investigating the microvasculature of the human visual cortex, our study shows that spontaneous LFOs and vascular reagibility decrease in CMA. Particularly, LFOs are impaired in contrast to VLFOs, which remain unaltered. Hence, CMA accelerates microvascular changes due to aging, leading to impairments of autoregulation. Alterations have to be attributed mainly to arterial hypertension, and might be, at least partly, reversed by medical treatment such as angiotensin-converting enzyme inhibitors/angiotensin II receptor blockers. Results indicate that spectral analysis is much more sensitive to changes in the microvasculature due to aging or CMA compared with time-line analysis of the functional hemodynamic response, and enables, therefore, an earlier detection of such alterations.