
Abstract
There is broad agreement that generalized tonic–clonic seizures (GTCS) and normal somatosensory stimulation are associated with increases in regional CBF. However, the data regarding CBF changes during absence seizures are controversial. Electrophysiologic studies in WAG/Rij rats, an established animal model of absence seizures, have shown spike-wave discharges (SWD) that are largest in the perioral somatosensory cortex while sparing the visual cortex. Recent functional magnetic resonance imaging (fMRI) studies in the same model have also shown localized increases in fMRI signals in the perioral somatosensory cortex during SWD. Because fMRI signals are only indirectly related to neuronal activity, the authors directly measured CBF and neuronal activity from specific microdomains of the WAG/Rij cortex using a specially designed probe combining laser-Doppler flowmetry and extracellular microelectrode recordings under fentanyl/haloperidol anesthesia. Using this approach, parallel increases in neuronal activity and CBF were observed during SWD in the whisker somatosensory (barrel) cortex, whereas the visual cortex showed no significant changes. For comparison, these measurements were repeated during somatosensory (whisker) stimulation, and bicuculline-induced GTCS in the same animals. Interestingly, whisker stimulation increased neuronal activity and CBF in the barrel cortex more than during SWD. During GTCS, much larger increases that included both the somatosensory and visual cortex were observed. Thus, SWD in this model produce parallel localized increases in neuronal activity and CBF with similar distribution to somatosensory stimulation, whereas GTCS produce larger and more widespread changes. The normal response to somatosensory stimulation appears to be poised between two abnormal responses produced by two physiologically different types of seizures.
Cerebral blood flow velocity (CBF) and cerebral energy metabolism are normally closely related to local neuronal activity, which includes the neuronal firing rate and field potentials from synaptic activity of neurons (Attwell and Iadecola, 2002; Lauritzen, 2001; Smith et al., 2002; Sokoloff, 1981). With the rise of functional neuroimaging, these relationships have taken on major practical significance, and there has been a great interest in establishing these relationships under conditions of normal brain function (Ames, 2000; Logothetis et al., 2001; Mintun et al., 2001; Norup Nielsen and Lauritzen, 2001; Ritchie, 1967; Shulman et al., 2002). However, very little is known about the coupling of neuronal activity and CBF under abnormal conditions, such as epileptic seizures. Are neuronal activity and CBF increased in all types of seizures? Are the increases, if present, greater or less than during normal information processing in the brain? Are increases spatially confined to the regions of seizure activity, or do they also occur in regions spared by seizures? These questions have important clinical applications, because functional neuroimaging is increasingly used to localize epileptic seizures and guide focal surgical treatment (Lemieux et al., 2001; O'Brien et al., 1998; Richardson, 2002; Rosenow and Luders, 2001; Zubal et al., 1995).
It has long been known, based on observations of the exposed human cerebral cortex during surgery, that epileptic seizures are associated with macroscopic increases in cerebral perfusion (Horsley, 1892; Penfield, 1933; Penfield and Jasper, 1954). However, subsequent investigations have yielded contradictory results in different seizure types, particularly with regard to absence or spike-wave seizures. Absence seizures are brief episodes of staring and behavioral arrest, accompanied by rhythmic spike-and-wave discharges (SWD) on electroencephalography. Generalized tonic–clonic seizures (GTCS), in contrast, are major convulsive episodes accompanied by high frequency EEG paroxysms. Human and animal studies have shown large increases in neuronal activity, CBF, and metabolism during GTCS (reviewed in Blumenfeld, 2003). However, some investigators have shown increases in CBF during SWD (Prevett et al., 1995; Yeni et al., 2000), whereas others have shown the opposite (Bode, 1992; Nehlig et al., 1996; Sanada et al., 1988; Sperling and Skolnick, 1995).
The variable results in these studies may be a product of limited spatial and temporal resolution of existing neuroimaging methods, along with the nonuniform spatiotemporal profile of SWD (Blumenfeld, 2003; Meeren et al., 2002). Integration of measurements over large spatial or temporal domains may produce misleading results by combining increases, decreases, or no change in signal into one measurement. We sought to avoid these problems by dynamically measuring CBF along with neuronal activity using laser-Doppler flowmetry (LDF) and multiunit recordings obtained simultaneously in the same microdomain of the rodent cerebral cortex. LDF measures real-time microvascular perfusion in tissue based on the Doppler shift of back-scattered light from moving red blood cells (Wadhwani and Rapoport, 1988). Major advantages of this technique are the ability to use small probes to sample over a spatial scale of a few hundred microns at high temporal resolution and the ability to simultaneously record neuronal spiking and field potentials with an extracellular microelectrode. We accepted the limited spatial sampling of this technique compared with neuroimaging methods because it avoids the potential ambiguities of integrating signals over larger spatial and temporal domains.
WAG/Rij rats are an established rodent model of absence seizures (Coenen et al., 1992; Coenen and Van Luijtelaar, 2003; Crunelli and Leresche, 2002; Inoue et al., 1994) exhibiting spontaneous SWD, which are similar to human absence seizures in terms of behavior and response to medications. Interestingly, SWD in both humans (Coppola, 1988; Rodin and Ancheta, 1987; Weir, 1965) and WAG/Rij rats have much larger amplitude in anterior brain regions, and recent studies in WAG/Rij rats suggest that SWD may originate from the perioral somatosensory cortex, while the occipital cortex is almost entirely spared (Blumenfeld, 2003; Meeren et al., 2002). Our recent functional magnetic resonance imaging (fMRI) studies have also shown increases that are maximal in the perioral and barrel somatosensory cortex during SWD in WAG/Rij rats (Nersesyan et al., 2003, 2004). Therefore, we investigated local effects on CBF and neuronal activity in both regions that are intensely involved (e.g., barrel cortex) and in those that are spared (e.g., primary visual cortex) during SWD in WAG/Rij rats. We compared these measurements to changes in the same regions during GTCS and during normal somatosensory processing. Dynamic and simultaneous measurements with tissue LDF and extracellular multiunit recordings provide direct information not available by other currently existing methods. This information about the time course and distribution of the microvascular hemodynamic response to seizures and normal neuronal function will improve the interpretation of functional neuroimaging in patients with epilepsy.
MATERIALS AND METHODS
Mapping experiments were performed on 35 adult epileptic WAG/Rij rats, and combined electrophysiology and laser Doppler experiments were performed on 12 adult female epileptic WAG/Rij rats aged 160 to 180 days with an average weight of 188 ± 8 g (mean ± SD). Anesthesia was induced with 1.5% halothane and then switched to 40 μg/kg intravenous fentanyl (Abbott Laboratories, North Chicago, IL, U.S.A.) plus 2 mg/kg intraperitoneal haloperidol (Novaplus, Irving, TX, U.S.A.) every 45 minutes, because fentanyl/haloperidol anesthesia does not suppress SWD (Pinault et al., 1998). A tracheostomy was performed, and the animals were artificially ventilated. The femoral artery was cannulated with a fine plastic catheter (Intramedic PE tubing, inner diameter 0.56 mm, outer diameter 0.965 mm; Becton Dickinson, Sparks, MD, U.S.A.) for continuous blood pressure, blood gas (P
The animal was placed in a stereotaxic frame (David Kopf Instruments, Tujunga, CA, U.S.A.) on a vibration-free table inside a Faraday cage. The skin and underlying tissues were removed over the skull vertex and after the marking of needed stereotaxic coordinates (Paxinos and Watson, 1986) small burr holes were drilled and duratomy was performed. Experiments to map the regions maximally involved in multiunit activity and field potentials during SWD were performed with single tungsten microelectrodes (FHC, Bowdoinham, ME, U.S.A.) with impedance 2 to 4 MΩ (measured with a 1-kHz, 10-nA sine wave current). Electrode positions for mapping studies were verified histologically at the conclusion of experiments. To simultaneously record neuronal activity and monitor microvascular perfusion from the same small area of the rat cerebral cortex we developed a combined double-probe using a bare fiber laser-Doppler probe BF/F/0.5, total diameter approximately 450 μm (Oxford Optronix, Oxford, UK) and a tungsten microelectrode (FHC, Bowdoinham, ME) with an impedance of 2–4 MΩ (measured with a 1 kHz, 10nA sine wave current).
The microelectrode was glued to the side of an 18G spinal needle shaft (Terumo, Tokyo, Japan) and the fiberoptic laser-Doppler probe was placed inside of the needle shaft so that tips of each sensor protruded (approximately 1.5 mm) beyond the tip of the needle. The shaft of the needle was then placed in an electrode holder (Plastic One, Roanoke, VA, U.S.A.) on the stereotaxic apparatus, and the tip of the double probe was advanced into the rat cortex through the burr hole until both probes came to lie at a depth corresponding to cortical layer IV. Because the cortical thickness varies from the frontal to the occipital regions (Paxinos and Watson, 1998), the physical penetration depths in the regions of interest were determined from prior studies (Hyder F, 2003 unpublished data).
Although the tissue integrity around the double probe was likely compromised during the process of insertion, the regions beneath the tips of the double probe were viable. Tissue damage in the path of the probe being inserted is an unavoidable consequence of invasive methods (Rival et al., 1995; Rundquist et al., 1985; Swiontkowski et al., 1986). However, the viable tissue around the tip of the probe allows for highly sensitive measurements of local somatosensory activity under normal physiologic conditions (Ances et al., 2000; Leniger-Follert and Hossmann, 1979; Matsuura and Kanno, 2001; Ngai et al., 1999). Although the expected sampling volumes of the microelectrode and the laser-Doppler probe were partly overlapping due to the intrinsic design of the double probe, to ensure that both sensors sampled signals from superimposing regions, we placed the tip of the microelectrode slightly below (approximately 120 μm) the tip of the laser-Doppler probe. This design was implemented in part because both sensors were sensitive to signals only around the tips and the laser-Doppler probe sampled a slightly larger region (Oxford Optronix) than the microelectrode (FHC).
Two double-probes were used simultaneously during the experiment to record local tissue CBF and neuronal activity in two different locations. The first probe was placed in the whisker area of the primary somatosensory cortex, barrel field (S1BF), and the second probe was placed in the primary visual cortex, monocular (V1M). In 7 of 12 rats, the coordinates were (in millimeters from bregma) ML = +5.8, AP = −2.3; for S1BF and ML = +2.4, AP = −8 for V1M. In the remaining five rats, we used slightly different coordinates within the same functional zones and did not include these data in our group analysis, although results were very similar to those obtained in the main group. To record macroscopic brain activity over a wider region, a pair of EEG electrodes (WPI, Sarasota, FL, U.S.A.) were placed adjacent to the skull in the left frontal and occipital areas and recorded in differential mode.
Extracellular neuronal signals were amplified (x1,000) and filtered (low and high cutoffs at 100 Hz and 20 kHz, respectively) with a Microelectrode AC Amplifier Model 1800 (A-M Systems, Carlsborg, WA, U.S.A.). Microvascular blood perfusion in rat brain tissue was monitored with Oxyflo Laser Doppler Microvascular Perfusion Monitor (Oxford Optronix). The EEG was recorded and filtered (low and high cutoffs at 1 Hz and 300 Hz, respectively) with the Grass EEG and Polygraph Data Recording System Model 79D (Grass Instruments Co., Quincy, MA, U.S.A.). All signals were digitized and processed with CED 1401 interface using Spike 2 software (Cambridge Electronic Design, Cambridge, UK).
All recordings were performed continuously for several hours. Under these conditions, 11 out of 12 WAG/Rij rats exhibited multiple SWD. Mechanical stimulation of all whiskers on the rat's left snout was performed in unison with a wooden probe without touching the skin at approximately 5-minute intervals, with stimulus duration of 3 seconds and at a frequency of 5 Hz. The duration and frequency of the stimulation were similar to, or slightly less than, the duration and frequency of SWD events. In five rats, GTCS were induced by intravenous bolus injection of 0.2 mg bicuculline after acquiring enough data sets with spontaneous SWD and whisker stimulation. In each rat, three injections were performed, with a stabilization period of at least 30 minutes between each seizure and the next bicuculline injection.
The extracellular neuronal recordings included multiunit spiking, representing local presynaptic neuronal firing, and local field potentials, representing summated regional postsynaptic activity. During epileptic seizures, high-frequency neuronal firing in the cerebral cortex causes massive synchronized presynaptic and postsynaptic activity in local microcircuits (Avoli et al., 1990; Kostopoulos et al., 1981). Thus, during seizures, local recordings of spiking rate and field potentials are closely related. Because discrete field potentials cannot easily be identified or quantified during sustained tonic–clonic seizures, our analysis focused on the closely related spiking rate, which can be quantified both during seizures and at baseline. Spiking activity of the neuronal ensemble was extracted from the extracellular recordings by shape recognition of high signal-to-noise ratio spikes with the Spike 2 software, which uses a template-matching procedure (Lewicki, 1998). Up to three well-resolved units were identified per recording electrode, and were followed to create a temporal history for the entire recording session. We used the same neuron templates identified under baseline conditions in each recording to identify neurons during seizures and whisker stimulation, and to ensure that the spiking data extracted from the extracellular recordings were from the same neuronal ensemble in all conditions. The extracted data were then converted to reflect the spiking frequency (ν) of the neuronal ensemble by analyzing consecutive 1-second bins for SWDs and whisker stimulation, and 10-second bins for GTCS, because these events had a longer duration. The changes in spiking frequency (Δν/ν) were calculated by comparison of ν during seizures or whisker stimulation versus mean ν of the baseline immediately preceding the seizure or whisker stimulation. Similarly, changes in CBF (ΔCBF/CBF) were calculated during seizures or whisker stimulation versus mean CBF of the baseline immediately preceding the seizure or whisker stimulation. However, it should be noted that ΔCBF/CBF measured by laser-Doppler methods is not quantitative. Because changes in activity during whisker stimulation represent normal somatosensory processing whereas changes during seizures reflect abnormal activity, we were interested in determining the relative changes in ν and CBF under conditions of SWD, whisker stimulation, and GTCS. We therefore normalized the values for Δν/ν and ΔCBF/CBF for each experiment to the mean peak values obtained during whisker stimulation. Thus, the magnitudes of changes in each parameter during SWD and GTCS could be compared in a meaningful manner.
RESULTS
CBF and neuronal activity during SWD and whisker stimulation
Mapping studies of SWD were performed with extracellular multiunit electrode recordings in 35 WAG/Rij rats, and were in general agreement with prior published studies (Meeren et al., 2002). As in these studies, we found that multiunit activity and field potentials were maximal in the somatosensory cortex, particularly in the perioral somatosensory cortex and barrel cortex (Fig. 1). Interestingly, when particular cortical regions were involved, the corresponding thalamic relay nuclei were involved as well, and when specific cortical regions were spared, so were the corresponding thalamic regions. Thus, the somatosensory cortex and motor cortices were all intensely involved in SWD, along with the thalamic ventral posterior medial nucleus, ventral posterior lateral nucleus, nucleus reticularis thalami, and ventral lateral nucleus. However, the primary visual cortex and hippocampus were entirely spared by SWD, as were the thalamic lateral geniculate nucleus and lateral dorsal nucleus. Sparing of the visual cortex and lateral geniculate nucleus was not due to visual suppression, because these regions were spared by SWD even when the room was darkened, and even in three animals in which all retinal inputs were blocked by bilateral intraocular tetrodotoxin injections.
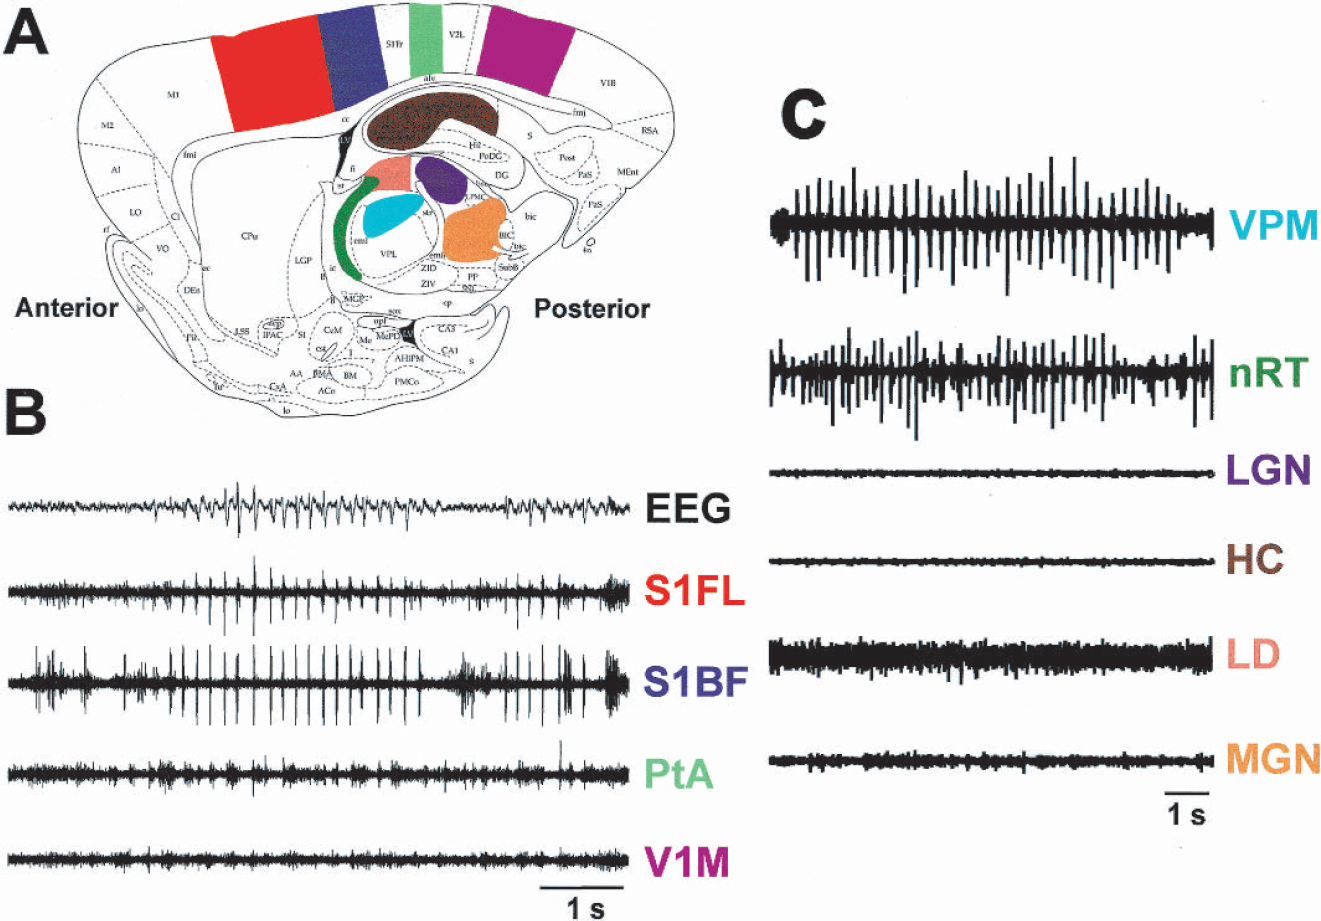
Selective cortical and subcortical network involvement in SWD. (
For simultaneous recordings of electrophysiologic and CBF changes, we focused our studies on the whisker area of the primary somatosensory cortex, barrel field (S1BF), and the primary visual cortex, monocular (V1M), because these regions were, respectively, found to be maximally involved, and spared, by SWD. In the initial five rats, we sampled different locations within these regions to find coordinates with optimal responses to both whisker stimulation and SWD (in S1BF) and then used these coordinates for group analyses in the remaining seven animals. A total of 140 spike-wave seizures were recorded in these seven animals with an average duration of 5.12 ± 1.63 seconds (mean ± SD; range, 2.07–9.61 seconds). A total of 50 whisker stimulation responses were recorded with constant stimulus duration of 3 seconds. In all rats, spontaneous SWD induced a noticeable CBF increase in S1BF and negligible CBF increases in V1M (Figs. 2 and 3A). The CBF changes correlated strongly with multiunit neuronal activity, which showed a prominent increase in neuronal firing frequency during SWDs in S1BF and lack of a similar increase in V1M. As in prior studies (Meeren et al., 2002), local field potentials during SWD were also present in S1BF but not V1M (data not shown). The onset of CBF increases in S1BF was delayed by approximately 1 or 2 seconds after the onset of SWD (Fig. 2B). After the seizure, CBF decreased to basal levels, also with a lag of approximately 2 seconds (Fig. 2B). The mean peak increases in ν and CBF during SWD were much greater in S1BF than in V1M (P < 0.0001 for ν and P < 0.0003 for CBF, two-tailed t-test) (Figs. 3 and 4).
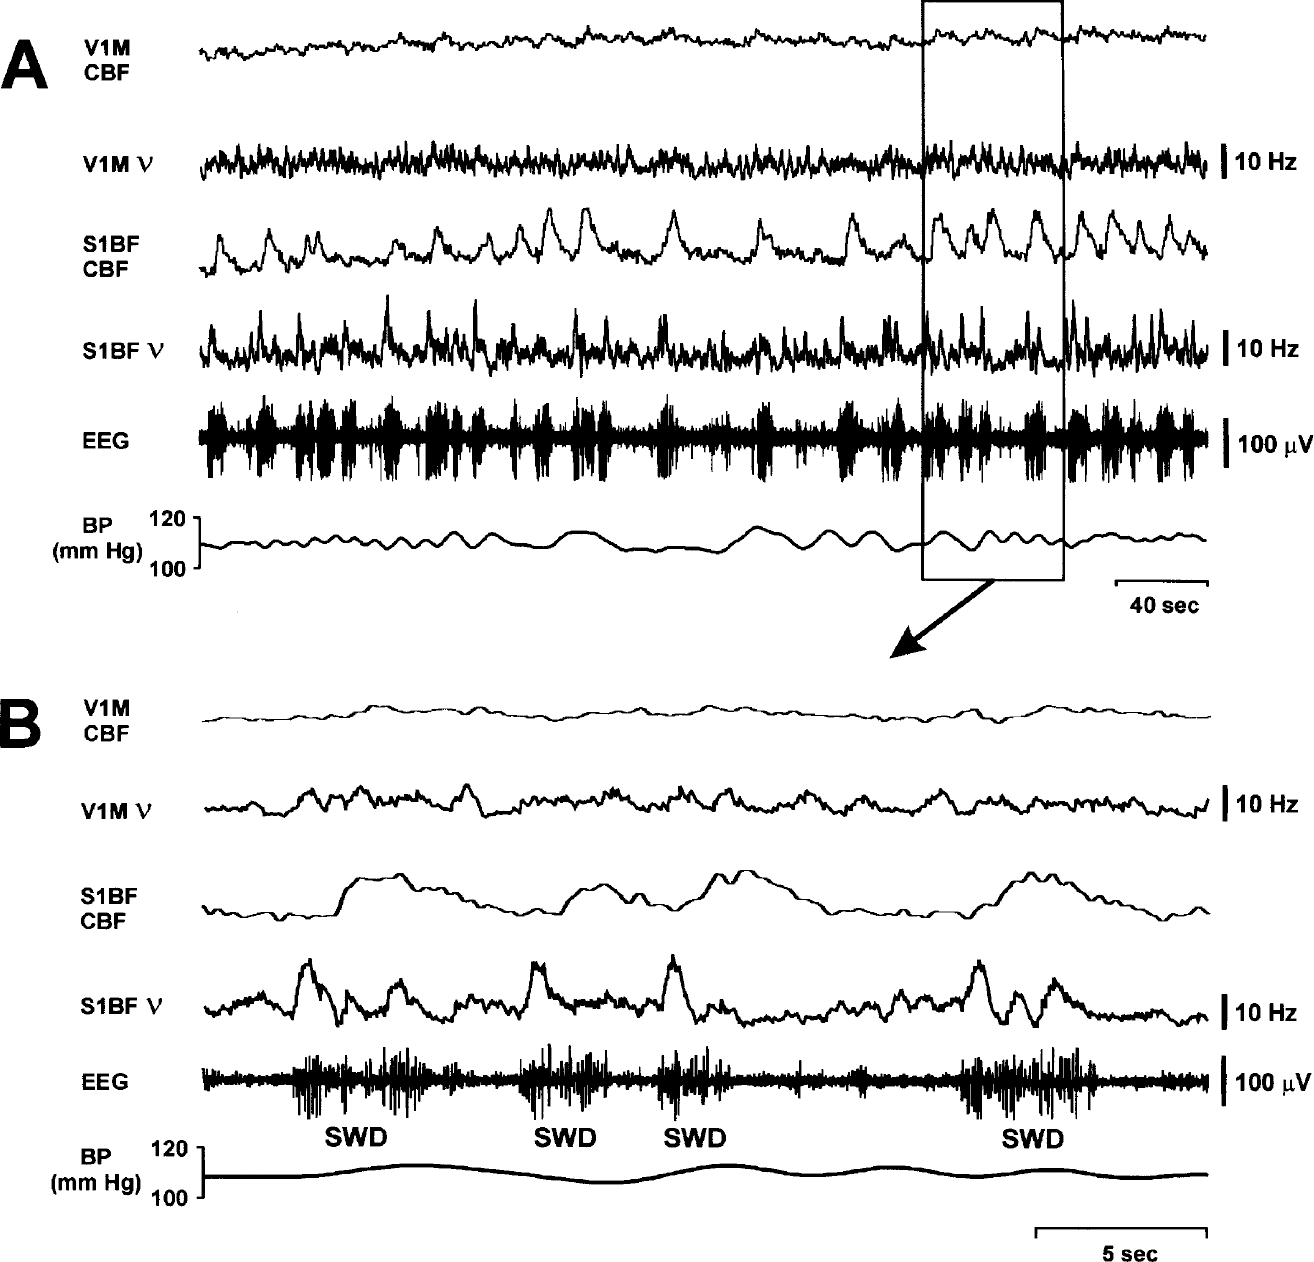
Dynamic recordings of CBF and neuronal activity during SWD. (
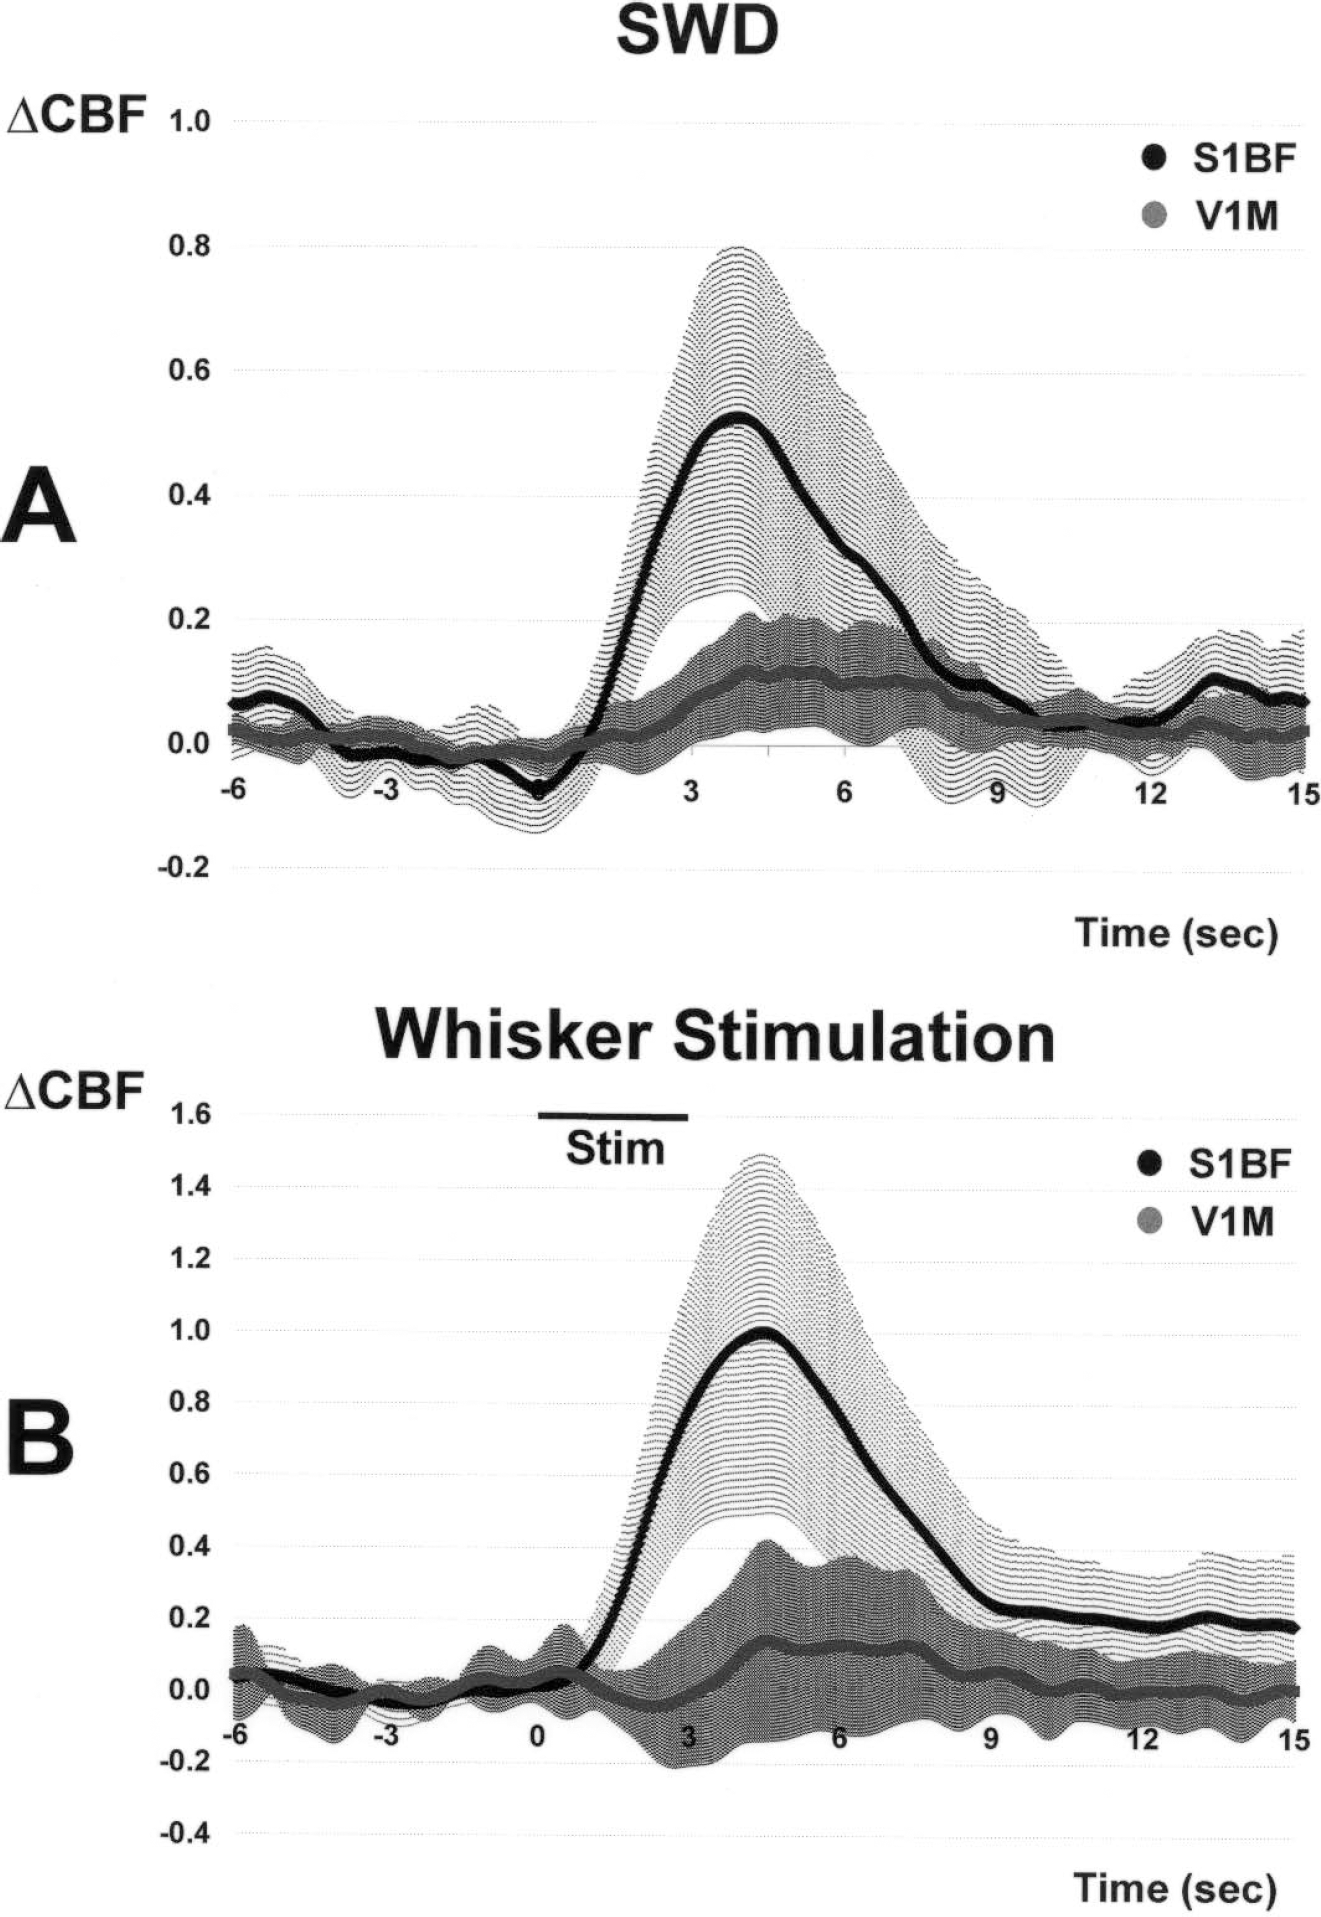
Waveform averages for CBF changes during SWD versus whisker stimulation. (
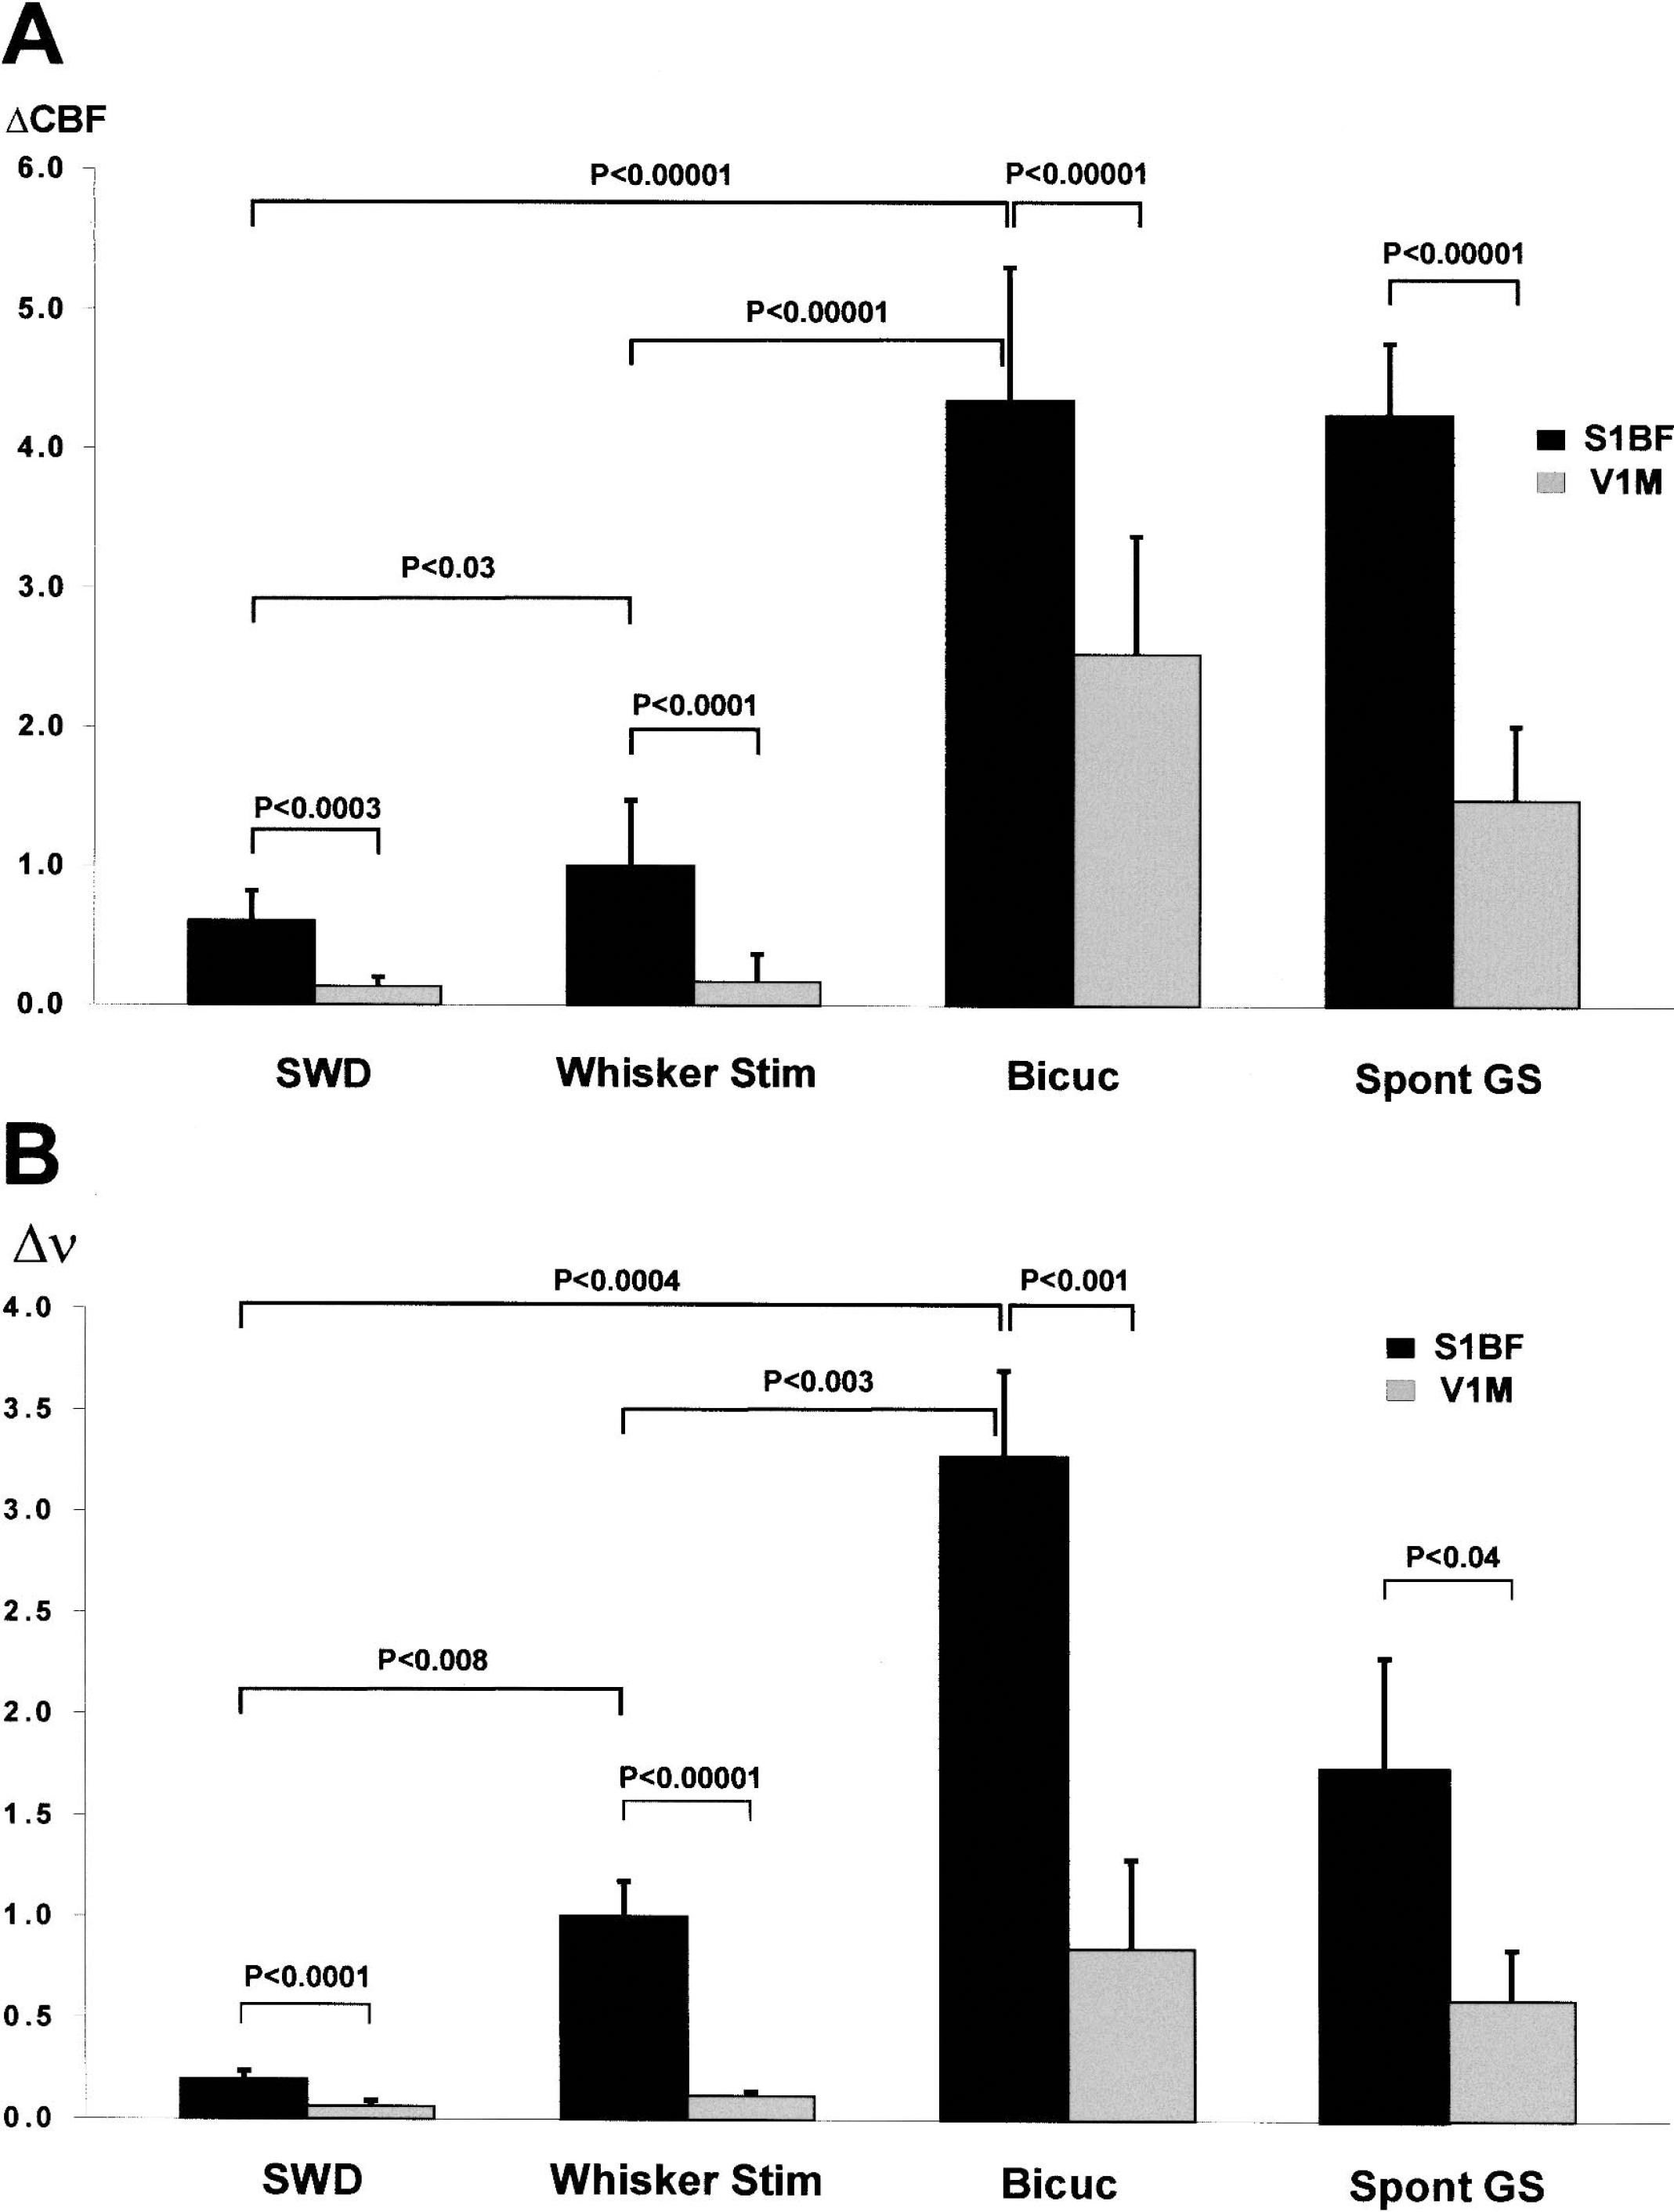
Summary of mean peak changes in CBF and neuronal firing (v) under all conditions. Comparison of mean peak increases in CBF (
Similar transient increases in neuronal firing and CBF were observed in the barrel cortex (S1BF) during whisker stimulation (Figs. 3B and 5). However, during whisker stimulation, the increases in ν and in CBF were greater than during SWD in the same location (Figs. 3 and 4). Thus, in S1BF the mean peak increases in ν and CBF during SWD relative to whisker stimulation (mean peak increase during whisker stimulation defined as 1.0) were 0.2 ± 0.04 and 0.6 ± 0.20, respectively (P < 0.008 for ν and P < 0.03 for CBF, two-tailed t-test) (Fig. 4). Therefore, smaller relative increases in neuronal firing and CBF were observed in the barrel cortex during SWD than during whisker stimulation. We found that mean fractional changes in CBF during SWD and whisker stimulation were 24% and 45%, respectively. However, caution should be used in comparing these fractional changes with other reports because of the unknown baseline values. Our laser-Doppler measurements from the S1BF region during whisker stimulation are in good agreement with prior laser-Doppler measurements for the forelimb stimulation model from other laboratories (Ances et al., 2000; Matsuura and Kanno, 2001; Ngai et al., 1999) as well as from our own (Kida et al., 2002a; Trübel et al., 2003).
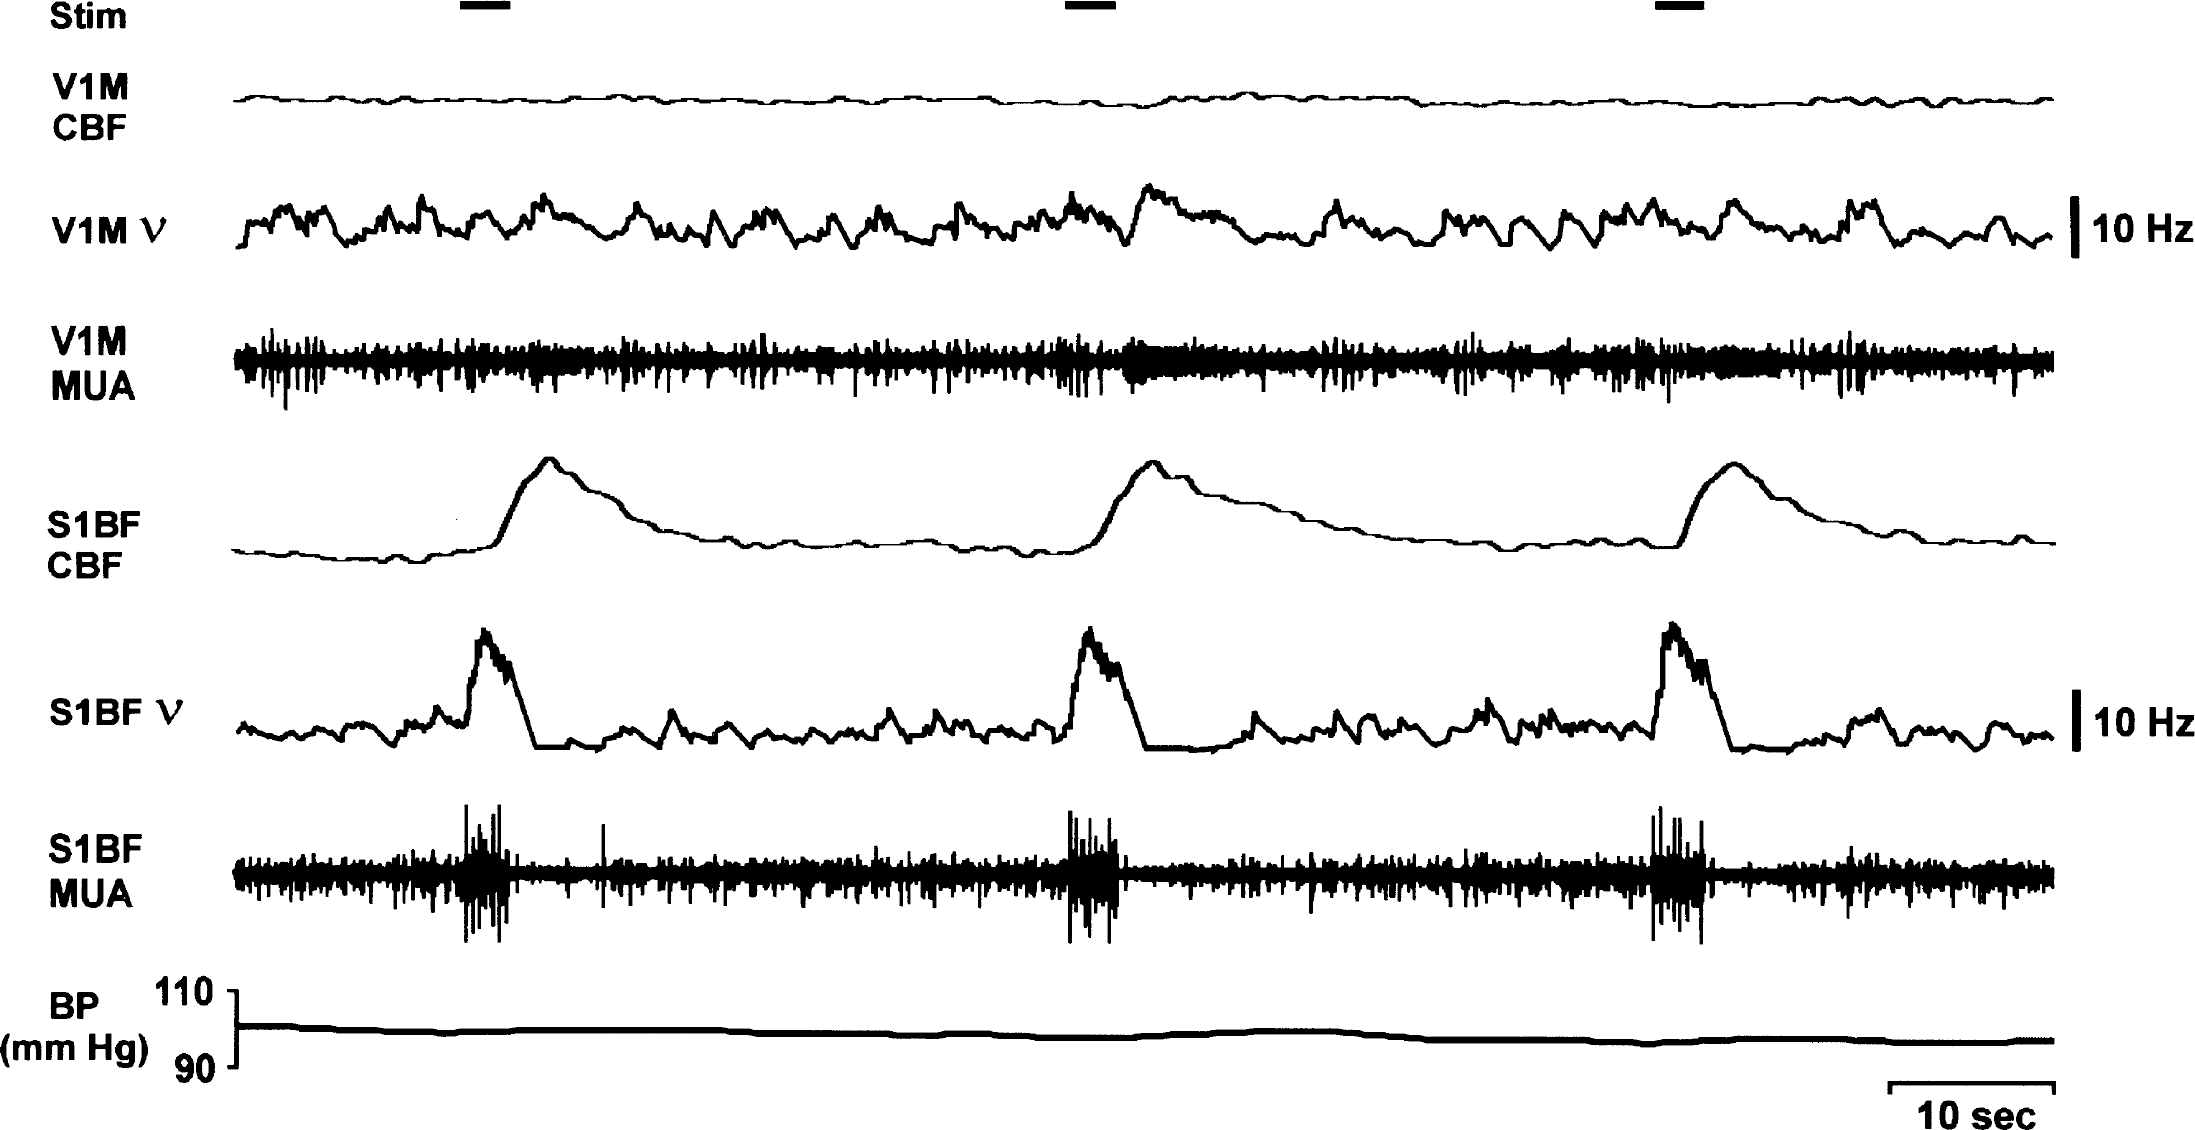
CBF and neuronal activity during whisker stimulation. Changes in CBF were recorded by laser-Doppler flowmetry together with extracellular multiunit neuronal activity (MUA) during multiple episodes of whisker stimulation (horizontal black bars, duration = 3 seconds) in a WAG/Rij rat under fentanyl/haloperidol anesthesia. Whisker stimulation induces parallel increases in CBF and neuronal firing rate (v in barrel cortex (S1BF)) and almost negligible changes in primary visual cortex (V1M). CBF variations are independent of arterial blood pressure fluctuations.
In the case of both SWD and whisker stimulation, the CBF variations were completely independent of arterial blood pressure fluctuations (Figs. 2 and 5). In addition, increases in CBF and neuronal firing in V1M were negligible during both SWD and whisker stimulation compared with S1BF (Fig. 4).
CBF and neuronal activity during bicuculline-induced and spontaneous GTCS
A total of 14 bicuculline-induced tonic–clonic seizures were recorded in seven rats, with mean seizure duration of 210.6 ± 78.4 seconds. The intravenous bolus injection of 0.2 mg bicuculline induced, after a mean latency of 12.6 ± 3.9 seconds, GTCS with a sharp increase of both ν and CBF in S1BF (Fig. 6A). However, unlike SWD and whisker stimulation, marked increases were also present in V1M during bicuculline-induced tonic–clonic seizures (Figs. 4 and 6A), and field potential activity during tonic–clonic seizures involved both regions as well (data not shown). In addition, increases in ν and in CBF were dramatically higher during bicuculline-induced seizures than during SWD or whisker stimulation (Figs. 4 and 6A). Thus, in S1BF the mean peak increases in ν and in CBF during bicuculline-induced seizures relative to whisker stimulation (mean peak increase during whisker stimulation defined as 1.0) were 3.3 ± 0.4 and 4.3 ± 0.9, respectively (P < 0.003 for ν and P < 0.00001 for CBF, two-tailed t-test) (Fig. 4). The mean fractional change in CBF during GTCS was 206% for bicuculline-induced seizures, which was much larger than the changes during SWD in the same rats.
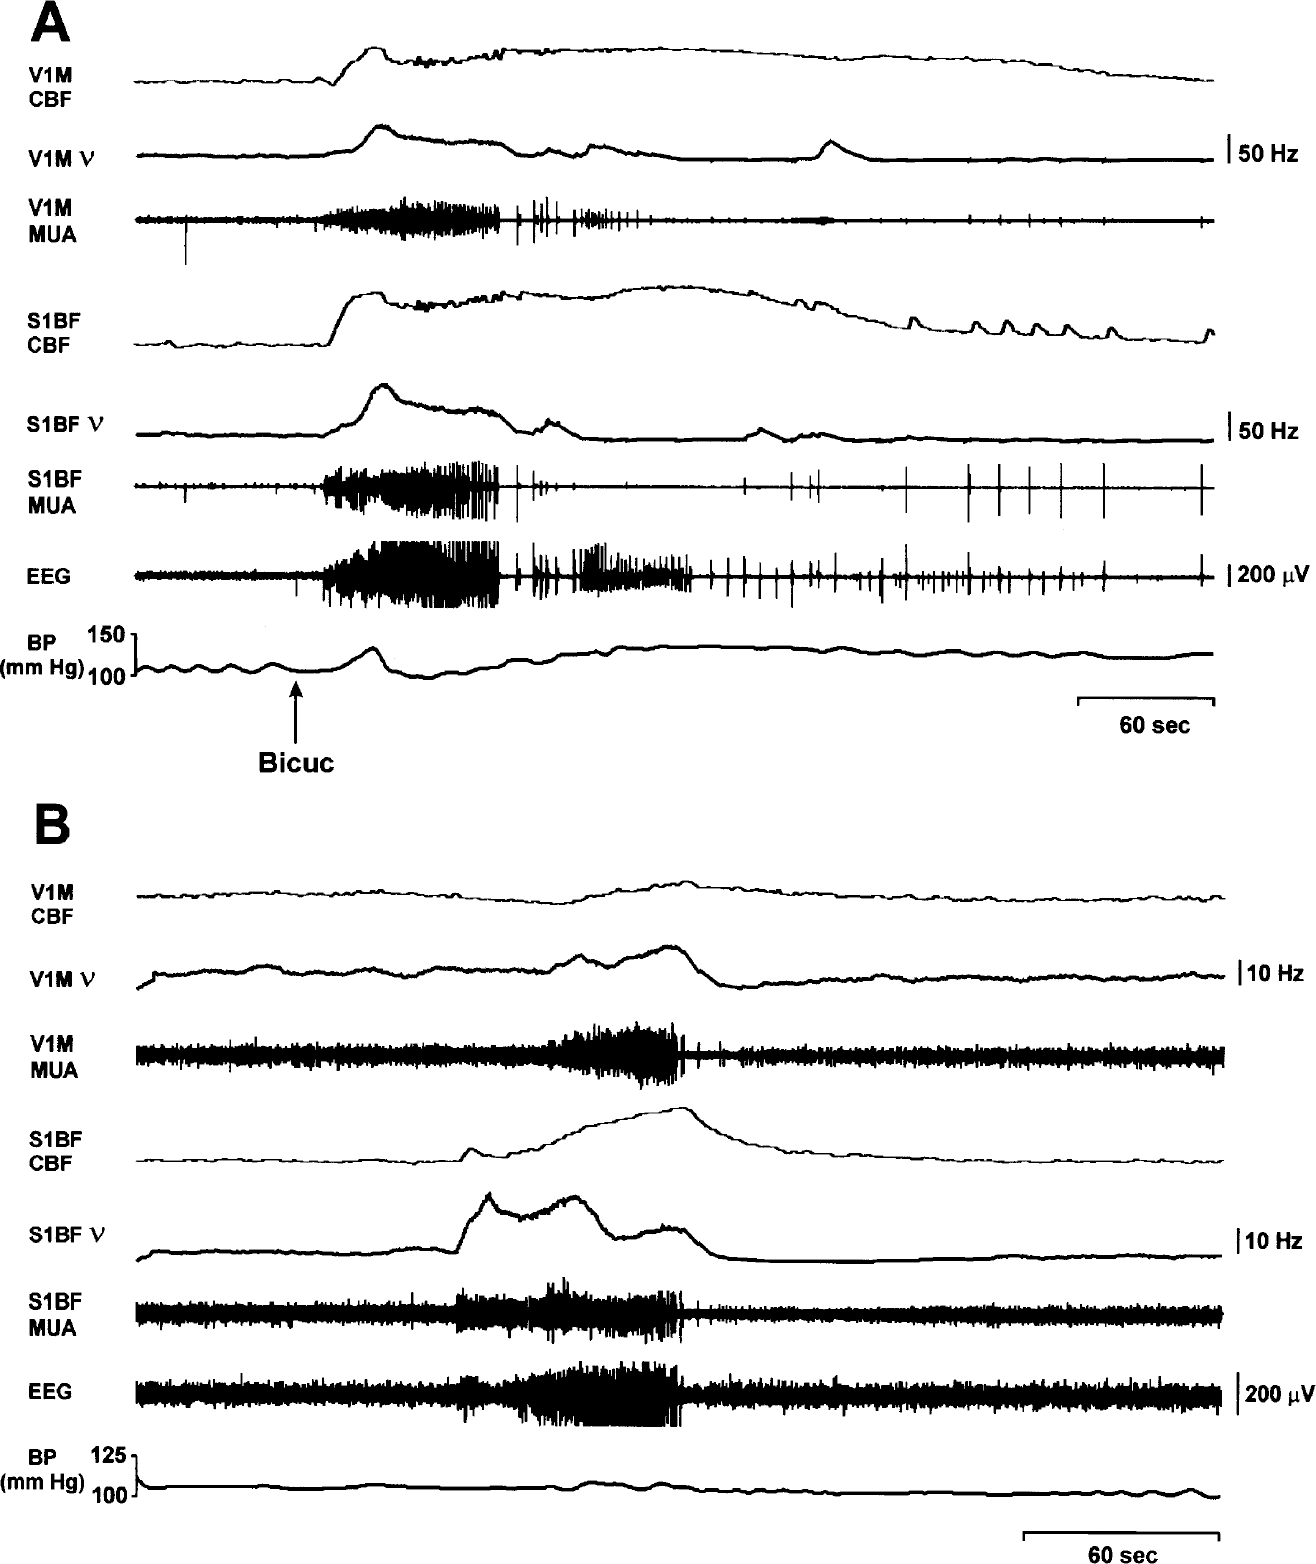
CBF and neuronal activity during generalized tonic–clonic seizures. Changes in CBF and extracellular multiunit activity (MUA) were recorded simultaneously, along with EEG and arterial blood pressure (BP) monitoring during bicuculline-induced (
CBF fluctuations were partially correlated with transient blood pressure variations after the injection of bicuculline (Fig. 6A). However, as shown in the figure, large CBF increases were often present even when systemic blood pressure was at or below baseline, so that the increases in CBF cannot be explained entirely by blood pressure changes. This finding agrees with previous studies showing cerebral autoregulation independent of changes in systemic blood pressure (Hernandez et al., 1978; Reese et al., 2000). To clarify this further, we analyzed CBF changes separately for the 3 out of 14 tonic–clonic seizures in which the systemic blood pressure increased by less than 15% or decreased during seizures. In these three seizures, the mean peak increase in CBF relative to whisker stimulation was still markedly increased at 4.3 ± 0.01 (P < 0.00001).
Under fentanyl/haloperidol anesthesia, 1 rat of the 12 rats studied had spontaneous GTCS instead of SWD. This provided an opportunity to record changes in CBF and neuronal firing rate during tonic–clonic seizures without bicuculline (Fig. 6B). A total of nine seizures were recorded with a mean duration of 48.08 ± 12.15 seconds. In S1BF, the mean peak increases in ν and in CBF during spontaneous GTCS relative to whisker stimulation were 1.7 ± 0.5 and 4.2 ± 0.5, respectively (P < 0.09 for ν and P < 0.00001 for CBF) (Fig. 4). Thus, as in bicuculline-induced GTCS, the increases were greater than during SWD or whisker stimulation. In addition, as in bicuculline-induced tonic–clonic seizures (but unlike whisker stimulation or SWD), marked increases were also present in V1M during the spontaneous tonic–clonic seizures (Fig. 4). This suggests that the large CBF increases during GTCS were related to neuronal firing, and not to some other nonspecific effect of bicuculline. As shown in Fig. 6B, although increases in systemic blood pressure were also observed during these seizures, they were relatively small at 14% on average (range, 7–18%) over the baseline, and would therefore be expected to make only a small contribution to the observed increases in CBF (Hernandez et al., 1978).
DISCUSSION
These studies show localized CBF increases at the microvascular level during spontaneous SWD, somatosensory stimulation, and bicuculline-induced GTCS in the primary somatosensory cortex of WAG/Rij rats. Increases in CBF correlated with increases in neuronal activity in the same locations. Regions spared by increases in neuronal activity were likewise spared by CBF increases. SWD produced CBF and ν increases in barrel cortex that were smaller than during somatosensory stimulation. GTCS, however, produced increases that were much greater than during somatosensory stimulation. Thus, the normal response to somatosensory stimulation in this region is poised between two abnormal responses produced by two physiologically different types of seizures.
Although it is generally agreed that under normal physiological conditions synaptic activity contributes to increased neuronal metabolism and CBF, there has been some controversy regarding the contribution of action potentials (spiking) to neuroimaging signals (Attwell and Laughlin, 2001; Hyder et al., 1998; Lauritzen, 2001; Logothetis et al., 2001; Mintun et al., 2001; Shulman et al., 2002; Smith et al., 2002; Sokoloff, 1980;). Although this debate is likely to continue, what is clear is that during epileptic seizures there is high frequency neuronal firing in the cerebral cortex causing massive synchronized activity in both presynaptic and postsynaptic local microcircuits (Avoli et al., 1990; Kostopoulos et al., 1981). Thus, during seizures, local recordings of spiking rate and field potentials are closely related, regardless of their relative contributions to neuroimaging signals. In the current study, because discrete field potentials cannot easily be identified or quantified during sustained tonic–clonic seizures, we focused our analyses on the closely related spiking rate, which can be quantified both during seizures and at baseline. In addition, we found that field potentials agreed at least qualitatively with our results. As in prior studies (Meeren et al., 2002), we found that field potentials were present during SWD in the barrel cortex but not in the primary visual cortex, whereas during tonic–clonic seizures, field potential activity was present in both locations (data not shown). We should note that our aim in this study was not to investigate quantitative aspects of neurovascular coupling; rather, our purpose was to determine whether CBF increases or decreases in brain regions involved and spared electrophysiologically during different types of seizures, justifying the use of neuroimaging approaches to study local changes in epilepsy (Lemieux et al., 2001; Richardson, 2002; Zubal et al., 1995).
As we have previously reviewed (Nersesyan et al., 2004), prior studies of CBF and metabolism during SWD have variably reported increases, decreases, or both, possibly due to variations in the spatial and temporal profile of SWD relative to the measurement techniques used. One important aspect of SWD that may lead to variability is the fact that the local neuronal firing rate increases sharply during the spike component of SWD, but during the wave component firing decreases and may even enter a brief silent period with each cycle of the SWD (Avoli et al., 1990; Kostopoulos et al., 1981). Because cerebral metabolic energy requirements and CBF vary on the time-scale of seconds, their changes may depend on the mean neuronal activity level averaged over several cycles of SWD. Many variables may affect whether the spike or wave component predominates in this average, including seizure duration, the individual human subject or animal model being studied, exact seizure syndrome, behavioral state, medications, and many other factors. Thus, it is crucial to directly measure the mean neuronal activity level during SWD to determine how it is related to changes in local CBF during seizures.
In an effort to overcome these confounding factors, we used tissue LDF and multiunit recordings obtained simultaneously in the same microdomain of the rodent cerebral cortex. We recorded from the barrel cortex and primary visual cortex because recent electrophysiology (Meeren et al., 2002) and blood oxygen level–dependent fMRI (Nersesyan et al., 2004) recordings in WAG/Rij rats have shown these regions, respectively, to be intensely involved or spared by SWD (Nersesyan et al., 2003, 2004). Although the spatial sampling of LDF is limited compared with neuroimaging, LDF has the major advantage of allowing simultaneous recordings of neuronal activity and CBF from the same microvascular region and at high time resolution. We found that during SWD in layer 4 of the barrel cortex, the neuronal firing rate increased, and this was followed approximately 2 seconds later by an increase in CBF. The visual cortex was relatively spared by both the increase in neuronal activity and CBF. This finding suggests that the local increase in neuronal activity during SWD is coupled with increased CBF. Interestingly, recent studies of voltage gated sodium channels have shown increased expression of NaV1.1 and NaV1.6 localized to the barrel cortex of WAG/Rij rats (Klein et al., 2004). These changes correlate with seizure frequency, and may provide a physiologic explanation for enhanced excitability and generation of SWD localized to this region.
Our additional finding that whisker stimulation produces larger increases in CBF and v in the barrel cortex than SWD may have several important implications. For example, because experiments done under different conditions contain variable contributions from external sensory inputs or other activity, this may dramatically alter the “baseline” neuronal firing just before SWD. Thus, if CBF and v are less during SWD than during certain stimulated states, this may be another important cause of the variability reported in previous studies of CBF during SWD. Furthermore, reduced activity during SWD compared with normal somatosensory processing may also play an important functional role in the impaired information processing, and impaired consciousness that occurs during absence seizures. We also found that during GTCS, increases in CBF and v were several-fold higher than either SWD or somatosensory processing. Thus, different types of seizures may interfere with normal information flow in the brain via different mechanisms, with some seizures producing greater and others less neuronal activity, either of which may disrupt normal processing (Blumenfeld and Taylor, 2003).
One important clinical application of these results is for the interpretation of neuroimaging studies used for presurgical localization of seizures in patients with epilepsy. Our results confirm that regions of increased neuronal activity colocalize with regions of increased CBF during seizures, whereas regions not involved in seizures do not show CBF increases. In addition, with a lag of a few seconds, CBF increases closely track the time course of increased neuronal firing during seizures. However, the investigations reported here are limited in several ways, and will need to be extended by future studies. For example, although both absence and tonic–clonic seizures exhibit focal features (Blumenfeld, 2003; Blumenfeld et al., 2003; Meeren et al., 2002; Nersesyan et al., 2003), both seizure types studied in this investigation are usually classified as “generalized” (ILAE, 1981). Because epilepsy surgery is usually reserved for localization related epilepsy (Lamoureux and Spencer, 1995; Spencer, 1998), it will be essential to extend these studies to models of localization related epilepsy as well. Another limitation already mentioned is the relatively limited spatial sampling of this method compared to functional neuroimaging. Although this was justified in order to directly study CBF and neuronal activity in tightly colocalized regions, future studies will be needed, including measurement of neuroenergetics with fMRI (Hyder et al., 2001) to obtain more detailed spatial information about CBF and neuronal activity during seizures. It has been recently shown that changes in local neuronal activity (inferred from the spiking rate) and oxidative metabolism (inferred from tissue PO2 measurements), are spatially colocalized at the level of columns during physiologic activation (Thompson et al., 2003). Because fMRI spatial resolution has improved to the level of columns in the rat brain (Kida et al., 2002b; Yang et al., 1996), it may be possible to combine electrophysiology with fMRI in the future, as has been shown recently (Logothetis et al., 2001). Another possible concern is that although we found that the response to whisker stimulation was larger than the response to SWD in the specific region of barrel cortex investigated here, this may not be the case in other regions. It is possible that regions exist where the maximal response to SWD may be greater than the response to whisker stimulation. Nevertheless, our results show that, at least in some regions intensely involved in SWD, increases in neuronal activity and CBF during SWD are not dramatically different from, and can even be smaller than the response to, normal somatosensory processing in the same region.
The CBF measurements reported here were also limited by being relative, and would be greatly strengthened by newer techniques of high-time-resolution absolute CBF measurements (Detre and Wang, 2002; Silva and Kim, 1999). Noninvasive CBF measurements would also overcome potential problems with our probe, which disrupts the blood–brain barrier, allowing humoral factors to possibly influence CBF changes. Our analysis of spiking frequency was restricted to the two or three largest-amplitude spikes recorded with each electrode, although it may be important in future studies to investigate a larger population of neurons, e.g., by analyzing the integrated amplitude of all spikes regardless of amplitude, or by using multielectrode arrays. In addition, although our current studies were confined to the cerebral cortex, prior investigations have shown an important role for subcortical structures such as the thalamus in generating SWD (Avoli et al., 1990; McCormick and Contreras, 2001; Nersesyan et al., 2004; Steriade et al., 1993, 1997), and subcortical structures also clearly participate in both GTCS and normal information processing (Avoli et al., 1990; Browning, 1985; Faingold, 1999; Gale, 1992; Steriade et al., 1997). Our preliminary recordings from the somatosensory thalamus in WAG/Rij rats have shown increases in CBF and neuronal activity during both SWD and GTCS that occur simultaneously with cortical increases (Nersesyan H, 2004, unpublished data). However, some previous neuroimaging studies have found differences between changes in the cortex and thalamus during SWD (Prevett et al., 1995; Salek-Haddadi et al., 2002), making it clear that further investigation of CBF and neuronal activity in subcortical structures is needed.
In conclusion, we found that SWD, GTCS, and normal somatosensory processing all are associated with increases in CBF and neuronal activity in small microdomains of the cerebral cortex. CBF increases occur in regions of increased neuronal activity, but not in regions where neuronal activity is unchanged. Increases in CBF and v are less intense during SWD than during somatosensory processing in these regions, and much less intense than during GTCS. Thus, these three different types of neuronal activity have distinct cerebral energy requirements associated with their distinct cerebral functions in neural information processing.
Footnotes
Acknowledgments:
The authors thank Drs. Hubert Trubel, Natasja Maandag, Koi Anunta, and Bei Wang for assistance in implementing these recordings, Dr. David A. McCormick for advice and guidance with initial electrophysiologic recordings in this model, and Dr. Joshua Brumberg for helpful comments on the manuscript.