
Abstract
Brain capillaries play a crucial role in maintaining cellular viability and thus preventing neurodegeneration. The aim of this study was to characterize the brain capillary morphology at rest and during neural activation based on a big data analysis from three-dimensional microangiography. Neurovascular responses were measured using a genetic calcium sensor expressed in neurons and microangiography with two-photon microscopy, while neural acivity was modulated by stimulation of contralateral whiskers or by a seizure evoked by kainic acid. For whisker stimulation, 84% of the capillary sites showed no detectable diameter change. The remaining 10% and 6% were dilated and constricted, respectively. Significant differences were observed for capillaries in the diameter at rest between the locations of dilation and constriction. Even the seizures resulted in 44% of the capillaries having no detectable change in diameter, while 56% of the capillaries dilated. The extent of dilation was dependent on the diameter at rest. In conclusion, big data analysis on brain capillary morphology has identified at least two types of capillary states: capillaries with diameters that are relatively large at rest and stable over time regardless of neural activity and capillaries whose diameters are relatively small at rest and vary according to neural activity.
Introduction
The brain receives 15% of the cardiac output to cover its expensive energy consumption. 1 The fact that cerebral blood flow (CBF) is directed to the active regions based on neural activity (i.e., neurovascular coupling) allows us to map brain activity noninvasively using haemodynamic neuroimaging techniques.2,3 Regional CBF is mainly regulated by parenchymal arterioles.4,5 However, parenchymal arterioles develop independently of the functional neural unit, 6 suggesting that the capillary level of blood flow control further contributes to neurovascular coupling. 7
Capillaries are the smallest vessels in the body and contain the largest surface area of the blood-tissue interface. 8 This morphologic feature is superior in the efficient exchange of nutrients and wastes with surrounding cells. Our previous study on the living mouse cortex showed that more than 50% of parenchymal vessels are composed of microvessels, including capillaries with diameters smaller than the size of the red blood cells. 9 In response to increased neural activity, nearby capillaries dilate and recruit fresh arterial blood from upstream to active sites. 10 Accumulating evidence indicates that capillaries are an active part of neurovascular coupling.11–14 Conversely, age-dependent capillary dysfunction, including decreased capillary density, contributes to a decrease in CBF in older people, leading to cognitive impairment.15–19 Acute normalization of capillary perfusion is thus crucial for the viability of brain cells after cerebral ischaemia and haemorrhage.20–22 The preclinical studies have consistently shown that well-developed capillary networks and balanced capillary perfusion are essential for preventing neurodegeneration and maintaining brain function.
While much attention has been given to understanding the functional role of brain capillaries in vivo, the stability of the brain capillaries at rest and their impact on the response to neural activity are not well understood. This is due in part to the lack of sophisticated software to quantify the small changes in capillary morphology from a large-volume image of 3D microscopic angiography in preclinical studies. In this study, we characterized the variability of brain capillary morphology at rest and during neural activation with MATLAB-based software and big data analysis of 3D microangiography. 9 Using double-transgenic mice expressing genetically encoded calcium ion sensors (GCaMP) in cortical neurons (Cre-CaMKII), neural activity and microvasculature around activated neurons were imaged simultaneously with two-photon microscopy. Repeated 3D imaging (i.e., an XYZ scan) was performed at layers II/III in the somatosensory barrel cortex, while gradual changes in neural activity were induced by mechanical stimulation of contralateral whiskers with variable frequencies (1–8 Hz) or by a seizure caused by kainic acid (a cyclic analogue of L-glutamate and an agonist of ionotropic kainic acid receptors 23 ). Trial-to-trial changes in capillary diameter were determined along the centreline of the vessel in the 3D reconstructed image, 9 resulting in big data (3000–5000 points per trial) that were used to estimate the probability distribution of the capillary responses to variable neural activations.
Material and methods
Animal preparations
The use of animals and experimental protocols were approved by the Animal Ethics Committee of the National Institute of Radiological Sciences and the University of Electro-Communications. All experimental procedures complied with the guidelines established by the Institute for the Humane Care and Use of Laboratory Animals according to ARRIVE guidelines (i.e., ARRIVE Essential 10). 24 A total of 12 adult male double-transgenic mice (18–34 g; Cre-CaMKII/GCaMP3: B6;129S-Gt(ROSA)26Sor<tm38(CAG-GCaMP3)Hze>/J, No. 014538, The Jackson Laboratory, Sacramento, CA) in which the cortical neurons (a CaMKII promoter) expressed the genetically encoded calcium indicator (GCaMP3) 25 were used for the experiments.
The animals were anaesthetized with isoflurane (3% for induction and 1.7–2.1% for surgery) in an ambient air mixture (100–300 mL/min) using a mask and kept warm with a heating pad (37°C). Part of the animal’s skull (3–4 mm in diameter) above the left somatosensory barrel cortex was removed and sealed with a cover glass with a custom-made animal head holder for two-photon microscopy. 26 After the surgery, the animals were allowed to recover and were housed in a normal cage (a 12-hour light/dark cycle; two to five animals in each cage) with free access to food and water. The imaging experiments started at least two weeks after the day of the surgery.
Two-photon microscopy
The head of the animal was fixed with a custom holder on a microscope stage, where the animal was allowed to move freely on a floating ball of styrene foam. 26 Prior to the initiation of imaging experiments, animals were allowed to acclimatize to the experimental apparatus. 5 At the beginning of the imaging session, the response areas in the measured cortex that showed robust calcium signal changes due to the contralateral side of whisker deflection (10 Hz for five sec) were determined using fluorescent imaging of neuronal GCaMP signals (excitation and detection at 488 nm and 500–550 nm, respectively) with a confocal laser scanning microscope (TCS-SP5MP, Leica Microsystems, GmbH, Wetzlar, Germany). Then, 0.1 mL sulforhodamine 101 (SR101; 10 mM in saline, Sigma–Aldrich, St. Louis, Missouri, USA) was injected intraperitoneally to label blood plasma. 27 A two-photon laser scanning fluorescence microscope (TCS-SP5MP) equipped with a Ti:sapphire laser (MaiTai HP, Spectra-Physics, Inc, Santa Clara, California, USA) was used to capture XYZ images of neural calcium activity and microvasculature simultaneously in the activation foci of the somatosensory barrel cortex (Figure 1(a) & Supplementary Fig. S1). The excitation laser (910 nm with a mean power of 1.8 W) was delivered through a 20× objective lens (NA = 1.0, water immersion, Leica Microsystems), and the emission signal was measured with two photomultipliers through 500–550 nm and 573–648 nm bandpass filters for GCaMP and SR101, respectively.
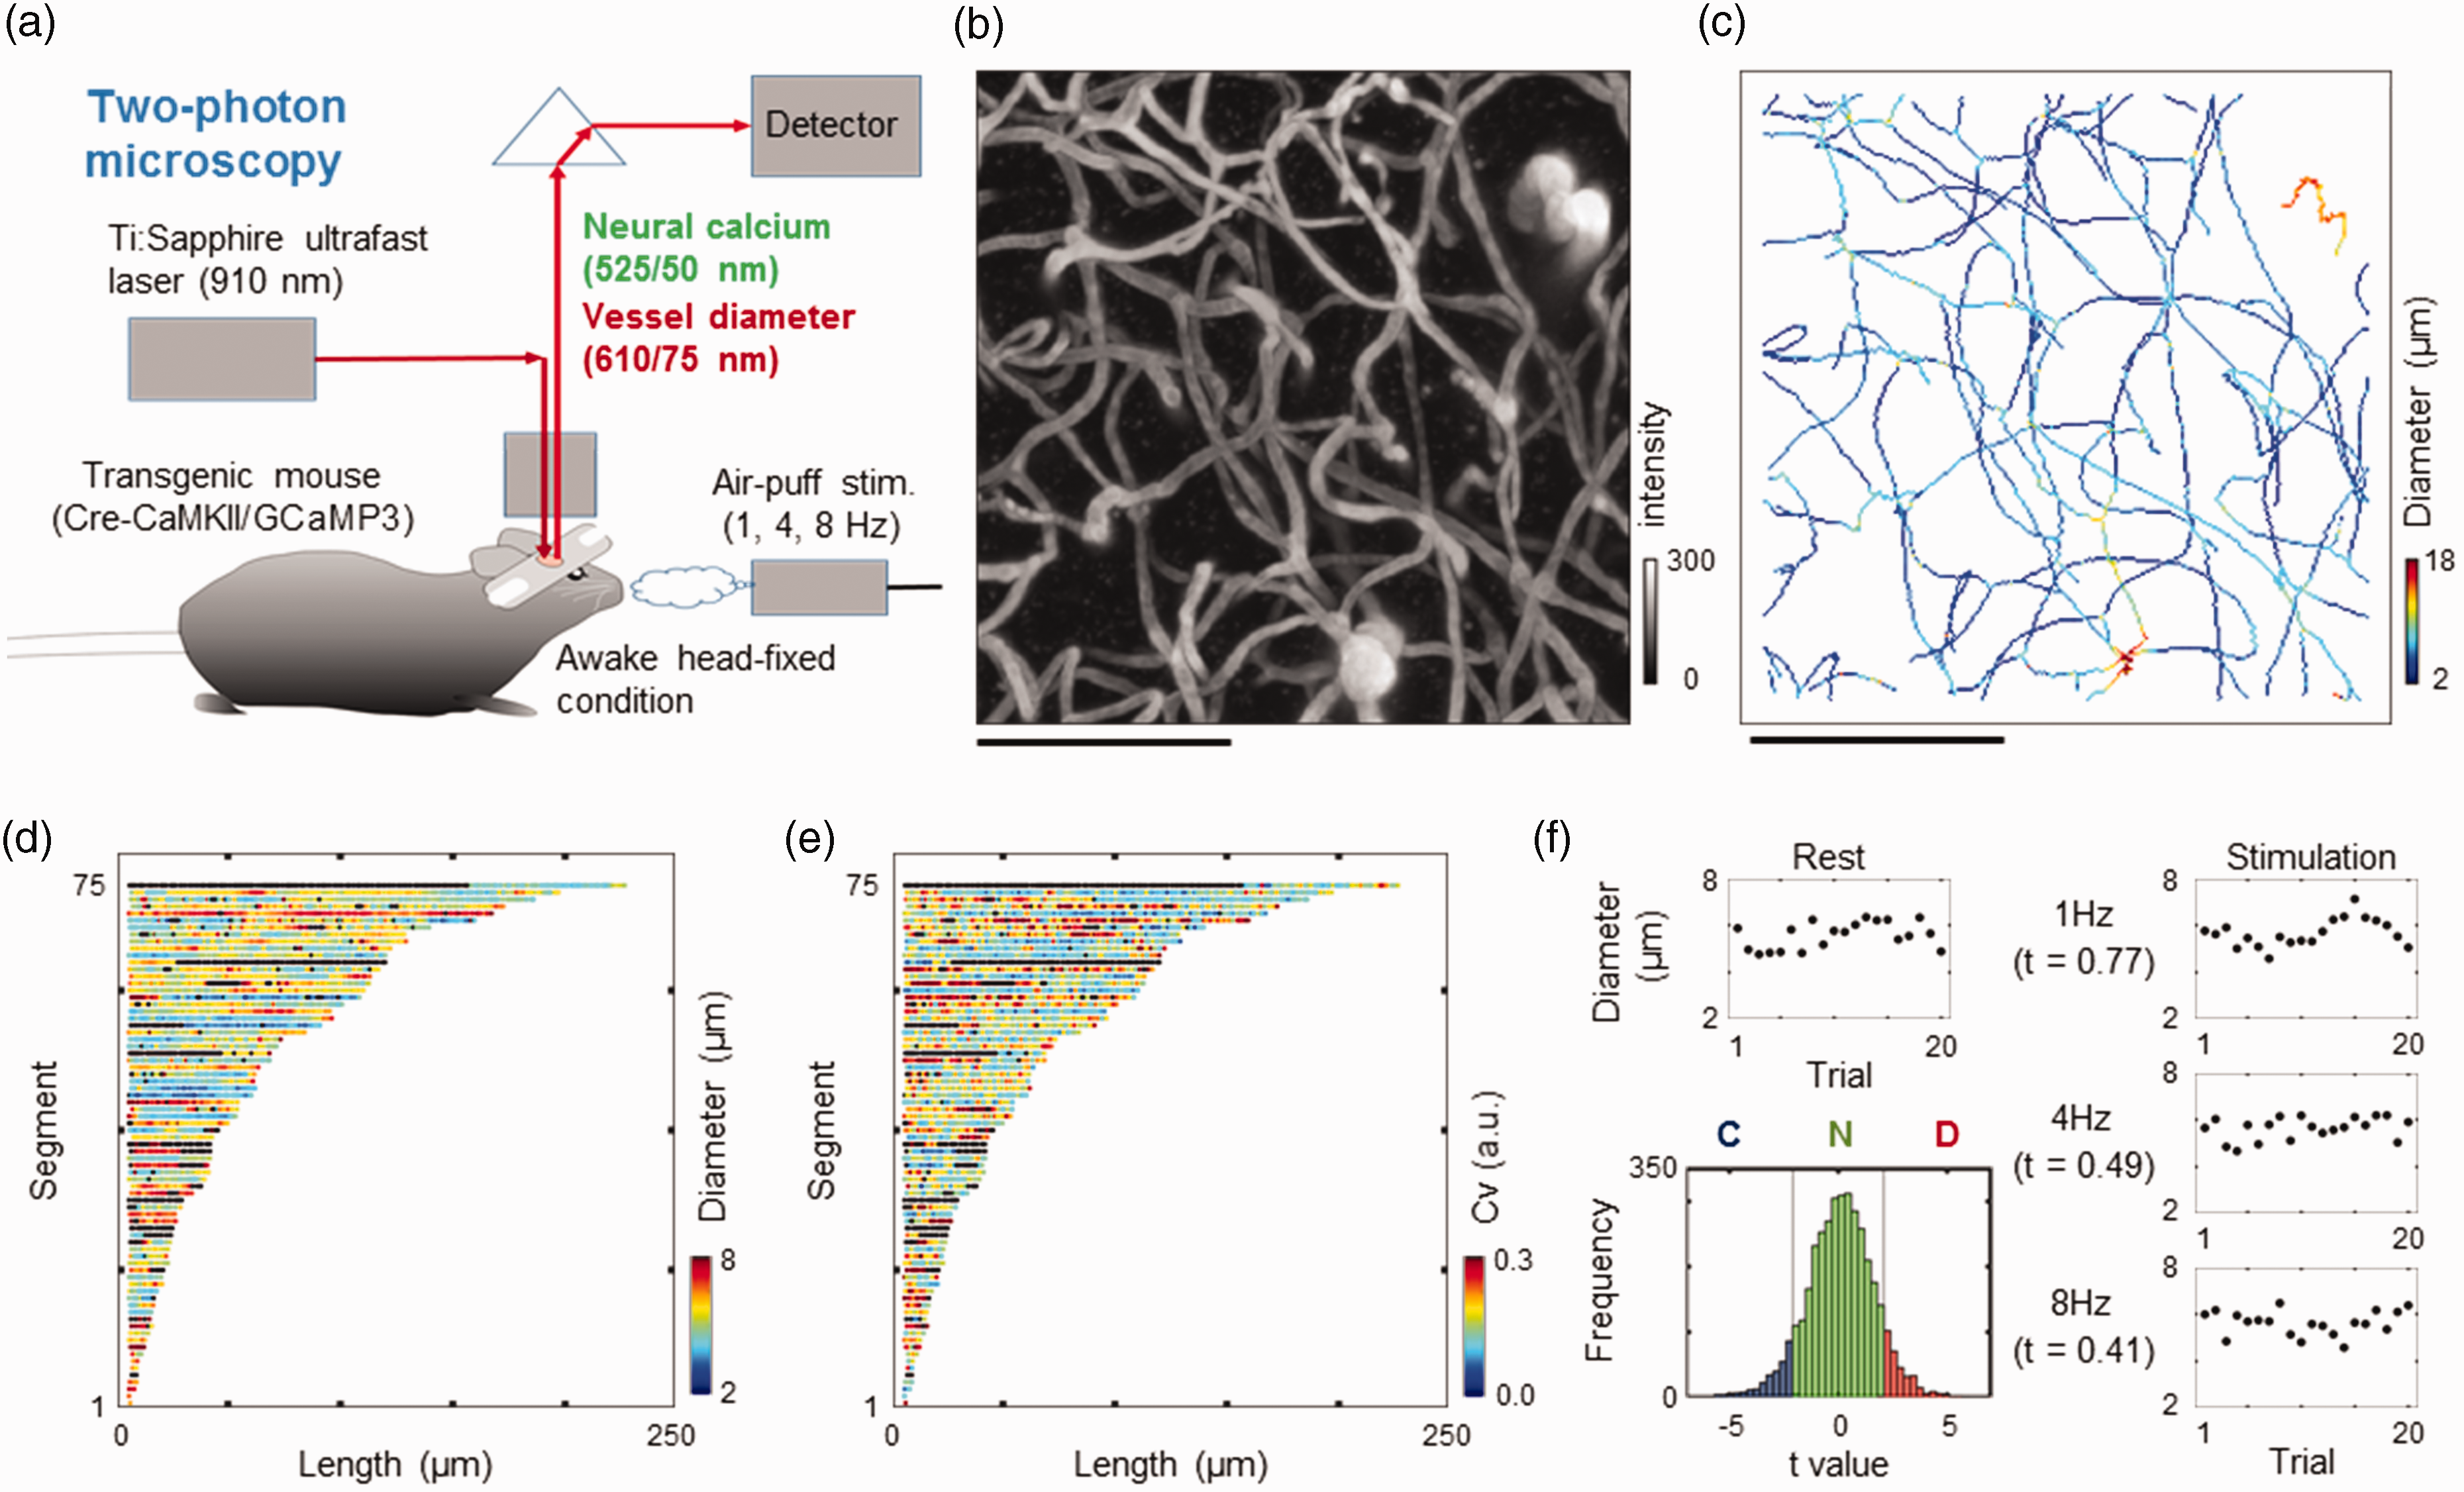
Image acquisition and analysis. (a) Schematic view of simultaneous recordings of neural activity and vascular responses to whisker stimulation in the somatosensory barrel cortex of awake mice. Neural activity was measured through a calcium imaging technique, in which transgenic mice expressed a genetically encoded calcium sensor (GCaMP3) in the cortical neurons (Cre-CaMKII). Air-puff stimulation at varying frequencies (1, 4, and 8 Hz) was applied to the contralateral side of the whiskers, while simultaneous imaging of neurovascular responses was conducted with two-photon microscopy. (b) Two-photon microscopy image representing the 3D structure of the microvessels. A maximum intensity projection image was produced for depths between 100 and 300 μm from the cortical surface. Scale bar: 100 μm. (c) A colour map of vessel diameters (measured from an image b). A total of 6711 pixels were obtained along the vessel centreline. The measured diameter is represented in colour over 2 (blue) to 18 (red) μm. Scale bar: 100 μm. (d) Comparison of capillary diameters with lengths of the capillary segments. The capillary segments that had two branches on both edges were automatically extracted (75 capillary segments, n = 2774 pixels) from image b. The length was the distance from one branch to another along the centreline of the vessel, excluding areas less than 6 μm from the junction point. The measured segment was ordered by length (short to long). The colour represents the mean diameter at rest. Black indicates “NaN” (failed to measure). (e) Capillary lengths versus resting diameter fluctuations. The colour represents coefficients of variance (Cv) of resting trials. Black indicates “NaN” (failed to measure) and (f) Classification of capillary responses. The diameter data were pooled for each state of rest and three frequency stimulations. Student’s t values were then calculated for all stimulation data against the resting diameters and empirically classified into three groups (see text): constriction (C), no change (N), and dilation (D). The histogram represents the distribution of the t values for the rest versus 8 Hz stimulation conditions (n = 4803 pixels). Trial-to-trial variations in the capillary diameters are represented at rest (left) and during stimulation (right). The corresponding t values were 0.77, 0.49, and 0.41 for 1-, 4-, and 8-Hz stimulation, respectively (top to bottom, right).
First, a high-resolution image (1024 × 1024 × 255 pixels) was taken with a field of view of 258 × 258 µm (an in-plane resolution of 0.25 µm/pixel) over depths of 100–300 µm (cortical layers II/III) with a step size of 0.79 µm/step for anatomical reference. Then, a functional image (256 × 256 × 128 pixels) was collected at the same location with an in-plane resolution of 1.0 µm/pixel and a step size of 1.58 µm/step. In each XYZ acquisition, imaging was started from the deepest plane (300 µm) with a rate of approximately 0.2 seconds per image (i.e., 26 seconds for a single XYZ acquisition). The onset of the image acquisition and the induction of whisker stimulation were controlled with a TTL signal generated by a pulse generator (Master-8, A.M.P.I., Jerusalem, Israel) to randomize the time delay of the image acquisition behind the whisker stimulation. The image acquisition followed three to five seconds after the onset of whisker stimulation. During each time period of brain activation, relatively stable diameters were maintained. If a large image distortion was observed in association with the animal’s motion, the scanning of the image was interrupted until the animal was stabilized. A total of 80 or 33–57 sets of XYZ scans were performed for functional or kainic acid treatment experiments, respectively. Approximately every hour, the animal received drinking water to prevent dehydration during imaging experiments. Before and after the imaging sessions, the animal’s physiological conditions (heart rate, respiration rate and arterial oxygen saturation level) were monitored using a pulse oximeter (Mouse Ox Plus; STARR Life Sciences Corp., Oakmont, PA).
Stimulation
A puff of air was delivered using a picopump (PV830, World Precision Instruments, Sarasota, Florida, USA) with a rectangular pulse (50-ms pulse width at 15 psi) for 30 seconds to the animal’s whiskers (N = 6 animals) on the right side of the face at variable frequencies (1, 4, 8 Hz), based on a previous study. 26 For each stimulation condition, a total of 20 trials were recorded with randomized orders of different stimulation frequencies, including no stimulation condition (i.e., a total of 80 trials including 20 trials at rest). In each trial, XYZ imaging with 128 XY images over depths of 100–300 µm was performed. The time interval between trials (i.e., image acquisition for the XYZ image) was more than 30 seconds. For the kainic acid treatment experiments, kainic acid (20 mM in saline, 15 mg/kg) was injected intraperitoneally into the animal (N = 6 animals). Two animals were excluded because of seizure-related complications and image distortions. The repeated XYZ scan with or without whisker stimulation at 4 Hz for 30 seconds was carried out randomly up to 200 minutes after the injection of kainic acid (N = 4).
Image analysis
Custom code written in MATLAB software (Mathworks, Inc., Natick, MA, USA) was used for all image analysis procedures (software available upon request to the author). The neural calcium response was quantified using XYZ images for GCaMP signals. The pixel resolution of all anatomical and functional XYZ images was first rescaled to an isotropic resolution of 0.79 µm/pixel (i.e., 326 × 326 × 255 pixels) using bicubic interpolation and spline interpolation processing. To improve the signal-to-noise ratio, a median filter with a kernel size of three by three pixels was applied, and a Gaussian low-pass filter with a kernel size of seven by seven pixels and σ = 1.8 pixels was further applied to enhance the neural signals. A Gaussian low-pass filter with a kernel size of 150 × 150 pixels and σ = 75 pixels was also applied to all images to adjust the brightness distortion in the image. The pixel intensity was then normalized to the mean intensity of all frames in each pixel to correct pixel intensity inhomogeneity caused by region-dependent optical scattering and absorption.
Next, a 3D Gaussian filter with a kernel size of 55 × 55 × 135 pixels with σ = two by two by five pixels was applied to smooth the signal-to-noise ratio over the depths. A binarization process was performed for GCaMP images by applying a threshold (approximately 99% of the peak intensity). A morphological filter was applied to extract the cell body (the object consisting of more than 10 voxels), and the closing process (a disc shaped with radius three pixels) was applied to the binary image. Finally, the center of gravity of the extracted cell body was determined in each XYZ image, and the same cell was identified for all trials if the distance from the center of gravity was within 12 µm across the images captured at different time points.
A location of the extracted positive GCaMP cell bodies was identified on the anatomic image (a high-resolution reference image). In this process, we used both the raw anatomy image and the image whose pixel intensity was inverted in black and white (an inverse image) because most of the cell bodies in the anatomical image appeared to have lower intensity (i.e., inactive at rest) than those in the background intensities. Binarization processing was applied based on the signal-noise ratio (SNR) in the GCaMP anatomical image (a threshold at 80% of SNR) and the inverse image (a threshold at 50% of SNR). The cell body was automatically extracted using either anatomical or inverse images. The signal intensity was the average of the highest 5% of pixels, and the background noise was the mean of the remaining pixels. The opening process (a disc shape with a radius of four pixels) was applied to remove small objects, and the centre of gravity of each object was determined in the 3D reconstructed image. Referring to a 3D coordinate of the cell locations, the cell closest to the center of gravity of the GCaMP-positive cell in the functional image was identified and counted in each XYZ scan. The total number of active neurons was calculated in each trial and normalized with the sum of all activated neurons over trials for functional activation.
Vascular images were analyzed using SR101 signal images. First, the spatial inhomogeneity of signal intensity in the SR101 image was normalized by using the same weighting factor applied to the GCaMP image. Then, a median filter with a kernel size of five by five pixels and a 3D Gaussian low-pass filter with a kernel size of 169 × 169 × 135 pixels and σ = 6.7 × 6.7 × 5.4 pixels were applied to suppress shot noise and smooth pixel intensities. Next, the pixel resolution was resized to 256 × 256 × 128 pixels, and binarization processing was performed by applying a cut-off threshold of 30–50% of the signal-to-noise ratio in each image. Signal intensity was an average value of 5% of the highest intensity pixels in the image, and noise intensity was a mode value of pixel intensities in the image. Opening and closing processes (disc shapes with radii of one and two pixels, respectively) were applied to fill the unlabelled blood cell spaces inside the vessel area. After binarization processing, a vessel centerline was automatically extracted using a 3D thinning function. In this process, a manual inspection with the raw image was carried out. A single vessel segment (divided at 6 µm from the junction point in both edges) was defined as the vessel connecting to two junction points on both edges, excluding those segments that had an end point at the edge of the imaging field. The segments were also classified into three groups: short (<30 µm), middle (31–100 µm), and long (>100 µm) segments.
Diameter measurements
The vessel diameter was measured along the centerline of the vessel (Figures 1(b) and (c)). In each functional image, a cross-correlation of the vascular images with the anatomical image was calculated in a two-dimensional plane, and image displacement was corrected to maximize the correlation between these images. In addition, the depth showing the maximum overlap for those vessel areas was identified within 10 slices from the original depth for each XY slice of the functional images. To further align the local distortion of the vasculature, a cubic region with a length of 25 µm on one side was extracted around the center of the measuring point, and a cross-correlation of the pixel intensities between each image and the anatomic image was calculated for all functional images. The location showing the largest correlation with the anatomical image was used to correct local motions of the vasculature. In each trial, the pixel location with poor SNR was excluded from the subsequent diameter measurement (i.e., assigned as “NaN”).
The diameter was the minimum distance between the measurement point on the centerline of the vessel and the two edges of the labelled blood plasma widths. 9 In this analysis, the measurement site identified on the anatomical image with a mean diameter less than 8 µm was considered a capillary (Figure 1(d)). Resting diameter fluctuations were quantified by dividing the standard deviation value by the mean of the vessel diameters (i.e., coefficient of variance; Cv) measured at rest (Figure 1(e)). For activation trials, the probability distribution of the capillary responses (dilation, no-change, and constriction) was quantified. In these analyses, a pixel location where the diameter measurement failed (i.e., a “NaN” value) on over 50% of the trials was excluded. To classify the capillary responses, t values were calculated to compare measured diameters to resting states (without stimulation) and to each activation condition (whisker deflection or kainic acid treatment). If the measuring location showed a t value greater than 2.09 for activation states, it was considered to be a “dilation”, whereas if the location showed a t value less than −2.09, it was considered a “constriction” (Figure 1(f)). The reminder was regarded as “no change”.
Statistical analysis
Data are represented as the mean ± standard deviation or median values with [first to third quartiles] according to the normality of the data. The normality of the data was evaluated using the Lilliefors test (lillietest in the MATLAB code), and the null hypothesis was discarded at the 5% significance level. For correlation analysis, Spearman’s correlation (Rho) or Pearson's correlation (R) were used. For statistical tests, Student’s t test or the Wilcoxon signed-rank test for two-group comparisons and the Steel-Dwass test, the Steel test or Dunnett’s test for multiple-group comparisons were used (p < 0.05). Data presented and software used were available upon reasonable request to the author.
Results
Global changes in capillary diameters did not follow the trial-by-trial neural activity for functional activation
Resting GCaMP activity was sparse, and only a few neurons (2.4 ± 1.9 × 100 cells/mm3/trial, N = 6) occasionally showed fluorescent signals (Figure 2(a)). With the increased frequency of whisker stimulation, a corresponding increase in activity was observed (Figure 2(b)); 3.9% ± 1.5%, 5.0% ± 1.9% and 6.4% ± 3.5% for stimulation frequencies of 1, 4 and 8 Hz, respectively (N = 6). GCaMP activity significantly increased (P < 0.05, Steel test) for 4 Hz and 8 Hz stimuli compared to the resting activity (2.3% ± 1.0%). The trial-to-trial variations in GCaMP activity were then sorted and normalized by the maximum activity through all trials so that the neural responses gradually changed over trials (Figure 2(b)). This was used to check whether the neurovascular coupling in the capillaries (<8 µm in diameter) responds to trial-to-trial variations in neural activity (Figure 2(c)). However, the capillary diameters (the median value of all measured capillaries) did not consistently follow the trial-to-trial neural activity (Rho = −0.22 to 0.42, N = 6, Figure 2(d)). This may be explained by the fact that some capillaries were dilating and others were constricting, which resulted in the cancellation of these responses. Therefore, a more detailed classification of the fractional capillary responses was carried out.
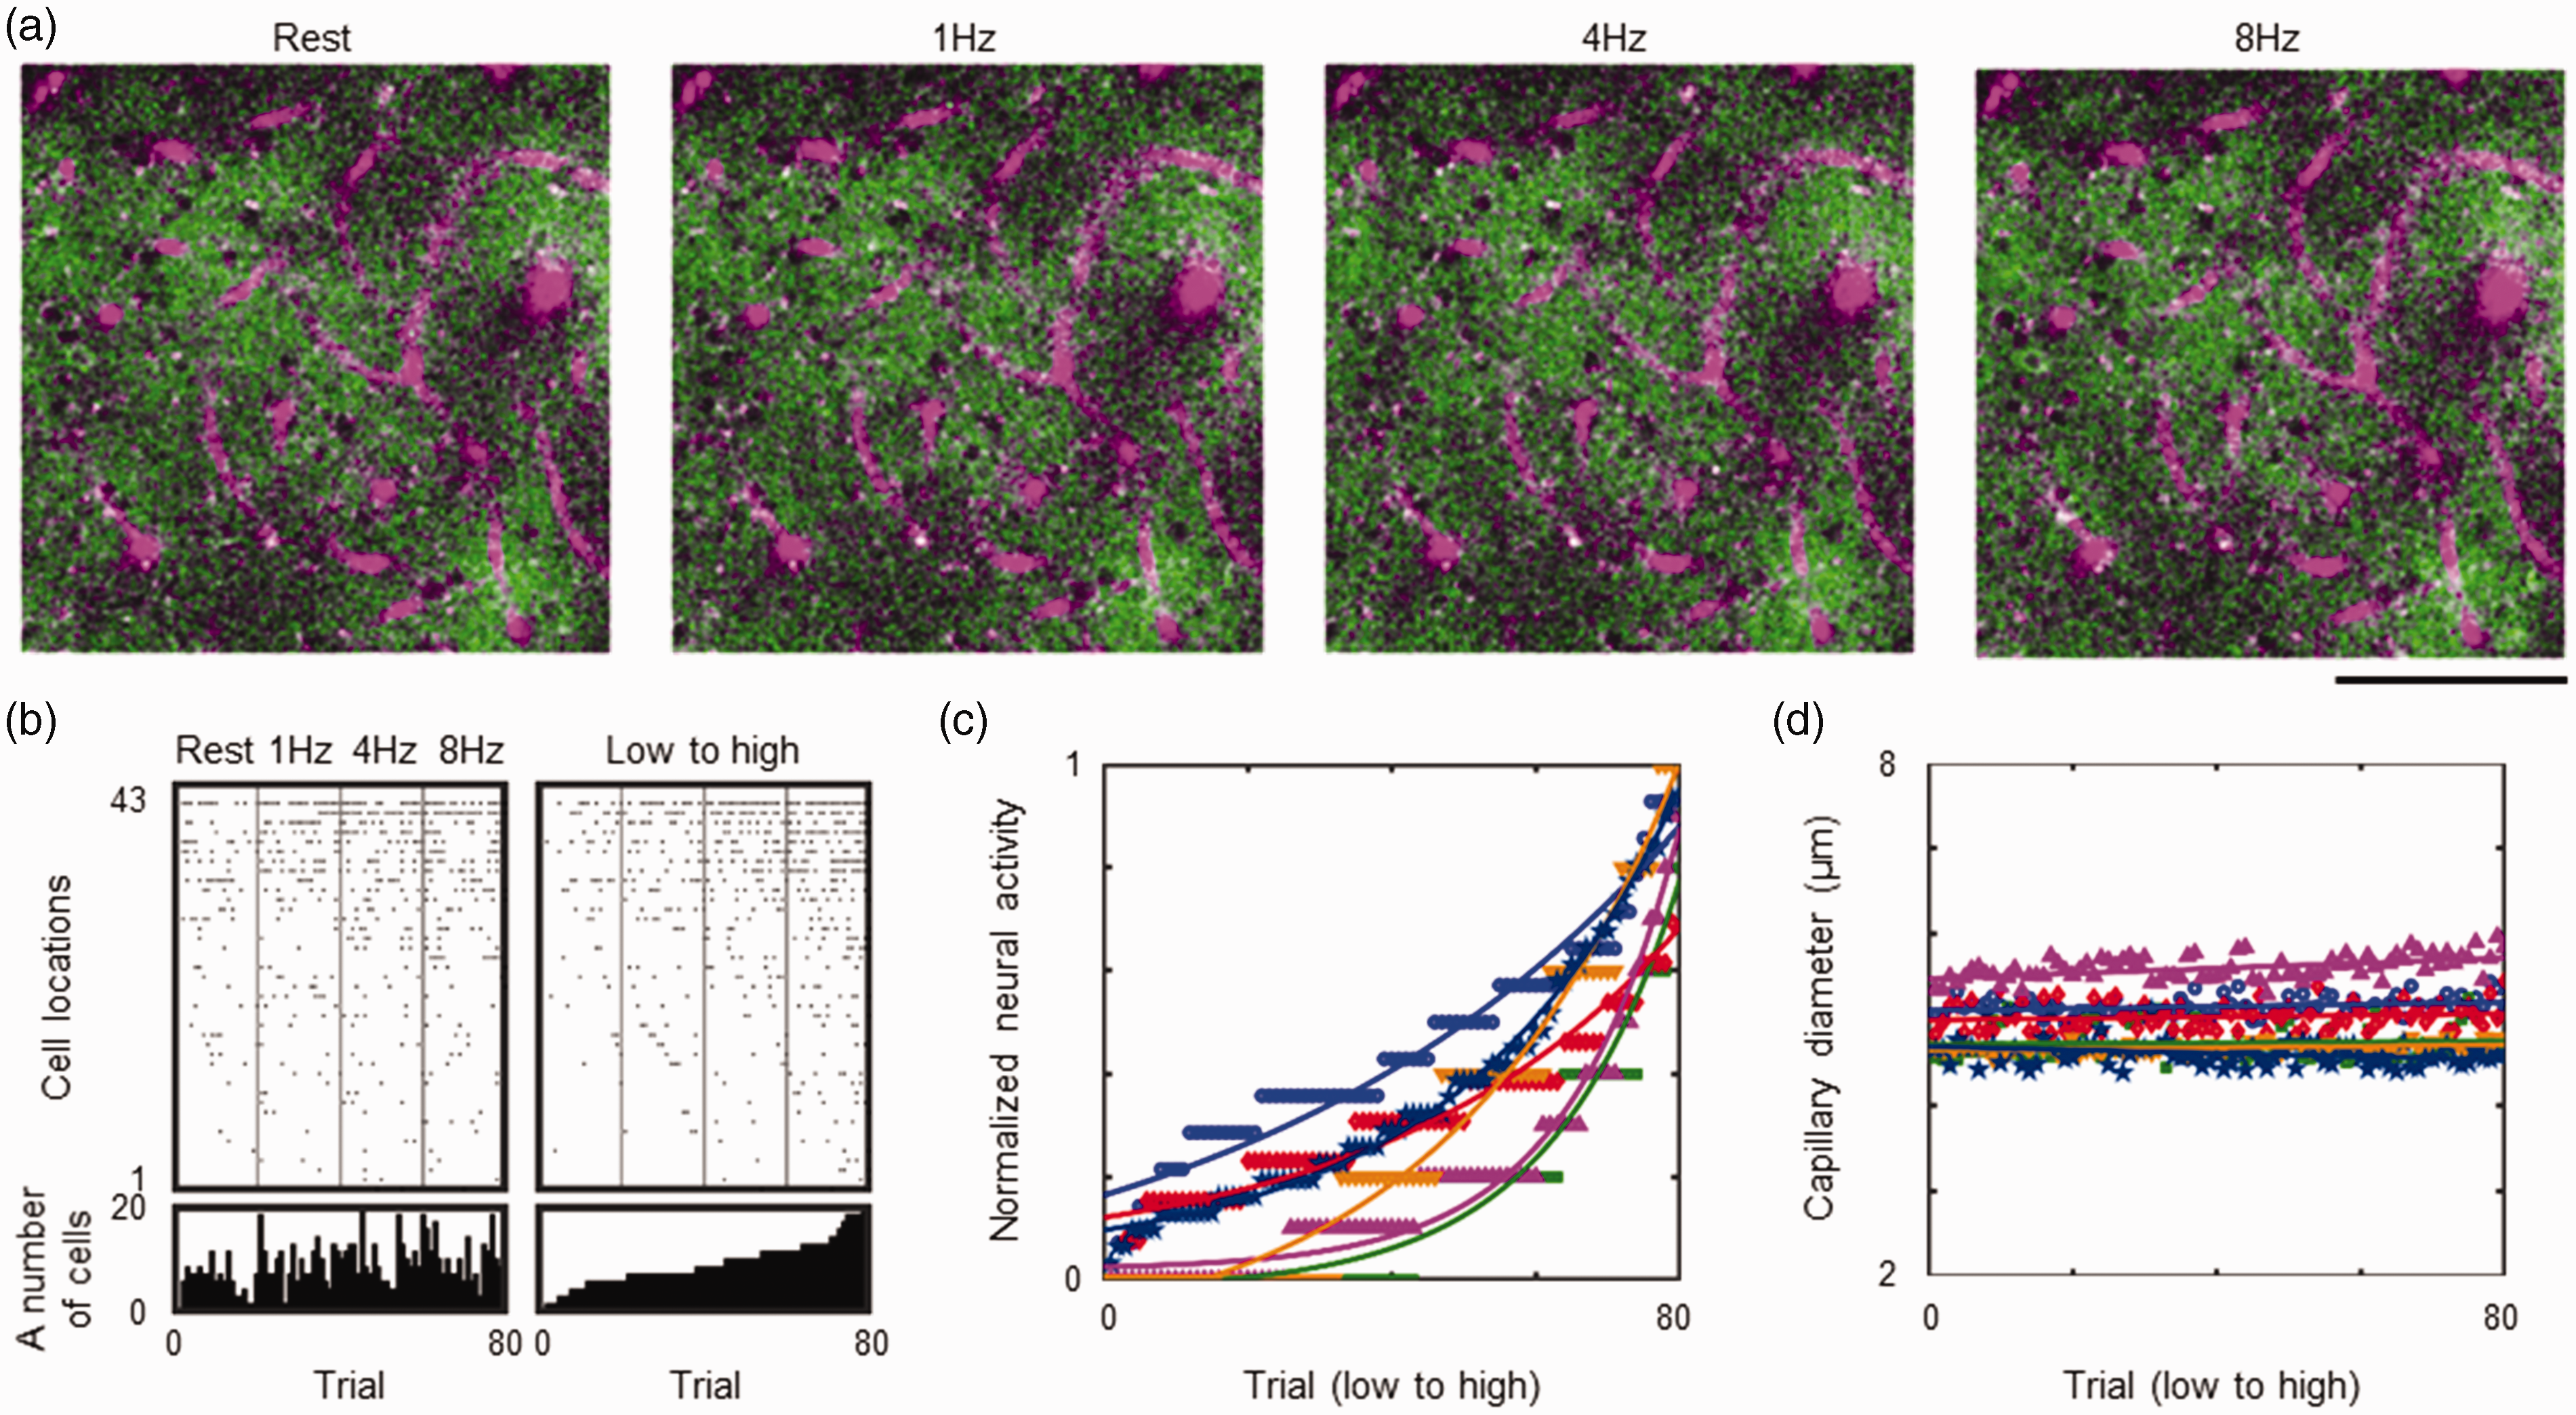
Simultaneous imaging of neurovascular responses to whisker stimulation. (a) Representative images of GCaMP neurons (green) and blood plasma labelled with SR101 (magenta). A single slice image captured at the same location (a depth of 115 μm from the cortical surface) was compared for resting state (no stimulation) and activation conditions with 1, 4, 8 Hz stimulation (left to right). Scale bar: 100 μm. (b). Raster plot for GCaMP responses. The activated cells were identified at each XYZ scan trial (one to eighty trials; x-axis), and the number of active cells (y-axis) was counted in each trial (left). The measured GCaMP activity was sorted across all trials (right). (c) Comparisons of GCaMP activities over the course of the experiments for six animals. The order of the imaging trials (x-axis) was sorted by the number of activated cells, and the number was normalized to the maximum number of each animal (different colours indicate different animals) and (d) Corresponding capillary diameter responses. The order of the imaging trials (x-axis) corresponds to the one shown in c. It should be noted that there were no consistent increases in the capillary diameters despite a monotonic increase in neural activities, as shown in c (colours identifying animals are the same as in c).
Capillary dilation and constriction occurred locally in capillaries with relatively small and large resting diameters, respectively
The measured capillary sites were first classified into three groups: dilatation, constriction and no change. Representative animal data (n = 3778 pixel locations) showed both fractional dilatation (n = 441, 427 and 334 locations) and constriction (n = 270, 242 and 299 locations) in response to stimulation with frequencies of 1, 4 and 8 Hz, respectively (Figure 3(a)). Comparisons between different response sites showed that the capillary diameters changed oppositely from 4.8, 4.9 and 4.8 µm at rest to 5.2, 5.3 and 5.3 µm for dilation sites (for 1, 4 and 8 Hz frequencies, respectively) and from 5.5, 5.3 and 5.5 µm to 5.1, 4.8 and 5.0 µm for constriction sites, respectively (Figure 3(b)). No detectable change (mean of 5.1 µm at rest and all stimulation conditions) was evident in the remaining locations. These variations in the response were consistently observed for all six animals. Namely, the dilation sites had relatively small resting diameters (4.6 ± 0.3 µm, N = 6), whereas the constriction sites had larger resting diameters (5.2 ± 0.5 µm, Figure 3(c)). The differences in the resting diameters between these locations were statistically significant (P < 0.05, Steel-Dwass test).
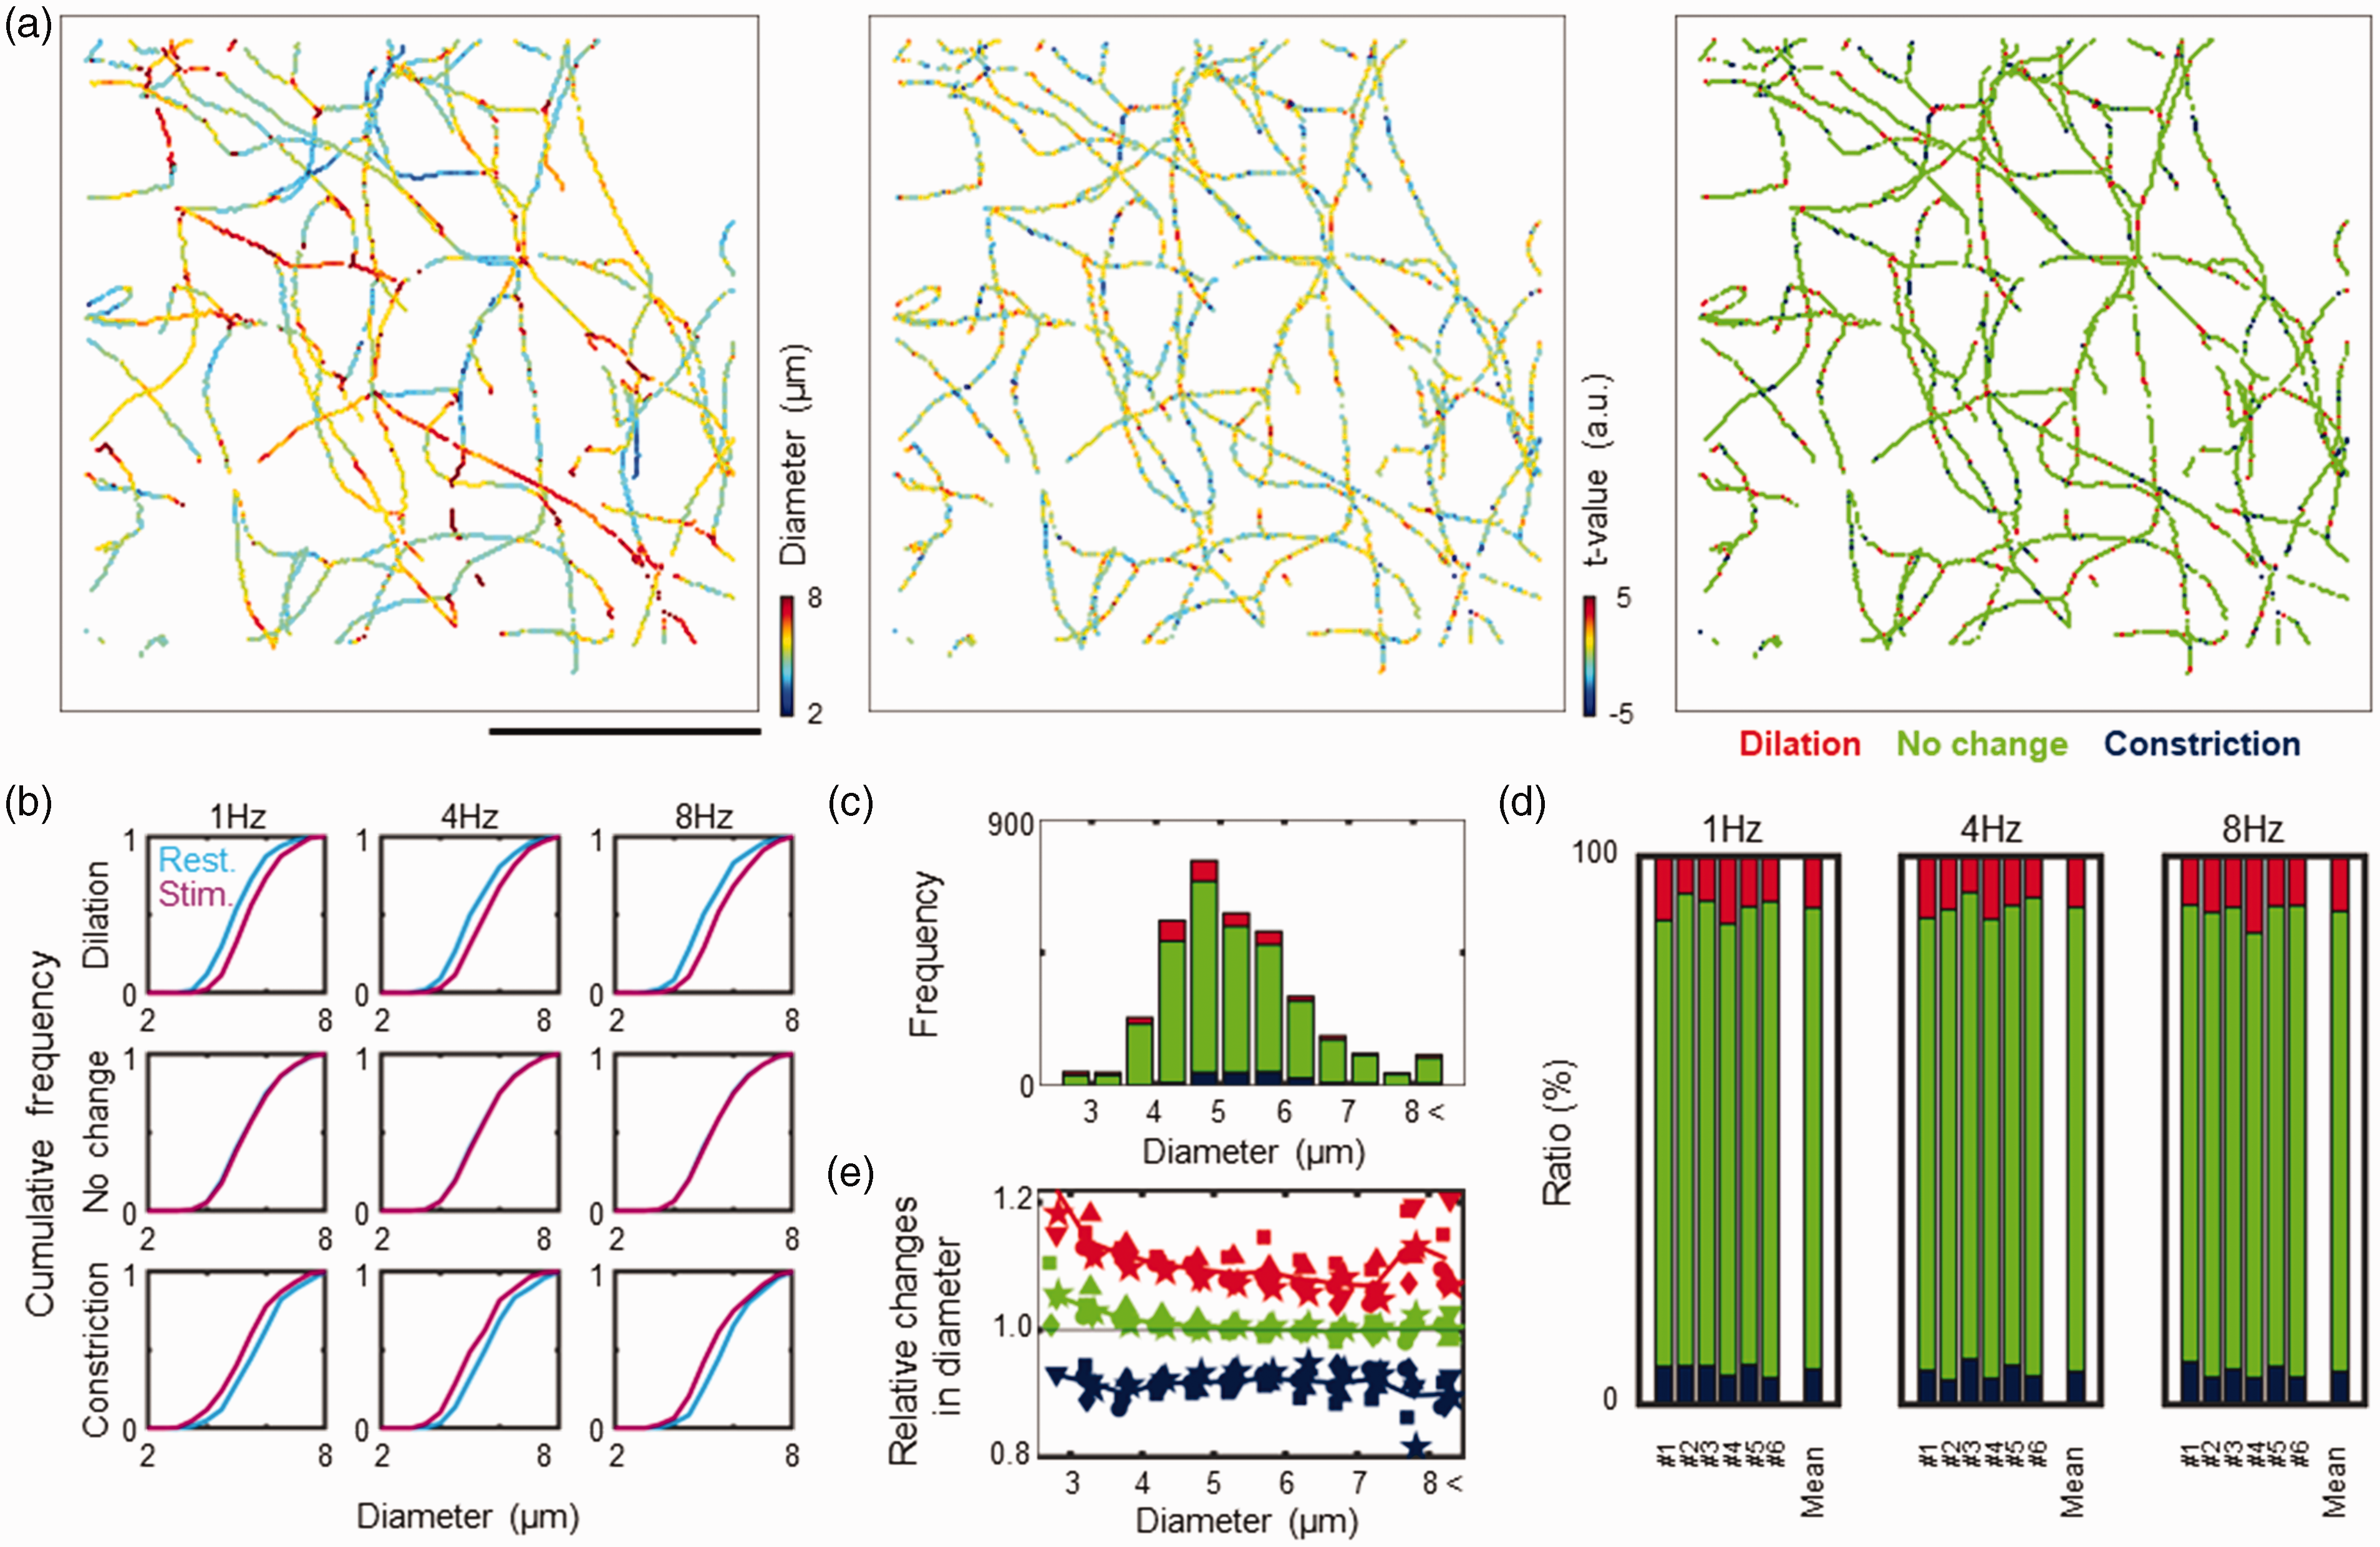
Comparison of capillary diameters between locations of dilation, no change and constriction. (a) Representative maps of measured capillary diameters (left), t values (middle) and probability distribution for capillary response to stimulation (right). The capillaries (<8 μm in diameter, n = 3779 pixels) were extracted from the reconstructed image shown in Figure 1(b). Colour indicates the mean diameter at rest (left) and t values calculated for rest versus 8-Hz stimulation (middle). The response probability (right) showed dilation (red), no changes (green), and constriction (blue). Scale bar: 100 μm. (b) Normalized cumulative histogram for comparisons of mean capillary diameters at rest (cyan) and in response to stimulation (magenta) in this representative animal (shown in a). Locations with dilated responses to stimulation (median values of 5.2–5.3 μm, n = 334–441 pixels) had relatively smaller resting diameters (4.8–4.9 μm, upper), while locations with constrictions (4.8–5.1 μm, n = 242–299 pixels) had larger resting diameters (5.3–5.5 μm, lower). There was no apparent difference in diameter at locations with no change (∼5.1 μm, n = 3068–3146 pixels, middle). Consistent results were observed for three stimulation conditions (1 to 8 Hz, left to right). (c) Histogram of resting diameters and responses to stimulation (8 Hz in a representative animal). Colours indicate the number of locations with dilation (red), no change (green), and constriction (blue). (d) Comparison of the probability distribution for dilatory (red), unchanged (green) and constrictive (blue) responses in three stimulation conditions (1 to 8 Hz, left to right). Consistent results were observed in all 6 animals (#1 to #6). (e) Comparison of relative changes in diameters for 8 Hz stimulation versus at rest. Note that capillaries with small resting diameters showed larger dilations (red), while constriction (blue) occurred independently of the resting diameters. No detectable change in diameters was evident at locations where no change was observed (green).
The probability distribution of capillary responses consistently showed that dilation occurred at 10.1% ± 1.6% (N = 6) of all measurement sites, whereas constriction occurred at 6.1% ± 1.0% of sites (Figure 3(d)). The remaining locations (i.e., 83.8% ± 1.6%) showed no detectable changes (Figure 3(d)). For dilatory responses, capillaries with smaller resting diameters were more dilated, while relative changes in diameters were constant for constriction independent of resting diameters (Figure 3(e)). As a result, the capillary responses produced a net increase in volumes; 1.0% ± 1.0%, 1.2% ± 0.9% and 1.6% ± 0.6% for 1, 4 and 8 Hz frequencies of stimulation, respectively. However, statistical significances were not detected for the changes in volumes relative to the resting conditions (P > 0.05, Steel test, N = 6).
Fluctuations in the resting capillary diameter and diameter responses were independent of capillary segment length
The capillary responses were then compared for the length of the capillary segment because short or long capillaries may play different roles. The junction points were identified in a 3D reconstructed image, and the capillary segments were extracted (Figure 4(a)). In accordance with the above results, the majority of capillaries showed no change in response to stimulation, and capillary sites of dilatation or constriction were randomly distributed along the segments (Figure 4(b)). Negative correlation was observed between the segment diameter and length (Rho =−0.18 to −0.44, n = 55 to 130 segments in each animal), but was not statistically significant in all six animals. Comparison between groups (i.e., short, medium and long segments) showed no significant differences in segment diameters (6.0 ± 0.5 µm, 5.2 ± 0.3 µm and 4.9 ± 0.5 µm) and Cv (0.21 ± 0.03, 0.19 ± 0.03 and 0.18 ± 0.04) over short, medium and long segments, respectively (N = 6, Figure 4(c)). Moreover, the probability distribution for capillary response was identical regardless of the segment length (Figure 4(d)).
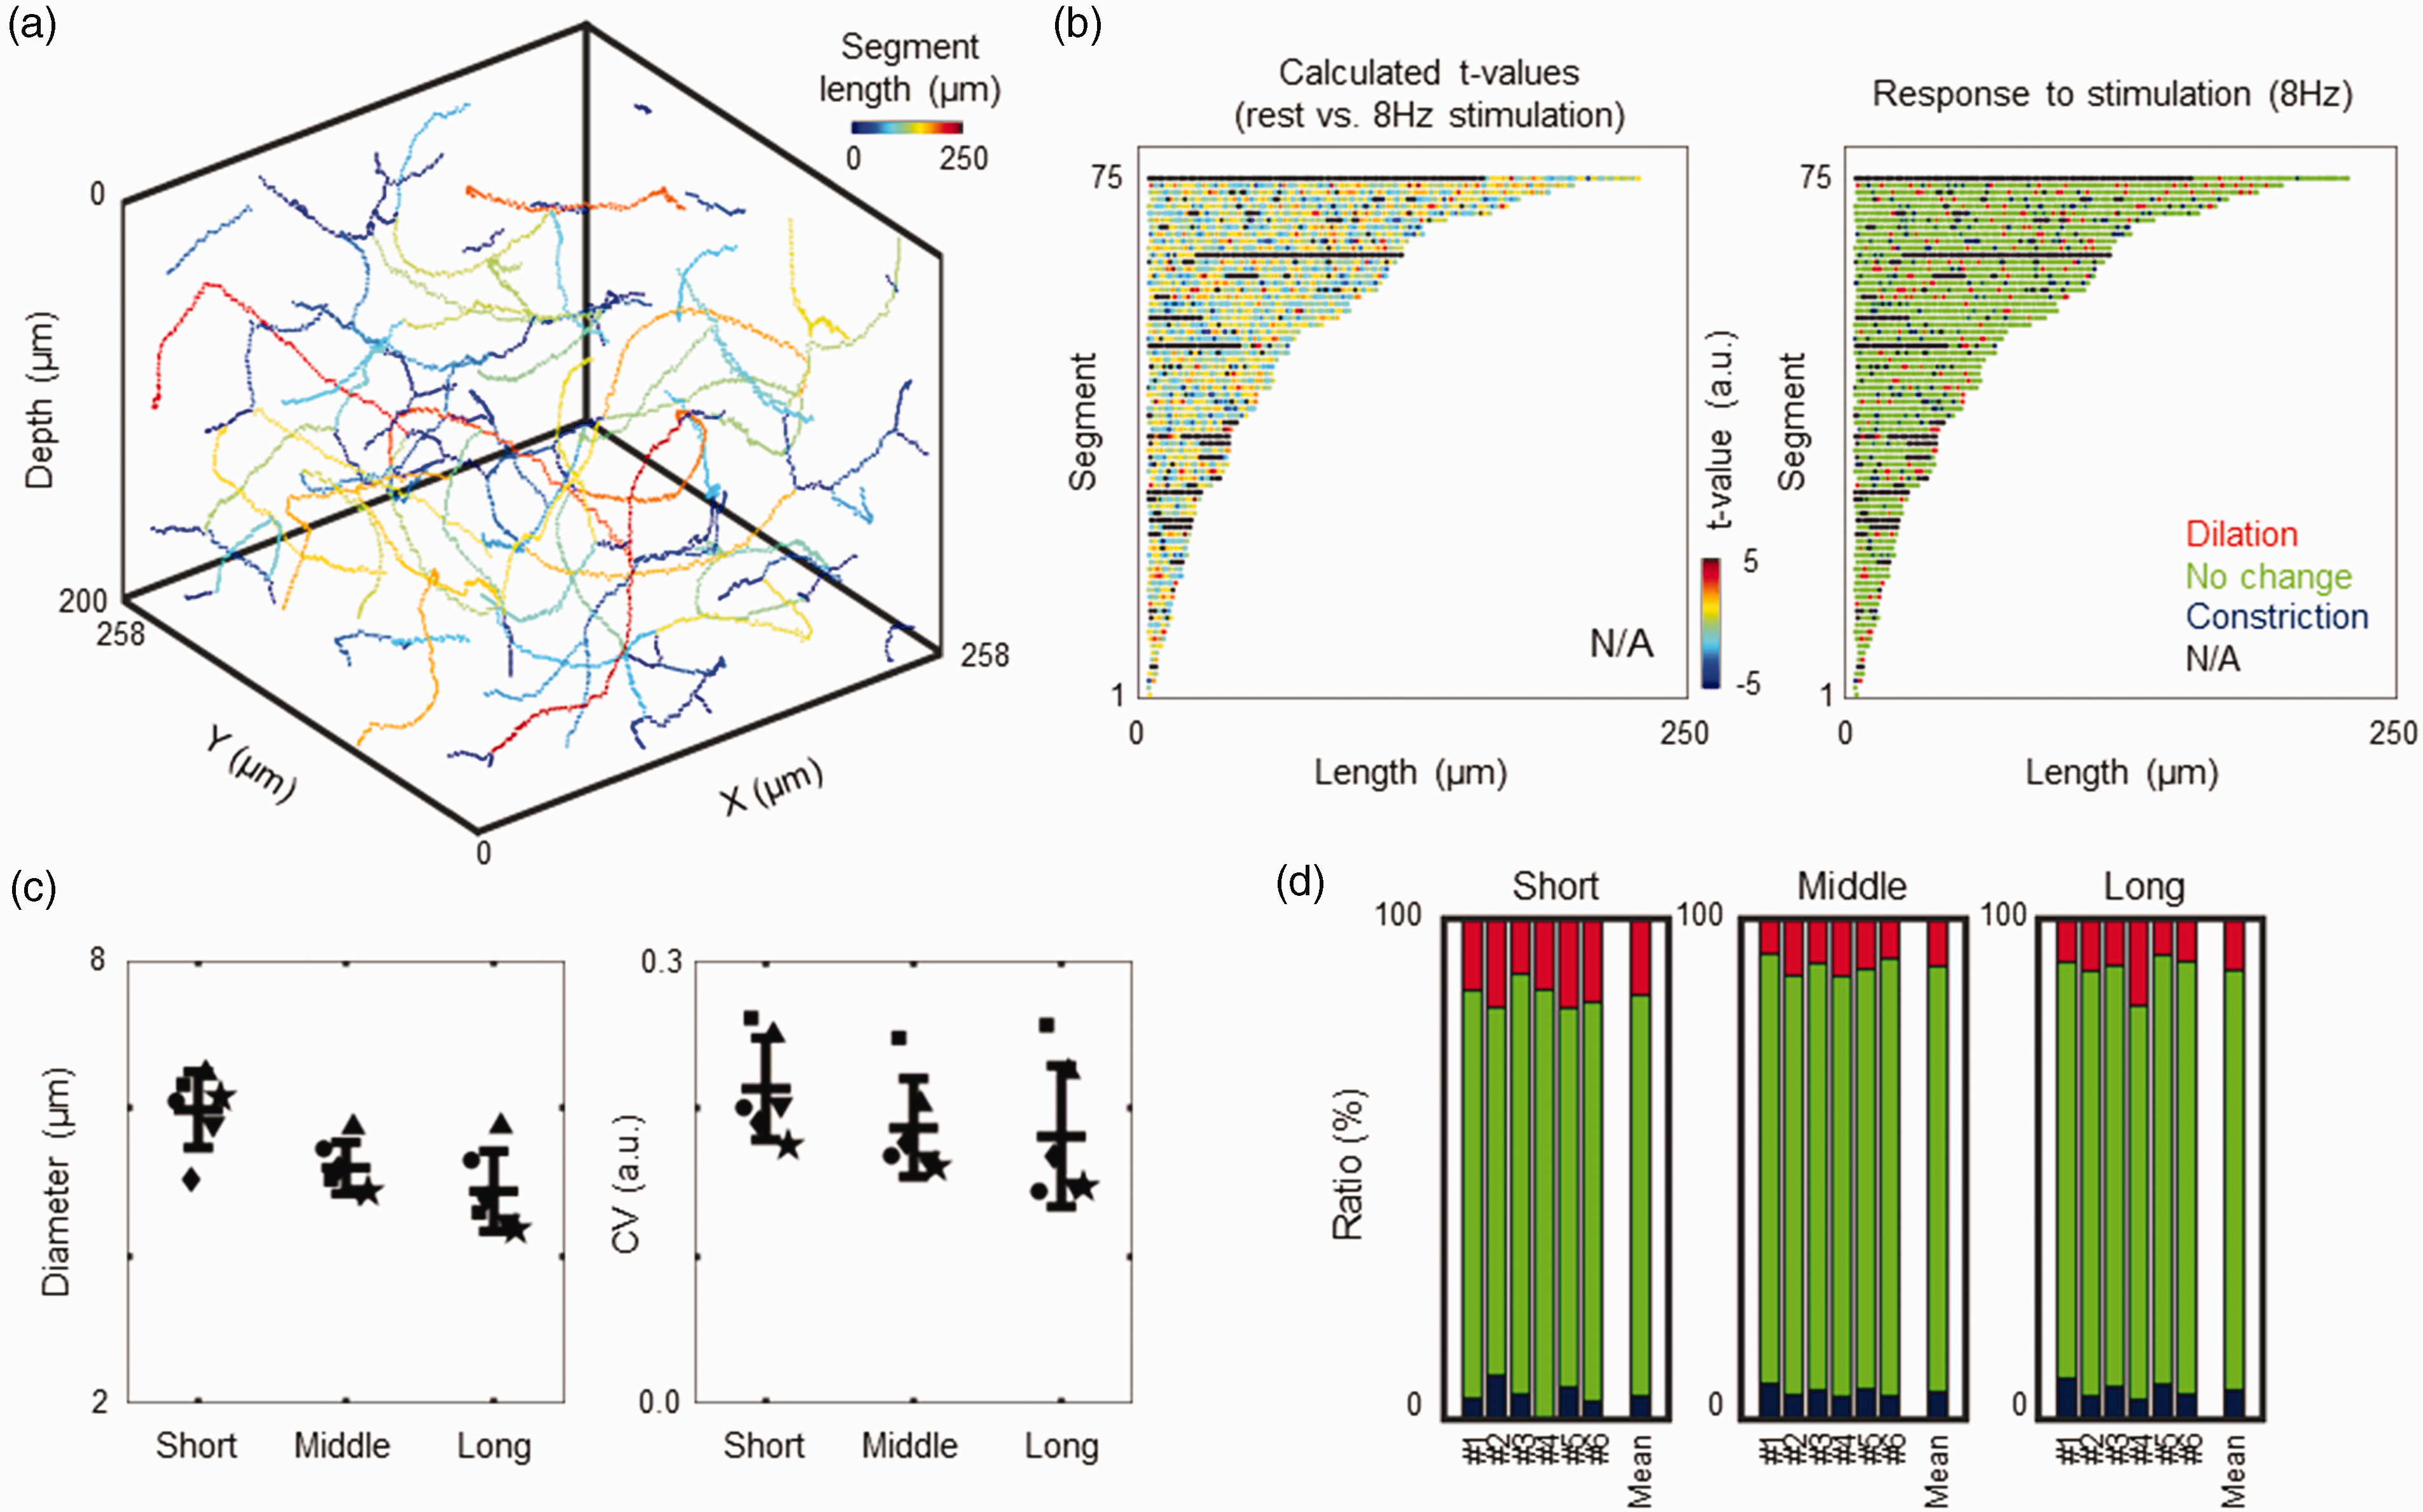
Comparisons of capillary responses across a segment length. (a) Three-dimensional reconstruction of capillary networks. Colours indicate the lengths of the capillary segments. A total of 75 segments (n = 3356 pixels) were extracted from the representative animal data (shown in Figure 1). (b) Comparisons of t values (left) and stimulation-induced responses (right). The segments were sorted from short to long (bottom to top), and the colours indicate calculated t values for rest versus 8 Hz stimulation (left). The probability distribution (right) showed that the majority of the measured locations were no changes (green), while these locations were randomly distributed for dilation (red) and constriction (blue) along the segment. Black indicates “NaN” (failed to measure). (c) Comparison of mean resting diameters (left) and Cv (right). The segments were classified into three groups: short (n = 7–38 segments), middle (n = 34–65 segments), and long (n = 11–29 segments) segments. Short segments tended to have greater diameters and fluctuations, but statistically significant differences were not detected (N = 6 animals) and (d) Comparison of the probability distribution for dilation (red), no change (green) and constriction (blue). These response probability was consistent regardless of the length of the segments in all 6 animals (#1 to #6).
Variability of the resting capillary diameters represents the degree of diameter change
The variations in resting diameters (i.e., Cv) were not uniform across the measured locations (Figure 5(a)). Next, we explored the differences in capillary responses based on variability in resting diameters. According to Cv, all measured locations were sorted, and the capillary locations ranked in the bottom 10% and top 10% were considered low- and high-fluctuating capillaries, respectively. These comparisons revealed that the low-fluctuating capillaries had relatively large resting diameters (6.3 ± 1.0 µm, n = 328, Figure 5(b)) and were stable over the trials regardless of neural activity (Figure 5(c)). In contrast, capillaries with high fluctuations had smaller resting diameters (4.6 ± 1.5 µm, n = 328, Figure 6(b)) and increased variability in accordance with neural activity (Figure 5(c)).
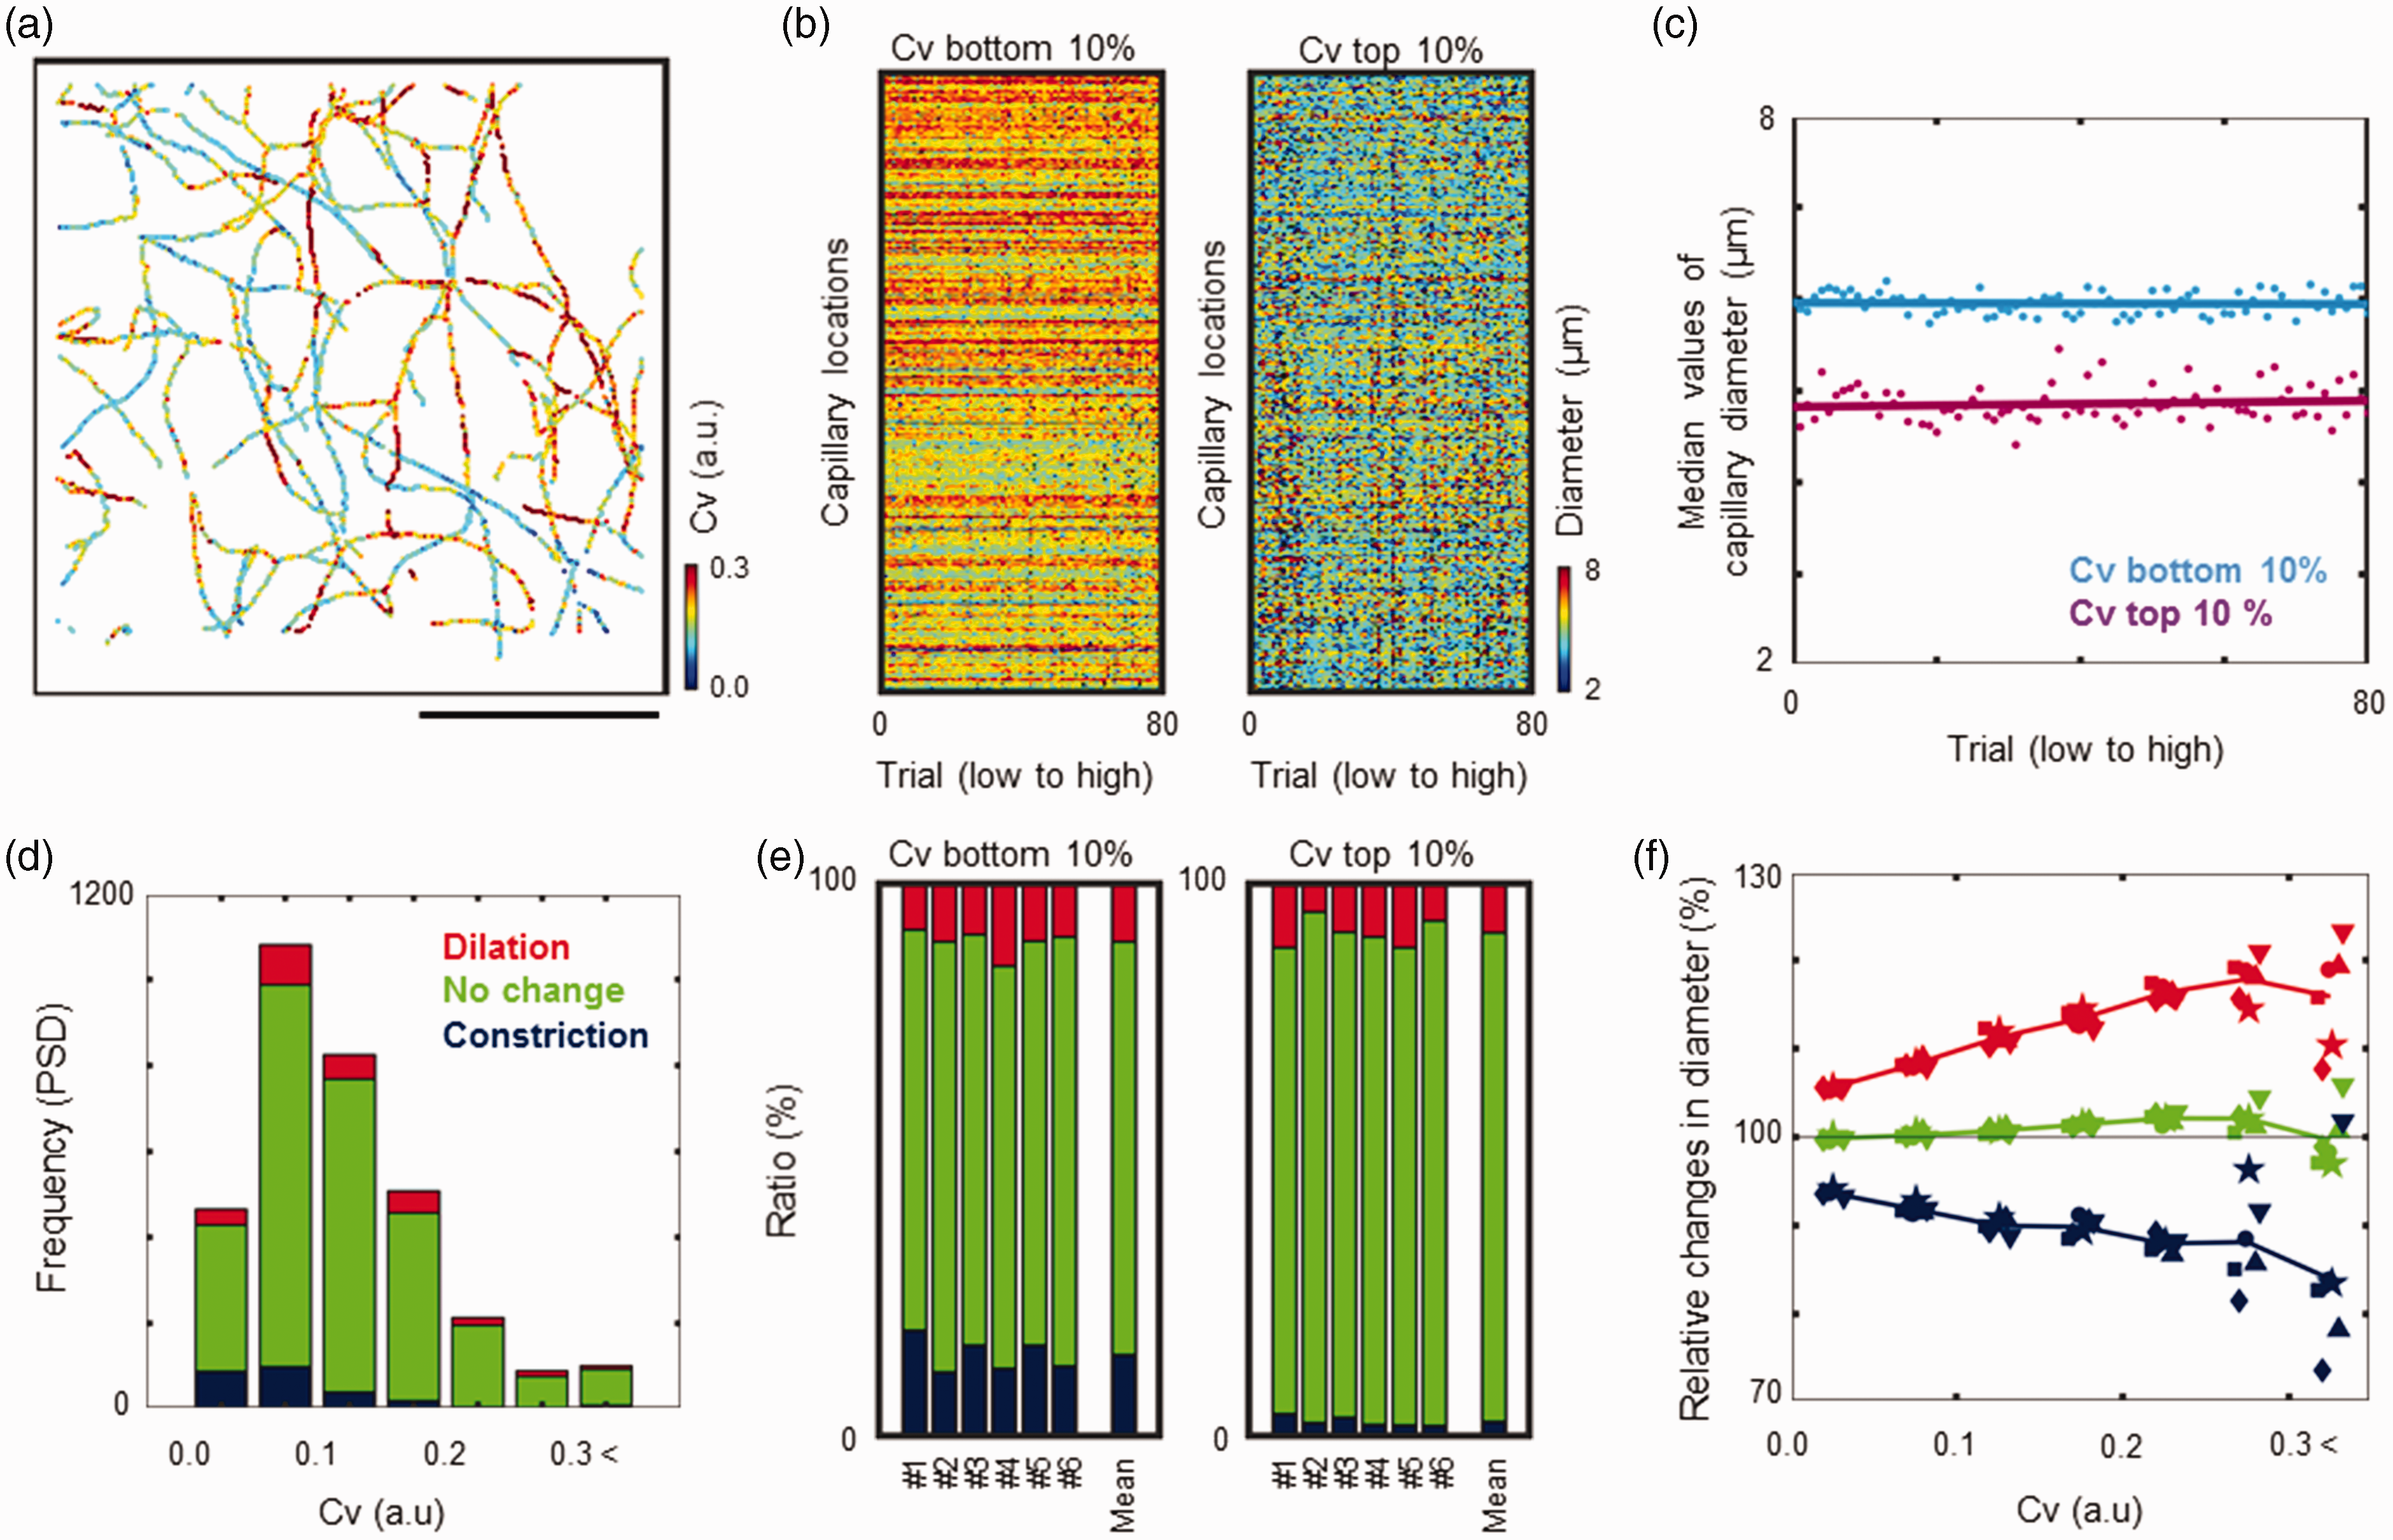
Comparisons of capillary responses based on resting diameter fluctuations. (a) Representative map of resting diameter fluctuations in the capillaries. Coefficients of variance (Cv) are represented in colour. Scale bar: 100 μm. (b) Comparisons of trial-to-trial variations in the capillary diameters. The measured diameters are represented in colour and arranged for all 80 trials (x-axis). The X-axis represents the trials sorted by neural activity (a number of activated GCaMP cells), and the Y-axis represents the measured locations sorted by Cv from low (lower) to high (upper). The bottom 10% (left) and the top 10% (right) out of all 3281 capillary locations are represented. (c) The median values of capillary diameters shown in b were compared for the lower (cyan) and higher (magenta) fluctuating capillaries. The trials were sorted by neural activity so that neural activity increased from left to right. Regression lines: Y = –0.0002 X + 6.0 and Y = 0.0008 X + 4.8 for the bottom 10% (R = 0.04) and the top 10% (R = 0.10), respectively. (d) Comparisons of diameter responses for different fluctuation capillaries. The numbers of locations for dilation (red), no change (green), and constriction (blue) responses to whisker stimulation (8 Hz) were compared over various levels of Cv, shown in a. (e) Probability distribution of capillary responses. Data for six animals (#1 to #6) consistently showed that dilation (red) occurred relatively independent of the resting diameter fluctuations. Constriction (blue) was significantly detected in the low-fluctuating capillaries (left), while no change (green) was significantly high in the high-fluctuating capillaries (right). (f) Relative changes in diameters in each group of dilation (red), no change (green) and constriction (blue) compared across the resting diameter fluctuations (Cv). Each symbol represents each animal data point. The line represents the mean value (N = 6).
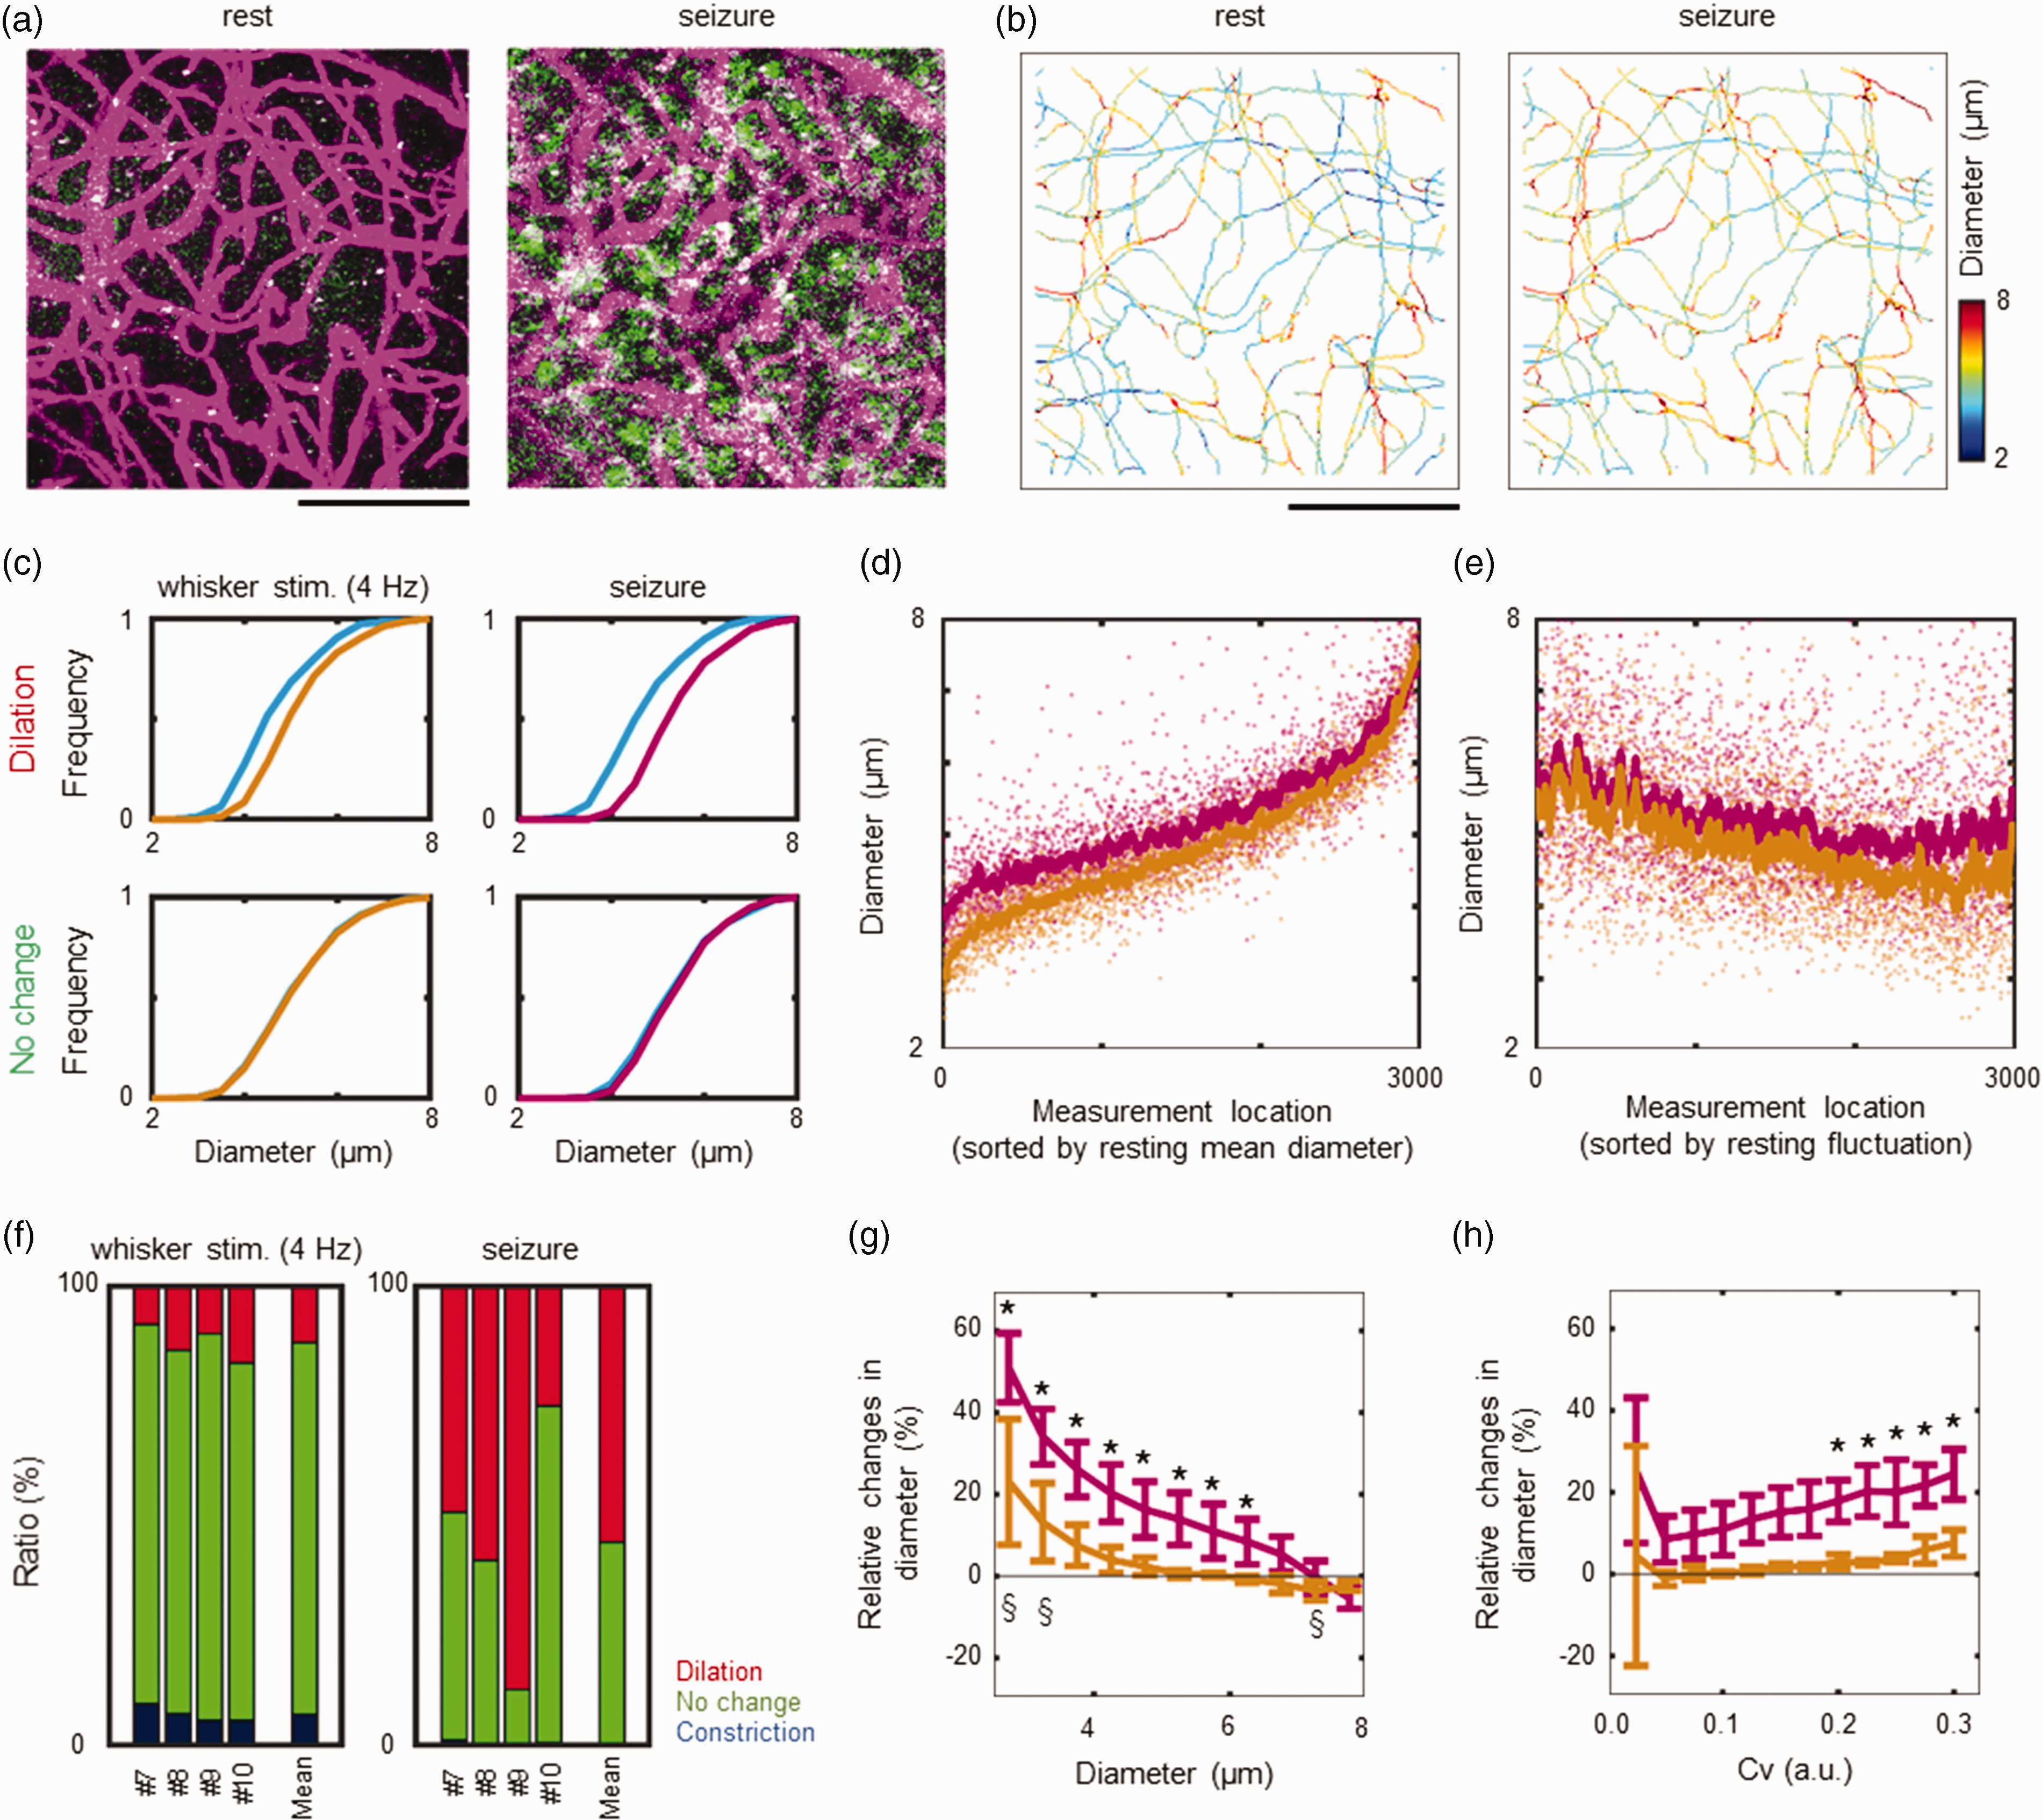
Capillary responses to pathological activation. (a) Images representing resting conditions (no convulsions; left) and seizures (right). The images are projections of maximum intensity for depths between 100 and 300 μm from the cortical surface. Hyperexcitability was evident with massive increases in the number of GCaMP-positive neurons (green) during a seizure event. Seizure-induced vasodilation (magenta) was also visually detected. Scale bar: 100 μm. (b) A map of the measured capillary diameters at rest (left) and during seizures (right) from image a. Colour indicates the diameter (n = 6355 and 6368 pixels for rest and seizures, respectively). Scale bar: 100 μm. (c) Comparisons of the capillary diameters. The measured locations were grouped into constriction, no change, and dilation based on t values for resting states versus whisker stimulation (left) or for resting states versus seizure (right). Because only a few locations showed constriction for seizures, the locations of dilation (top) and no change (bottom) were compared. Capillaries with dilation during whisker stimulation (brawn) had relatively smaller resting diameters (light blue) than those with no change (bottom). This was also consistent with the results for seizures (magenta). (d) All capillary locations (n = 2983 pixels) were sorted according to their resting diameters (small to large from left to right). The smaller diameters at rest showed greater changes for seizures (magenta) relative to changes for whisker stimulation (brawn). (e) All capillary locations were sorted according to the magnitude of the resting diameter fluctuations (Cv) (small to large from left to right). Capillaries with greater Cv tend to increase diameter responses to seizures (magenta) relative to the responses to whisker stimulation (brawn). (f) Comparisons of probability distribution for dilation (red), no change (green), and constriction (blue) between whisker stimulation (left) and seizure (right) in four animals (#7 to #10). (g) Relative changes in diameter responses were compared for the diameters at rest. Capillaries with small diameters at rest significantly dilated for seizures (magenta) and whisker stimulation (brawn). *P < 0.05 for diameters between epileptic seizure and rest, §P < 0.05 for diameters between whisker stimulation and rest (Dunnett’s test). (h) Capillaries with relatively larger fluctuations at rest also significantly contributed to diameter responses to seizures (magenta), while this trend was consistent for the response to whisker stimulation (brawn). *P < 0.05 for diameters between epileptic seizure and rest (Dunnett’s test).
Capillary dilation occurred relatively independent of the degree of resting fluctuations, but constriction tended to occur in low-fluctuating capillaries (Figure 5(d)). The probability distribution for capillary constriction was 14.7% ± 2.7% in low-fluctuating capillaries, which was significantly larger than that in high-fluctuating capillaries (2.6% ± 0.8%, P < 0.05, N = 6, Figure 5(e)). In contrast, dilatation occurred evenly for low- and high-fluctuating capillaries (10.6% ± 2.1% and 9.0% ± 2.4%, respectively, p = 0.16, Figure 5(e)). Although the probability distribution for dilation was identical, relative changes in diameter responses increased with increased Cv (Figure 5(f)). The results show that the variability in resting diameters represents the ability to change diameters during neural activation.
Seizures made the majority of capillaries to dilate depending on the resting diameters
To test these observations under pathological conditions, capillary responses to kainic acid-induced seizures were further investigated. Neural hyperexcitability occurred periodically during epileptic seizures, where a large number of GCaMP-positive cells were evident (Figure 6(a)). The capillaries were apparently dilated, and the diameter measurements showed increases in a number of large capillaries during epileptic seizures (Figure 6(b)). Consistent with the responses to whisker stimulation, capillaries with smaller diameters at rest (4.3 µm [3.8–5.0 µm], n = 1282) dilated during seizures (5.1 µm [4.6–5.7 µm]). However, capillaries with relatively large diameters at rest (5.0 µm [4.4–5.7 µm], n = 1292) remained unchanged for seizures (5.1 µm [4.5–5.8 µm]; Figure 6(c)). This difference between pathological and normal activation was demonstrated by comparing the responses to whisker stimulation (4 Hz) in the same measurement locations (Figure 6(c)): 4.3 µm [3.8–5.0 µm] at rest to 4.8 µm [4.3–5.5 µm] for activation in dilation responses (n = 230) and 4.7 µm [4.1–5.5 µm] for no change (n = 2265). Because seizures exaggerated the dilatory responses of the capillaries compared to the normal activation, dependencies of the diameter changes on the resting diameters become more evident (Figure 6(d)). Furthermore, the seizure-induced additional dilation occurred in higher fluctuation capillaries (Figure 6(e)).
On average, 56% ± 22% (N = 4) of the locations showed a dilatory response to seizures, and the remaining 44% ± 22% were unchanged (Figure 6(f)). Few places showed constriction (<1%) during seizures, whereas 7% ± 1% of locations showed constriction for whisker stimulation (Figure 6(f)). Consequently, these variable diameter responses produced 2.6% ± 1.7% and 26% ± 8% volume increases for whisker stimulation and seizures, respectively. Capillaries with small resting diameters were significantly dilated for both activations (p < 0.05, Dunnett’s test, Figure 6(g)). Resting diameter fluctuations also played a key role in increasing the capillary volume for seizures (Figure 6(h)). Of these volume responses, volume increases in high-fluctuating capillaries accounted for 15% ± 4% of the total volume increases during seizures, which were significantly higher than those of low-fluctuating capillaries (7% ± 2%, P < 0.05, Student’s t test).
Discussion
Big data analysis of the brain capillary morphology revealed that 84% of capillary sites do not show detectable change in diameters during functional activation (Figure 3). Of the remaining sites, 10% dilate and 6% constrict, resulting in a net 1–2% increase in capillary volume. The differences in these responses are related to the resting states of capillary diameters. Capillaries with relatively large diameters at rest are stable over time, independent of the neural activities, but occasional constriction can occur (Figure 5). In contrast, capillaries with small resting diameters vary in association with neural activity. For hyperexcitability caused by an epileptic seizure, 56% of the capillaries dilated, and the remaining 44% remained unchanged. Importantly, the diameter increases were inversely related to the resting diameters (Figure 6(g)), suggesting the upper limit of capillary diameter which was approximately 7 µm in the mouse cortex.
Under normal arousal conditions, all brain capillaries are perfused and thus maintain the lumen diameter.28,29 However, substantial heterogeneity is present through capillary networks and even in single capillaries. 30 Therefore, in this study, the lumen diameter was measured along the centreline of the vessel in the 3D reconstructed images, 9 allowing us to determine the spatiotemporal heterogeneity in the diameter distributions. The observed variability in the capillary lumen structure could represent an anatomical variation of the capillaries, such as variable coverage by pericytes, 31 phenotypic variations in vascular endothelial cells, 32 and/or variable thickness of glycocalyx layers 33 or variable noises in the image. Because the measurements are based on fluorescent labelling of the blood plasma, the latter was smoothed by a filter applied to compensate for artefacts caused by unlabelled blood cell movements. Furthermore, multiple trial images were used in the analysis. Thus, the observed variations in the trial-to-trial variations of the capillary diameters could represent physiological variations rather than instrumental noise.
Pioneering studies have consistently shown that brain capillaries significantly dilate in response to respiratory hypercapnia.34–36 This dilation was dependent on the resting diameters in normocapnic conditions. 37 Namely, the smallest capillary at prehypercapnia showed the greatest dilation, while the larger capillaries remained constant for hypercapnia. Our results on responses to seizure are in good agreement with this report. For functional activation, constriction and dilation of brain capillaries have been consistently observed in in vivo optical imaging studies.10,38–43 However, some studies have reported no detectable changes in capillary diameters.44,45 There could be many reasons for these discrepancies because of the heterogeneous nature and small changes in the capillary diameter responses to functional activations.
The novelty of this study is that based on big data analysis with 3D microscopic angiography, we first characterized the probability distribution of capillary responses to functional and pathological brain activations. Other studies have highlighted the first-order capillary as the starting point for the functional vascular response because it has a structural difference with the presence of sphincters and the transition from the arteriole to the capillary.10,13,41,43,46,47 In our experiment, capillary diameter responses to functional activation did not show apparent localization of the response sites over lengths of the capillaries (Figure 4), between upstream (arterial) and downstream (venous) capillaries (Supplementary Fig. S2), and distance to active neurons within the field of view (Supplementary Fig. S3). The mean diameter of the first-order capillary was observed to increase steadily in comparison with other capillaries (Supplementary Fig. S2). However, it can limit the maximum dilation capacity due to its larger diameter at rest. Activation of seizures revealed ceiling effects on capillary vasodilatation, resulting in a non-linear relationship between capillary dilation and evoked neural activity (Supplementary Fig. S4). In case of pathologic hyperexcitation, the increase in capillary volume therefore reflects the resting states of the capillary diameter and the number of capillaries. Although the field of view in this study is limited, increased capillary volume during seizures tended to occur on the venous sides partly due to the higher number of capillaries on the venous side (Supplementary Figure S4). Future studies are needed to fully quantify volume changes along capillary networks, such as with a mesoscopic 3D microangiography.
Overall, pixel-based analysis along the vessel centreline revealed that there are at least two types of capillary states: capillaries with relatively large diameters at rest remained stable irrespective of the neural activity, and capillaries with relatively small diameters and variable at rest changed diameters in association with neural activity. It is unknown whether these states are interchangeable over time. Interestingly, single-cell ablation of pericytes caused capillary dilation in the vicinity, 48 indicating changes in capillary states. Other studies have also shown that the loss of brain pericytes causes a decline in brain capillary perfusion, neurovascular uncoupling and resultant cerebral hypoxia.49,50 These capillary dysfunctions in the brain eventually lead to cognitive impairment.51,52 Previously published studies have consistently showed that changes in capillary states (i.e., capillary dysfunction) are crucial in pathological brains. However, there is currently no technique for diagnosing the capillary states of the brain in clinical settings.
For clinical translation from the current results, spatiotemporal variations in the resting volume of brain capillaries should be measured directly or indirectly. This will tell us the functional states of the brain capillaries because resting variations in the brain capillary volume predict the capacity for capillary volume increases in normal and pathological brain activation. Although local vasodilation of brain capillaries may have a limited impact on the increases in net CBF,53,54 temporal variations in capillary diameter lead to a network redistribution of blood cell flow. 55 This can affect the capillary transit time. Thus, current results are implicated for clinical application to detect capillary dysfunction by measuring temporal variations in capillary transit time, which has been characterized as alternation in the heterogeneity of capillary transit time in the pathological brains. 56 Additional work is further needed using the current methods to verify the relationship between the modified heterogeneity of capillary transit time and changes in capillary states under pathological conditions.
Limitations of the method
The methods are based on a full visualization of blood plasma labelled with SR101, so the imaging field was limited to the upper cortical layers due to signal-to-noise ratio issues in our two-photon microscopic angiography. 9 Thus, the observed results on probability distribution and other capillary parameters could be specific to the cortical regions measured in this study. For example, the most prominent changes in blood volume occur in cortical layer IV during neural activation. 57 Further technical improvements in fast, deep and large-volume imaging are needed for comprehensive 3D or 4D brain microangiography. For the quantification of capillary diameter and volume, segmented vessels were used for analysis, but areas near the junction points were not included, as the current algorithm cannot accurately measure them. To reduce errors in diameter measurements, the capillaries were automatically segmented to exclude 6 µm from the junction point. 58 This omission may underestimate capillary behaviour in the vicinity of branches and make it difficult to quantify the absolute volume of the brain capillaries. Finally, capillary diameter was measured in a 3D reconstructed image with normalized intensity heterogeneity. 9 Despite a limited scan speed for the Z (axial) direction, we prefer to use the XYZ scan rather than the XYt scan (i.e., single-plane time interval imaging) because the XYZ scan minimizes errors caused by the measured plane defocus (e.g., due to motion artefacts) and an inappropriate threshold for image binarization. 9 However, this imaging protocol sacrifices an image acquisition rate and thus lacks time information on the evolution and propagation of vascular dynamics. Also, slow scanning may not capture all GCaMP signals, allowing only relative comparisons between different stimulation paradigms, but not absolute quantification. Although the beginning of image acquisition and the beginning of stimulation were randomized, a potential bias for changes in diameter and neural responses caused by phase differences in neurovascular dynamics cannot be ruled out.
In summary, using custom software in MATLAB and a big data analysis of 3D microscopic angiography, this study successfully characterized the probability distribution of capillary responses (i.e., dilation, constriction and no change) to functional and pathological brain activations. For functional activation, fractional dilation and constriction occurred at capillaries having relatively small and large resting diameters, respectively. These reactive sites are sparsely distributed independent of the arteriovenous axis. For pathological activation (epileptic seizure), capillary dilation occurred at over half of the capillary sites, while others remained unchanged. The relative changes in vasodilation depend on the diameter at rest, and the upper limit of capillary dilation was estimated to be approximately 7 µm in diameter. Differences in response to neural activity are subject to variations in the resting diameter, indicating at least two states of the brain capillary at rest. For future clinical application, fluctuations in capillary volume at rest may allow us to diagnose the functional states of the brain capillaries.
Supplemental Material
sj-pdf-1-jcb-10.1177_0271678X231156372 - Supplemental material for Capillary responses to functional and pathological activations rely on the capillary states at rest
Supplemental material, sj-pdf-1-jcb-10.1177_0271678X231156372 for Capillary responses to functional and pathological activations rely on the capillary states at rest by Hiroki Suzuki, Hiroshi Takeda, Hiroyuki Takuwa, Bin Ji, Makoto Higuchi, Iwao Kanno, Kazuto Masamoto in Journal of Cerebral Blood Flow & Metabolism
Footnotes
Funding
The author(s) disclosed receipt of the following financial support for the research, authorship, and/or publication of this article: Grant support: JSPS KAKENHI: 22K07317 to KM and 22J23260 to HS.
Acknowledgements
The authors are grateful to Takuma Sugashi and Ryota Hachiya for their support in software development and data analysis.
Declaration of conflicting interests
The author(s) declared no potential conflicts of interest with respect to the research, authorship, and/or publication of this article.
Authors’ contributions
Hiroshi T., K.M. for conception and design; Hiroshi T., Hiroyuki T., K.M for acquisition of data; H.S., Hiroshi T., K.M. for analysis of imaging data, H.S., Hiroyuki T., B.J., M.H., K.M. for interpretation of data; H.S., K.M. for drafting the manuscript; H.S., I.K., K.M. revising it critically for important intellectual content; and all authors for final approval of the version to be published.
Supplemental material
Supplemental material for this article is available online.
References
Supplementary Material
Please find the following supplemental material available below.
For Open Access articles published under a Creative Commons License, all supplemental material carries the same license as the article it is associated with.
For non-Open Access articles published, all supplemental material carries a non-exclusive license, and permission requests for re-use of supplemental material or any part of supplemental material shall be sent directly to the copyright owner as specified in the copyright notice associated with the article.