
Abstract
While it is known that cortical sensory dysfunction may occur in focal neocortical epilepsy, it is unknown whether sensory-evoked neurovascular coupling is also disrupted during epileptiform activity. Addressing this open question may help to elucidate both the effects of focal neocortical epilepsy on sensory responses and the neurovascular characteristics of epileptogenic regions in sensory cortex. We therefore examined bilateral sensory-evoked neurovascular responses before, during, and after 4-aminopyridine (4-AP, 15 mmol/L, 1 μL) induced focal neocortical seizures in right vibrissal cortex of the rat. Stimulation consisted of electrical pulse trains (16 seconds, 5 Hz, 1.2 mA) presented to the mystacial pad. Consequent current-source density neural responses and epileptic activity in both cortices and across laminae were recorded via two 16-channel microelectrodes bilaterally implanted in vibrissal cortices. Concurrent two-dimensional optical imaging spectroscopy was used to produce spatiotemporal maps of total, oxy-, and deoxy-hemoglobin concentration. Compared with control, sensory-evoked neurovascular coupling was altered during ictal activity, but conserved postictally in both ipsilateral and contralateral vibrissal cortices, despite neurovascular responses being significantly reduced in the former, and enhanced in the latter. Our results provide insights into sensory-evoked neurovascular dynamics and coupling in epilepsy, and may have implications for the localization of epileptogenic foci and neighboring eloquent cortex.
INTRODUCTION
Cortical responses to sensory stimuli may be altered in focal neocortical epilepsy.1,2 In occipital lobe epilepsy, regions of visual cortical dysfunction ipsilateral to the epileptogenic region can be identified using functional magnetic resonance imaging (fMRI). 3 Postictal attenuation of auditory event-related potentials ipsilateral to the epileptogenic focus has also been reported in temporal lobe epilepsy. 4 Assessment of cortical dysfunction can therefore not only elucidate the relationship between partial onset epilepsy and sensory systems, but also provide important lateralizing information on the seizure onset zone (SOZ). However, little is known on the effects of focal neocortical epilepsy on sensory-evoked neurovascular coupling. Therefore, whether debilitated sensory-evoked neurovascular coupling is also a feature of epileptogenic zones in sensory regions, and whether recurrent seizure activity produces enduring effects on neurovascular responses, both ipsilateral and contralateral to the SOZ, remain unexplored. In nonpathologic brain states, evaluation of sensory-evoked neurovascular responses in anesthetizedrodent models can offer valuable insights into the nature of neurovascular coupling, and guide refinement of mathematical models that enable interpretation of perfusion-based imaging signals in terms of underlying neuronal activity.5-11 Assessment of neural and hemodynamic responses to sensory stimulation before, during, and after epileptiform activity can therefore interrogate the stability of neurovascular coupling mechanisms in epilepsy, which have been recently suggested to be altered in acute models.12,13 This remains an important question, as a detailed understanding of neurovascular coupling is crucial to the correct interpretation of perfusion-related imaging signals in epilepsy, such as blood oxygen level-dependent (BOLD) fMRI, that are increasingly used during presurgical evaluation of intractable epilepsy, and which typically assume linearity in neurovascular coupling. 14
Using the 4-aminopyridine (4-AP) acute model of focal epilepsy in the rat somatosensory cortex, we hypothesized that the supranormal metabolic stress placed on the neurovascular unit during ictal-like discharges may modulate conventional neurovascular responses to sensory stimulation. Further, we posited that recurrent seizures may have lasting effects on sensory-evoked neurovascular responses not only in the cortex ipsilateral to the SOZ but also in contralateral cortex. We therefore used concurrent multichannel electrophysiology to measure the current source density (CSD) of evoked field potentials (FPs), and two-dimensional optical imaging spectroscopy to obtain spatial maps of oxyhemoglobin (HbO), deoxyhemoglobin (Hbr), and total hemoglobin (Hbt) concentration in the rat neocortex. We subsequently evaluated regional neurovascular responses to vibrissal stimulation during 4-AP-induced focal neocortical seizures and examined bilateral evoked responses after cessation of seizure activity.
MATERIALS AND METHODS
Animal Preparation and Surgery
All procedures described were performed with UK Home Office approval under the Animals (Scientific Procedures) Act of 1986. Female hooded Lister rats (total
Epilepsy Model
The potassium channel blocker 4-AP (Sigma-Aldrich, Gillingham, UK, 15 mmol/L, 1 μL) was used to generate focal seizure-like discharges12,13,15 in the right vibrissal cortex (RVC). 4-AP was infused at a depth of 1,500 μm via the fluidic port in a multichannel microelectrode (Neuronexus Technologies, Ann Arbor, MI, USA) over a 5-minute period (0.2 μL/min) using a 10-μL Hamilton syringe and syringe pump (World Precision Instruments Inc., Sarasota, FL, USA).
Two-Dimensional Optical Imaging Spectroscopy
Two-dimensional optical imaging spectroscopy was used to measure changes in cerebral HbO, Hbr, and Hbt concentration. A Dalsa 1M30P camera (Billerica, MA, USA) operating in 4 × 4 binning mode was used to record the images, with each pixel representing ~ 75 μm × 75 μm. Spatial maps of cortical hemodynamic responses were generated using a Lamda DG-4 high speed filter changer (Sutter Instrument Company, Novata, CA, USA). Illumination of the cortex was conducted at four different wavelengths specifically selected as two pairs (495±31 nm FWHM (full width at half maximum) and 559±16 nm FWHM; 575±14 nm FWHM and 587±9 nm FWHM), with each pair sharing a similar total absorption coefficient (thus sampling a similar tissue volume) but possessing antipodal HbO and Hbr absorption coefficients (so as to maximize the signal-to-noise ratio). Camera frame rate was set at 32 Hz, and synchronized to the filter switching, resulting in an effective frame rate of 8 Hz per wavelength. Image data were subjected to spectral analysis consisting of a path length scaling algorithm described in detail previously.16,17 Briefly, the algorithm uses a modified Beer-Lambert Law in conjunction with a path-length correction factor for each wavelength used, based on Monte Carlo simulations of light transport through tissue. Baseline concentration of Hbt was estimated at 104 μmol/L 18 with saturation estimated at 50%. The spectral analysis produced 2D images over time of HbO, Hbr, and Hbt, the latter being proportional to cerebral blood volume (CBV) under the assumption of a constant hematocrit. 5
Localization of Vibrissal Somatosensory Cortex for Electrode Implantation
To localize the region of somatosensory ‘barrel’ cortex activated by vibrissal stimulation, a preparatory two-dimensional optical imaging spectroscopy experiment was conducted in each subject. Here, the contralateral mystacial pad was stimulated with a train of electrical pulses (1.2 mA intensity and 0.3 ms pulse width) for 2 seconds at 5 Hz. A total of 30 stimulus presentation trials of 24 seconds duration were aggregated (stimulation onset at 8 seconds, intertrial interval of 26 seconds) and averaged to create a mean trial which was subjected to the aforementioned spectral analysis. Spatiotemporal changes in Hbt were subsequently analyzed using statistical parametric mapping (SPM) in which each pixel's time series was regressed against a design matrix representing a direct current (DC) offset, ramp, and ‘boxcar’ function of the same duration as the stimulation. 19 This produced a z-score activation map where high values represented large evoked increases in Hbt, with low values conversely associated with decreases. Pixels within 50% of the maximum and minimum z-score were used to define the ‘positive’ and ‘negative’ regions of interest (ROIs), respectively. Positive ROIs were then coregistered with camera images of the cortical surface to guide further thinning of the skull and a small perforation in the dura mater to be made, enabling insertion of a depth electrode into the vibrissal cortex (Figures 1D and 1E). In all subjects, a 16-channel electrode, coupled to a fluidic probe loaded with 4-AP, was inserted into, and normal to, the RVC to a depth of 1,500 μm. In six further animals, a second identical electrode, albeit not coupled to an infusion port, was also implanted into the left vibrissal cortex (LVC) after following the above procedure. Multichannel electrodes (16 channels with 100 μm spacing, site area 177 μm2, 1.5 to 2.7 MΩs impedance, and 33 μm tip width; Neuronexus Technologies, Ann Arbor, MI, USA) were coupled to a preamplifier and data acquisition device (Medusa Bioamp, TDT, Alachua, FL, USA). We found no evidence of cortical spreading depression during a 1-hour monitoring period between electrode implantation and data collection, consistent with previous reports.9,10,20
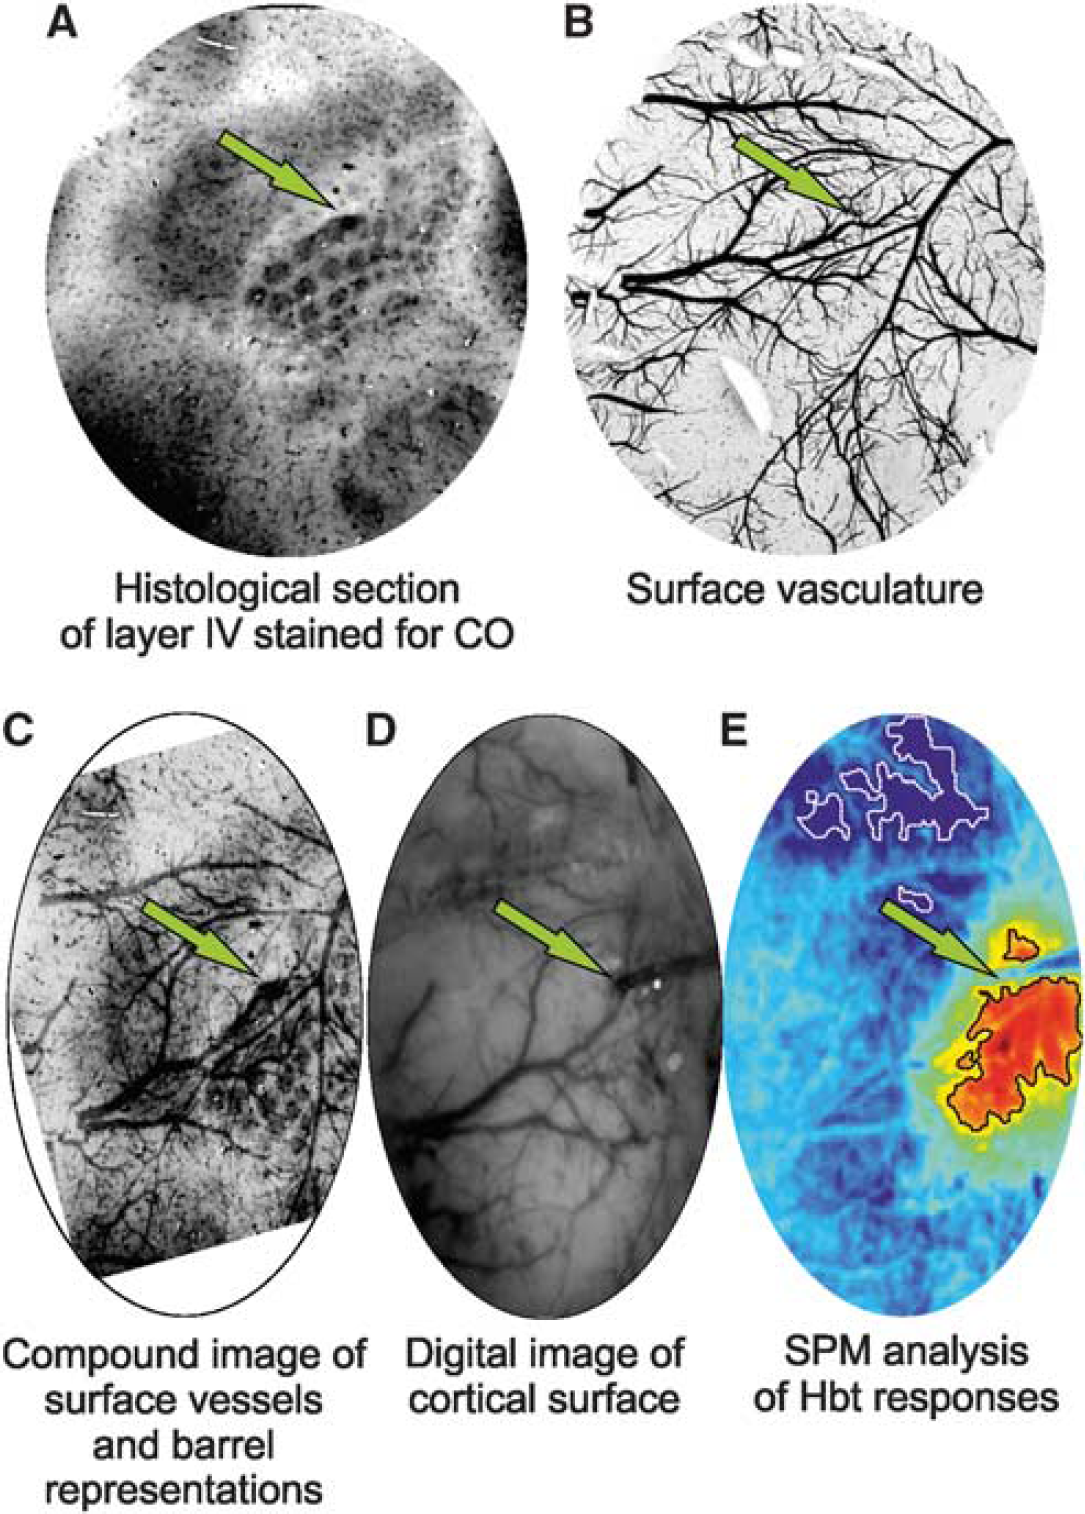
Histologic confirmation of electrode implantation site in a representative subject. Electrode sites are indicated with a green arrow. (
Multidepth Electrophysiology and Current Source Density Analysis
Field potential recordings across 16 channels in each electrode were sampled at 6 kHz with 16-bit resolution and averaged over trials, with stimulus onset ‘jittered’ within a 20-ms window to reduce the effects of 50 Hz mains noise. Interpretation of FPs is difficult due to the conduction properties of the extracellular medium as well as the superposition principle, in which FPs from multiple cells linearly summate and thus may not be localized within a particular cortical region. As a result, CSD analysis of laminar FP recordings was performed to resolve such inherent spatial ambiguities and transform these into a laminar distribution of current sources and sinks. This technique has been described in detail previously, 11 and produces a characteristic superficial current source with a prominent underlying early middle-layer (‘primary’) current sink in response to mystacial pad stimulation. The locus of this primary current sink (~ 400 to 500 μm below cortical surface) has been previously shown, using cytochrome oxidase histology, to be spatially concordant with cortical lamina IV, 21 the target layer of primary somatosensory input from the ventral posterior thalamus. As the current sink is widely considered to reflect active, rather than passive (i.e., source related), neural mechanisms, the time series through the primary sink has been historically taken as our dependent measure of neural activity, reflecting the summed activity of excitatory postsynaptic potentials due to thalamocortical activation and subsequent intracortical processing. 20 Comparison of this neural metric with associated hemodynamic measures to investigate neurovascular coupling is therefore warranted from both a signal processing and a neurophysiologic point-of-view. To facilitate description of neural responses to stimulation in each condition, neural data are also presented as neural profiles representing peak negative responses to each electrical pulse in the stimulation train.
Experimental Paradigm
The stimulation protocol used to investigate neurovascular coupling consisted of 30 stimulation presentation trials with an intertrial interval of 70 seconds, each delivering a 16-second train of electrical pulses (5 Hz, 1.2 mA intensity, and 0.3 ms pulse width) to the mystacial pad after a 10-second prestimulation baseline period. These stimulation parameters have been previously shown to induce robust neural and hemodynamic responses, with maximal signal-to-noise ratio and avoidance of signal saturation in urethane anesthetized rats.9,16,20–22 Electrophysiology measures of neural activity were recorded across all 16 channels for a period of 25 seconds and beginning 4 seconds before stimulation onset in each trial. In addition, continuous neural data from one channel at a depth of 700 μm were also recorded. Cortical hemodynamic measures were recorded concurrently and continuously throughout each experiment. Identification of positive and negative ROIs using SPM analysis was conducted for each hemodynamic variable in each condition, and used to derive hemodynamic time series responses to stimulation (as fractional changes from baseline unless otherwise specified).
In six subjects, an initial experimental run was conducted to obtain control neurovascular responses to stimulation of the left mystacial pad (henceforth referred to as ‘control’) using the above paradigm. A short time after, and after a baseline recording of 280 seconds, 1 μL of 4-AP was infused into RVC via the fluidic port in the multichannel electrode over a 5-minute period. The stimulation protocol was then repeated 400 seconds after offset of 4-AP infusion. Onset and offset timings of 4-AP-induced seizure-like discharges were evaluated by eye with reference to raw FP recordings, summed power spectrum of these in the frequency range of 0.1 to 49 Hz, and concurrent Hbt measures, with stimulation trials coinciding within ictal discharges selectively extracted and averaged for final analysis. Neurovascular responses to the aforementioned stimulation trials will be henceforward referred to as ‘intraictal’. A final experimental run, identical to the control, was then conducted 2 hours after onset of 4-AP infusion when seizure-like activity had ceased (hereafter referred to as ‘postictal’ neurovascular responses to stimulation). Furthermore, in another six subjects, two control experiments were conducted with stimulation to the left (
Cytochrome Oxidase Histochemistry
Following most experiments, postmortem brain tissue was prepared for histologic analysis using a modified procedure to that described by Wong-Riley and Welt, 23 and has been described in detail previously. 24 Briefly, subjects were perfused transcardially with saline, 4% paraformaldehyde and subsequently photographic emulsion (Jessops Ltd., Leicester, UK) to allow discrimination of surface vasculature in subsequent histologic sections. Brains were removed, the cortex of interest detached, compressed, and then sectioned into slices tangential to the surface using a cryostat, the first slice at a depth of 200 μm to capture and later visualize the surface vasculature, with subsequent slices at successive 50 μm depths. Slices were placed in an incubation medium in a dark room at 37°C to allow staining for cytochrome oxidase so as to distinguish barrel representations. Finally, photomicrographs of each histologic section were produced and linearly warped to each other manually (Figures 1A to 1C).
RESULTS
Neural Responses to Control Stimulation of Left Mystacial Pad Control stimulation of the left mystacial pad elicited typical neural responses in the contralateral RVC. The trial-averaged CSD depth profile to the first pulse of the stimulation train (Figure 2A, in a representative subject) displayed a large current source near the cortical surface (~300 μm) and underlying short-latency current sink (~ 450 μm, peak latency of 9±0.4 ms,
Hemodynamic Responses to Control Stimulation of Left Mystacial Pad
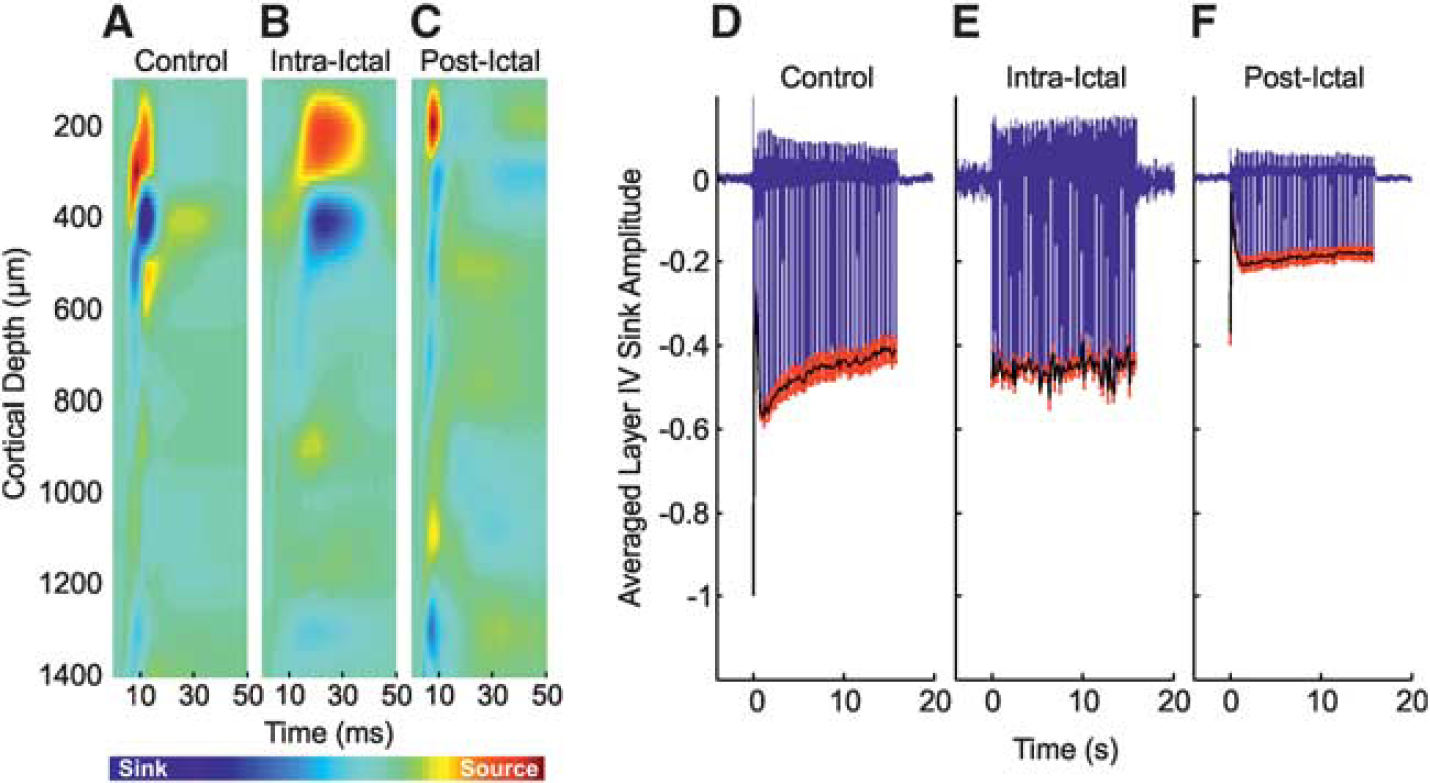
Neural responses in right vibrissal cortex (RVC) to left mystacial pad stimulation before, during, and after 4-aminopyridine (4-AP) infusion in RVC. (
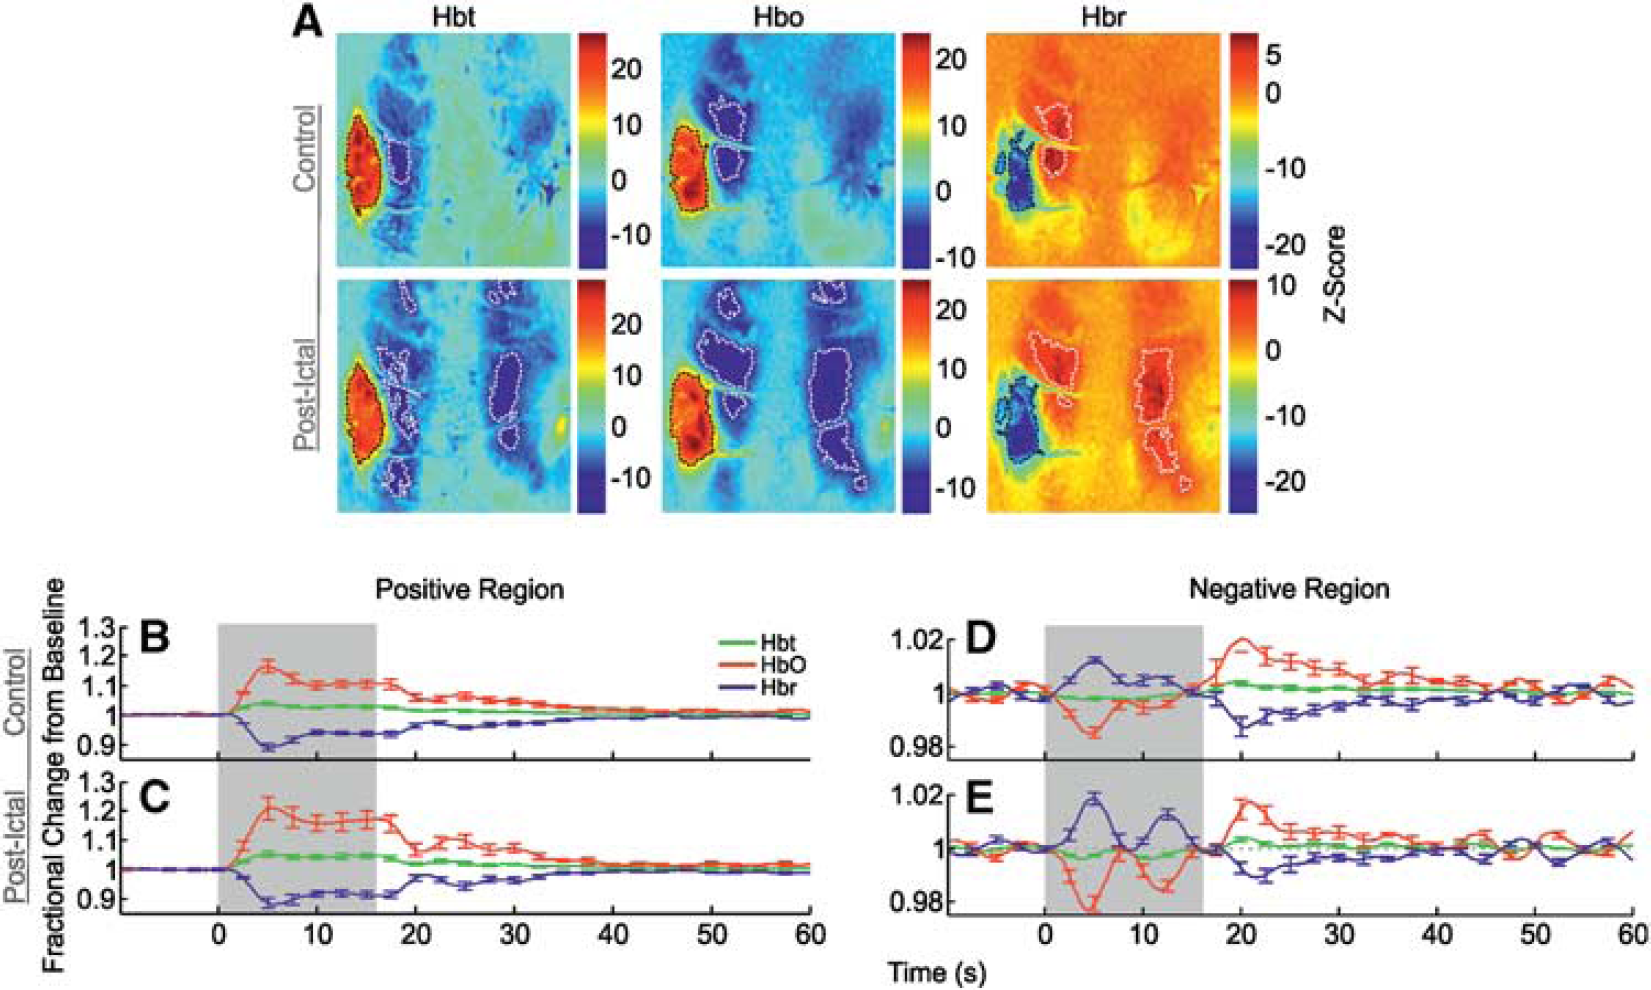
Correspondingly, control stimulation of the left mystacial pad produced stereotypical SPM activation maps of Hbt, HbO, and Hbr in RVC (Figure 3A, in a representative subject). Large increases in Hbt and HbO were observed over the entirety of the vibrissal cortex, with a robust decrease in Hbr colocalized to same general region (delimited as black dashed lines in Figure 3A). In addition to such hallmark spatial responses to stimulation, cortical areas outside the barrel field were also associated with inverted or ‘negative regions’ (encircled as white dashed lines in Figure 3A) where, contrastingly, Hbt and HbO decreased, and Hbr increased. Trial-averaged hemodynamic time series, as fractional changes from baseline, for Hbt, HbO, and Hbr in both positive and negative regions were derived from ROIs and averaged over subjects (Figures 3B and 3E,
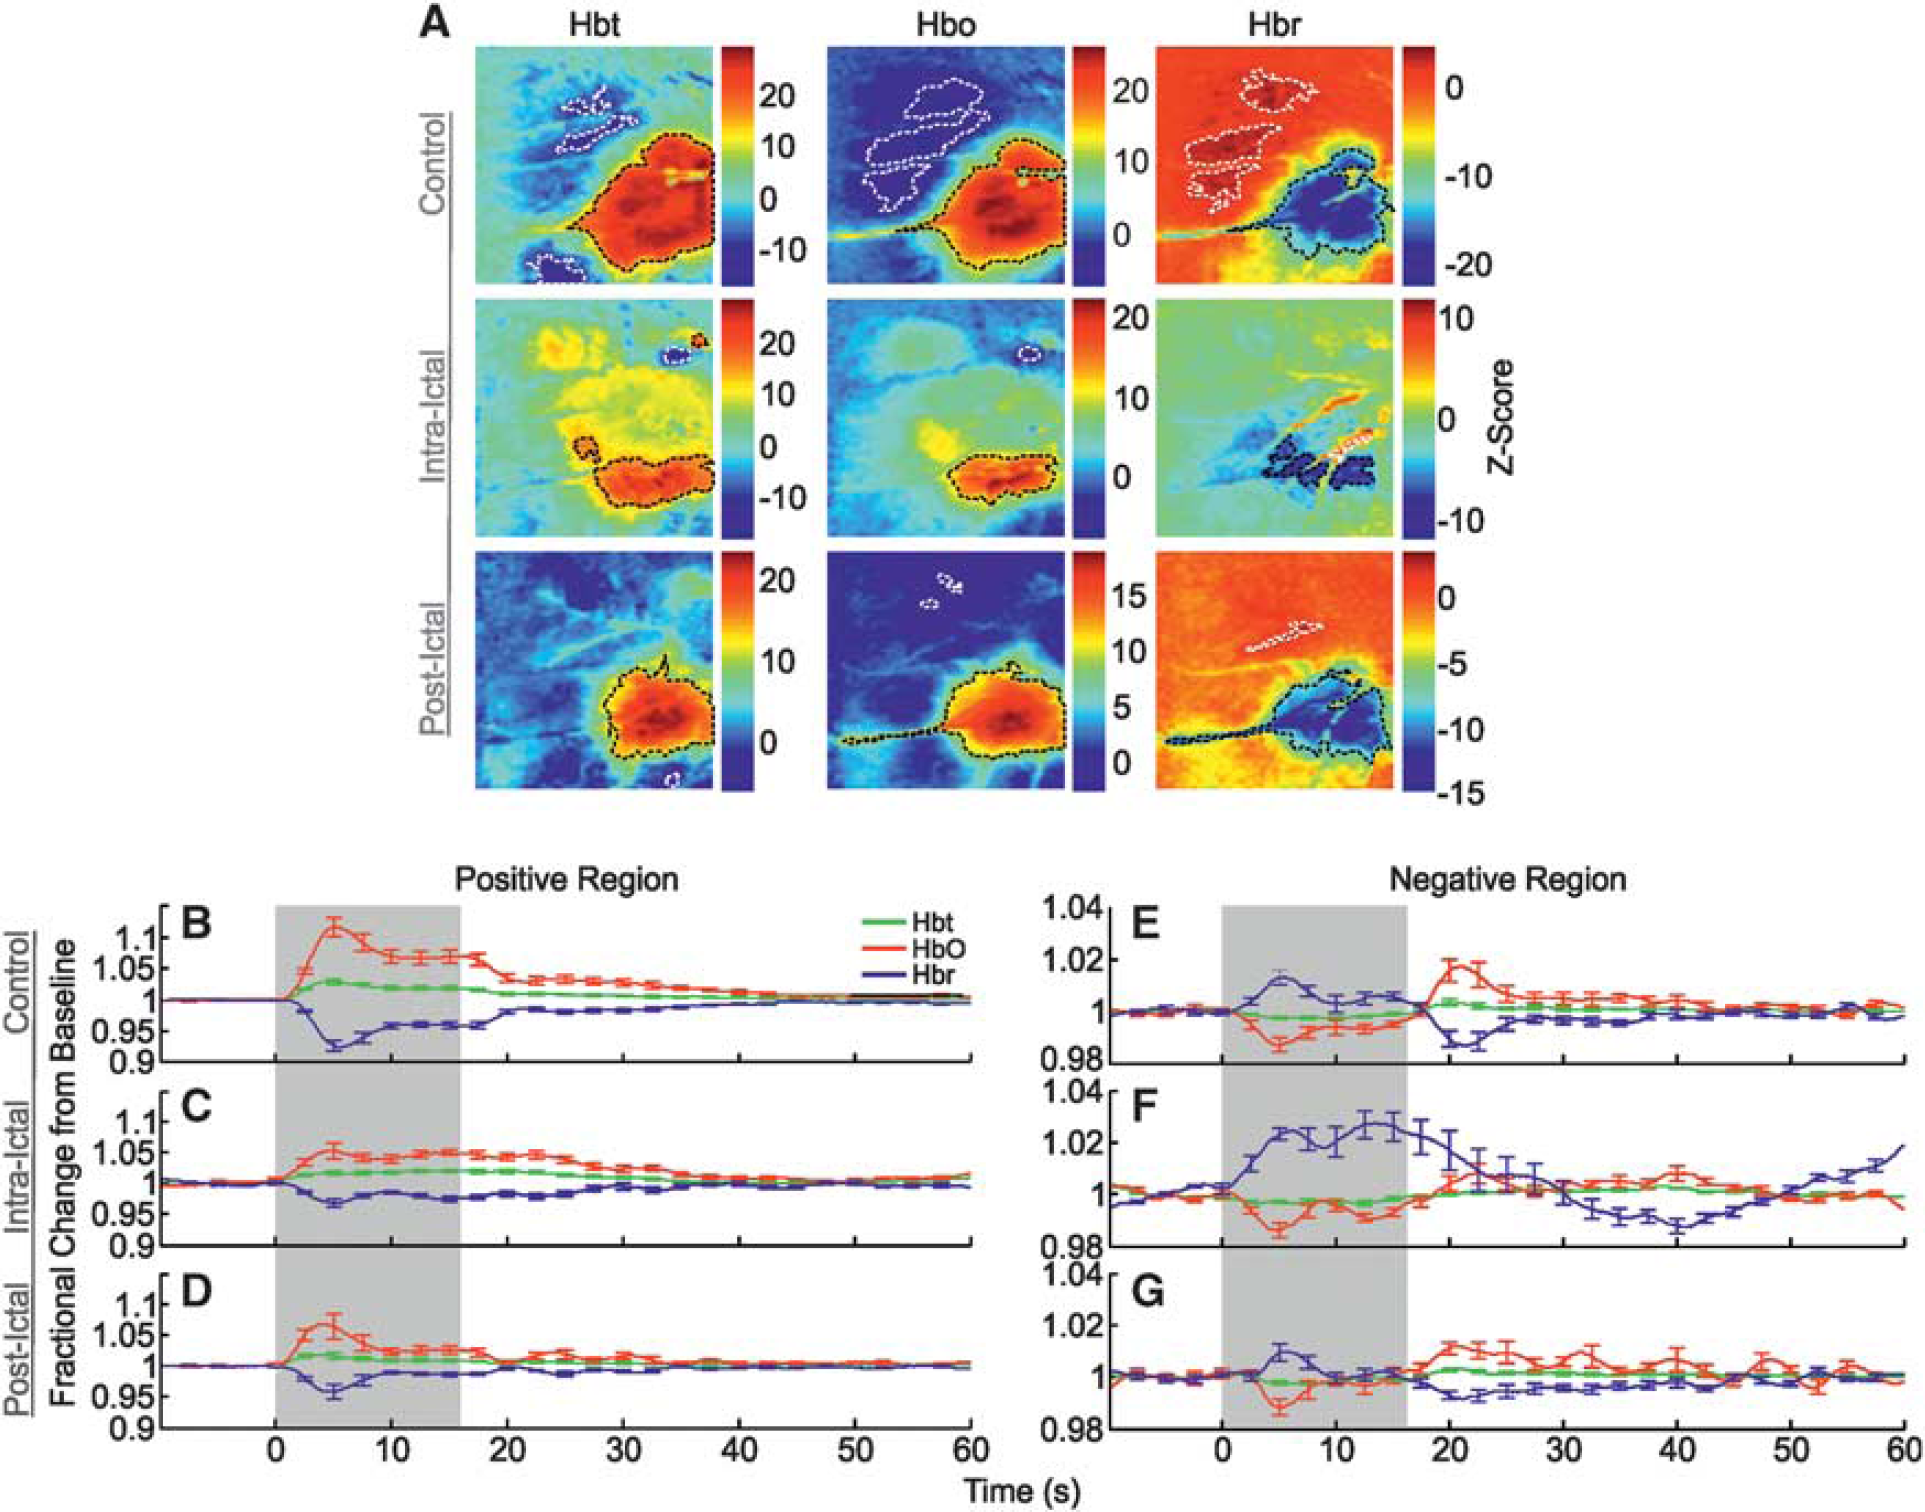
Hemodynamic responses in right vibrissal cortex (RVC) to left mystacial pad stimulation before, during, and after 4-aminopyridine (4-AP) infusion in RVC. (
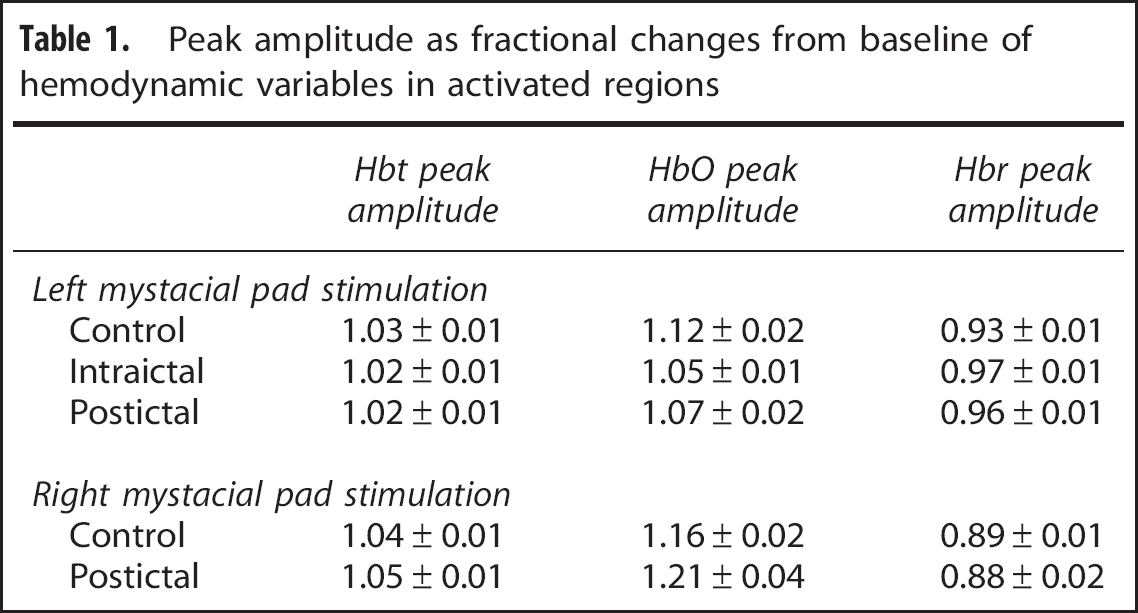
Peak amplitude as fractional changes from baseline of hemodynamic variables in activated regions
Neurovascular Responses During 4-Aminopyridine Seizure Induction
Infusion of 4-AP into the RVC induced ictal-like discharges as described previously.12,13 Pronounced increases in FP activity became observable toward cessation of the infusion period and evolved into distinct spontaneous seizure-like discharges within 8 to 10 minutes after infusion, each lasting ~ 30 to 80 seconds in duration, for up to 2 hours (representative example of continuous FP recordings made from a depth of 700 μm is shown in Figure 4A with individual seizure selected as inset). Continuous measurements of Hbt, HbO, and Hbr micromolar concentration were also concurrently recorded (Figure 4B, from the same subject). Before the end of the infusion period, a marked increase in Hbt and HbO, and a prominent decrease in Hbr, was observed that persisted throughout the remainder of the recordings. To examine this, four time points were selected during the continuous hemodynamic recordings: (1) a baseline measure taken 60 seconds after recording onset, (2) at offset of 4-AP infusion, (3) two-thirds into the recording period, and finally (4), 60 seconds before recording offset. Hbt, HbO, and Hbr micromolar concentrations were extracted in each case and averaged over subjects (Figure 4C,
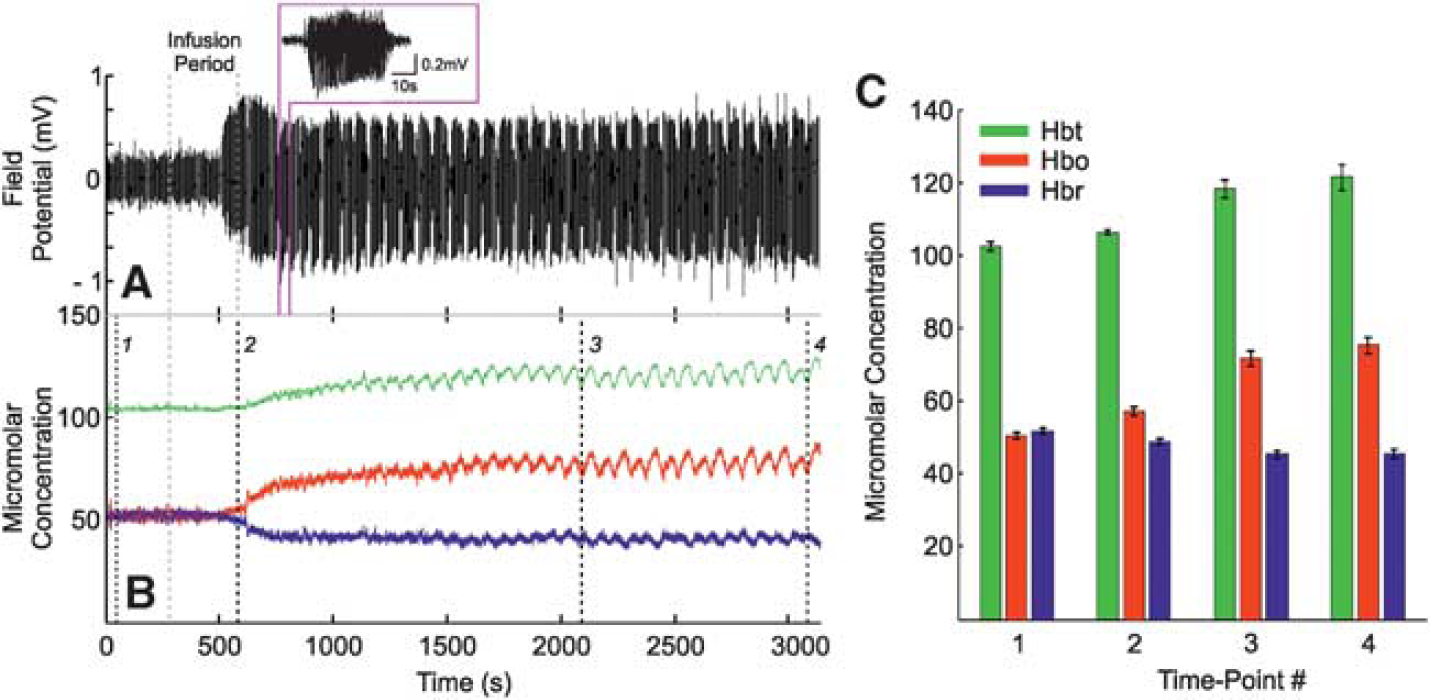
Local neural and hemodynamic baseline changes after 4-aminopyridine (4-AP) infusion in right vibrissal cortex (RVC). (
Neural Responses to Stimulation of Left Mystacial Pad During Local Seizure Discharges
Neural responses to stimulation trials occurring during ictal discharges displayed some notable differences in comparison with control responses. The trial-averaged CSD depth profile (Figure 2B, from the same subject shown in Figure 2A) indicated the layer IV sink to be delayed (peak latency 17.5±1.5 ms,
Hemodynamic Responses to Stimulation of Left Mystacial Pad During Local Seizure Discharges
Trial-averaged time series, as fractional changes from baseline, for Hbt, HbO, and Hbr were once again extracted from SPM-derived ROIs (Figure 3A, in a representative subject) and averaged over subjects (Figure 3C,
Hbt and HbO time series from negative regions (Figure 3F) were roughly comparable to those seen during control (Hbt peak minima: 0.996±0.001 at 6.1 seconds; HbO peak minima: 0.986±0.003 at 4.8 seconds), but displayed smaller and more delayed overshoots after stimulation (Hbt peak maxima: 1.003±0.001 at 38.6 seconds; HbO peak maxima: 1.008±0.004 at 22.4 seconds). The Hbr time series, however, exhibited a much larger increase (Hbr peak maxima: 1.027±0.005 at 13.5 seconds) and a more delayed undershoot (Hbr peak minima: 0.987±0.002 at 40.8 seconds). Negative regions of all variables were reduced in size, with significant decreases in Hbt and HbO response areas (
Postictal Neural Responses to Stimulation of Left Mystacial Pad After Seizure Activity
Postictal neural responses to stimulation 2 hours after seizure induction showed similar dynamics but markedly reduced amplitudes in comparison with control. In this condition, the primary sink peaked earlier (7.9±0.2 ms) and was reduced in terms of amplitude, both at inception, and during subsequent propagation into more superficial layers (Figure 2C, from the same subject shown in Figures 2A and 2B). No significant differences between summed neural activity to postictal stimulation were found between data sets in which intraictal stimulation was conducted (
Hemodynamic Responses to Stimulation of Left Mystacial Pad After Seizure Activity
The SPM maps of hemodynamic responses to stimulation 2 hours after seizure-induction exhibited increases in Hbt and HbO, and decreases in Hbr, that were confined to smaller areas compared with control (Figure 3A). Negative regions were likewise reduced in size and occupied different cortical localities. No significant differences in summed postictal hemodynamic responses were found between subjects in which stimulation trials were delivered during seizure activity (
Finally, negative responses (Figure 3G) consisted of a solitary initial early peak (Hbt peak minima: 0.998±0.001 at 8.8 seconds; HbO peak minima: 0.99±0.003 at 5.1 seconds; Hbr peak maxima: 1.1 ± 0.003 at 5.4 seconds) followed by a later overshoot (undershoot in the case of Hbr) at ~ 21 seconds (Hbt peak maxima: 1.003±0.001 at 20.9 seconds; HbO peak maxima: 1.01±0.003 at 20.6 seconds; Hbr peak minima: 0.99±0.002 at 21.4 seconds) before returning to baseline. Similarly, negative regions of all variables were reduced in area compared with the control condition, but not found to be significant (
Neurovascular Responses to Control and Postictal Stimulation of Right Mystacial Pad
Neural and hemodynamic responses to control stimulation of the right mystacial pad (Figures 5A, 5C, 6A, 6B, and 6D) were, as to be expected, highly comparable to those observed during stimulation of the left mystacial pad (Figures 2A, 2D, 4A, 4B, and 4E); as such, the reader is directed to the description of the latter detailed in earlier text. Interestingly, neurovascular responses to postictal stimulation differed to those in the control condition. The primary current sink was increased in amplitude compared with control, both during initiation and subsequent proliferation into shallower cortical depths (Figure 5B), with no significant difference in peak latency between conditions observed. This was exemplified by an increased initial response in the averaged layer IV sink time series (Figure 5D,
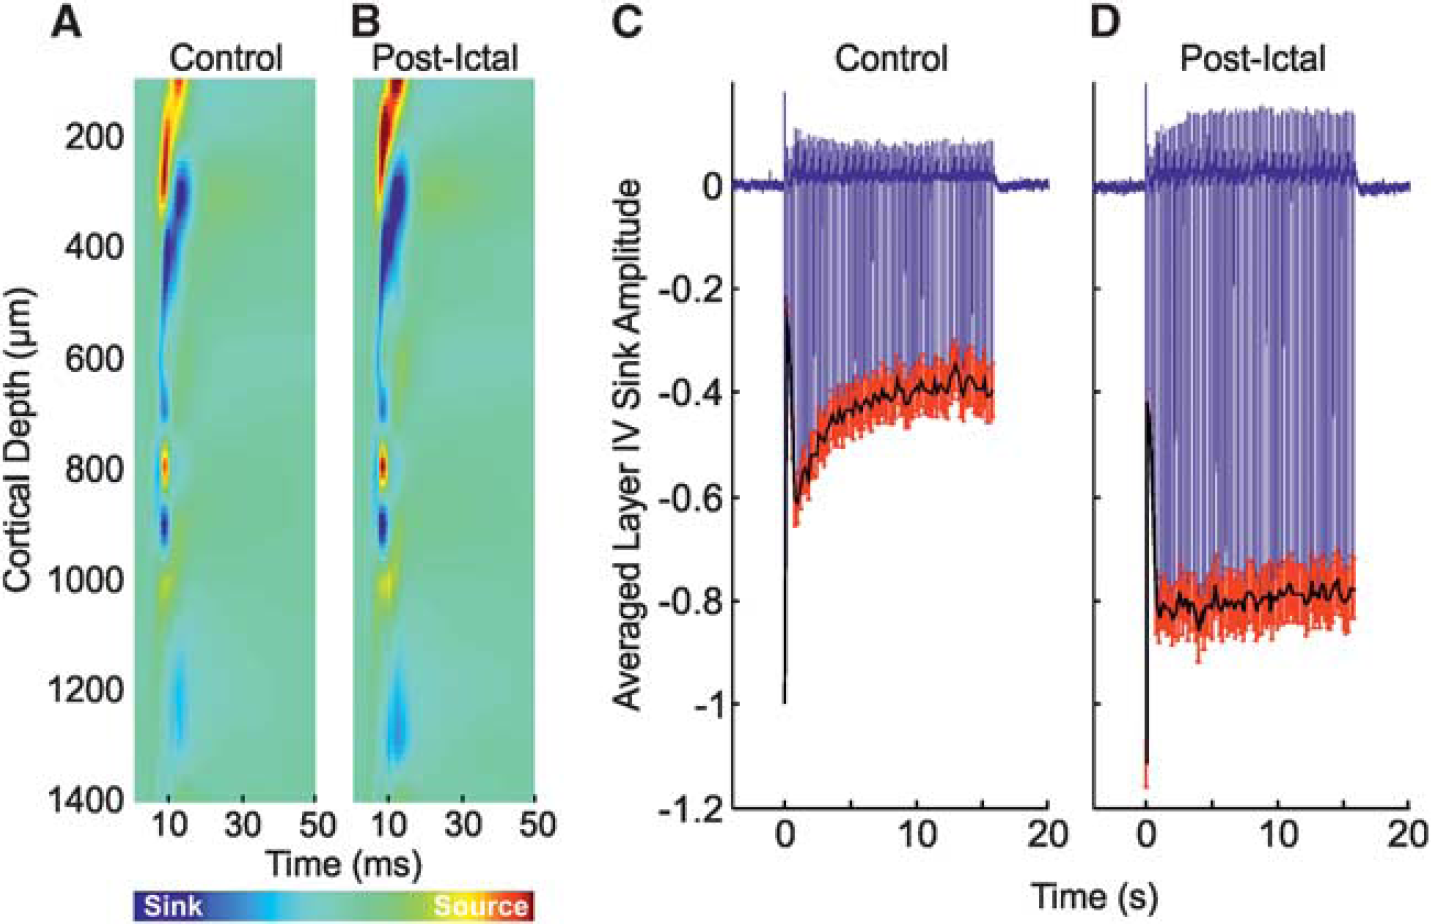
Neural responses in left vibrissal cortex (LVC) to right mystacial pad stimulation before, and after, 4-aminopyridine (4-AP) infusion in right vibrissal cortex (RVC). (
Hemodynamic responses in left vibrissal cortex (LVC) to right mystacial pad stimulation before, and after, 4-aminopyridine (4-AP) infusion in right vibrissal cortex (RVC). (
Epilepsy-Induced Alterations in Sensory-Evoked Neurovascular Coupling
We have shown that neurovascular responses to vibrissal stimulation are modified in sensory cortex in the presence of focal seizure-like discharges, and bilaterally during the postictal period. However, these findings alone are not sufficient to evaluate whether neurovascular coupling is also altered during such conditions. One method of evaluating the changes in the neurovascular coupling relationship is to deconvolve the full-wave rectified neural response time series and Hbt time series from the control condition to produce a hemodynamic impulse response function (IRF) as described previously.8,10,11 Convolution of neural time series in other conditions with this ‘control’ IRF produces predictions of hemodynamic responses under the assumption that the system is linear time invariant. Failure of linear convolution modeling to faithfully predict experimentally obtained Hbt responses is therefore indicative that the neurovascular coupling relationship has undergone a departure from linearity.
Thus, IRFs were derived in each control condition (i.e., ipsilateral and contralateral to SOZ, Figures 7F and 7G) and convolved with evoked neural responses in each condition to yield Hbt response predictions. Unsurprisingly, linear convolution modeling predictions in control conditions ipsilateral and contralateral to SOZ provided appropriate fits to the experimentally obtained Hbt/CBV responses (Figures 7A and 7D), as quantified by the coefficient of determination (
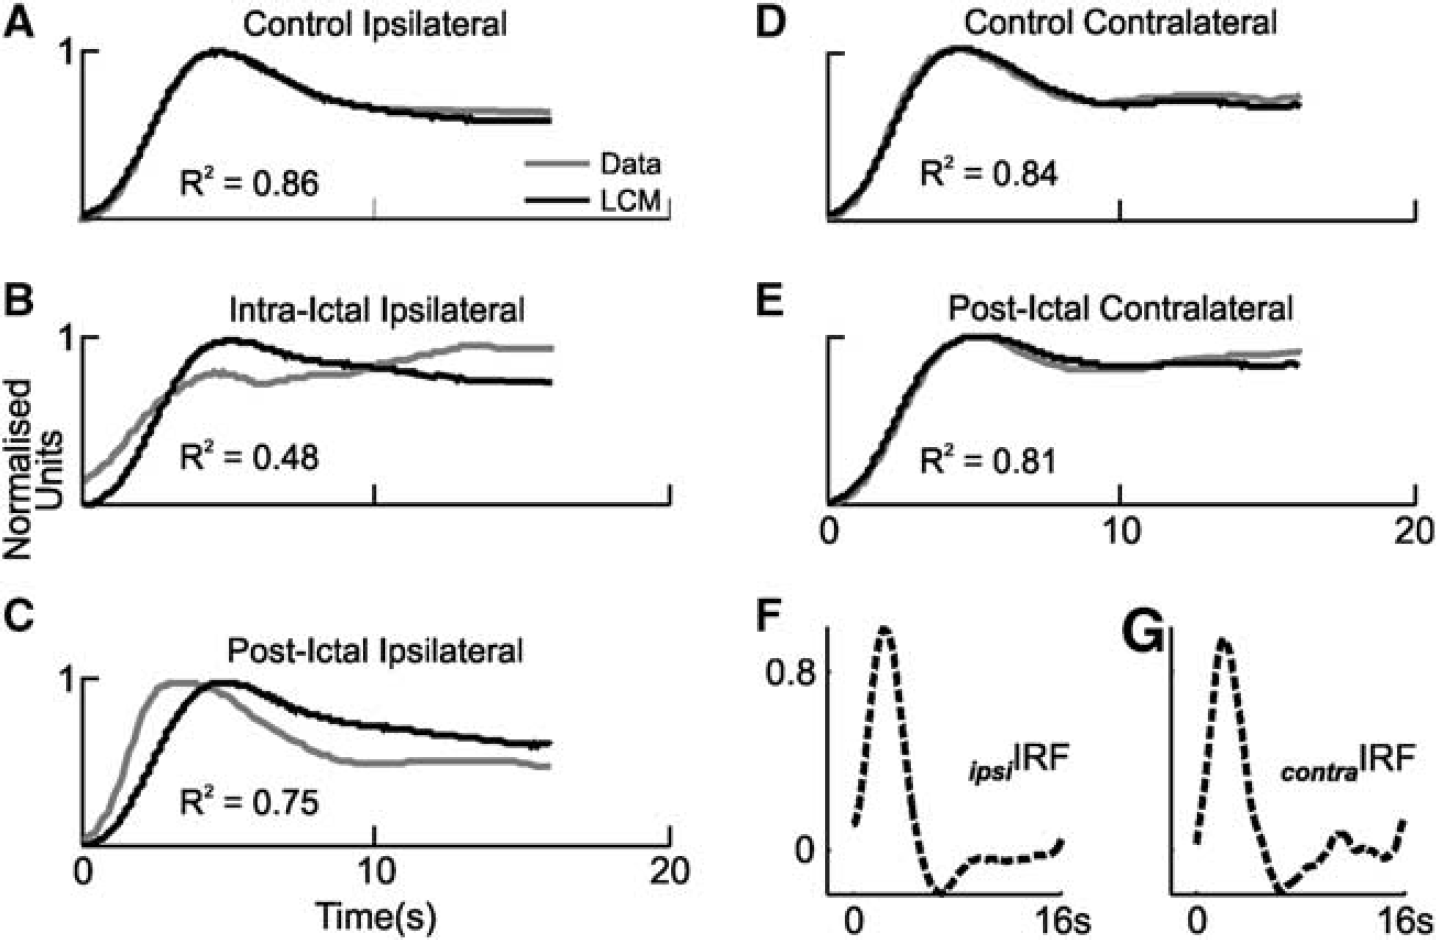
Linear convolution modeling (LCM) predictions of evoked hemodynamic (total hemoglobin, Hbt) responses. (
DISCUSSION
The key findings of this study were the following: (1) sensory-evoked neurovascular coupling in the SOZ is modified during focal ictal-like discharges, (2) induction and persistence of seizure activity after injection of 4-AP produces marked increases in Hbt, HbO, and a decrease in Hbr concentration, in addition to polyphasic alterations underlying each ictal event, (3) sensory-evoked neurovascular responses are significantly reduced in vibrissal cortex ipsilateral to SOZ, and reciprocally enhanced in contralateral vibrissal cortex. These novel observations have implications for understanding sensory-evoked neurovascular coupling and dynamics in focal neocortical epilepsy, the interpretation of noninvasive functional neuroimaging data during epileptic states, and provide insights into the characteristics of the 4-AP model of neocortical seizures in the anesthetized rodent.
Neurovascular Responses During 4-Aminopyridine-Induced Seizure Activity
We have shown there to be a divergence from linearity in the sensory-evoked neurovascular coupling relationship in the SOZ during 4-AP-induced ictal discharges. If debilitation of sensory-evoked neurovascular coupling is taken to reflect an underlying perturbation of neurovascular mechanisms, then our observation supports and extends the suggestion that neurovascular coupling in epilepsy may be altered from the normal state.12,13,25 Taken together, these findings suggest caution when interpreting perfusion-based imaging signals during ictal activity, such as increasingly popular BOLD fMRI, which traditionally assume linearity in neurovascular coupling under the framework of the general linear model. 14 Furthermore, the observed increases in Hbt/CBV and decreases in Hbr after 4-AP infusion may also be an important consideration as most models of the BOLD signal are heavily dependent on baseline cerebral blood flow and Hbr. 26 Accurate interpretation of perfusion-related signals is predicated on a detailed knowledge of the underpinning neurovascular coupling mechanisms, much of which has thus far been derived through examination of sensory-evoked neurovascular responses in anesthetized rodent preparations.5–7,9,10,16,20,21,27 Since the use of noninvasive functional mapping seems destined to play an increasingly important role in identification of epileptogenic foci and adjacent functional cortex, 28 insights into neurovascular coupling during seizures, such as those presented here, are central to enabling their faithful interpretation.
Contemporaneous with local seizure activity, we observed neural responses to undergo strong adaptation and exhibit temporal broadening, which may be ascribed to the action of 4-AP that produces prolonged presynaptic depolarization leading to increases in inhibitory and, particularly, excitatory neurotransmitter release.29,30 We and others have suggested that the ‘peak and plateau’ response to long duration stimulation may represent two distinct neurovascular coupling components; an initial transient arterial backwards dilation followed by an increase in CBV colocalized to the region of neuronal activation and possibly of metabolic origin, respectively. 10 The slower hemodynamic response dynamics during stimulation in the presence of ictal activity, which lacked the prominent ‘peak’ component compared with control, may therefore reflect a reduced capacity for further arterial dilation in the presence of the large increases in Hbt/CBV that was observed after seizure induction.
Modulation of Postictal Neurovascular Responses
The significant reduction in sensory-evoked neurovascular responses ~ 2 hours after regional seizure induction may have several explanations. 4-AP-induced seizure activity can promote neurodegeneration through excitotoxic mechanisms mediated by
Interestingly, we also observed an enhancement of post-ictal sensory-evoked neural responses in vibrissal cortex contralateral to the SOZ. This might be ostensibly attributed to some form of disinhibition of commissural projections between RVC and LVC known to underpin bilateral integration of sensory responses to vibrissal stimulation. 34 However, a recent study using focal photothrombotic model of stroke and somatosensory stimulation in rat has shown there to be significantly enhanced sensory activation in contralesional, unaffected, cortices after stroke. 35 Such enhancements were suggested to be likely mediated by subcortical connections, rather than transcallosal projections, with disinhibition of contralesional thalamic nuclei rendering these more responsive to ascending sensory inputs. 35
Possible Clinical Significance
Although care should be exercised when extrapolating our findings to the human epileptic brain it is tempting to speculate on the potential implications of our results. For example, in instances where epileptogenic foci are believed to be within sensory regions, the use of appropriate stimulation paradigms and evaluation of evoked neurovascular coupling before and during seizures, and subsequent mapping of areas where it is comparatively disrupted, might provide a useful adjunct when localizing the SOZ. A caveat to this is the preponderance of BOLD fMRI paradigms in epilepsy conducted during interictal periods, rather than ictal periods, mainly due to unpredictability, noise, and safety considerations associated with the latter. Notwithstanding, interictal and ictal activity may not always be colocalized, 36 and there has thus been considerable interest gaining in ictal electro-encephalogram-fMRI studies 37 as localization of fMRI correlates of electrophysiologic seizure events may be a more efficacious method of identifying the epileptogenic zone. However, though ictal electroencephalogram-fMRI studies have typically convolved electrophysiologic discharges with a canonical hemodynamic response function to characterize seizure-related BOLD signal changes, reservations about the reliability of this general linear model approach in pathologic conditions have led to novel data-driven methods (including independent component analysis) being recently developed. 36
Our finding of a postictal reduction in sensory function at the site of the epileptic focus is consistent with evidence of postictal diminishment of auditory event-related potentials ipsilateral to the epileptogenic zone, which have been suggested to be of localizing value in patients with temporal lobe epilepsy. 4 However, we could find no reports of reciprocal enhancements of sensory function in cortex contralateral to SOZ. Additional clinical research may shed further light on the possibility that sensory function is augmented in contralateral cortical regions immediately after intense recurrent focal seizures, which may provide a secondary method with which to confirm laterality of the epileptogenic zone. Our finding of preserved postictal sensory-evoked neurovascular coupling suggests that perfusion-based imaging techniques would be suitable in this regard. This may also lead to a greater understanding of the impact of seizure-induced modulation of sensory function on cognitive and behavioral deficits in focal neocortical epilepsy. Finally, the data also enlighten the interpretation of intraoperative optical imaging experiments for localizing ictal and functional cortex.28,38
Methodological Considerations
In this study, we used regional injection of 4-AP to generate focal ictal-like events in the somatosensory cortex of the urethane-anesthetized rat, which enabled the use of invasive recording techniques with high spatial and temporal resolution. This acute epilepsy model remains the only
Urethane provides a long-lasting and stable depth of surgical anesthesia, and has been shown to preserve excitatory (glutamate mediated) and inhibitory (GABAA and GABAB mediated) synaptic transmission, in contrast to many general anesthetics that are thought to enhance GABAergic and inhibit glutamatergic transmission. 40 Neurovascular coupling is also preserved under urethane such that a single whisker deflection elicits a hemodynamic response in the rat barrel cortex. 16 These properties have led to the common use of urethane when investigating neural-hemodynamic coupling.7–11,16–18,20–22 Although other studies have preferred the use of α-chloralose, the choice of α-chloralose or urethane was not found to affect the spatial-temporal pattern of the evoked hemodynamic response, 27 nor the relationship between neural activity and BOLD fMRI responses. 22
Footnotes
The authors declare no conflict of interest.
ACKNOWLEDGEMENTS
The authors thank the technical staff of the University of Sheffield's Department of Psychology: Marion Simkins, Natalie Kennerley, and Michael Port.