
Abstract
Apoptosis plays a critical role in many neurologic diseases, including stroke. Cytochrome c release and activation of various caspases are known to occur after focal and global ischemia. However, recent reports indicate that caspase-independent pathways may also be involved in ischemic damage. Apoptosis-inducing factor (AIF) is a novel flavoprotein that helps mediate caspase-independent apoptotic cell death. AIF translocates from mitochondria to nuclei where it induces caspase-independent DNA fragmentation. Bcl-2, a mitochondrial membrane protein, protects against apoptotic and necrotic death induced by different insults, including cerebral ischemia. In the present study, Western blots confirmed that AIF was normally confined to mitochondria but translocated to nuclei or cytosol 8, 24, and 48 hours after onset of ischemia. Overall, AIF protein levels also increased after stroke. Confocal microscopy further demonstrated that nuclear AIF translocation occurred in the peri-infarct region but not in the ischemic core where only some cytosolic AIF release was observed. Our data also suggest that AIF translocated into nuclei after cytochrome c was released into the cytosol. Bcl-2 transfection in the peri-infarct region blocked nuclear AIF translocation and improved cortical neuron survival.
Apoptosis plays a critical role in various neurologic diseases, including stroke (Graham and Chen, 2001; MacManus and Buchan, 2000; Mattson, 2000). During apoptosis, cytochrome c is released into the cytosol from the mitochondria and forms apoptosomes with Apaf-1 and pro-caspase-9. Pro-caspase-9 and pro-caspase-3 are then cleaved and activate caspase-activated DNase (CAD), which causes DNA fragmentation (Enari et al., 1998; Zimmermann et al., 2001). Both global and focal ischemia cause cytochrome c release and caspase activation (Cao et al., 2002; Fujimura et al., 1998; Schulz et al., 1999). However, caspase inhibition only partially protects against ischemic damage (Loetscher et al., 2001; Sugawara et al., 2002; Zhan et al., 2001), and no caspase activity is detected in some stroke models (Gill et al., 2002; Yenari et al., 2002), suggesting the involvement of caspase-independent pathways.
A possible candidate for a caspase-independent apoptogenic protein is apoptosis-inducing factor (AIF), a 57 kDa flavoprotein with a ~100 amino acid mitochondrial localization sequence (MLS) at its N-terminus (Susin et al., 1999b). The AIF precursor protein is synthesized in the cytoplasmic ribosomes and imported into the mitochondrial intermembrane space, where the MLS is cleaved, producing mature AIF. AIF is normally confined to the mitochondrial intermembrane space in healthy cells (Daugas et al., 2000b; Lorenzo et al., 1999; Susin et al., 1999b), and purified AIF exhibits NADH oxidase activity while superoxide anion (O2−) is formed in vitro (Miramar et al., 2001). However, its physiologic role is unclear. Regardless, during apoptosis AIF translocates to the cytosol and to the nucleus in HeLa, Rat-1, or Jurkat cells (Lorenzo et al., 1999; Susin et al., 1999a, 1999b; Wilson, 1998). When recombinant AIF is injected into the cytoplasm of intact cells or added to purified nuclei from HeLa cells, it causes the nucleus to undergo peripheral chromatin condensation and triggers large-scale DNA degradation to fragments of ~50 kbp (Susin et al., 1999b). AIF also induces purified mitochondria to release cytochrome c and caspase-9, suggesting that AIF, once released from mitochondria, accelerates membrane permeabilization in a positive feedforward loop (Susin et al., 1999b). All of these changes can occur in the presence of saturating doses of the wide-ranging caspase inhibitor Z-VAD.fmk, suggesting that AIF acts in a caspase-independent manner. AIF translocation occurs in neurons damaged by pneumococcus and Zn2+ (Braun et al., 2001; Jiang et al., 2001) and p53 (Cregan et al., 2002) in vitro. A recent study indicates that AIF mediates Poly(ADP-ribose) polymerase-1 (PARP-1)-dependent neuronal death (Yu et al., 2002). In vivo, AIF translocation occurs in retinal detachment induced by subretinal injection of sodium hyaluronate (Hisatomi et al., 2001). Most recently, it was demonstrated that AIF translocation occurs after traumatic brain injury in rats (Zhang et al., 2002), focal cerebral ischemia (Ferrer and Planas, 2003), hypoxia-ischemia in the neonatal rat brain (Zhu et al., 2003), and transient global ischemia in rats (Cao et al., 2003).
Bcl-2 can block both apoptosis (Israels and Israels, 1999) and necrosis (Kane et al., 1993, 1995), in part by blocking release of cytochrome c and AIF in vitro (Cregan et al., 2002; Daugas et al., 2000b; Zimmermann et al., 2001). We and others have previously shown that overexpression of Bcl-2 using defective herpes simplex viral (HSV) vectors protects against excitotoxic and ischemic neuronal insults in vitro and in vivo (Antonawich et al., 1999; Dumas et al., 2000; Jia et al., 1996; Lawrence et al., 1996, 1997; Linnik et al., 1995; Phillips et al., 2000; Sapolsky and Steinberg, 1999). Bcl-2 overexpression before ischemia induced by permanent occlusion of the middle cerebral artery (MCA) and the ipsilateral common carotid artery (CCA) protected cortical tissue assessed 24 hours after ischemia onset (Linnik et al., 1995). Overexpression using gene transfer also attenuated striatal neuron loss in a suture model of MCA occlusion, whether the Bcl-2-containing vector was delivered before (Lawrence et al., 1996) or after ischemia onset (Lawrence et al., 1997). Using a distal MCA occlusion model in the rat, we have demonstrated previously that Bcl-2 protects against ischemic neuron loss and blocks cytochrome c release and caspase-3 activation (Zhao et al., 2003). Here we report that AIF translocates into the cytosol and nuclei after stroke and over-expression of Bcl-2 blocks AIF translocation.
MATERIALS AND METHODS
Experiments were conducted in accordance with guidelines for the care and use of laboratory animals approved by the Stanford University Administration on Laboratory Animal Care.
Focal cerebral ischemia
The model used has been described previously (Hsu et al., 1993). Anesthesia for Sprague-Dawley rats (290–350 g) was induced by 5% isoflurane and maintained by 2–3% isoflurane. A ventral midline incision was made, and the two CCAs were isolated. Snares were placed around the CCAs, and the animal was placed on its right side. A 2-cm vertical scalp incision was made midway between the left eye and ear. The temporalis muscle was bisected and a 2-mm burr hole was made at the junction of the zygomatic arch and squamous bone. The distal MCA was then exposed and ligated above the rhinal fissure with a 10–0 suture. The CCA snares were tightened to occlude the CCAs for 2 hours and were then released, while the distal MCA remained occluded.
Herpes simplex viral-mediated gene transfer
HSV vectors were generated as previously described (Lawrence et al., 1996). HSV Bcl-2 vector (designated pα22βgalα4bcl-2) containing the human bcl-2 gene and the Escherichia coli lacZ gene, and a control vector (designated α4s) that does not contain bcl-2 gene, were generated. Between 12 and 14 hours before ischemia onset, 3 μL of either Bcl-2 vector or control vector was infused bilaterally to the cortex at a region corresponding to the infarct border (from bregma: anterior-posterior (AP) = −2 mm, medial-lateral (ML) = 2.8 mm, dorsal-ventral (DV) = 1.7 mm). The numbers of infectious vector particles infused were as follows: Bcl-2 vector, 8.1–11 × 103, control vector, 8.4–8.9 × 10³. Vector:helper ratios were 1:1.6–2.0 for the Bcl-2 vector and 1:1.4–1.7 for the control vector. We have previously demonstrated that Bcl-2 and control vectors transfect neurons with similar efficiency (Zhao et al., 2003).
Western blots
A separate set of animal brains subjected to similar experimental conditions was harvested 8, 24, and 48 hours after the onset of ischemia. Animals were perfused transcardially with normal saline, and the brain was quickly removed. The portion corresponding to regions I (the peri-infarct region) to III (part of ischemic core) shown in Fig. 1 was rapidly dissected. Corresponding samples were prepared from the contralateral, non-ischemic side. The samples of whole-cell protein and subcellular fractionation of mitochondria and cytosol from the cortex were processed as previously described (Yenari et al., 2002). For subcellular fractionation of nuclei, samples were prepared by the method of Huang and associates (Huang et al., 2001). Whole-cell fraction, cytosolic, mitochondrial, and nuclear fractions (10 μg protein/lane) were subjected to 7.5% or 10% sodium dodecyl sulfate-polyacrylamide gel electrophoresis (SDS-PAGE) for 1.5 hour. Protein bands were transferred from the gel to polyvinylidene fluoride (Millipore, Bedford, MA, U.S.A.) membranes for 1 hour. To confirm equal loading of the lanes, membranes were stained with 0.1% Ponceau Red (Sigma) in 5% acetic acid for 5 minutes, and the total amount of protein loaded on each lane was measured using an optical densitometer (GS-700 imaging densitometer, Bio-Rad, Hercules, CA, U.S.A.). Membranes were then probed for AIF by incubating in the primary antibody (purified rabbit anti-AIF antibody 1:2000, AB 16501, Chemicon International, Temecula, CA, U.S.A.) for 1 hour, followed by a horseradish peroxidase-conjugated secondary anti-rabbit antibody (1:2000, Santa Cruz Biotechnology). This antibody was raised against a peptide corresponding to amino acids 517 to 531 of human AIF, which is identical to those of mouse and rat AIF (Susin et al., 1999b). To verify accurate separation of the cellular sub-fractions of mitochondria and cytosol, separate aliquots of the same mitochondria and cytosolic samples were subjected to 15% SDS-PAGE, and membranes were probed for the mitochondrial marker cytochrome c oxidase (COX; 1 g/mL; 20E8-C12, Molecular Probes, Eugene, OR, U.S.A.) and the nuclear marker TFIID basal transcription factor (1:500, rabbit polyclonal antibody, Santa Cruz Biotechnology), as previously described (Huang et al., 2001). The nuclear subcellular fraction was also checked using the antibody against TFIID. Protein bands were detected using an enhanced chemiluminescence system (Amersham, Arlington Heights, IL, U.S.A.) and exposed to roentgen film. Films were scanned by an optical densitometer and analyzed using Multi-Analyst software (Bio-Rad).
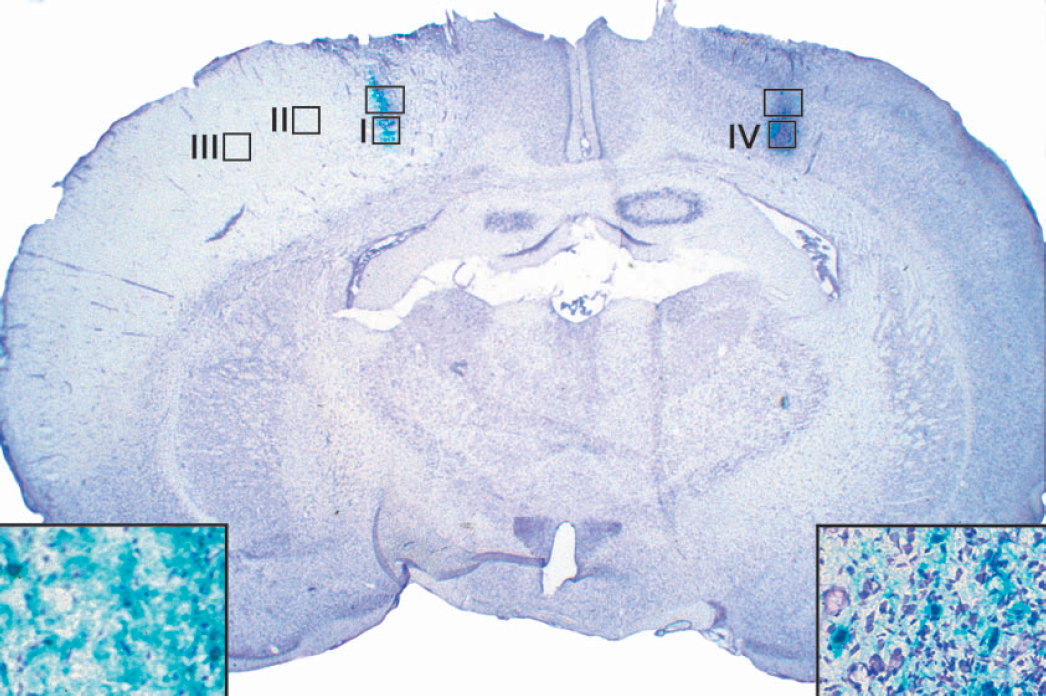
A representative brain section from an animal transfected with control vector reveals the targeted area (rectangles) and, at a higher magnification (inserts), β-gal-positive neurons (blue) in the ischemic and control hemisphere. The four regions (squares) analyzed by confocal microscope in this study are the infarct margin (I), the transitional region from the infarct margin to the infarct core (II), the core infarct (III), and the nonischemic cortex (IV).
Histochemistry and laser-scanning confocal microscopy
Double or triple-label fluorescence confocal microscopy was performed on brain sections transfected with HSV vectors from animals subjected to 2 hours of distal MCA occlusion. Animals were killed 2, 4, 8, or 48 hours later with an overdose of halothane, and brain sections were prepared and analyzed as previously described (Yenari et al., 1998, 2001). Briefly, rats were perfused transcardially with normal saline followed with 3% paraformaldehyde (PFA). Brains were post-fixed with 3% PFA, 20% sucrose for 24 hours. Thirty-micrometer sections were cut onto glass slides in the coronal plane using a cryostat. One of every three consecutive sections was stained with X-gal and counterstained with cresyl violet to determine if transfection was successful. Seven to ten slices adjacent to slices that were positive for X-gal were selected for immunostaining. Tissues were treated with proteinase K (1:2 dilution, Dako, Carpinteria, CA, U.S.A.) in phosphate-buffered saline (PBS; 10 mM) for 15 minutes, and washed in PBS for 3 × 5 minutes. Sections were blocked in PBS containing 5% donkey serum (Sigma, St. Louis, MO, U.S.A.), 1% Bovine Serum Albumin (BSA), and 0.3% triton X-100 for 1 hour at room temperature, then incubated in the primary antibodies diluted in blocking solution at 4°C overnight. Sections were washed with PBS and incubated for 2 hours at room temperature (light shielded) in the two secondary antibodies diluted in blocking solution. Sections were washed with PBS then incubated in mounting media containing 4′6-diamindino-2-phenylindole (DAPI) (Vector Laboratories, Inc., Burlingame, CA, U.S.A.) for 2 minutes, then washed again with PBS for 10 minutes. Sections were cover-slipped and examined under a LSM510 confocal laser scanning microscope (Carl Zeiss, Thornwood, NY, U.S.A.). Negative controls, in which the primary antibodies were omitted, were run in parallel. Double staining of AIF and cytochrome c, or AIF and β-gal, was performed. Primary antibodies of purified mouse anti-cytochrome c antibody (1:500, Cat. no. 556432, PharMingen, San Diego, CA, U.S.A.), purified rabbit anti-AIF antibody (1:200, AB 16501, Chemicon International), and mouse monoclonal anti-β-galactosidase (1:200, Clone Gal-13, Product No. G8021, Sigma) were used. The secondary antibodies were Cy3-conjugated donkey anti-rabbit IgG (1:200, Jackson ImmunoResearch, West Grove, PA, U.S.A.), and Fluorescein (FITC)-conjugated donkey anti-mouse IgG (1:200, Jackson ImmunoResearch).
Cell counts
We previously showed that the bipromoter vector expresses transgene and reporter gene in a similar fashion (Lawrence et al., 1996; McLaughlin et al., 2000; Yenari et al., 2001). The distribution of expression caused by several vectors has been examined in detail, including glucose transporter (GT), heat shock protein 72 (HSP72), calbindin D28K (CaBP) and Bcl-2, initially by quantifying transgene expression immunohistochemically (Fink et al., 1997; McLaughlin et al., 2000; Yenari et al., 1998, 2001). GT-positive, CaBP-positive, and HSP72-positive neurons were easily quantified in vitro and in vivo, as were Bcl-2-positive neurons in vitro. However, Bcl-2 staining was not sufficiently discrete in vivo to quantify the number of neurons infected (Antonawich et al., 1999; McLaughlin et al., 2000); this was the case using a variety of antibodies, different fixatives and staining protocols, floating or slide-fixed sections, and with horseradish peroxidase or fluorescent secondary visualization (Antonawich et al., 1999; McLaughlin et al., 2000). The reporter gene driven by the bipromoter transcriptional unit (β-gal), however, shows greater than 98% covariance in expression with the transgene (Fink et al., 1997). Furthermore, we have shown that HSV is neurotrophic (Yenari et al., 2001). Thus we determined whether Bcl-2 protected against ischemic neuron loss by comparing the number of transfected, X-gal-positive neurons in the ischemic hemisphere with the number in the contralateral hemisphere (Yenari et al., 1998, 2001). All β-gal-positive neurons and neurons double-labeled with β-gal and nuclear AIF were counted under the confocal microscope from 7–10 consecutive sections as described above. The number of β-gal-positive neurons that showed AIF nuclear translocation was normalized to the total number of β-gal-positive neurons.
Statistics
One-way ANOVA followed by Student-Newman-Keuls post hoc tests were used as indicated. Data are presented as means ± SD.
RESULTS
Bcl-2 transfection mediated by herpes simplex viral vectors protects against ischemic neuron loss
Consistent with our previous reports (Lawrence et al., 1996, 1997), Bcl-2 overexpression improved cortical neuron survival. Relative survival is represented as the percent of β-gal-expressing neurons remaining in the occluded hemisphere versus the contralateral hemisphere. Neuron survival was 85 ± 21% in animals treated with Bcl-2 vectors, which was significantly higher than 50 ± 19% in animals transfected with control vectors (P < 0.01, t-test).
Mitochondrial release of AIF
Mature mitochondrial AIF is a ~57 kDa protein, whose apparent molecular mass determined by SDS-PAGE is ~67.5 kDa, approximately 10 kDa more than expected because of migration behavior (Miramar et al., 2001). Consistent with previous studies (Miramar et al., 2001; Susin et al., 1999b), a single AIF band was detected in the mitochondria but not in the cytosol or nucleus fractions of nonischemic cortex (Fig. 2). Ischemia caused the appearance of AIF in cytosol and nuclei, commensurate with AIF translocation. The two bands observed after ischemia in some lanes of the cytosolic and mitochondrial fractions suggest that there may have been AIF protein degradation or cleavage. In addition, the depletion of mitochondrial AIF 8 hours after ischemia was followed by a marked increase 24 hours after ischemia. Western blots of whole cell lysates showed that overall AIF levels also increased (Figs. 2 and 3), indicating that not only was AIF translocated in response to ischemia, but ischemia triggered upregulation of the protein as well.
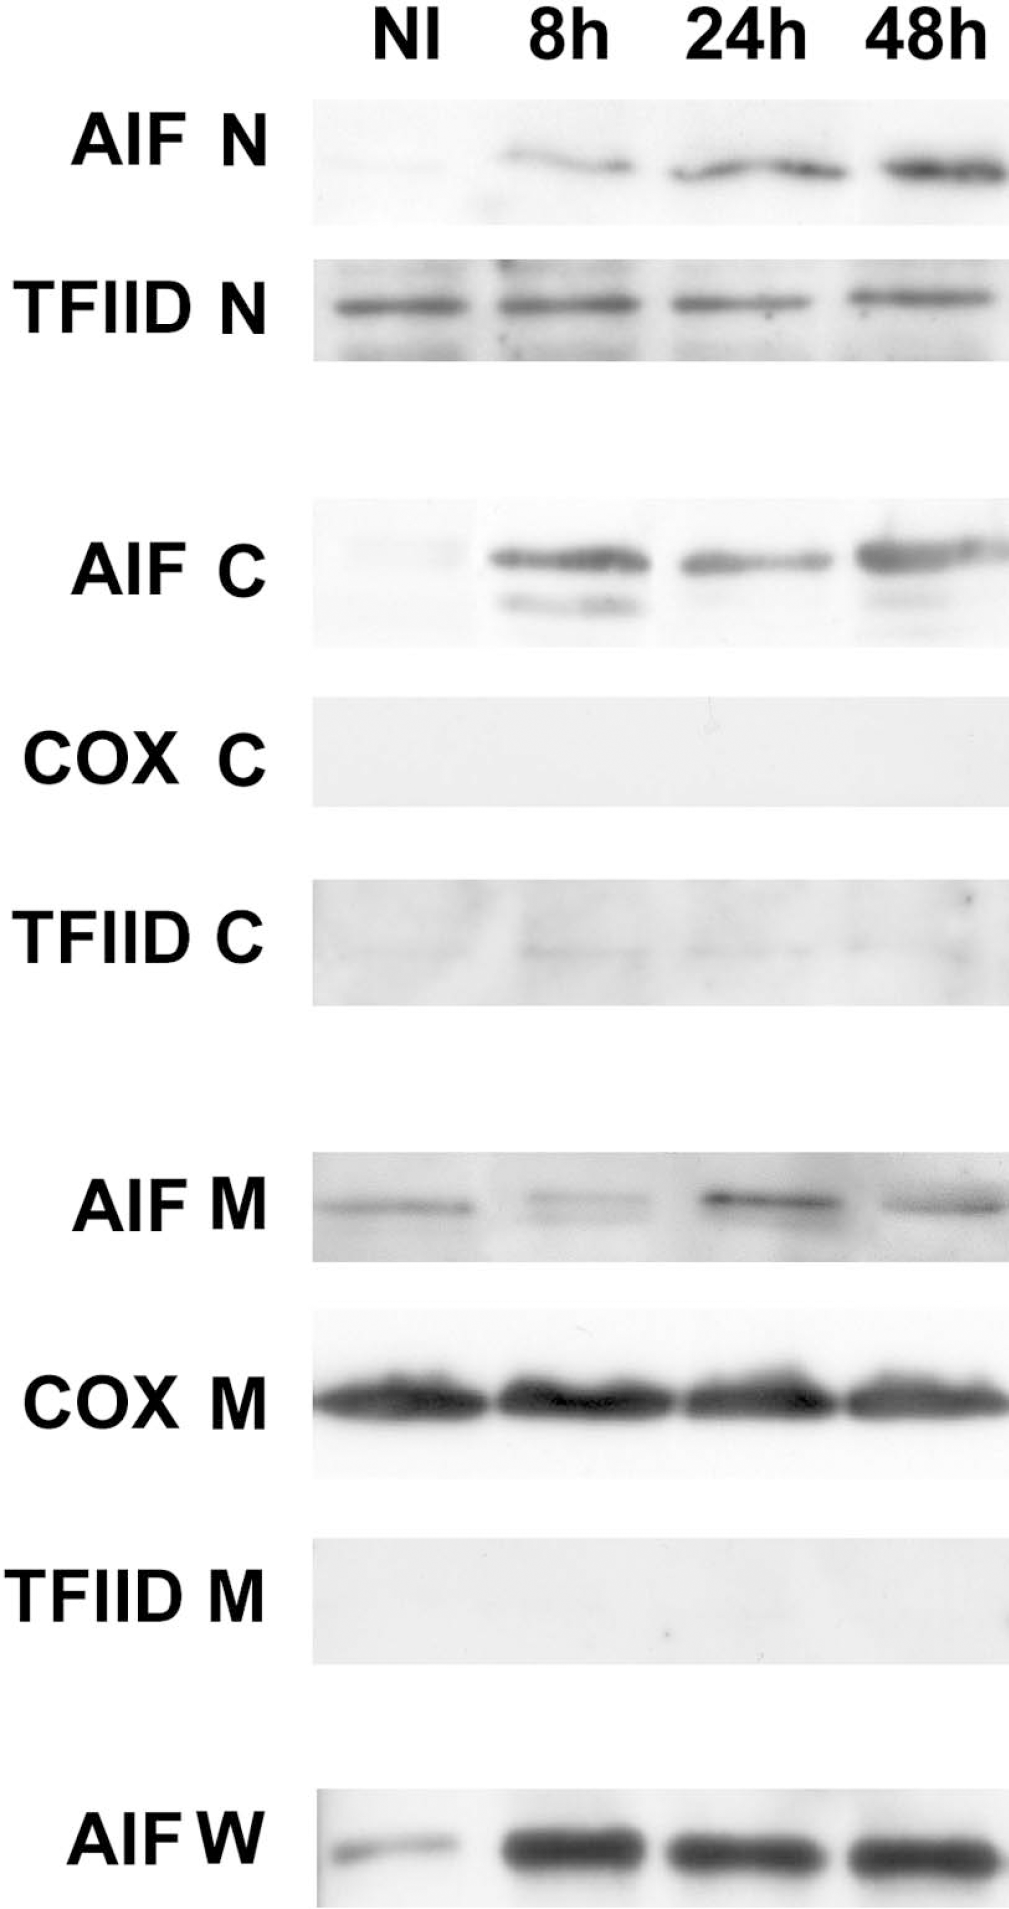
Western blots of subcellular fractions isolated from ischemic cortex demonstrate that AIF redistributed from the mitochondria to the cytosol and nucleus. Whole-cell homogenates show that overall protein levels increased 8, 24, and 48 hours after ischemia onset (NI, nonischemic cortex). The equal loading of protein was confirmed by Ponceau Red staining (data not shown). Western blots of TFIID indicate the nuclear subcellular fraction. Western blots of COX and TFIID show bands only within the mitochondrial and nuclear fractions, respectively, confirming successful separation of mitochondria, cytosol and nuclear fractions. Each band represents three animals. Western blots were repeated three times. AIF, apoptosis-inducing factor; COX, cytochrome oxidase; N, nuclear subfraction; C, cytosolic subfraction; M, mitochondrial subfraction; W, whole-cell protein.
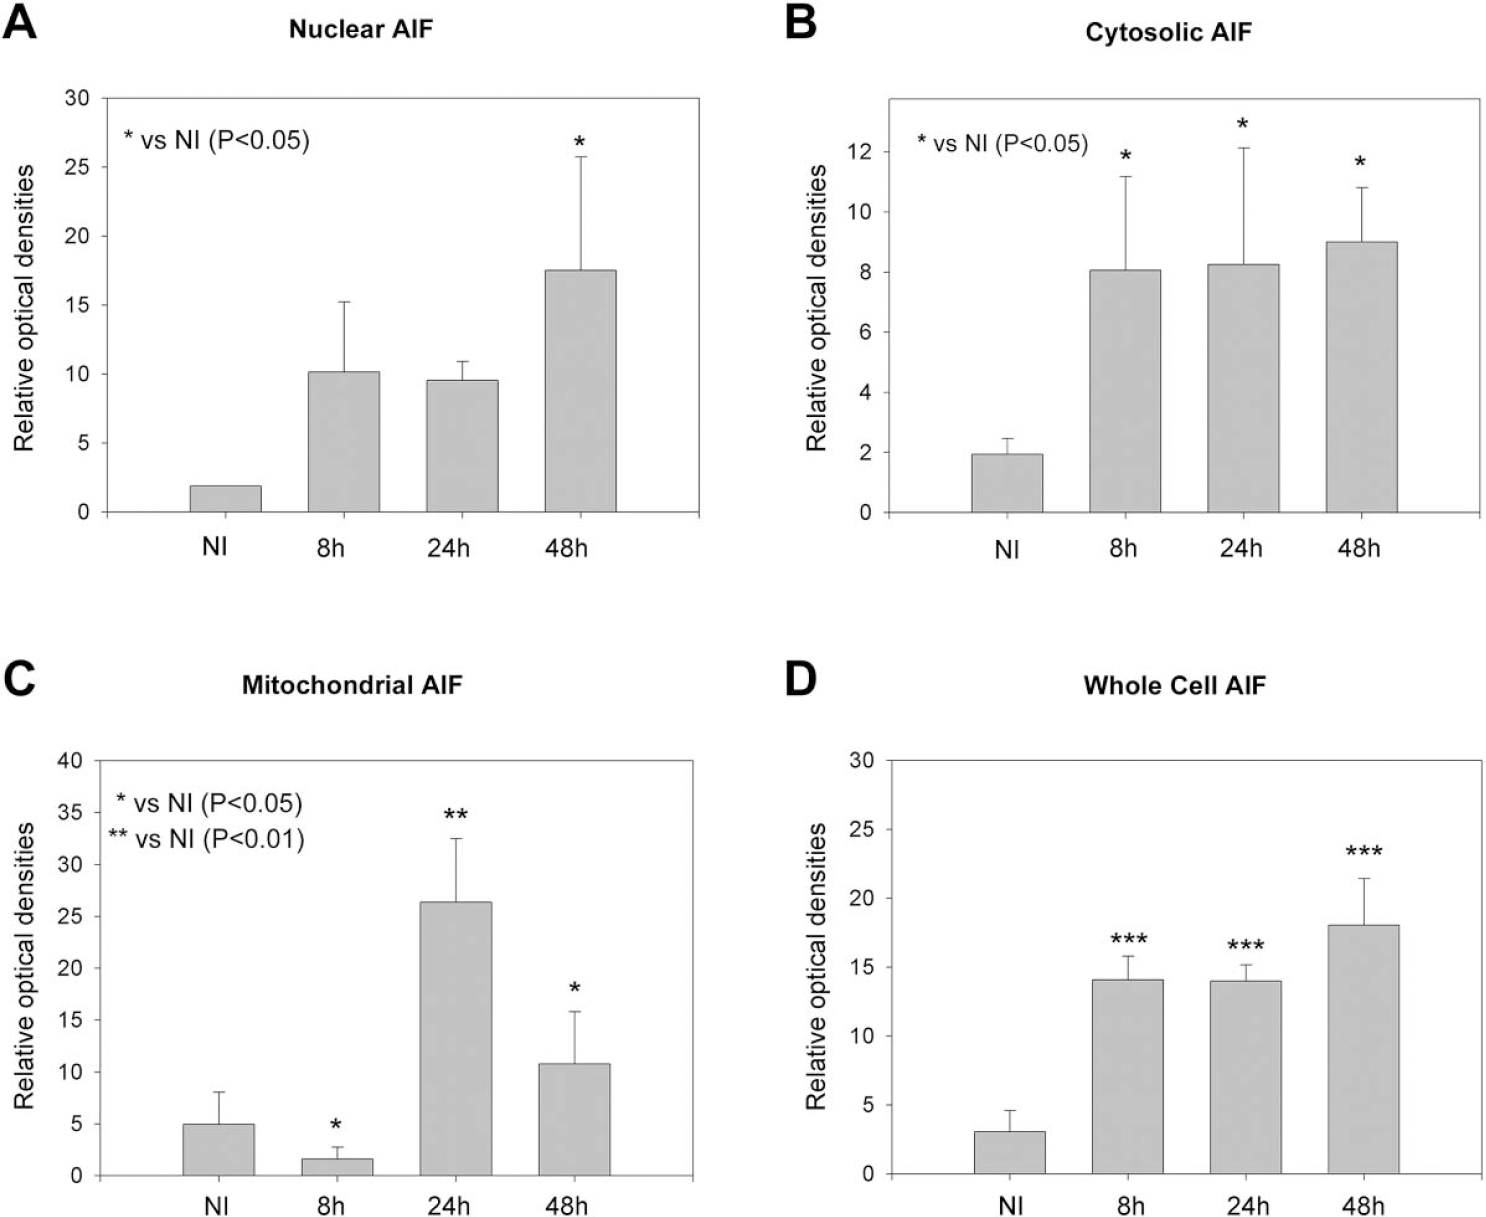
Optical densities of Western blots show that AIF significantly increased in the nuclei (A) 48 hours and in the cytosol (B) 8, 24, and 48 hours after ischemia onset. In contrast, AIF significantly decreased in the mitochondria 8 hours but increased 24 and 48 hours after ischemia (C). Western blots of whole-cell homogenates show that overall levels of AIF significantly increased 8, 24, and 48 hours after ischemia (D). Data represent optical densities of brain samples of separate animals run on the same gel for each time and condition. NI, data from nonischemic cortex; AIF, apoptosis-inducing factor.
AIF translocates into nuclei in the infarct margin
Distal MCA occlusion produced a well-delineated infarct cortex (Fig. 1). We analyzed immunostaining in four regions (I, II, III, and IV) based upon the topography of the infarct in this model and relative distance of the cortical region from the infarct center (core) or margin. Eight hours after ischemia onset, AIF staining was dense in the nuclei of cells in the infarct margin of region I, whereas little AIF staining was present in the cytosol (Fig. 4). Similar results were observed 48 hours after ischemia onset (data not shown). In contrast, numerous diffuse cytosolic AIF-positive neurons were observed in the ischemic region III, and very few nuclear AIF-positive cells were observed. A mixture of cells whose cytosol or nuclei were stained with AIF was observed in the region II (Fig. 4). Some neurons were stained with a punctate pattern in the non-ischemic cortex (region IV of Fig. 1). No AIF-positive staining was found in tissue when primary antibody was omitted (data not shown).
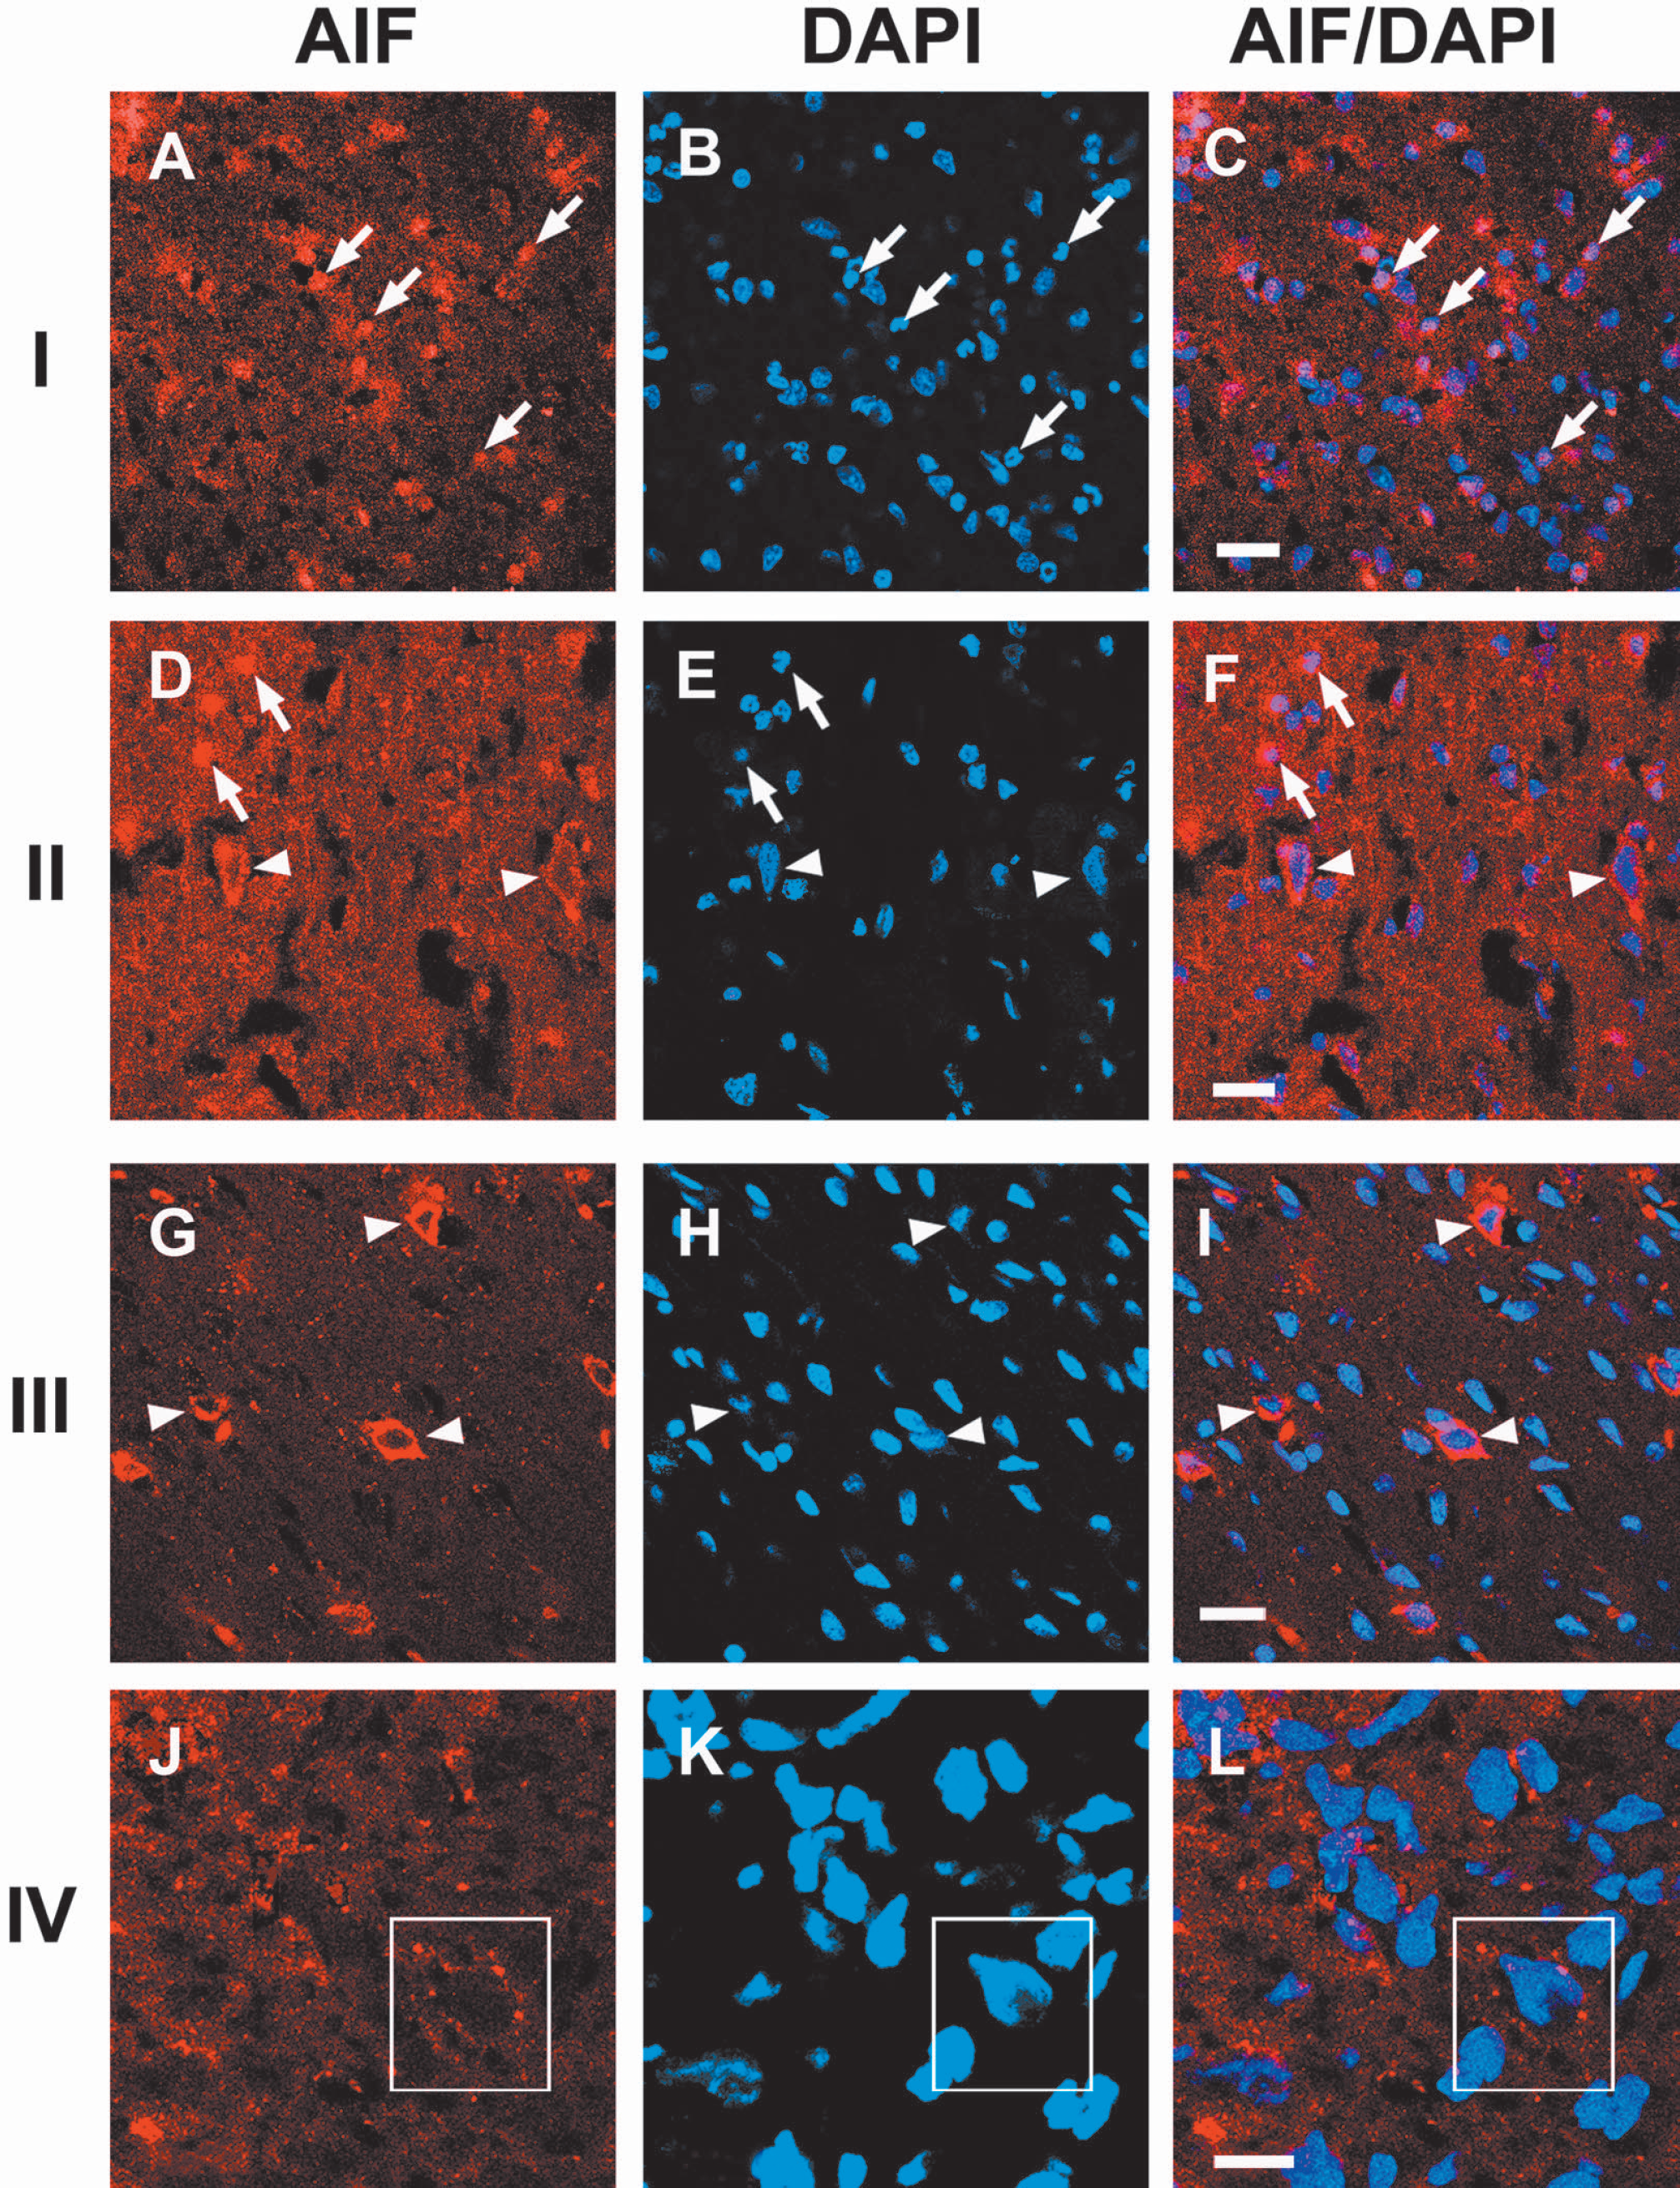
Confocal microscopic images from regions I, II, III, and IV. Double immunofluorescent staining of AIF (red) and DAPI (blue, nuclear DNA) 8 hours after MCA occlusion. Many cells showing nuclear co-localization of AIF and DAPI were observed in the peri-infarct area of region I whereas few cells demonstrating cytosolic AIF staining were observed in this area. The density of cells showing nuclear AIF stain decreased whereas the number of cells showing diffuse cytosolic AIF stain increased in the transitional region II. Cells showing nuclear AIF staining were not observed in the ischemic core (region III), but more cells showing cytosolic AIF were found. Some cytosolic punctate AIF staining in the nonischemic cortex of region IV was observed at a higher magnification, which may indicate that AIF resides in the mitochondria. Arrows in I and II indicate nuclear AIF staining; arrowheads in II and III indicate cytosolic AIF staining; boxes in IV indicate punctate AIF staining in the cytosol. The scale bar is 20 μM in I, II, and III, and 10 μM in IV. AIF, apoptosis-inducing factor; DAPI, 4′6-diamindino-2-phenylindole; MCA, middle cerebral artery.
Nuclear AIF translocation occurs after cytosolic cytochrome c release and co-localizes with apoptotic bodies
Cytochrome c release is a critical factor in the caspase-dependent apoptotic pathway. The time courses of AIF and cytochrome c release in region I near the ischemic margin were compared using confocal microscopy. A punctate pattern of AIF staining was observed in the non-ischemic cortex (Fig. 5). AIF immunoreactivity increased at 2 and 4 hours after ischemia onset. However, nuclear AIF translocation was not observed until 8 hours. There was no staining of cytochrome c in the nonischemic cortex, probably because the antibody could not access protein in the cells (Fujimura et al., 1998; Zhao et al., 2003). Diffuse cytochrome c staining indicative of cytochrome c release into the cytosol was observed 2 hours after ischemia onset. Therefore, nuclear AIF translocation was observed after cytosolic cytochrome c release.
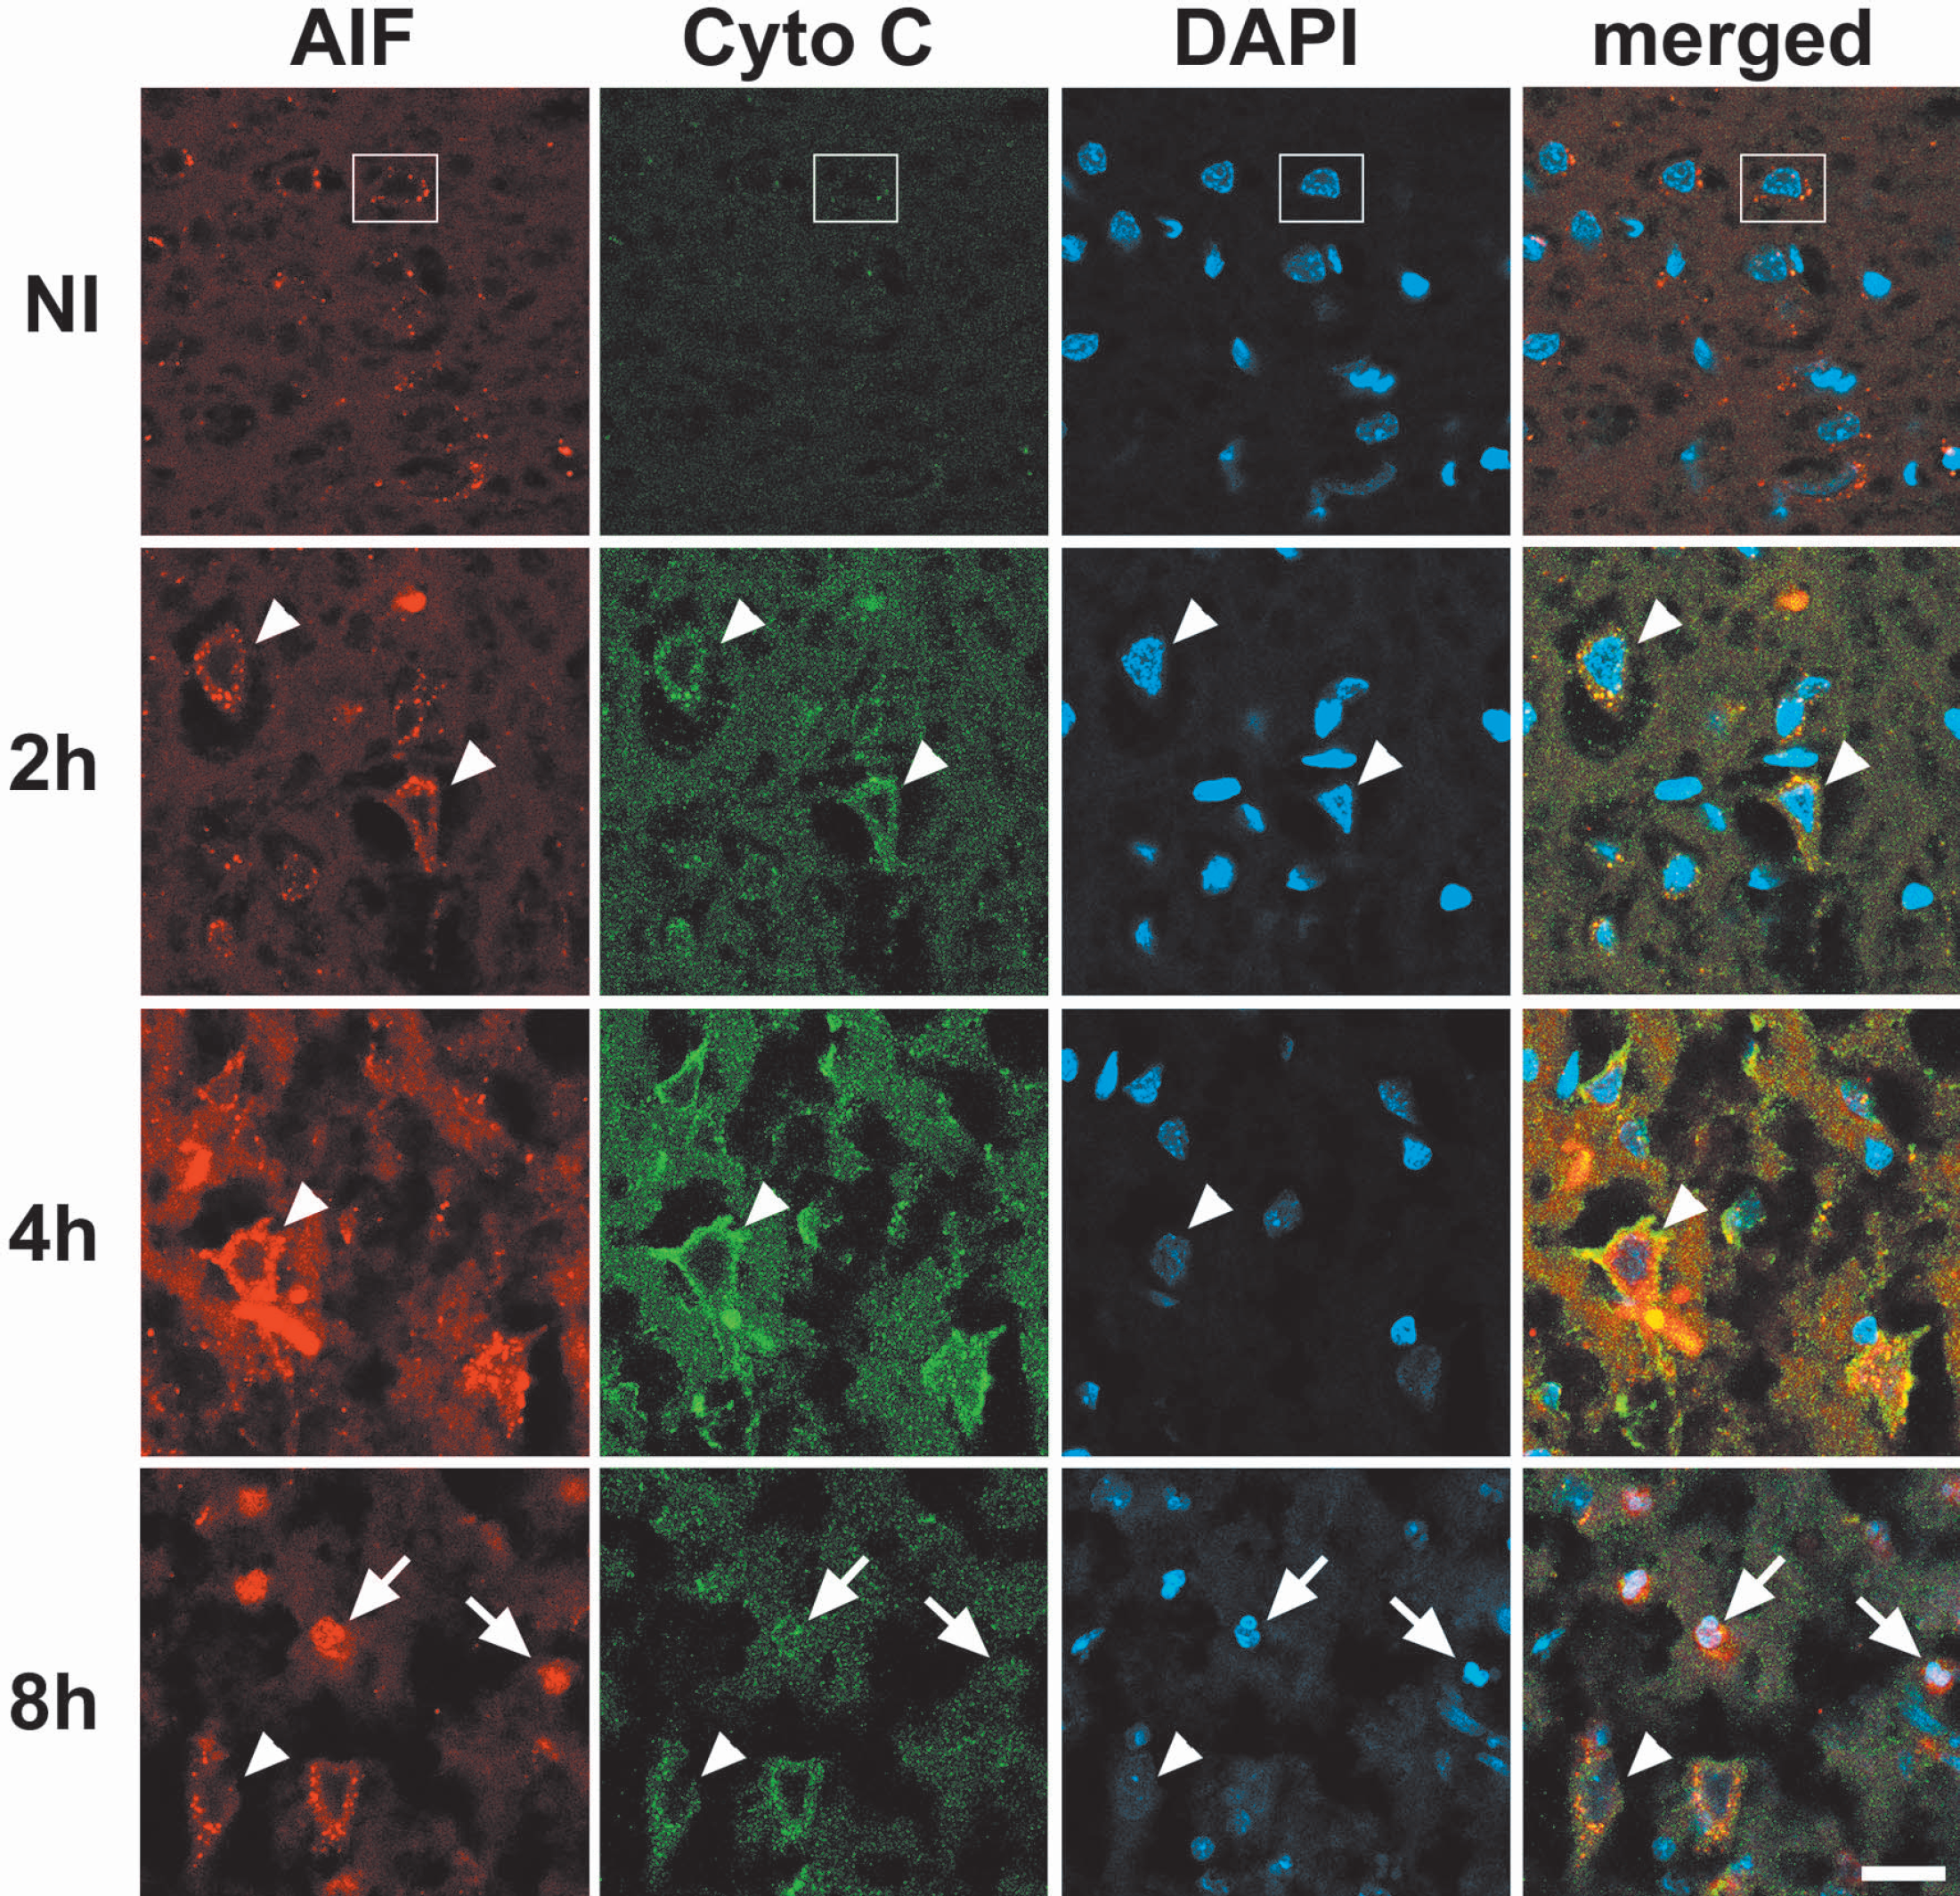
Triple staining for AIF (red), cytochrome c (green) and DAPI (blue) in region I shown in Fig. 1. Immunoreactivity of both cytosolic AIF and cytochrome c was increased 2 hours after ischemia onset and further enhanced at 4 hours. Nuclear AIF translocation was not observed until 8 hours after ischemia. Arrows in “8h” show nuclear AIF translocation; arrowheads in “2h”, “4h”, and “8h” indicate diffuse cytosolic AIF and cytochrome c staining; a box in NI indicates punctate AIF staining in the cytosol. The scale bar is 20 μM. Cyto c, cytochrome c; AIF, apoptosis-inducing factor; DAPI, 4′,6-diamidino-2-phenylindole.
To assess whether nuclear AIF translocation induced cell damage, double staining of AIF and DAPI 8 hours after ischemia onset was analyzed. Whereas cells with punctate AIF staining show non-condensed nuclear staining of DAPI, a subset of cells with nuclear AIF translocation co-localized with apoptotic bodies (Fig. 6), suggesting that nuclear AIF translocation might induce apoptosis.
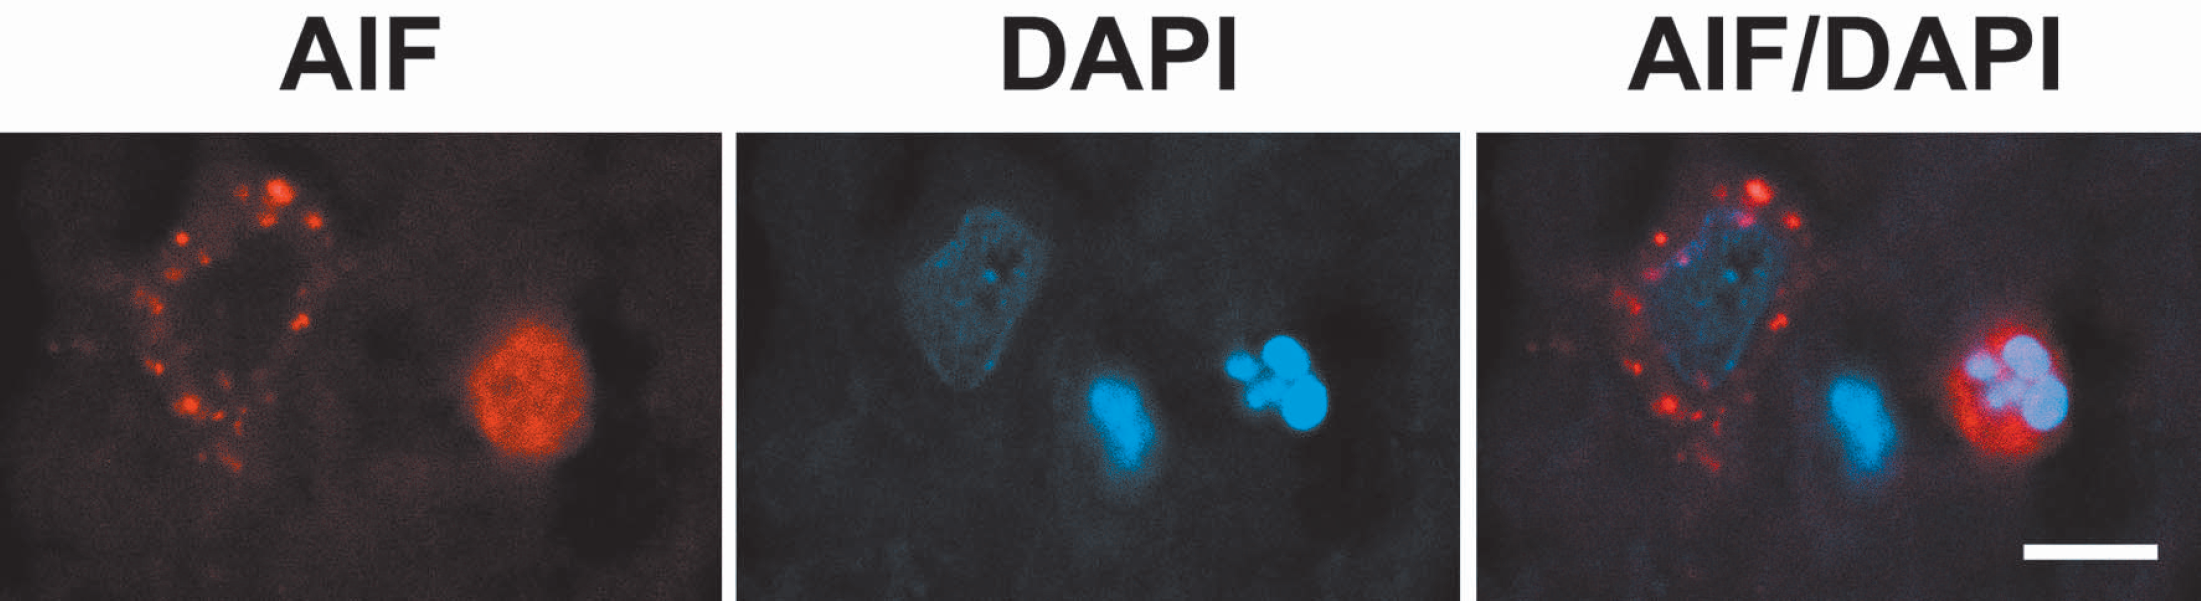
A representative image of double staining of AIF and DAPI showing nuclear AIF translocation colocalizes with apoptotic bodies (the right cell). By contrast, a cell with cytosolic AIF staining shows non-condensed DAPI staining (the left cell). The scale bar is 10 μM. AIF, apoptosis-inducing factor; DAPI 4′,6-diamidino-2-phenylindole.
Overexpression of Bcl-2 blocks AIF translocation
After microinjection of virus into rat brain, transgene expression is observed locally, limited to neurons near the injection site (Yenari et al., 2001) (see regions I and IV in Fig. 1). We targeted the infarct margin in the ischemic cortex and its counterpart in the nonischemic cortex (see boxes in regions I and IV in Fig. 1) because this was the region where we most consistently observed AIF translocation (Fig. 7, A–C). Because the number of transfected neurons was small, we were unable to assess whether Bcl-2 inhibited AIF translocation using Western blots. Thus we counted the total number of β-gal-positive neurons and determined the percentage of those neurons that showed nuclear AIF translocation. The total number of β-gal-positive neurons per animal in the ischemic cortex ranged from 30–121 across animals. At 8 and 48 hours after ischemia onset, the percentage of neurons double stained with nuclear AIF and β-gal in animals transfected with Bcl-2 was significantly lower than in animals transfected with control vector (Figs. 7 and 8).
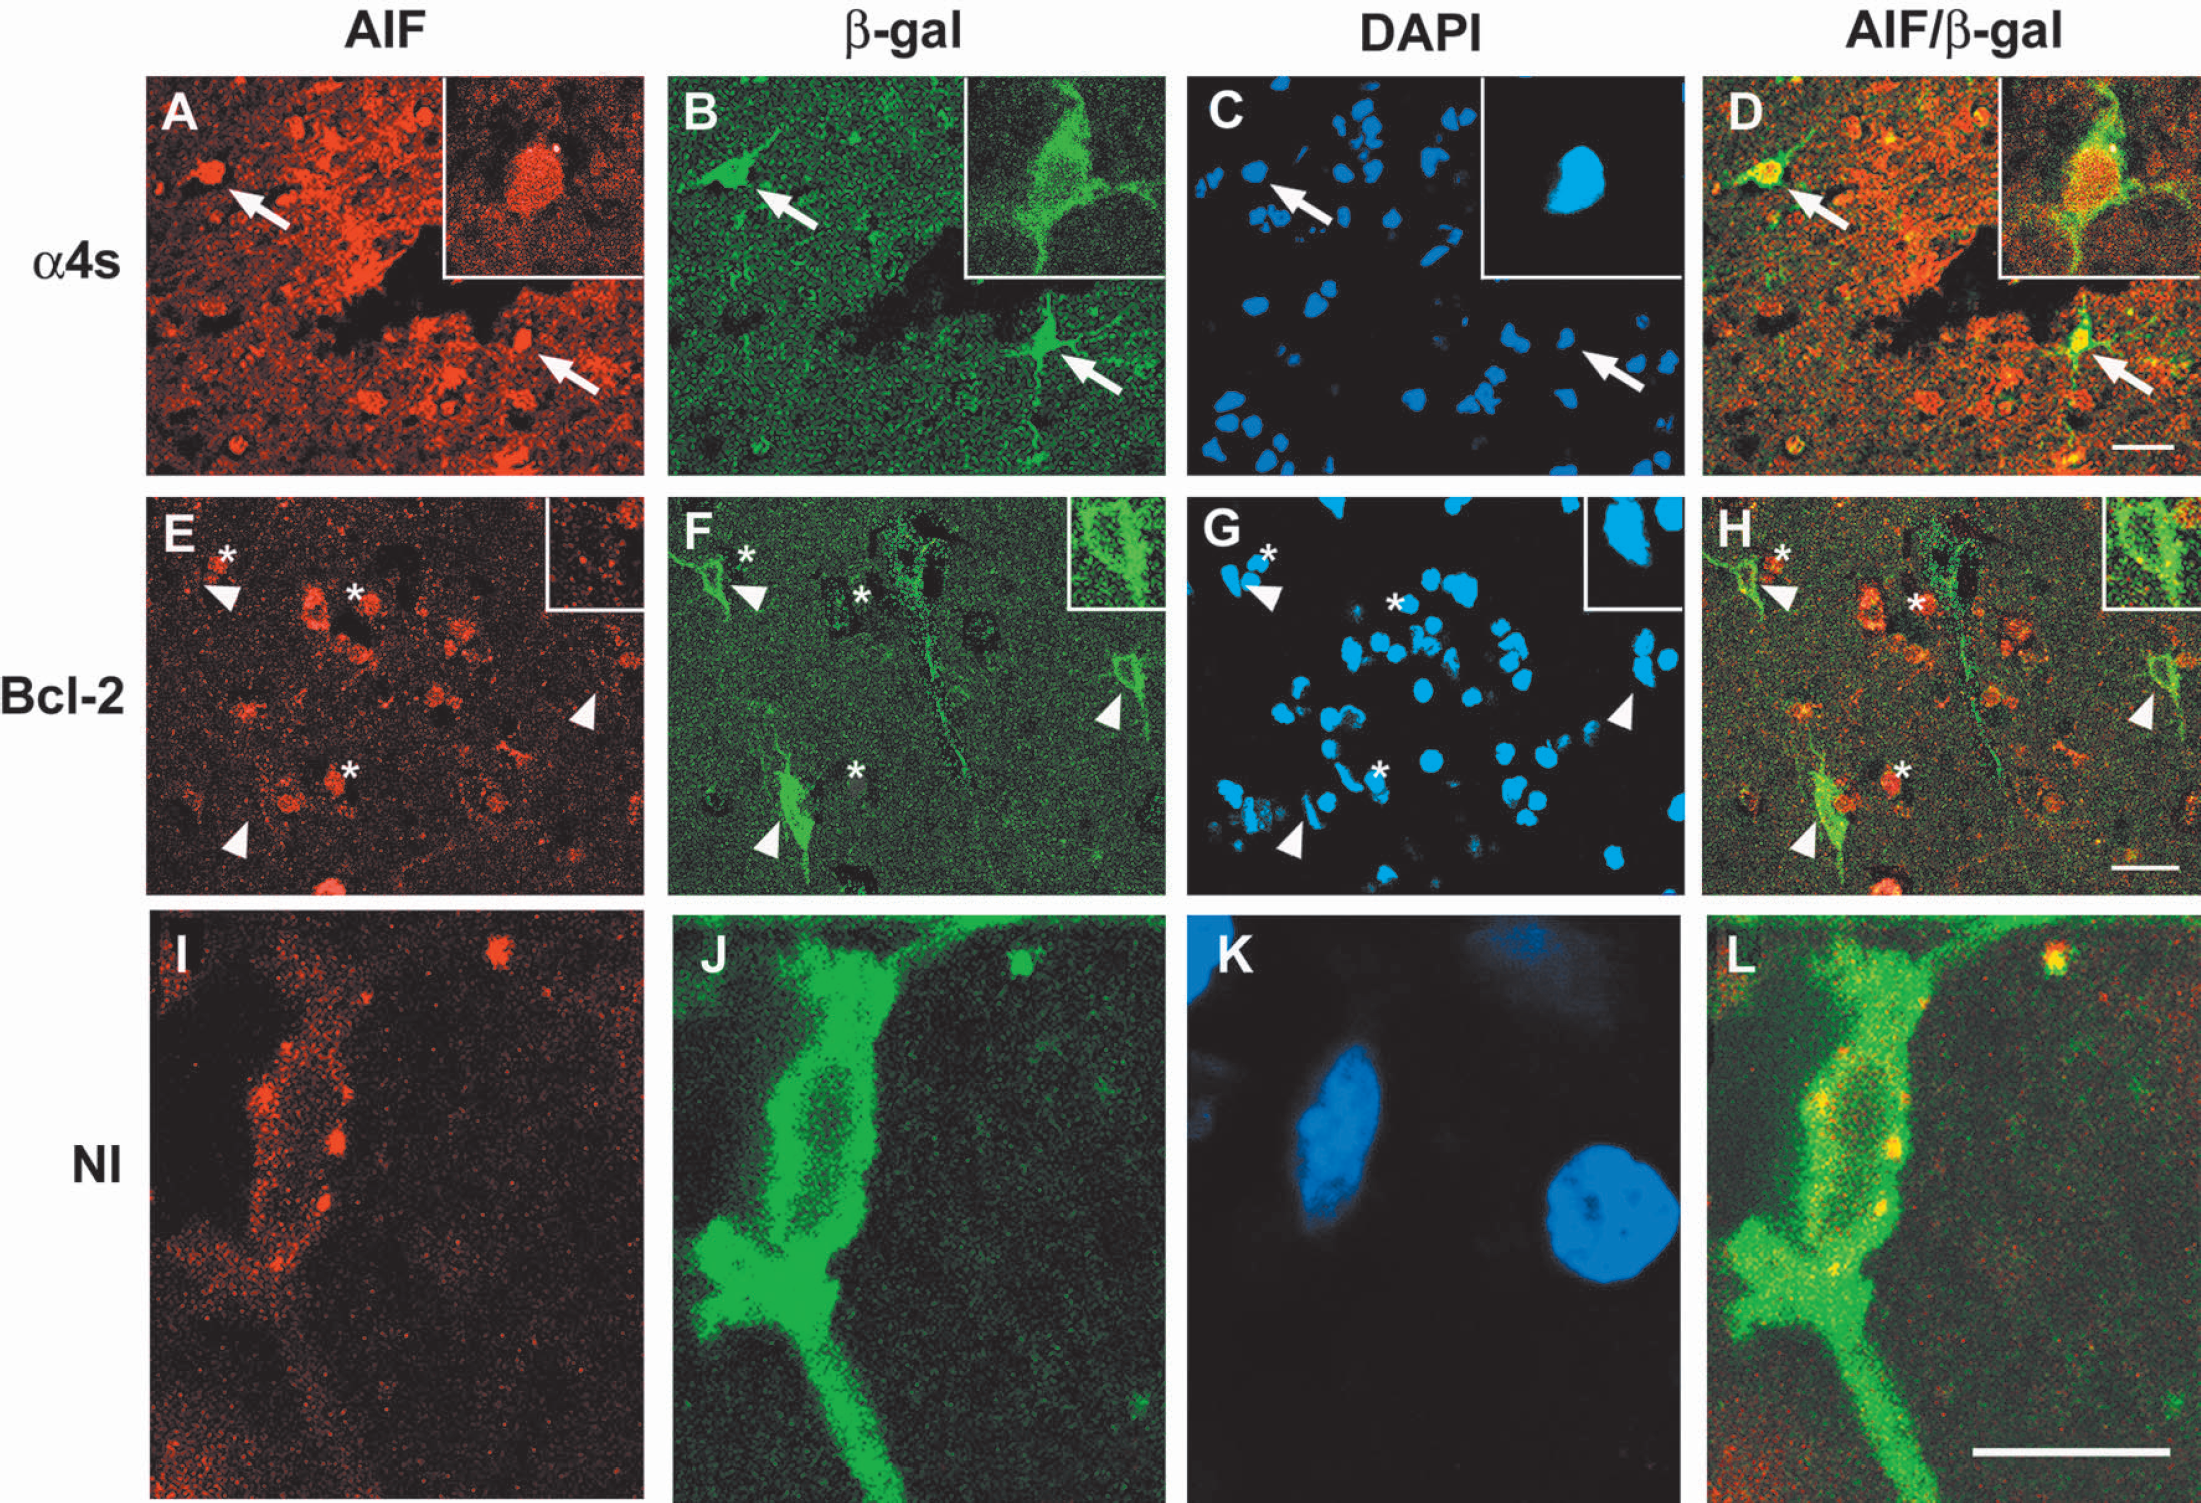
Triple labeling for AIF (red), β-gal (green), and DAPI (blue) 8 hours after MCA occlusion from region I or IV. The top panels (A–D) show ischemic cortex of an animal given control vector. The middle panels (E–H) show ischemic cortex of an animal given Bcl-2 vector. The bottom panels (I–L) show the nonischemic, contralateral cortex of an animal given control, α4s vector, at higher magnification to reveal the punctate pattern of AIF staining. Neurons showing nuclear AIF stain, β-gal stain, and DAPI are indicated by arrows in the top panel. Merged images of β-gal and AIF are shown in column AIF/β-gal. Arrowheads in the middle panel indicate β-gal positive but nuclear AIF-negative neurons. Punctate cytosolic AIF staining was observed in such neurons. In the middle panel, * indicates nuclear AIF-positive but β-gal-negative cells. A typical AIF cytosolic punctate stain from nonischemic cortex transfected with control vector is shown in the bottom panel. The scale bars in the top and middle panels are 20 μM and 10 μM in the bottom panel. α4s, control vector; Bcl-2, Bcl-2 vector; NI, nonischemic cortex; AIF, apoptosis-inducing factor; DAPI 4′, 6-diamidino-2-phenylindole.
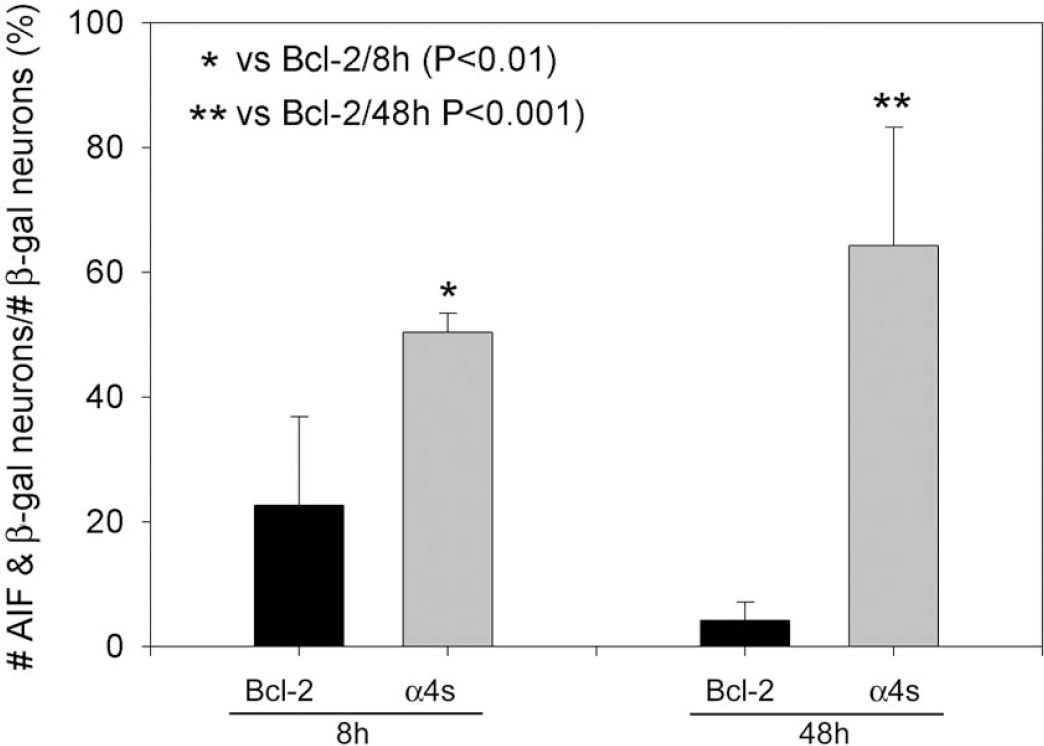
Total numbers of neurons that showed β-gal and nuclear AIF double labeling in the ischemic cortex were divided by the total number of β-gal-positive neurons in the ischemic cortex. Eight hours after ischemia onset, the percentage of AIF-positive cells in animals treated with control vector was 50 ± 2% (n = 3), which was significantly higher than 23 ± 8% with Bcl-2 vector (n = 3). Forty-eight hours after ischemia onset, the percentage of AIF-positive cells in animals treated with control vector was 64 ± 11% (n = 3), which was significantly higher than 4 ± 3% with Bcl-2 vector (n = 4). AIF, apoptosis-inducing factor.
DISCUSSION
To our knowledge, this is the first report to show that AIF specifically translocates into the nuclei of neurons in the infarct margin. We further demonstrate that overall levels of AIF increase after stroke and that nuclear AIF translocation occurs after the release of cytochrome c into cytosol. Finally, we provide evidence that HSV-mediated Bcl-2 overexpression blocks nuclear AIF translocation after stroke.
Several studies have demonstrated apoptosis after focal stroke or global ischemia. This is accompanied by cytochrome c release and caspase activation (Benchoua et al., 2001; Jover et al., 2002; Luo et al., 2002; Namura et al., 1998; Plesnila et al., 2001; Zhang et al., 2001), indicating the involvement of a classical intrinsic apoptotic pathway. However, caspase inhibitors can only delay or partially block ischemic damage (Sugawara et al., 2002; Zhan et al., 2001), and caspase activity is not always observed in experimental stroke models (Gill et al., 2002; Yenari et al., 2002), even when apoptosis occurs (Maier et al., 1998), suggesting the involvement of caspase-independent pathways. Caspase-independent apoptotic death has also been observed in other studies (Liang et al., 2001; Volbracht et al., 2001). In a search for molecules that cause caspase-independent apoptosis, Susin and colleagues (1996b) identified AIF. Injury causes AIF to be released from mitochondria into the cytoplasm and then into the nucleus, where it can induce apoptosis. The precise mechanism by which this occurs has not been resolved; however, AIF causes nuclear shrinkage and condensation and large-scale DNA fragmentation (Daugas et al., 2000a). Furthermore, AIF activity is caspase-independent (Daugas et al., 2000a).
It is well known that the cytochrome c/caspase-3 apoptotic pathway is an energy-dependent active process, which occurs only in the ischemic penumbra because of residual blood supply (Benchoua et al., 2001; Namura et al., 1998). Whether the AIF apoptotic pathway is ATP-dependent is not clear. However, the differential pattern of AIF translocation in the infarct margin and other infarct regions observed in the present study suggests AIF translocation may be ATP-dependent. The diffuse cytosolic AIF stain may reflect a necrotic, passive AIF release in the ischemic core. Based upon our observation that AIF translocates into nuclei, and upon previous reports that DNA fragmentation and caspase-independent apoptosis can occur after experimental stroke (Loetscher et al., 2001; MacManus et al., 1997; Sugawara et al., 2002; Yao et al., 2001; Zhan et al., 2001), we speculate that translocated AIF is partially responsible for ischemic damage. In fact, using the same model, we have shown both cytochrome c release into the cytosol and active caspase-3 activity (Zhao et al., 2003). Thus we provide new evidence that both caspase-dependent and AIF-dependent apoptotic pathways are involved in focal ischemia.
Of interest is the observation that there appeared to be more cells with cytosolic AIF staining at 4 hours than at 8 hours after ischemia in region I of the ischemic margin, suggesting that AIF may first translocate into the cytosol then transfer into the nuclei at a later time. Furthermore, we demonstrated that although cytosolic cytochrome c release was observed as early as 2 hours, nuclear AIF translocation was not detected until 8 hours after ischemia. This suggests that AIF translocation occurs after cytochrome c release. In contrast, cytochrome c release occurred after nuclear AIF translocation in neonatal rat brains exposed to hypoxia-ischemia (Zhu et al., 2003). Most recently, Cao and colleagues (2003) demonstrated that nuclear AIF translocation was not detected until 24 hours after transient global ischemia. However, previous studies have demonstrated that cytochrome c release occurs as early as 2 hours after global ischemia (Sugawara et al., 1999). Therefore, it seems nuclear AIF translocation follows cytochrome c release in both focal and global ischemia in adult animals. In addition, Cao and colleagues (2003) have demonstrated that a caspase inhibitor does not block nuclear AIF translocation, suggesting that AIF apoptotic pathway in global ischemia is caspase-independent. Whether AIF translocation in our ischemic model is truly caspase-independent requires further study because recent in vitro studies have demonstrated that AIF release occurs after cytochrome c release and requires caspase activation (Arnoult et al., 2002, 2003). A limitation of our study is that only a small number of neurons are transfected in our system. We consider Bcl-2 gene therapy mediated by HSV vectors to be mainly an experimental tool for mechanistic studies (as opposed to preclinical research assessing the therapeutic potential for Bcl-2 gene therapy). Therefore, additional experiments addressing the relationship between AIF and caspase apoptotic pathways are needed. Furthermore, although we observed that a subset of nuclear AIF-positive cells contained apoptotic bodies, not all of them did. AIF does not always induce a typical apoptotic nuclear pattern; AIF may also induce necrosis.
Blocking AIF translocation is a potential important target for stroke treatment, and these findings suggest that Bcl-2 overexpression may be a way to accomplish this. Bcl-2 proteins reside on the outer mitochondrial membrane oriented toward the cytosol (Israels and Israels, 1999). Bcl-2 governs ion transport and protects against breaches in the membrane (Israels and Israels, 1999). Bcl-2 also has various roles within cells, including buffering calcium mobilization (Foyouzi-Youssefi et al., 2000; Murphy et al., 2001; Pinton et al., 2002), regulating proton flux (Shimizu et al., 1998), antioxidant effects (Albrecht et al., 1994; Esposti et al., 1999), blocking cytochrome c (Green and Reed, 1998; Kowaltowski et al., 2000) and AIF release (Daugas et al., 2000a; Tsujimoto and Shimizu, 2000), and inhibiting caspase activity (Krebs et al., 1999; Murphy et al., 2000; Srinivasan et al., 1996; Zhang et al., 1999), among others. We demonstrated previously that overexpression of Bcl-2 blocks neuronal death in vitro and in vivo (Dumas et al., 2000; Lawrence et al., 1996, 1997; Phillips et al., 2000), and more recently we demonstrated that overexpression of Bcl-2 blocks cytochrome c release and active caspase-3 expression in the same stroke model used in the present study (Zhao et al., 2003). Here we demonstrate that Bcl-2 blocks AIF nuclear translocation in ischemic neurons. Thus Bcl-2 is able to block both caspase-dependent and AIF-dependent neuronal apoptotic pathways after experimental stroke and as such may be an important line of defense against apoptosis-mediated neuron death after ischemia.
It is of interest that we also observed that mitochondrial AIF increased 24 and 48 hours after stroke. What role the increased AIF plays after ischemia is not clear. Miramar and colleagues (2001) demonstrated, in an in vitro study, that natural AIF purified from mitochondria and recombinant AIF purified from bacteria (AIFdelta1–120) exhibit NADH oxidase activity while superoxide anion (O2−) is formed, implying a pro-oxidant function that is obviously not advantageous for the cell under normal conditions. Thus it may be that substrates of AIF oxidoreductase compete for endogenous NADH or that AIF is normally inactivated by local inhibitory factors within the intermembrane space (Miramar et al., 2001). In contrast, Klein and colleagues (2002) recently demonstrated that AIF is a free radical scavenger. The authors demonstrated that reduction of AIF expression leads to degeneration of cerebellar neurons. Mutant cerebellar granule cells are susceptible to exogenous and endogenous peroxide-mediated apoptosis but can be rescued by AIF expression. Overexpression of AIF in wild-type granule cells further decreases peroxide-mediated cell death (Klein et al., 2002). Thus the authors suggest that under normal conditions, AIF resides in the mitochondrial membrane to act as a free radical scavenger, whereas under conditions leading to apoptosis, AIF translocates into the nuclei resulting in large-scale DNA fragmentation (Klein et al., 2002). It is well known that various free radicals are generated after ischemia/reperfusion, including O2−, which contributes to ischemia/reperfusion injury (Chan, 2001). Whether mitochondrial AIF overexpression is a beneficial response to free radical production in the current study is not clear. Thus, AIF may have beneficial as well as injurious properties, and further research is required to determine whether AIF overexpression after ischemia contributes to ischemic damage or serves as a free radical scavenger.
Footnotes
Acknowledgements
The authors thank Dr. Raymond Sobel for his expert review of immunostaining and histopathology, Beth Hoyte for preparation of the figures, and David Schaal for assistance preparing the manuscript.