
Abstract
Signaling cascades associated with apoptosis contribute to cell death after focal cerebral ischemia. Cytochrome c release from mitochondria and the subsequent activation of caspases 9 and 3 are critical steps. Recently, a novel mitochondrial protein, apoptosis-inducing factor (AIF), has been implicated in caspase-independent programmed cell death following its translocation to the nucleus. We, therefore, addressed the question whether AIF also plays a role in cell death after focal cerebral ischemia. We detected AIF relocation from mitochondria to nucleus in primary cultured rat neurons 4 and 8 hours after 4 hours of oxygen/glucose deprivation. In ischemic mouse brain, AIF was detected within the nucleus 1 hour after reperfusion after 45 minutes occlusion of the middle cerebral artery. AIF translocation preceded cell death, occurred before or at the time when cytochrome c was released from mitochondria, and was evident within cells showing apoptosis-related DNA fragmentation. From these findings, we infer that AIF may be involved in neuronal cell death after focal cerebral ischemia and that caspase-independent signaling pathways downstream of mitochondria may play a role in apoptotic-like cell death after experimental stroke.
Keywords
The activation of signaling pathways associated with programmed cell death is an established feature of post-ischemic cell death in the brain (Blomgren et al., 2003;Fiskum, 2000;Graham and Chen, 2001;MacManus and Buchan, 2000;Mattson et al., 2000;Moskowitz and Lo, 2003;Sims and Anderson, 2002). Upstream death signals generated by cell membrane death receptors or by the release of death-inducing mitochondrial proteins activate downstream events that ultimately lead to DNA fragmentation and cell death. Among others, DR3- and Fas-death receptors have been implicated in cell death after cerebral ischemia (Harrison et al., 2000;Martin-Villalba et al., 1999) and may well serve as activators of the upstream initiator caspase-8 (Culmsee et al., 2001;Velier et al., 1999). Caspase-8 can activate caspase-3, the central downstream “executioner” caspase, directly or more often indirectly by cleaving the Bcl-2 family member protein BID (Plesnila et al., 2001). Cleaved BID translocates to the mitochondrial membrane and contributes to the cytosolic release of cytochrome c by interacting with BAX and other proapoptotic Bcl-2 family members (Fujimura et al., 1998a). Released cytochrome c forms a heptameric apoptosomal complex with APAF-1 and dATP/ATP leading to procaspase-9 activation (Acehan et al., 2002), which in turn cleaves and activates procaspase-3. Both caspase-9 (Cao et al., 2002; Krajewski et al., 1999) and −3 activation (Le et al., 2002;Namura et al., 1998) have been implicated as mechanisms of neuronal cell death after ischemia.
Although caspase activation has been identified as a major molecular mechanism of programmed cell death, recent findings indicate the importance of additional noncaspase—dependent mechanisms (Cande et al., 2002;Cregan et al., 2002;Penninger and Kroemer, 2003). Recently, a novel proapoptotic molecule, apoptosis-inducing factor (AIF), was identified (Susin et al., 1999) as a 67 kDa flavoprotein with significant homology to bacterial and plant oxidoreductases and located in the mitochondrial intermembranous space. Upon release from mitochondria, AIF migrates to the nucleus where it induces large-scale (50 kbp) DNA fragmentation and apoptosis by a yet unknown, caspase-independent mechanism (Daugas et al., 2000;Penninger and Kroemer, 2003). Based upon the previous assumptions, we hypothesize that AIF may be a novel factor that is released together with cytochrome c from mitochondria and leads to cell death after experimental stroke (focal cerebral ischemia).
To explore this hypothesis, we examined whether AIF is released from mitochondria and migrates to the nucleus in well-established models of ischemic cell death. We used in vitro [oxygen/glucose deprivation (OGD)] and in vivo (filament occlusion of the mouse middle cerebral artery) models to test whether AIF translocation is associated with well-known features of post-ischemic cell death, such as DNA fragmentation and cytochrome c release from mitochondria.
MATERIALS AND METHODS
Transient focal cerebral ischemia
Male C57/BL6 mice (body weight 18–22 g) (Charles River, Sulzfeld, Germany) were used for all experiments. Anesthesia was initialized with 4% halothane, 30% O2, and 66% N2O and maintained with 1% halothane, 30% O2, and 69% N2O for the duration of surgery (<20 minutes). Femoral artery catheterization for arterial blood pressure measurement and blood gas analysis was performed in a parallel group of animals subjected to the same anesthesia and surgery protocol. Body temperature was maintained at 37.0 ± 0.1°C with a feedback-controlled heating pad. A flexible laser Doppler probe was glued onto the exposed left parietal skull over the territory of the middle cerebral artery (MCA) for continuous monitoring of regional cerebral blood flow (rCBF) (Perimed 4001 Master, Perimed, Järfälla, Sweden). Thereafter, the left common and external carotid arteries were exposed and ligated. The common carotid artery was incised and a silicone-coated 8-0 nylon monofilament was pushed into the internal carotid artery until the laser Doppler signal indicated occlusion of the middle cerebral artery. Laser Doppler flow during occlusion was 20 ± 8% of baseline, indicating ischemic blood flow conditions in this area. Wounds were sutured, and the animals were transferred to an incubator (32°C) and allowed to wake up. Forty-five minutes after MCA occlusion, mice were shortly reanesthetized, and ischemia was terminated by removal of the intraluminal suture. For maintenance of body temperature after surgery, animals were retransferred to the incubator for another 2 hours. Mice were killed 1, 2, 4, 8, and 24 hours after MCA occlusion in deep halothane anesthesia. All procedures described are in accordance with local laws and were approved by the animal protection committee of the Government of Upper Bavaria.
Cell culture
Pregnant Sprague-Dawley rats (Charles-River, Sulzfeld, Germany) were killed by cervical dislocation in deep halothane anesthesia at gestation day 18, and embryos were removed from the uterus. Hippocampi and cortices were isolated from the brains and cells were dissociated by mild trypsination and trituration as described previously (Mattson et al., 1993). Hippocampal cells were then seeded onto polyethylenimine-coated 35-mm culture dishes containing a glass coverslip (for immunocytochemistry) or 60-mm culture dishes (for immunoblot analysis) and cultured under standard conditions (5% CO2, pH 7.4, 37°C) in Neurobasal medium (NBM) with 2% (vol/vol) B27 supplement, 2 mM glutamine, and 100 units/mL penicillin/streptomycin (GIBCO/BRL). Medium was replaced every 3 days. All experimental treatments were performed on 14-day-old cultures. At this time, the cultures contained less than 5% astrocytes as determined by GFAP immunocytochemistry (data not shown). The neurons in these cultures express both NMDA and non-NMDA glutamate receptors and are therefore vulnerable to glutamate-induced apoptosis (Glazner and Mattson, 2000;Mattson et al., 1993).
Oxygen glucose deprivation
Glucose-free Locke's medium (Locke's w/o glucose; 154 mM NaCl, 5.6 mM KCl, 2.3 mM CaCl2, 1 mM MgCl2, 3.6 mM NaHCO3, 5 mM HEPES, pH 7.2) supplemented with gentamicin (5 mg/L) was purged by a mixture of N2/CO2 gas (95%/5%) for 30 minutes, resulting in an oxygen content of 5% to 6%. Neurons were then washed three times with this medium and incubated for 4 hours in an oxygen-free N2/CO2 (95%/5%) atmosphere. Control cultures were incubated in Locke's with 10 mM glucose (control), oxygen-deprived Locke's with glucose (oxygen deprivation, OD), or oxygen-containing Locke's w/o glucose (glucose deprivation, GD). Thereafter, the medium was replaced by standard culture medium (see above). Four, eight, and twenty-four hours after onset of OGD, cells were fixed with 4% formaldehyde in phosphate-buffered saline (PBS) for immunocytochemistry, or cell lysates were prepared for Western Blot analysis.
Western Blot analysis
Cytosolic and nuclear lysates from primary cultured rat neurons were obtained with a validated commercially available nuclear extraction kit (TransAM, Active Motif, Carlsbad, CA, U.S.A.). Briefly, cells were scraped from the dishes in ice-cold phosphate buffered saline (PBS) containing protease and phosphatase inhibitors. The neurons were then centrifuged at 200 g for 5 minutes and incubated with 500 μL of hypotonic buffer for 15 minutes. After addition of a detergent and vortexing for 10 seconds, the nuclei were spun down by centrifugation at 10,000 g for 1 minute. The supernatant was collected as the cytosolic fraction. The nuclear pellet was washed with hypotonic buffer and exposed to 60 μL nuclear lysate buffer for 30 minutes. Nuclear lysates were obtained after a centrifugation step of 10,000 g for 15 minutes. Cell lysates from mouse brain were obtained as previously described (Plesnila et al., 2001). Protein concentration was measured photometrically (Bio-Rad Protein Assay; Bio-Rad Laboratories, Munich, Germany) and 10 to 20 μg protein were loaded together with 7 μL SeeBlue plus 2 molecular weight marker (Invitrogen, Karlsruhe, Germany) on 10% NuPage Bis-Tris gels (Invitrogen, Karlsruhe, Germany). Proteins were separated by electrophoresis and blotted over night onto Hybond PVDF membranes (Amersham Biosciences, Freiburg, Germany). The blot was probed with an affinity purified goat polyclonal antibody raised against a peptide mapping the C-terminus of mouse AIF (sc-9416, 1:500, Santa Cruz Biotechnology, Santa Cruz, CA, U.S.A.) at 4°C overnight. Membranes were then exposed to a rabbit anti-goat HRP-conjugated secondary antibody (1:5000) (DakoCytomation, Hamburg, Germany). Antibody binding was detected colorimetrically with an Opti-4CN substrate (Opti-4CN Substrate Kit, Bio-Rad Laboratories, Munich, Germany). Equal protein loading was demonstrated by stripping and reprobing the membrane with an anti-α-tubulin antibody (B-7, 1:1000, data not shown) (Santa Cruz Biotechnology, Santa Cruz, CA, U.S.A.).
Immunohistochemistry
Animals were perfusion-fixed with 4% paraformaldehyde (PFA). Brains were carefully removed and post-fixed in 4% PFA no longer than 24 hours. After dehydration, the tissue was embedded in paraffin and 5-μm coronal sections from six levels at equal distances (800 μm) from the rhinencephalon to the cerebellum were prepared upon conventional glass slides coated with amino-propyl-tri-ethoxy-silane (Merck, Darmstadt, Germany).
Apoptosis-inducing factor
Nonspecific binding was blocked for 30 minutes with 4% horse serum in PBS. Anti-AIF (2 μg/mL, sc-9416, Santa Cruz Biotechnology, Santa Cruz, CA, U.S.A.) was applied in TBS containing 1% BSA and 0.1% Triton X-100, incubated for 60 minutes at room temperature, followed by a biotinylated horse anti-rabbit antibody (6 μg/mL in PBS) for 60 minutes. Endogenous peroxidase activity was blocked with 3% H2O2 in PBS for 5 minutes. Visualization was performed using a Vectastain ABC Elite kit with 0.5 mg/mL 3,3′-diaminobenzidine (DAB) enhanced with 15 mg/mL ammonium nickel sulfate, 2 mg/mL beta-D glucose, 0.4 mg/mL ammonium chloride, and 0.01 mg/mL beta-glucose oxidase (Vector Laboratories, Burlingame, CA, U.S.A.). Negative controls, where the primary antibody was omitted, were completely blank, and preabsorbtion with the peptide provided by the manufacturer abolished the staining.
Cytochrome c
Nonspecific binding was blocked with 4% horse serum in PBS for 30 minutes. Anti-cytochrome c (1 μg/mL in PBS, clone 7H8.2C12) (PharMingen, San Diego, CA, U.S.A.) was applied and incubated for 60 minutes at room temperature, followed by another 60 minutes with a biotinylated horse anti-mouse antibody (2 μg/mL) in PBS. Peroxidase blocking and visualization were performed as above.
Microtubule-associated protein 2
Nonspecific binding was blocked with 4% horse serum in PBS for 30 minutes. Anti-MAP 2 (clone HM-2, Sigma, St. Louis, MO, U.S.A.) was applied diluted 1:2,000 (4 μg/mL) in PBS and incubated for 60 minutes at room temperature, followed by another 60 minutes with biotinylated horse anti-mouse (2 μg/mL) diluted with PBS. Peroxidase blocking and visualization were performed as above.
Oligonucleotide hairpin probe
A biotinylated oligonucleotide hairpin probe with one base overhang in the 3′ end (synthesized at Scandinavian Gene Synthesis, Köping, Sweden) was used as a marker of DNA damage (Didenko and Hornsby, 1996;Zhu et al., 2000). Staining was performed essentially according to Didenko and colleagues (1998). After deparaf-finization and rehydration, sections were incubated for 90 minutes at 65°C in 10 mM sodium citrate (pH 6.0), washed and treated with proteinase K (25 μg/mL in PBS) (Roche Diagnostics Scandinavia, Bromma, Sweden), for 10 minutes at room temperature. A mixture of 50 mM Tris-HCl (pH 7.8), 10 mM MgCl2, 10 mM dithiotreitol, 1 mM ATP, 15% polyethylene glycol 6000, with 35 μg/mL hairpin oligonucleotide and 250 U/mL T4 DNA ligase (Roche Diagnostics Scandinavia, Bromma, Sweden) was added, and the sections were incubated for 2 hours at room temperature. After washing, sections were incubated with 3% H2O2 in PBS for 5 minutes, followed by washing and 0.1% BSA in PBS for 30 minutes. Visualization was performed using a Vectastain ABC kit (Vector Laboratories, Burlingame, CA, U.S.A.). Negative controls, where the T4 DNA ligase was omitted, were completely blank.
AIF—HPP—Hoechst 33342
HPP staining was performed as described previously. After incubation with the HPP and T4 DNA ligase, sections were incubated with fluorescein-conjugated streptavidin (1:100 μg/mL in PBS) for 60 minutes. After washing, sections were blocked with 4% rabbit serum and incubated with the anti-AIF antibody as described above, followed by Texas Red-conjugated rabbit anti-goat IgG (1:100 in PBS) for 60 minutes. After washing, the sections were incubated with 1 μg/mL Hoechst 33342 in PBS (Molecular Probes, Eugene, OR, U.S.A.) for 10 minutes at room temperature with gentle agitation, washed, and mounted using Vectashield mounting medium (Vector Laboratories, Burlingame, CA, U.S.A.).
AIF—COX—Hoechst 33342
AIF and Hoechst stainings were performed as described (see above). After blocking with 4% normal horse serum for 30 minutes at room temperature, a monoclonal antibody against cytochrome c oxidase (COX) subunit IV was added at a dilution 1:100 (A-21347, 2.5 μg/mL) (Molecular Probes, Eugene, OR, U.S.A.) in 1% BSA-TBS overnight at 4°C. After washing, the sections were incubated with fluorescein-conjugated horse anti-mouse 1:100 (5 μg/mL) (Vector, Burlingame, CA, U.S.A.) for 60 minutes at room temperature.
Cell counting
Cell counting was performed in areas of cortex (layer V) affected by ischemia (MAP 2-negative areas on adjacent sections) by an observer naïve to treatment. From each individual brain (n = 4) three sections (800 μm apart) from the region of maximal infarct extension (from 0.4 to 0.2 mm anterior of bregma) were evaluated. Three randomly chosen visual fields (one visual field = 0.196 mm2) were counted within each section. The counts are reported as average number of cells per section.
Immunocytochemistry
Immunocytochemistry was performed as described previously (Culmsee et al., 2002). Briefly, cells grown on coverslips were fixed in 4% paraformaldehyde, permeabilized by exposure to 0.2% Triton X-100 for 5 minutes, and placed in blocking buffer (5% goat serum in PBS) for 30 minutes. Cells were then exposed to a polyclonal anti-AIF antibody (sc-9416, Santa Cruz; 1:200) overnight at 4°C, followed by an incubation for 1 hour with a biotinylated anti-goat IgG antibody (1:200) (Vector Laboratories, Burlingame, CA, U.S.A.) and 30 minutes in the presence of Oregon Green-streptavidin (Molecular Probes, Eugene, OR, U.S.A.). Then, the cells were incubated with 1 μg/mL Hoechst 33342 in PBS (Molecular Probes, Eugene, OR, U.S.A.) for 10 minutes at room temperature. The specificity of the immunoreaction was controlled by omission of the primary antibody. Images were acquired using a confocal laser scanning microscope (Carl Zeiss, Jena, Germany) with a 60× oil immersion objective (514-nm excitation and 535-nm emission for detection of Oregon Green and 352-nm excitation and 460-nm emission for detection of Hoechst 33342). All images were acquired using the same laser intensity and photodetector gain settings to allow comparisons of relative levels of immunoreactivity between cultures.
Statistical analysis
All data are given as means ± SD. For statistical comparisons between groups, the Kruskal-Wallis one-way analysis of variance on ranks test was used followed by Dunnett's all pairwise multiple comparison procedure as post hoc test. Calculations were performed with a standard statistical software package (SigmaStat 2.0, Jandel Scientific, Erkrath, Germany).
RESULTS
All animals showed comparable cerebral blood flow levels within the territory of the occluded middle cerebral artery (20 ± 8%). Before, during, and after ischemia, mean arterial blood pressure (84 ± 7 mm Hg, 82 ± 10 mm Hg, and 76 ± 10 mm Hg, respectively), pCO2 (37.4 ± 5.3, 45.2 ± 3.2, and 46.3 ± 3.9, respectively), pO2 (154 ± 18, 145 ± 8, and 140 ± 11, respectively), and arterial pH (7.36 ± 0.05, 7.30 ± 0.04, and 7.29 ± 0.04, respectively) were in the physiologic range.
A single 67 kDa band corresponding to the molecular weight of AIF was detected on immunoblots in lysates of primary cultured neurons (Fig. 1A). In mouse whole brain lysates and in mitochondrial fractions obtained from whole brain lysates, two bands (70 and 170 kDa) were identified (Fig. 1B). Similar bands were not detected in the cytosolic fraction of whole brain (Fig. 1B) or primary cultured neurons (Fig. 1C; control). In sections of mouse brain, AIF and the mitochondrial marker, cytochrome oxidase (COX), showed remarkable overlap within non-nuclear cell regions (Fig. 2) as did AIF and the nuclear dye Hoechst 33342 in primary cultured neurons (Fig. 3) and in sections from mouse brain (Figs. 2 and 6). These data demonstrate that the antibody indeed recognized a protein of approximately 67 kDa, which is localized to mitochondria, that is, AIF.
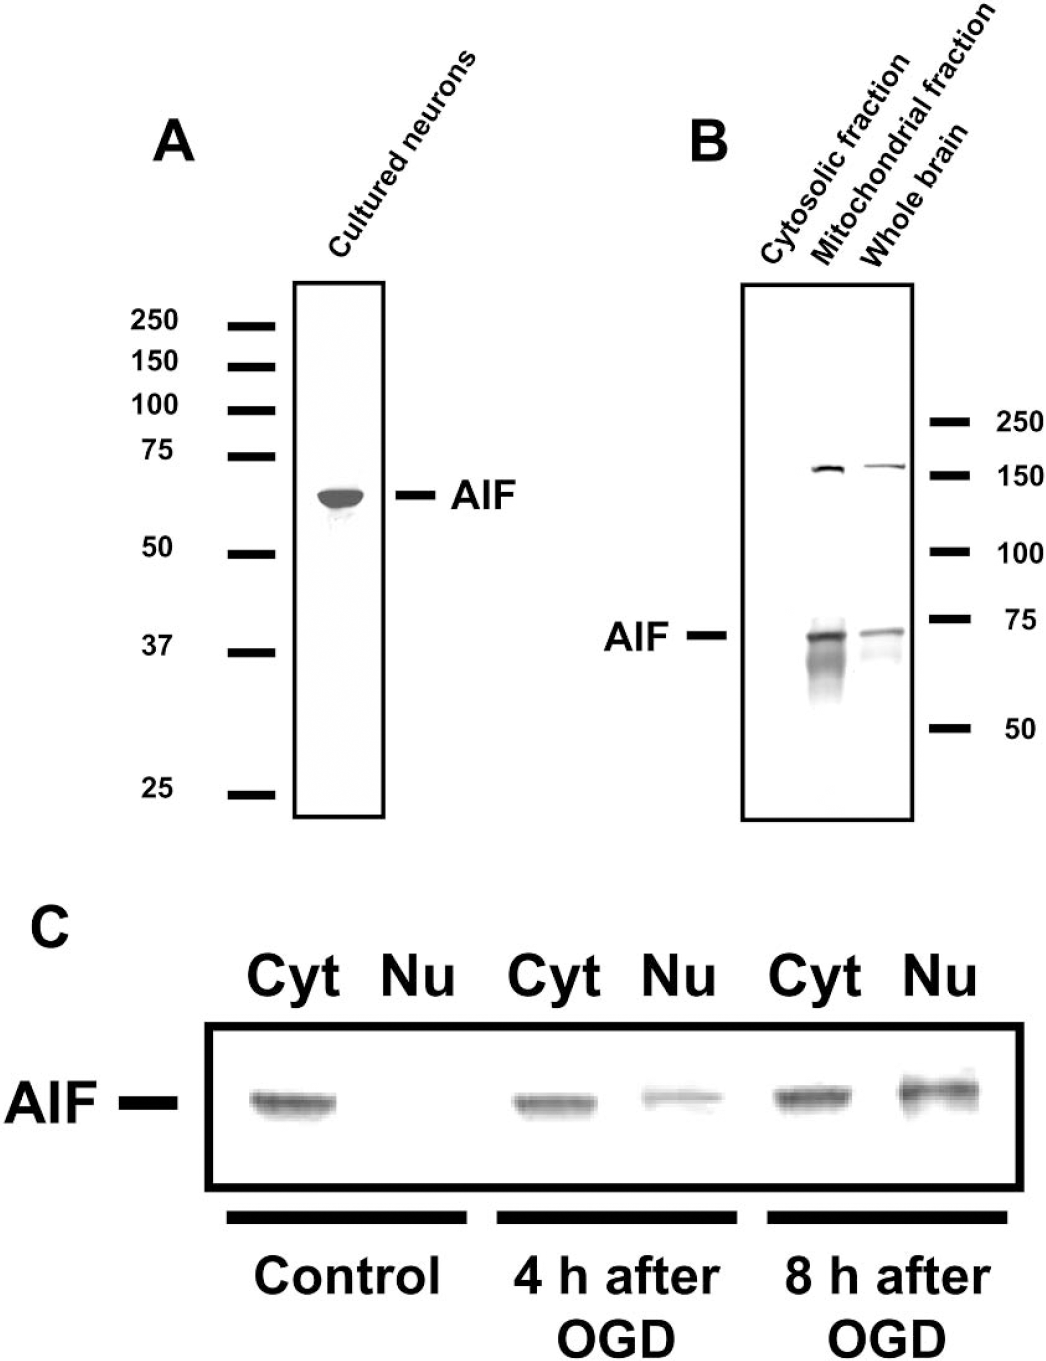
Detection of AIF in lysates from primary cultured neurons
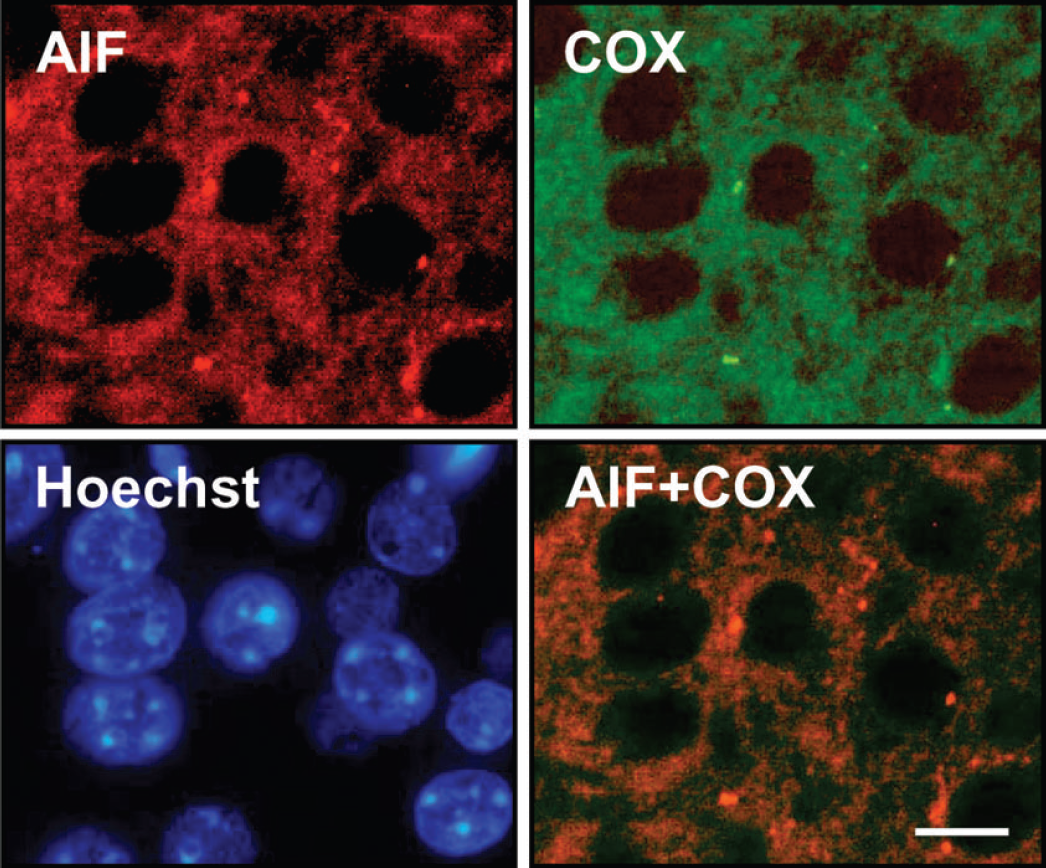
Immunohistochemistry of AIF (red) and COX (green), a mitochondrial marker, in normal mouse brain. Nuclei were counterstained with the DNA-binding dye Hoechst 33342 (blue). AIF and COX were exclusively detected outside the nucleus. Their staining pattern showed almost complete overlap (AIF + COX, orange) indicating mitochondrial localization of AIF. Scale bar: 10 μm. AIF, apoptosis-inducing factor; COX, cytochrome oxidase.
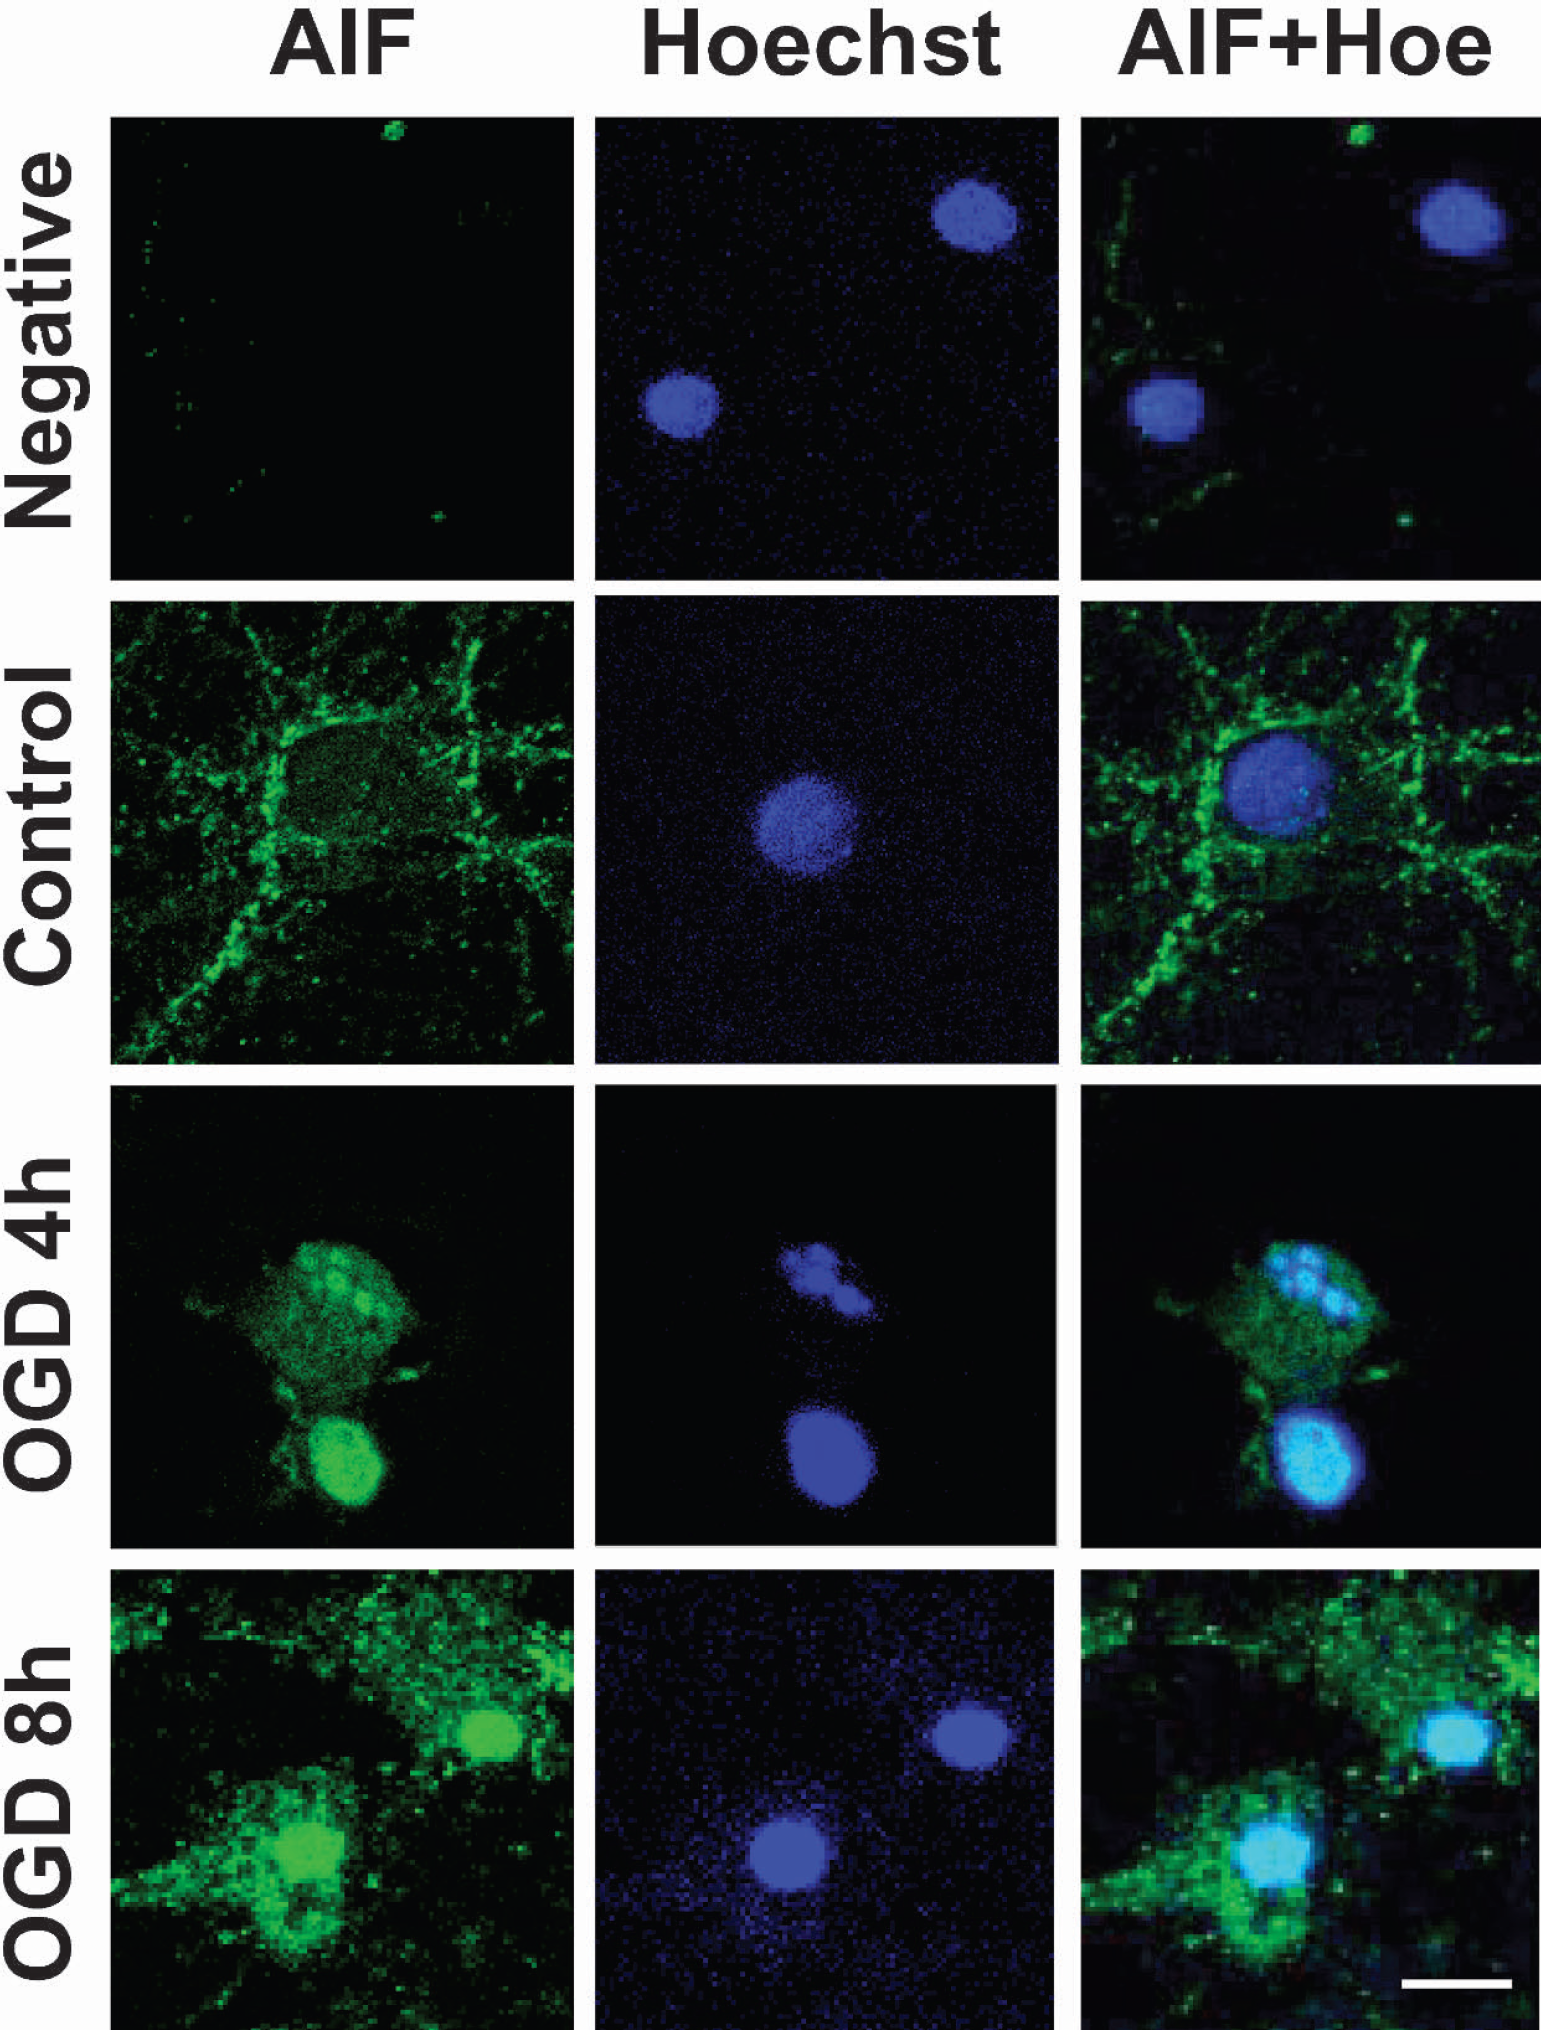
Immunocytochemistry of AIF (green). Nuclei were counterstained with the DNA-binding dye Hoe (dark blue). Under control conditions (Control), AIF was exclusively detected in the soma and processes of primary cultured rat neurons by confocal microscopy. Immunostaining was not observed when primary antibody was omitted (Negative). Four and eight hours after OGD nuclear staining of AIF (AIF + Hoe, light blue) together with nuclear condensation and fragmentation became prominent. AIF, apoptosis-inducing factor; Hoe, Hoechst 33342; OGD, oxygen-glucose deprivation.
Primary neuronal cultures (Fig. 3) or mouse brain (data not shown) did not stain for AIF when the primary antibody was omitted or when the antibody was preabsorbed with the peptide immunogen (data not shown). Neurons under control conditions showed only non-nuclear staining (Figs. 2, 3, and 6).
Four hours after OGD, the majority of cells showed nuclear staining for AIF, demonstrating nuclear translocation of the protein. At this time point, nuclear morphology and size were generally not altered, except single cells showing nuclear fragmentation (Fig. 3; OGD 4 hours); however, 8 hours after OGD, nuclear AIF relocation was observed together with nuclear condensation (Fig. 3; OGD 8 hours). These findings were confirmed by Western Blot analysis of lysates from OGD-treated neuronal cell cultures. AIF was only found within the cytosolic fraction in control preparations exposed to Locke's buffer with glucose for 4 hours (Fig. 1C; control). Four and eight hours after OGD, clear translocation of AIF to the nucleus was demonstrated (Fig. 1C).
Similar results were obtained in the brain after 45 minutes occlusion of the middle cerebral artery (MCAO). In naïve or sham-operated mice, AIF was localized exclusively in the cytoplasm of virtually all striatal and cortical cells (Figs. 4 and 6; control). One hour after MCAO, single cortical cells showed conspicuous AIF staining, and the staining pattern changed to reflect cytoplasmic and nuclear localization (Fig. 4; 1 hour). Four hours after ischemia, an increasing number of nuclei stained positive for AIF. Cortical cells displaying AIF translocation showed normal neuronal morphology, that is, triangular shape, small cytoplasm/nucleus ratio, and round or oval nuclei (Fig. 4; 4 hours). Only after 8 (not shown) and 24 hours, cells showed shrunken and irregular shapes (Fig. 4; 24 hours).
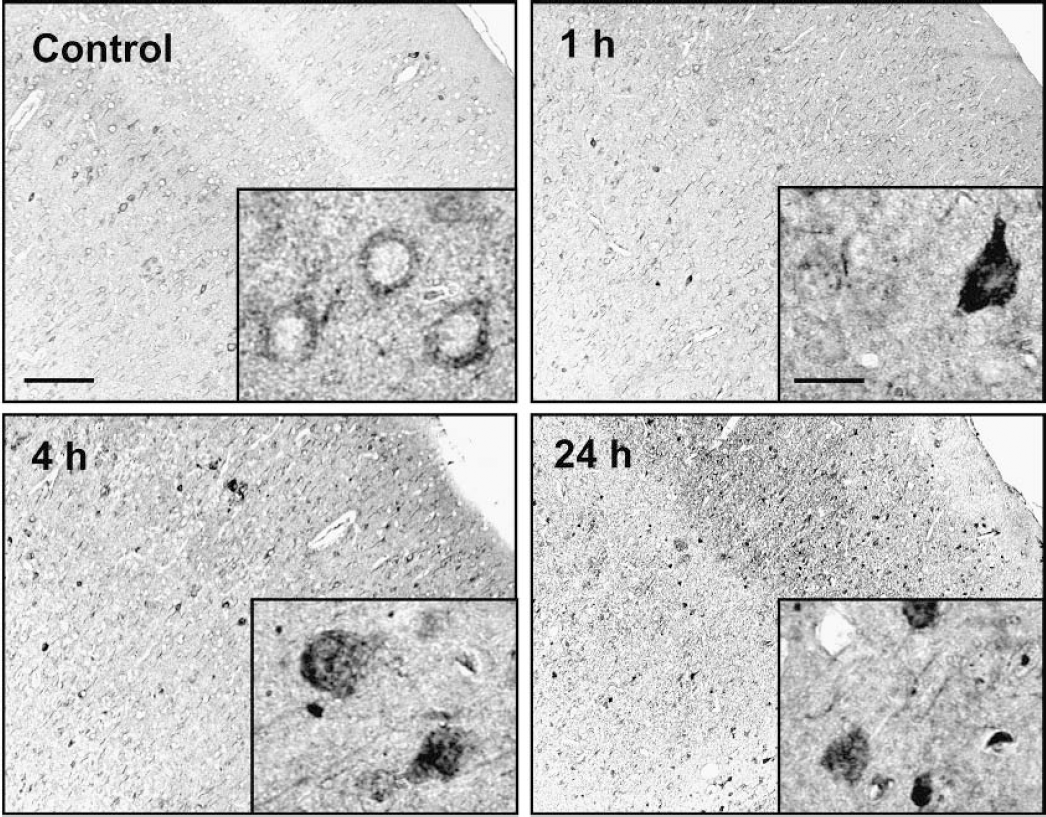
Low (100×, scale bar 100 μm) and high power (1,000×, scale bar 10 μm) photomicrographs of sections showing location and intensity of AIF immunostaining at different time points after reperfusion after 45 minutes of middle cerebral artery occlusion. AIF is detected in the cytoplasm of control neurons (Control). During the first 4 hours after reperfusion, nuclear morphology is not altered conspicuously but the intensity of AIF staining increases as does staining within the nucleus (1 and 4 hours). After 24 hours of reperfusion, positively stained cells show shrunken and serrated nuclei indicating irreversible nuclear damage. Scale bar: 10 and 100 μm, respectively. AIF, apoptosis-inducing factor.
The number of counted cells showing nuclear AIF in cortex increased 1 hour after the end of ischemia (Fig. 5, open bars). The highest number of AIF-positive cells was observed 24 hours after ischemia (P < 0.001).
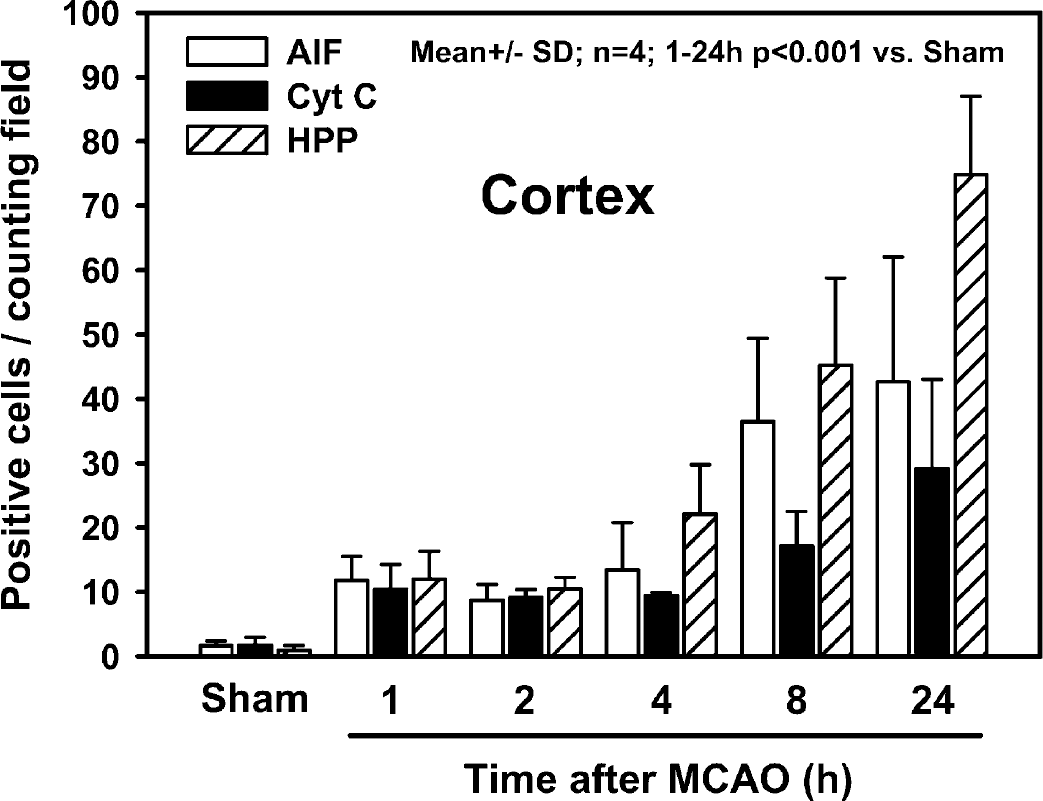
Quantification of cells (mean ± SD) stained positively for Cyt C, oligonucleotide HPP, and AIF at different time points of reperfusion after 45 minutes of MCAO in the cortex of mouse brain (n = 4). Cell counting was performed in areas of the cortex affected by ischemia (MAP 2-negative areas on adjacent sections). Three randomly selected fields (0.196 mm2 per field) were counted on three different sections (50 μm apart). Significant numbers of positively stained cells were detected for all three markers 1 hour after reperfusion (P < 0.001 vs. sham). More than twice as many AIF- and Cyt C-positive cells were found 8 and 24 hours after reperfusion as compared with the first 4 hours after ischemia. During the same period of time, the number of cell showing DNA damage (HPP-positive cells) increased almost sevenfold. Cyt C, cytochrome C; HPP, hairpin probe; AIF, apoptosis-inducing factor; MCAO, middle cerebral artery occlusion.
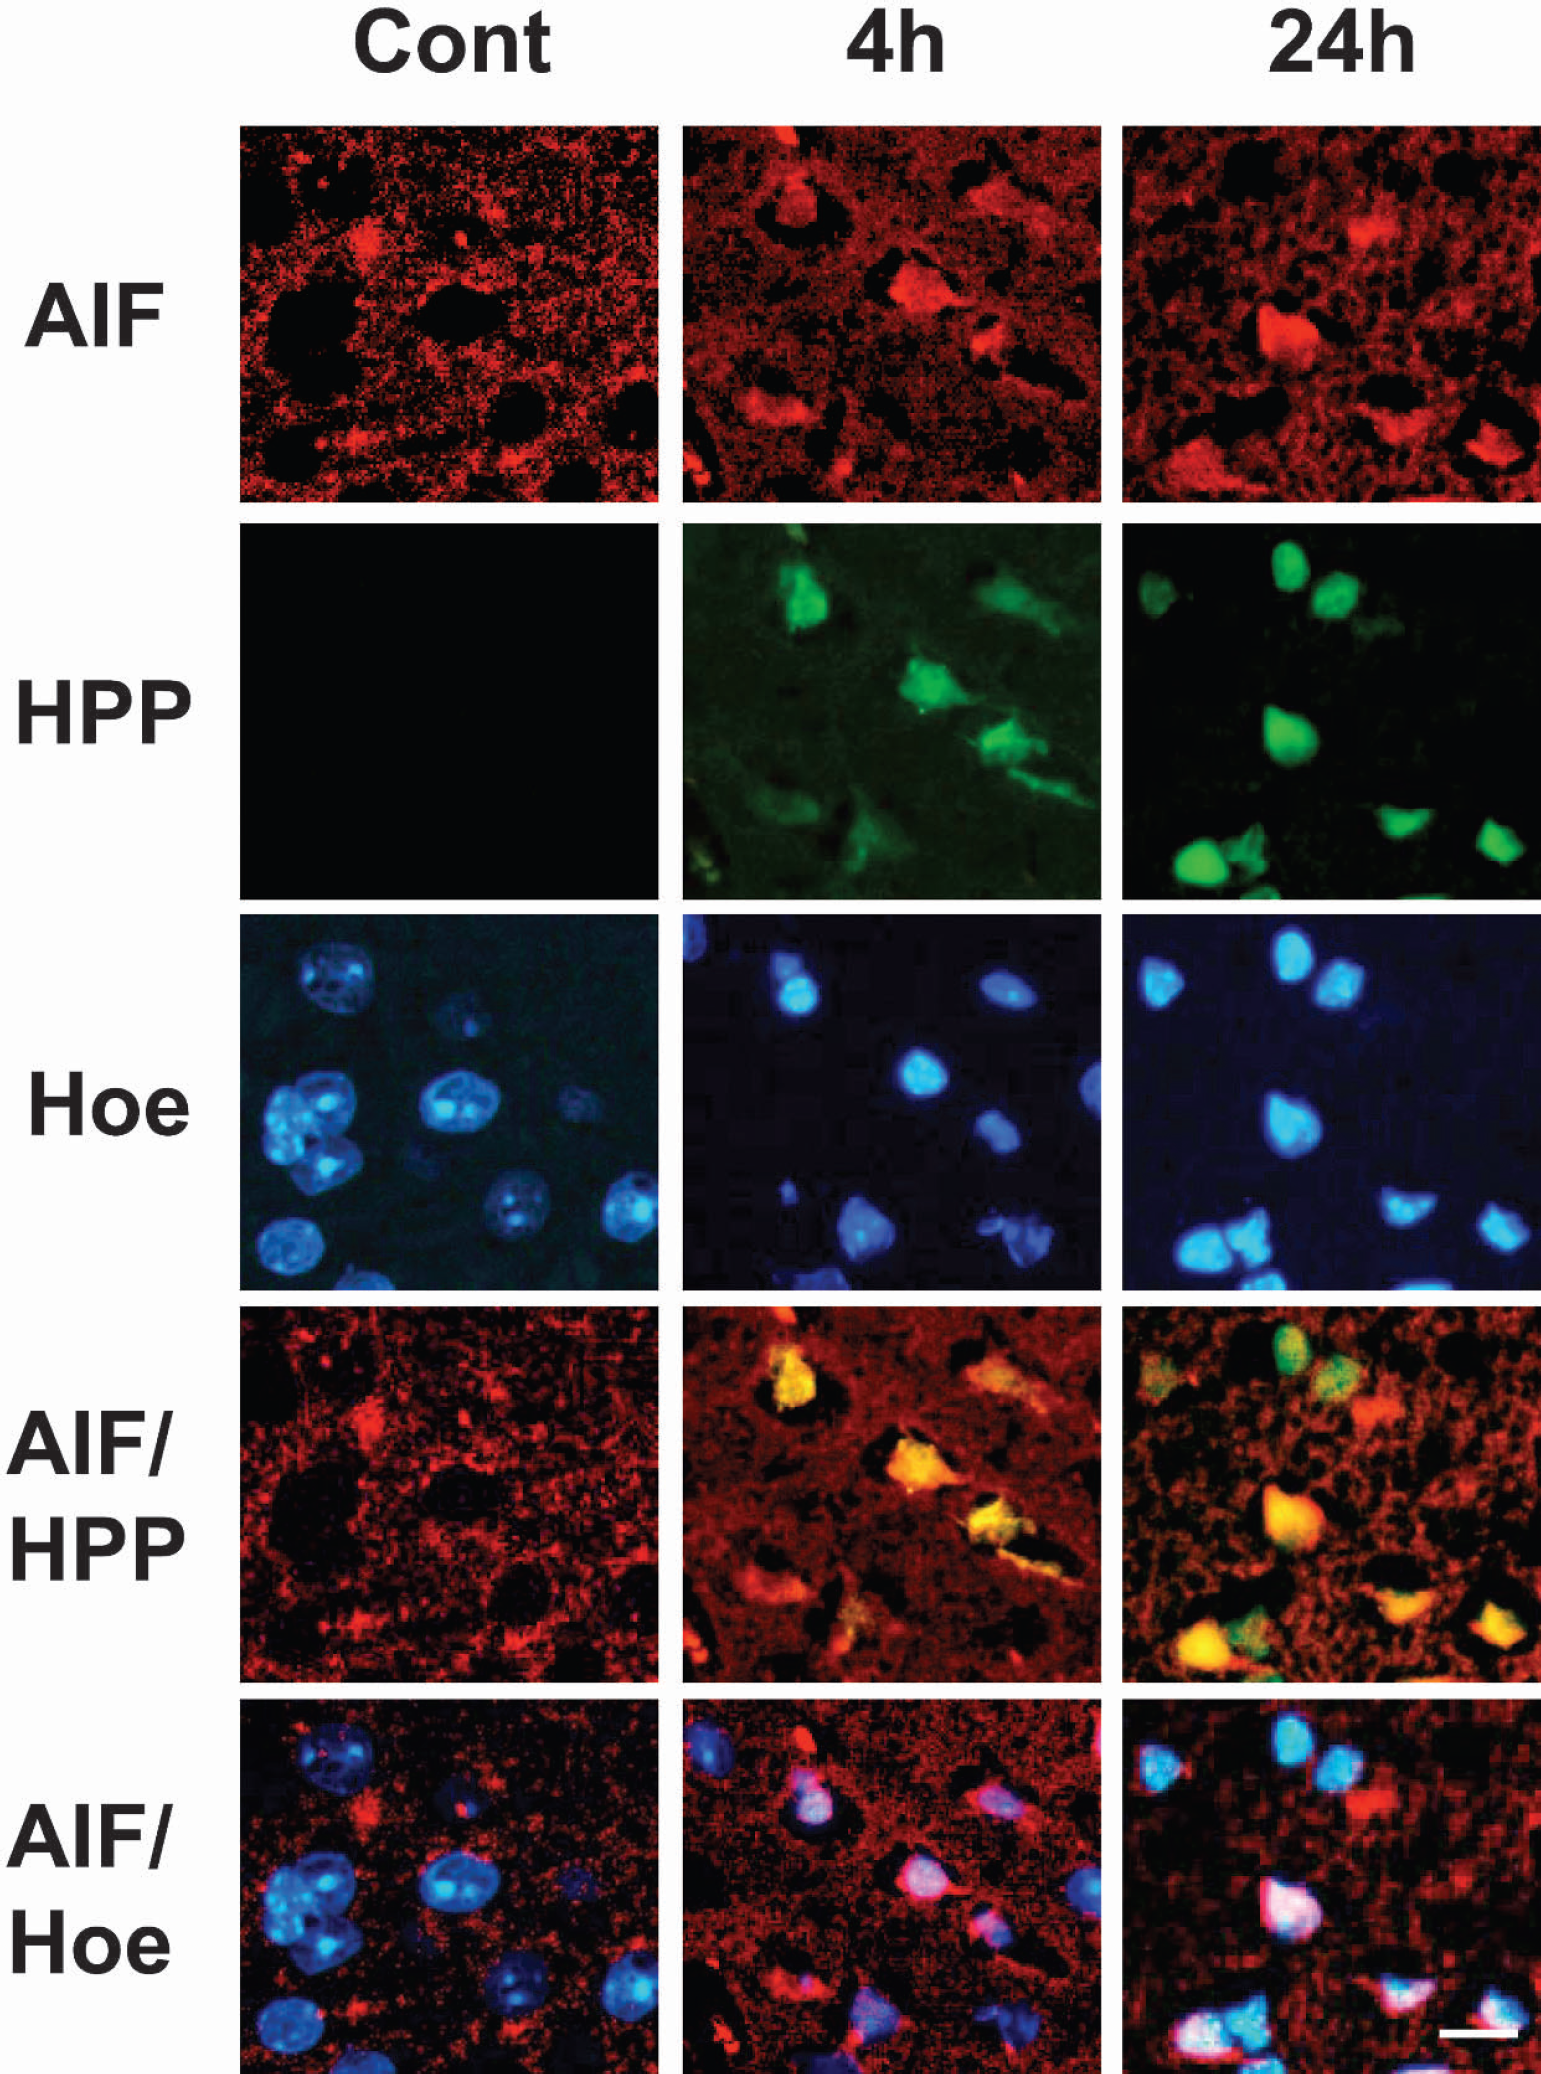
Triple-staining showing the colocalization of oligonucleotide HPP (green), AIF (red), and the nuclear dye Hoe (blue) within single cortical cells in control mouse brain (left column) and at 4 and 24 hours (right columns) after reperfusion after 45 minutes of MCAO. Under control conditions, AIF was detected exclusively in the cytoplasm (AIF/Hoe). Four hours after reperfusion, HPP and Hoechst staining and the overlay of HPP and AIF staining (lower right panels, yellow) indicate that AIF is contained within nuclei showing DNA fragmentation and nuclear condensation. Twenty-four hours after reperfusion, DNA fragmentation and nuclear condensation appear more intense along with more pronounced nuclear shrinking. However, there are cells with DNA fragmentation and nuclear condensation that do not show AIF-staining (lower right panel, white arrows). Scale bar: 10 μm. HPP, hairpin probe; AIF, apoptosis-inducing factor; Hoe, Hoechst 33342; MCAO, middle cerebral artery occlusion.
AIF translocation was accompanied by changes associated with postischemic cell death. Integrity of structural neuronal proteins (e.g., MAP 2) was maintained up to 4 hours after ischemia but decreased thereafter and was no longer detectable 24 hours after MCAO (data not shown). Before the disappearance of MAP 2, cytoplasmic cyto-chrome c immunostaining increased at 1 and 4 hours in parallel with nuclear AIF translocation and apoptosis-related DNA strand breaks as detected by an oligonucleo-tide hairpin probe (data not shown) (Zhu et al., 2000).
Cells showing evidence of AIF and cytochrome c release and DNA damage were counted in areas of the striatum and cortex affected by ischemic cell death (i.e., areas devoid of MAP 2 immunostaining 24 hours after MCAO). In the striatum, significant numbers of AIF-, cytochrome c-, and HPP-positive cells were detected by 1 hour after reperfusion (data not shown; P < 0.001 vs. sham-operated animals). Positive staining for cyto-chrome c and AIF peaked between 4 and 8 hours and decreased thereafter, whereas the number of cells displaying DNA damage increased steadily during this time. Compared with the striatum, the appearance of AIF-, cytochrome c-, and HPP-positive cells was markedly delayed in the cortex (Fig. 5). Although significant numbers of cells displayed these markers by 1 hour after reperfusion, no further increase was observed during the next 7 hours. At 8 hours after the end of ischemia, however, the number of cells showing nuclear AIF plus evidence of cytosolic AIF and cytochrome c increased by almost two- or threefold, respectively, as compared with the earlier time points (Fig. 5). Considering that cyto-chrome c release from mitochondria is a crucial step for downstream caspase-9 and −3 activation, (Fujimura et al., 1998b; Krajewski et al., 1999b;Sasaki et al., 2000), it is interesting to note that a greater number of cells stained positive for cytosolic/nuclear AIF than for cytochrome c.
Four hours after ischemia, cells displaying DNA damage and nuclear condensation in the cortex were also AIF-positive (Fig. 6; 4 hours). Twenty hours later, DNA degradation and nuclear condensation increased significantly as compared with the 4-hour time-point (Fig. 6; 24 hours). Cells with the most intense HPP staining were AIF-positive; however, HPP-positive cells without AIF-staining were also detected.
DISCUSSION
The current experiments performed upon primary cultured neurons after oxygen/glucose deprivation and upon mouse brain tissue subjected to focal cerebral ischemia by MCAO clearly demonstrate that AIF was released from mitochondria and translocated to the nucleus during postischemic neuronal cell death. To our knowledge, this is the first report to implicate AIF in neuronal cell death after focal cerebral ischemia.
As noted in the previous section, oxygen-glucose deprivation (OGD) caused rapid redistribution of AIF from mitochondria to the nucleus. (Figs. 1C and 3). Four hours after OGD, AIF was detected in the nucleus of single neurons, similar to changes observed after camptothecin-or NMDA-induced neuronal cell death (Cregan et al., 2002;Yu et al., 2002). After 8 hours, cells that displayed AIF translocation also showed clear nuclear pathology (Fig. 3; OGD 8 hours) suggesting that AIF may promote DNA damage. Although the precise mechanisms for AIF-induced DNA damage is still unknown (Lorenzo et al., 1999;Ye et al., 2002), several mechanisms for the upstream AIF-activated cell death pathway have been proposed recently for neurons (Cregan et al., 2002;Yu et al., 2002). Cregan and colleagues showed that camptothecin-induced/p53-dependent cell death has a fast, APAF-1-/cytochrome c-/caspase-mediated component and a slower, AIF-mediated but caspase-independent component in apaf-1-deficient neurons. Both cell death pathways could be activated independently from each other; for example, AIF could cause caspase-independent apoptosis-like nuclear morphology in the presence of a normal mitochondrial membrane potential and cytochrome c content (Cregan et al., 2002). Similar findings were reported after NMDA-induced neuronal cell death, wherein AIF translocated to the nucleus before the appearance of nuclear pathology (Yu et al., 2002). In the same paradigm, cytochrome c release was caspase-dependent, whereas that of AIF was not. Because AIF can also be released in a caspase-dependent manner in non-neuronal cells (Arnoult et al., 2002), this process may be selective for neurons.
It is of interest to note that nuclear AIF translocation depends upon the activity of poly(ADP-ribose) polymerase 1 (PARP-1) during NMDA-induced neuronal cell death (Yu et al., 2002).
Because NMDA activation mediates cell death after oxygen/substrate deprivation (Choi, 1993) and PARP-1 inhibitors reduce cell death in the same paradigm, PARP-1 may also be responsible for the AIF release after in vitro ischemia (OGD) observed in the current experiments (Figs. 1C and 3). This is indirectly supported by the fact that, recently, PARP-1 has been associated with apoptotic-like cell death in neuronal cells (Chiarugi, 2002;Chiarugi and Moskowitz, 2002), which is a prominent component of neuronal cell death after oxygen/substrate deprivation (OGD) (Le et al., 2002;Plesnila et al., 2001).
Our data further implicate AIF in ischemic cell death in vivo. One hour after focal cerebral ischemia, single cells showed AIF relocation from mitochondria to cyto-sol and to the nucleus (Fig. 4), as well as a substantial increase in immunostaining. At later time points (8–24 hours), cells showing nuclear AIF localization also displayed significant nuclear pathology (e.g., nuclear deformation and condensation), indicating that AIF may promote DNA damage and cell death after cerebral ischemia. This is supported by similar observations in other neuronal cell death paradigms, such as traumatic brain injury (Zhang et al., 2002), hypoglycemia (Ferrand-Drake et al., 2003), and neonatal hypoxia-ischemia (Zhu et al., 2003). In focal ischemia, the number of neurons displaying AIF relocation follows the time course of cell death in the currently used ischemia model, that is, cortical cells die between 8 and 24 hours after reperfusion. Accordingly, only a few cortical cells showed AIF redistribution at early time points (1–4 hours), whereas their numbers increased significantly between 8 and 24 hours (Fig. 5).
Upstream mechanisms involved in AIF release have been explored after focal cerebral ischemia. The pore-forming Bcl-2 family members BID and BAX, which are necessary for AIF release in neurons (Cregan et al., 2002), are major mediators of cell death after ischemia (Plesnila et al., 2001). Furthermore, overexpression of Bcl-2, which blocks AIF release, is neuroprotective after focal ischemia (Martinou et al., 1994;Zhao et al., 2003). PARP-1, which mediates nuclear AIF relocation after exposure to NMDA in neurons (Yu et al., 2002), is cleaved after focal cerebral ischemia, and parp-1-deficient mice are highly resistant to experimental stroke (Eliasson et al., 1997;Endres et al., 1997). Finally, cerebral ischemia causes AIF-specific DNA fragments of approximately 50 kbp (Charriaut-Marlangue et al., 1996;Yu et al., 2002), in addition to caspase-associated DNase (CAD)-specific DNA fragments of 200 to 1,000 bp. Because ischemia is accompanied by nuclear AIF relocation plus upstream and downstream events in the AIF-mediated death pathways, it seems reasonable to conclude that AIF may be a mediator of cell death after focal cerebral ischemia.
The number of cells containing AIF nuclear staining was greater than the number of cells showing evidence of cytochrome c staining. This may suggest that AIF and cytochrome c, which cause caspase-independent and caspase-dependent DNA damage downstream of mitochondria, respectively, are equally important for cell demise in cerebral ischemia. The parallel or subsequent activation of caspase-dependent/cytochrome c-mediated and caspase-independent/AIF-mediated cell death pathways may well serve as a good explanation for several previous findings after experimental stroke. For example, caspase-3 knock-out mice show significant neuroprotection after focal ischemia (Le et al., 2002), however, less than was anticipated based on previous studies showing impressive neuroprotection by modulation of mitochondrial proteins, such as by cyclosporine A (Shiga et al., 1992;Yoshimoto and Siesjo, 1999), knockout of bid (Plesnila et al., 2001), overexpression of sod (Fujimura et al., 2000), and bcl-2 (Martinou et al., 1994).
In conclusion, our findings demonstrate that AIF is released from mitochondria and translocates to the nucleus and that this translocation is associated with apoptosis-like DNA damage and cell death after focal cerebral ischemia.