
Abstract
High-intensity transient signals (HITS) detected by transcranial Doppler (TCD) ultrasound may correspond to artifacts or to microembolic signals, the latter being either solid or gaseous emboli. The goal of this study was to assess what can be achieved with an automatic signal processing system for artifact/microembolic signals and solid/gas differentiation in different clinical situations. The authors studied 3,428 HITS in vivo in a multicenter study, i.e., 1,608 artifacts in healthy subjects, 649 solid emboli in stroke patients with a carotid stenosis, and 1,171 gaseous emboli in stroke patients with patent foramen ovale. They worked with the dual-gate TCD combined to three types of statistical classifiers: binary decision trees (BDT), artificial neural networks (ANN), and support vector machines (SVM). The sensitivity and specificity to separate artifacts from microembolic signals by BDT reached was 94% and 97%, respectively. For the discrimination between solid and gaseous emboli, the classifier achieved a sensitivity and specificity of 81% and 81% for BDT, 84% and 84% for ANN, and 86% and 86% for SVM, respectively. The current results for artifact elimination and solid/gas differentiation are already useful to extract data for future prospective clinical studies.
Over 10 years ago, it was recognized that it was possible to detect microemboli moving through the brain arteries with transcranial Doppler ultrasound (TCD) by recording high-intensity transient signals (HITS) (Evans, 1999; Hennerici, 1995; Markus, 2000; Spencer, 1992; Spencer et al., 1990). TCD offers a unique window to approach the pathogenesis of brain embolism in humans (Markus, 2000). However, the clinical usefulness of HITS as a surrogate marker for clinical brain embolism risk is still debated (Easton, 1999), mainly because of the failure to discriminate the nature of HITS into artifacts or solid or gaseous emboli in different pathologic conditions (Markus, 2000).
The artifacts and solid and gas differentiation are of interest as suggested by recent studies on carotid endarterectomy (CEA) and coronary artery bypass grafting (CABG) (Ackerstaff et al., 2000; Babikian and Cantelmo, 2000; Newman et al., 2001a; Newman et al., 2001b; Selnes et al., 2001). Neurologic complications are most frequent and serious in both CABG and CEA. Stroke incidence is 1.5% to 5.2% for CABG (Newman et al., 2001a; Newman et al., 2001b; Selnes et al., 2001) and 5.5% in the North American Symptomatic Carotid Endarterectomy Trial to 6.5% in the European Carotid Surgery Trial for CEA (Babikian and Cantelmo, 2000). In addition, neurocognitive decline has been reported particularly in CABG (Newman et al., 2001a; Newman et al., 2001b; Selnes et al., 2001) and in CEA (Ackerstaff et al., 2000). A substudy from the earlier one of Newman et al. (2001b) showed that 5 years after CABG, there is a strong relationship between neurocognitive functioning and quality of life. From these observations, early interventions to prevent or reduce short- and long-term neurologic complications are warranted. The mechanisms advanced to explain the occurrence of stroke and cognitive changes are brain microemboli and to a lesser extent hypoperfusion. To protect the brain of patients after carotid and cardiac surgery, more and more people recommend to use preoperative evaluation such as the arrival of microemboli in middle cerebral arteries (MCAs) by TCD monitoring (Ackerstaff et al., 2000; Babikian and Cantelmo, 2000; Caplan, 2001). However, before performing interventional procedures for neuroprotection during carotid and cardiac surgery based on TCD monitoring, we need more information concerning the nature of HITS: artifacts, solid emboli, or gaseous emboli (Babikian and Cantelmo, 2000). During CEA and cardiac surgery, air and solid emboli are strongly intricated. They can be detected with TCD but it has been very difficult to distinguish solid from gaseous microemboli. Solid emboli are potentially far more damaging than gaseous emboli. They imply different therapeutic strategies.
Once HITS have been identified from the background Doppler signal, referred to as HITS detection, they are differentiated into artifacts and microembolic signals (MES); this is referred to as MES identification. The third task is then to differentiate between solid and gaseous MES; this is referred to as solid/gas separation. Each one of these three differentiation tasks consists in choosing between two classes, and is thus a classification problem (Fig. 1). The background Doppler signal is simply the signal of normal blood flow. Artifacts can occur for a variety of reasons (movement of the probe, rotation of the head, coughing, sneezing). From these three steps (Fig. 1), the classification of MES into the solid and gaseous types may represents the most difficult and challenging task (Russell and Brucher, 2001). The main focus of this article is solid/gas separation. To this end, we directed our efforts into several directions. First, we undertook a multicenter study including five different university hospitals. In this way, to the best of our knowledge, we could build the largest set of HITS in vivo with unequivocal sources of artifacts, gaseous and solid emboli, the latter being particularly difficult to collect in vivo. Second, we randomly divided this data set into three sets: a learning set, a validation set, and a test set. This is necessary to obtain statistically meaningful results. Third, we used a panel of advanced methods of signal processing and statistics for solving the most difficult aspect in the analysis of TCD signals: the differentiation between solid and gaseous microemboli, with a view to investigating the relative merits of these methods with respect to our goal. These three directions represent the originality of this final report of our multicenter study with respect to previous ones (Devuyst et al., 2000, 2001), where we reported preliminary results on a much lower number—greater than five times more in this present study—of HITS, fewer statistics, and only one signal processing approach.
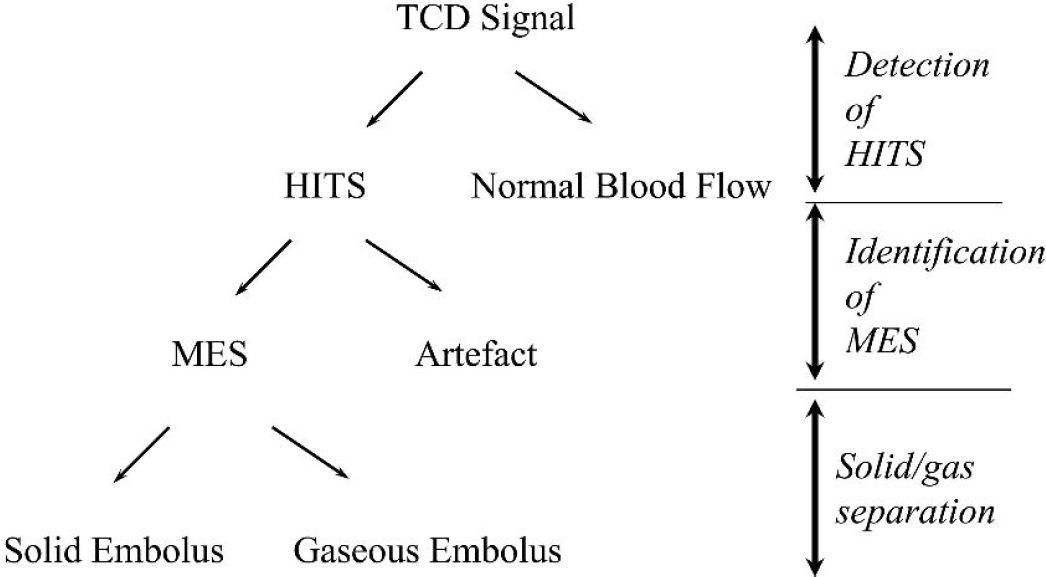
Decision tree with the three steps of transcranial Doppler (TCD) signal analysis: (1) detection of high-intensity signals (HITS), i.e., differentiation between HITS and background Doppler signal; (2) Identification of microembolic signals (MES), i.e., differentiation between MES and artifacts; and (3) MES classification, i.e. separation between solid and gaseous emboli.
Our aim is to study the possibility of automatically classifying microemboli into artifacts and solid and gaseous emboli with the help of following processing methods: decision trees, artificial neural networks, and support vectors machines.
MATERIALS AND METHODS
Patients and subjects
Transcranial Doppler monitoring
In all five neurology departments involved in this study, TCD signals were recorded during a 1-hour period using the same Doppler device (Multi-Dop X 4; DWL, Sipplingen, Germany; TCD-8 software, version 8.00K or higher). Two 2-MHz pulsed probes (one for each MCA) were fixed on a special headset connected to the Doppler machine. Each MCA was simultaneously insonated through the temporal window at two different depths (50 and 60 mm). Therefore, for each HITS, two signals were acquired (dual-gated TCD) (Ringelstein et al., 1998). A setting guaranteeing optimal embolus discrimination from the background spectrum was employed, using the criteria recommended in the International Consensus Group on Microembolus Detection (Ringelstein et al., 1998). All five neurology departments respected this setting. Signals with a peak MEPR (Table 1), which is defined as 10 log10 (peak power of the embolus part of the signal/ mean power of the part of the signal without embolus), of no less than 9 dB were recorded.
List of features calculated from the transcranial Doppler signals
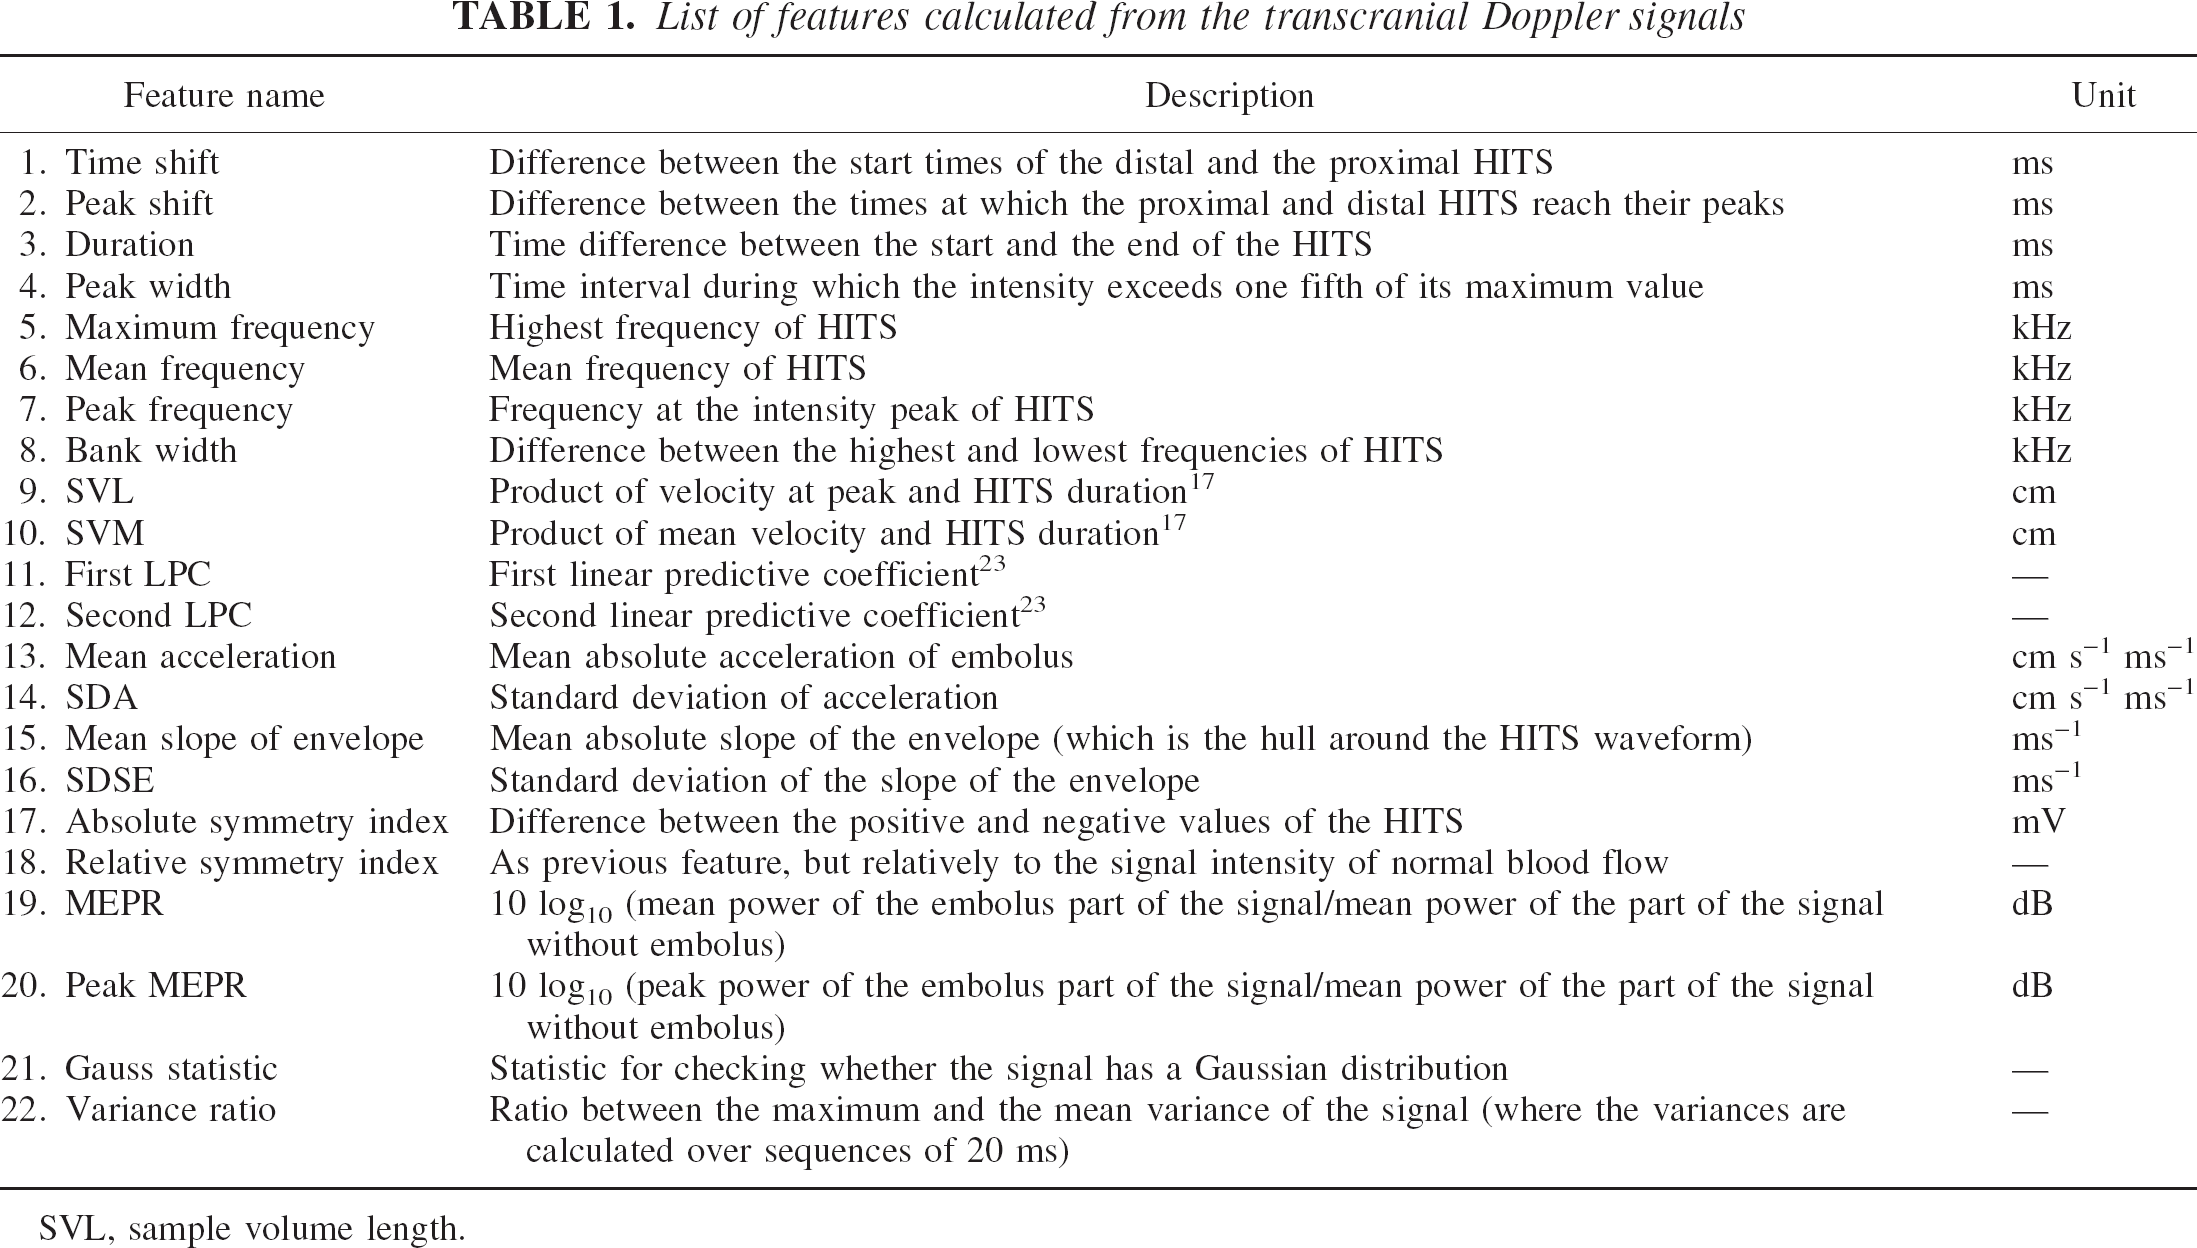
SVL, sample volume length.
Role of human experts
For the first two levels of the decision tree (Fig. 1) the experienced observer's offline analysis of HITS is taken as the reference (Markus et al., 1997). In our study three observers (G.D., G.A.D., and J.M.V.) reviewed the signals, and all observers had to agree with respect to HITS detection and MES identification (Devuyst et al., 2001). For the last level of the decision tree (Fig. 1) the situation is different: because no expert can reliably decide on the gaseous or solid nature of Doppler signals, we had to preselect patients to know the nature of emboli—solid emboli being obtained from high-grade symptomatic ICA stenosis patients and gaseous emboli being collected during the diagnosis of PFO-stroke patients.
Statistical methodology
At each level of our decision tree (Fig. 1) we have to differentiate between two classes. Our goal is to construct a model for automatic class prediction. Therefore, in order to calculate the predictive ability of a model, we need to set aside some data that will not be used in the course of model construction. This set of data, to be referred to as the test set, represents the future data that the model will have to deal with. Approximately one third of the data are to be randomly assigned to the test set. The rest will belong to the learning set, i.e., the set of data used for constructing models. The learning set itself will be divided into a training set and a validation set: the former is used to construct models and the latter to choose the best model among them. All results reported in this article are test set results. Sensitivity and specificity, both with the confidence interval at the 95% level, were used for each step of HITS classification. The receiver-operating characteristic (ROC) curve is also presented for each classifier.
Design of the algorithm
As shown in Fig. 1 there are three differentiation tasks: between HITS and background Doppler signal, between MES and artifacts, and between solid and gaseous emboli. The models for performing the three differentiation tasks of the decision tree have an algorithmic nature: they calculate some characteristic numbers from the TCD signals and then combine them to reach a decision. These numbers are also known as the features or the attributes. They are presented in Table 1. In the Results section, we will explain which subset of features is used for each task. The features were extracted in the time domain and in the frequency domain (through a fast-Fourier transform). Those features that can be calculated on both channels (dual-gated TCD) were averaged. Before extracting features, it is necessary to isolate the HITS within a recording. We do this with the help of the wavelet transform (Mallat, 1998). It is applied to both channels. The aim of this transformation is to remove the part of the signal coming from the normal blood flow and to retain only the time segment containing an HITS (Fig. 3).
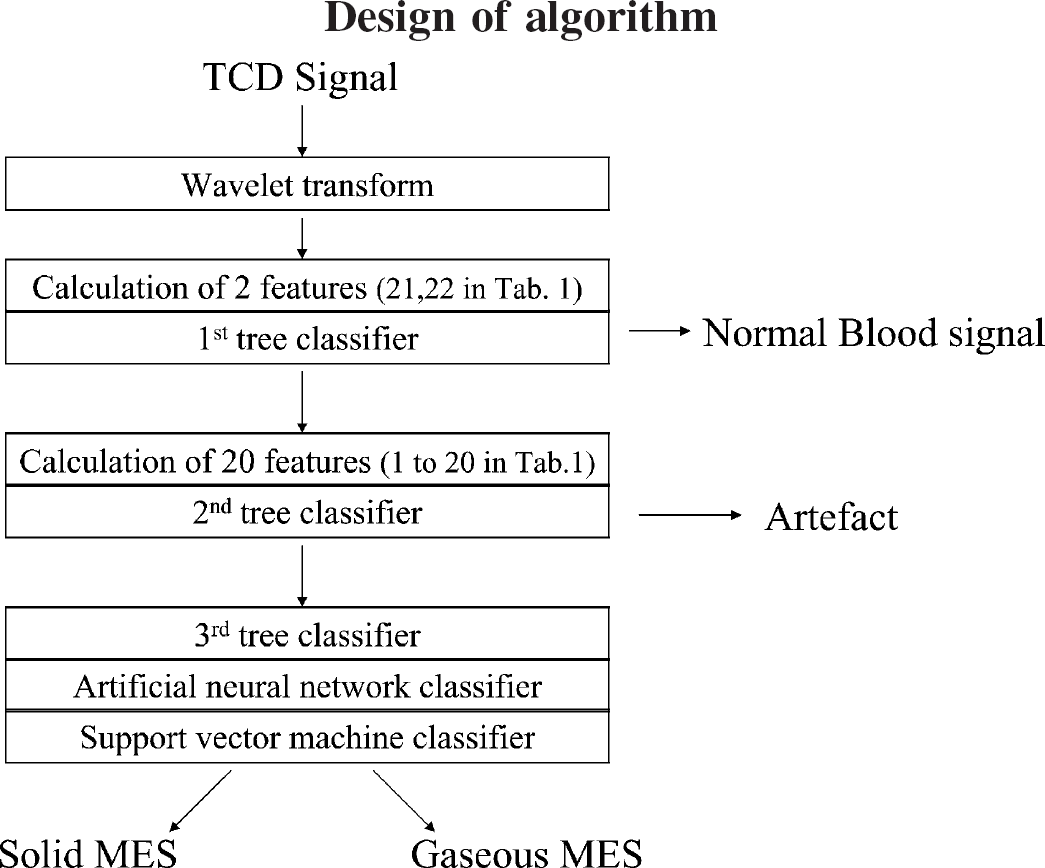
Flow chart of the algorithm. TCD, transcranial Doppler; MES, microembolic signal.
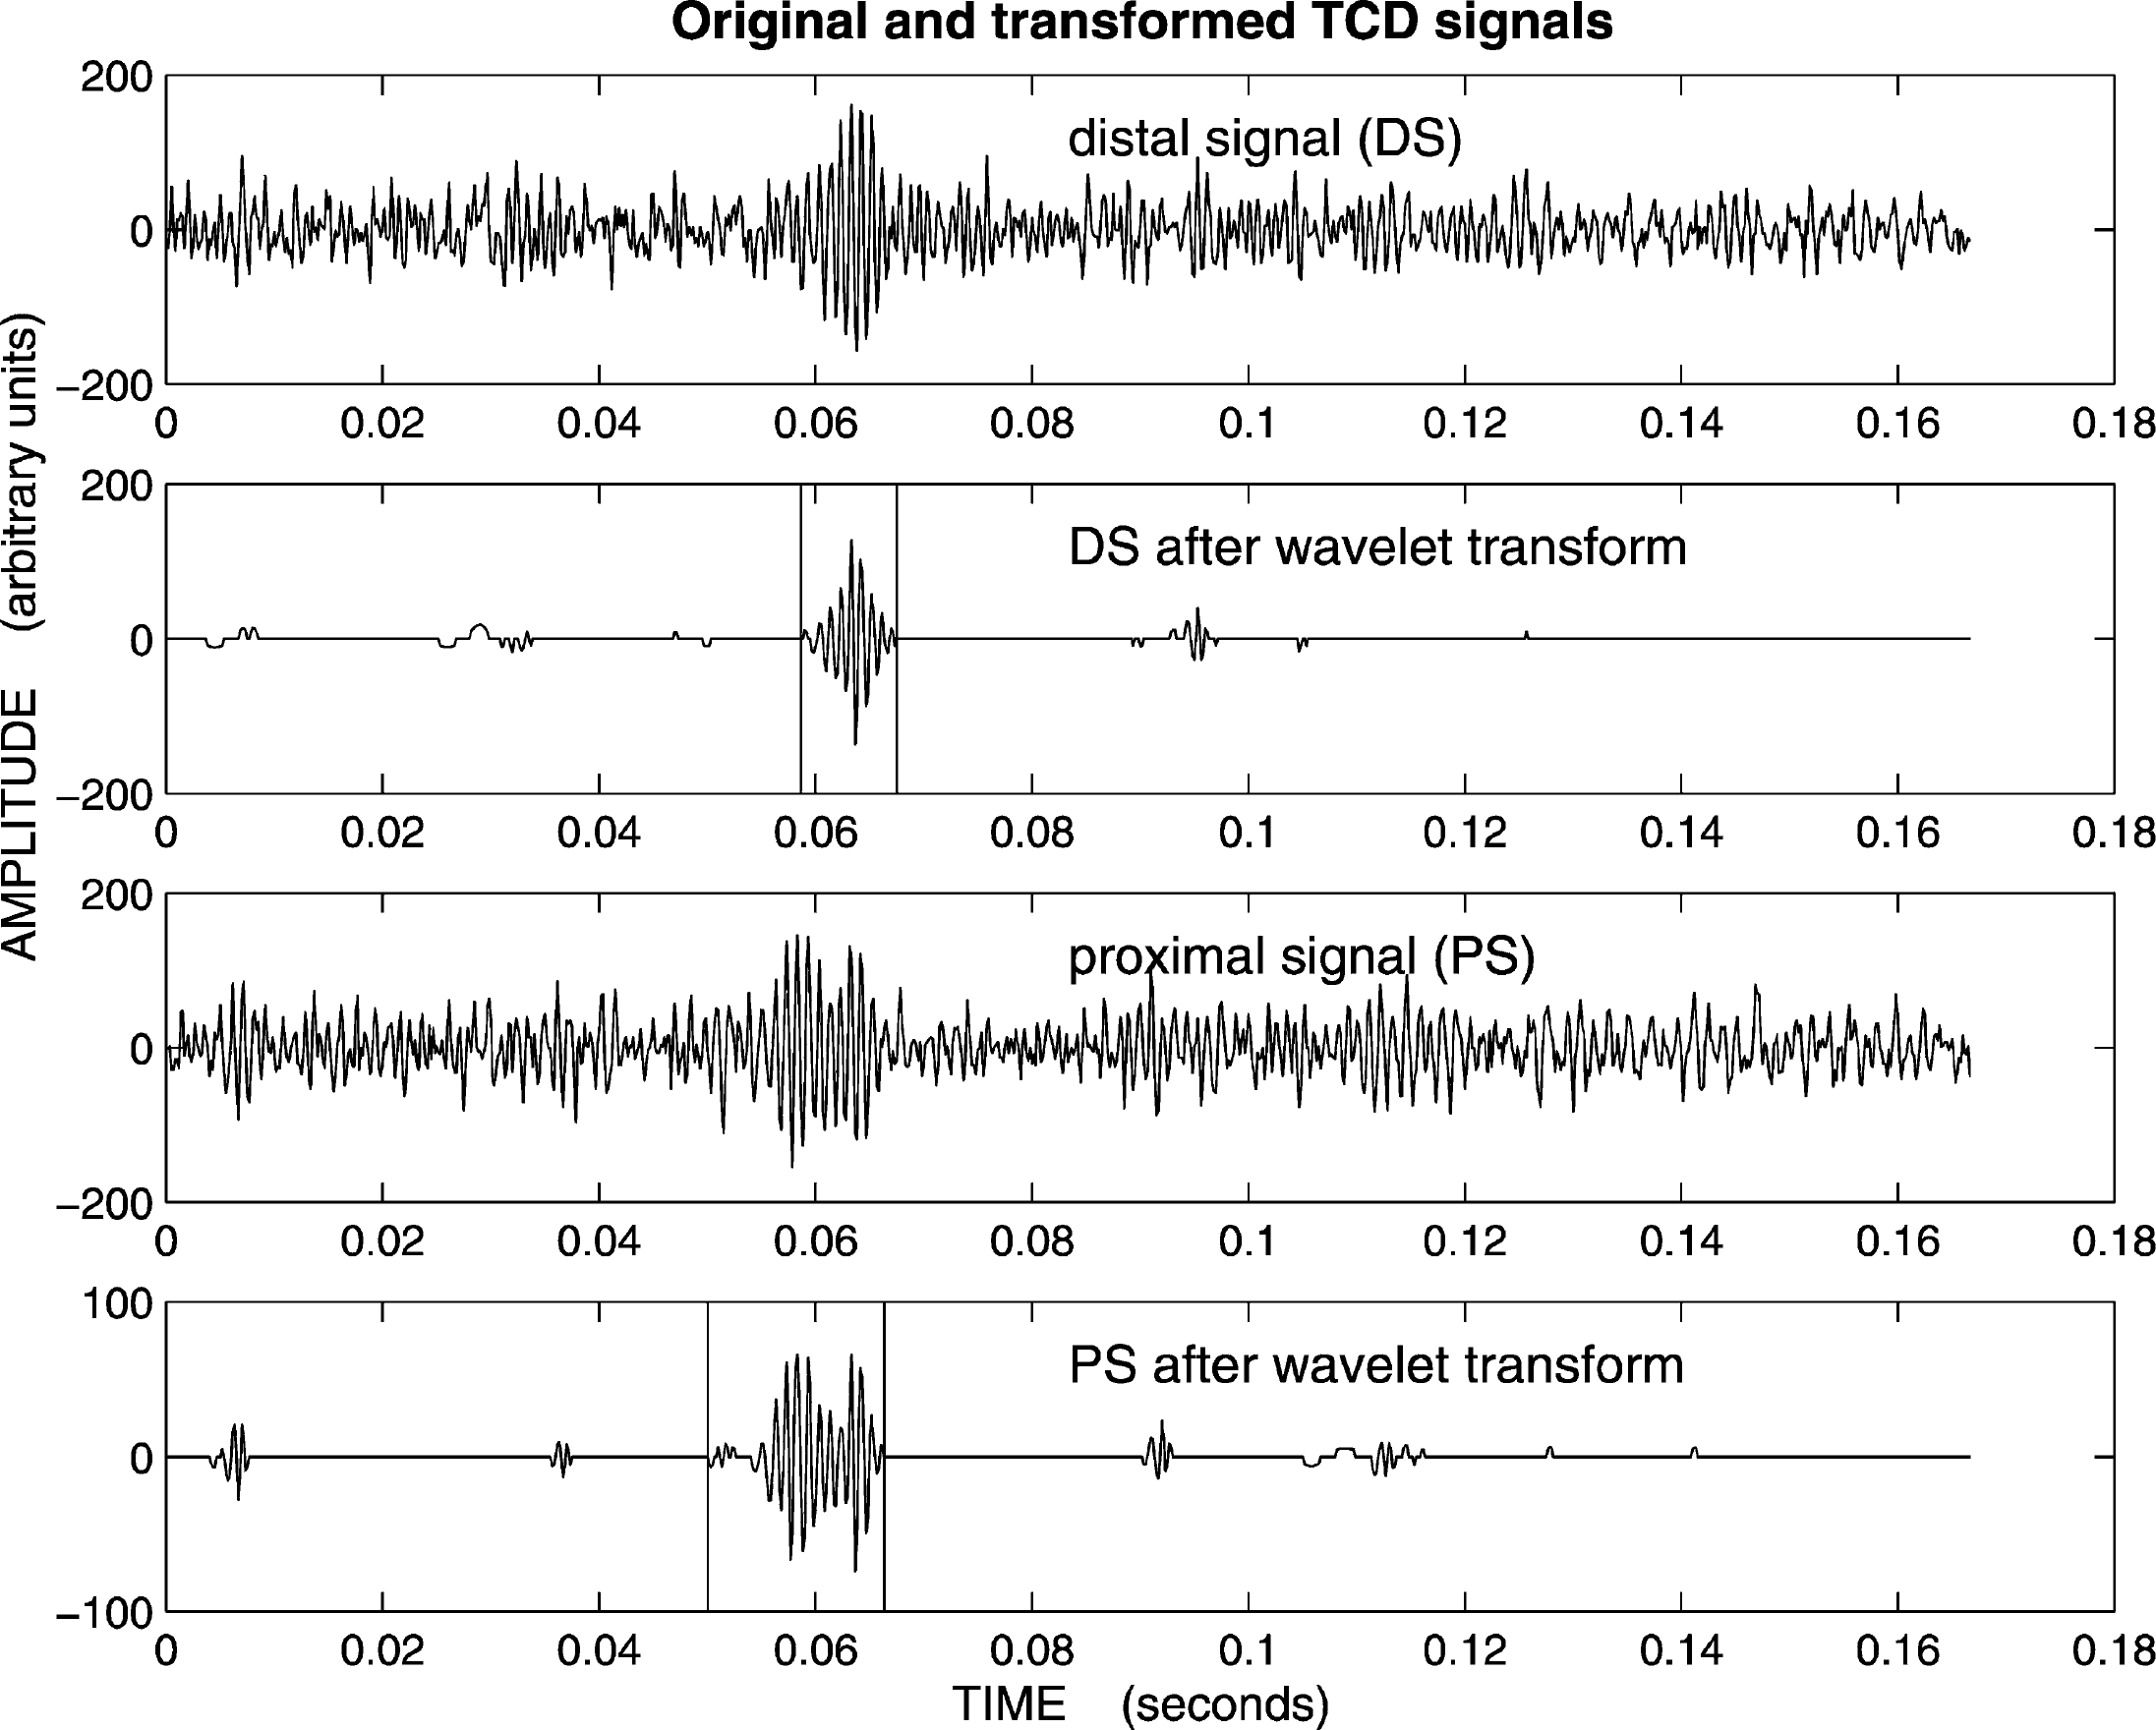
A signal pair together with their two corresponding “clean” versions obtained with the wavelet transform. This transformation is used to facilitate the finding of the start and end points of the microembolic signals, as shown by the vertical lines.
For the first two tasks, the choice and use of the features will be described in the section on results. For the differentiation between gaseous and solid emboli, we used the features 1 to 20 in Table 1. For solid/gas separation, we worked with three types of classifiers: binary decision trees (BDT), artificial neural networks (ANN), and support vector machines (SVM). Obviously, there are more classifiers that could be used. However, these three families of classifiers give a fair representation of what can be achieved. BDT are linear classifiers (Duda et al., 2001; Witten and Frank, 2000). ANN are nonlinear classifiers (Haykin, 1994): they try to draw some curved separating surface in the feature space. Their name originates from a highly simplified model of the human brain. SVM are an intermediate type of classifiers (Cristianni and Shawn-Taylor, 2000). Here, the idea is to combine the simplicity of linear methods with the flexibility of nonlinear methods. The expression support vector machine is somewhat misleading: these are algorithms, not machines. They cannot be described as simply as BDT, and we will not give any detailed description of these models here (Cristianni and Shawn-Taylor, 2000; Haykin, 1994). SVM are less general than ANN, yet far more general than BDT. A schematic overview of the algorithm is displayed in Fig. 2.
RESULTS
Differentiation between HITS and normal blood flow
We found that the signal of normal blood flow has a Gaussian (i.e., normal) distribution (Fig. 4). This is not true for a recording containing an HITS. However, because no Gaussian test is perfect, in addition to feature 21 we also used two other features: the change in the variance (feature 22), which is greater in the presence of a HITS, and the MEPR (Table 1). The success of the segmentation is also required. The segmentation fails if we cannot find the start or the end of the HITS. The sensitivity (i.e., the probability that a HITS is recognized as such) is 93%, with the confidence interval (92%, 95%) at the 95% level. The number of HITS in the test set is n = 1,000. The specificity (i.e., the probability that the normal blood flow is recognized as such) is 96%, with the confidence interval (93%, 98%) at the 95% level. The number of normal blood flow signals in the test set is 350. The error bounds, which correspond to a 95% confidence level, are conservative. This means that the lower bound was rounded down and the upper bound was rounded up. This applies to the rest of the article.
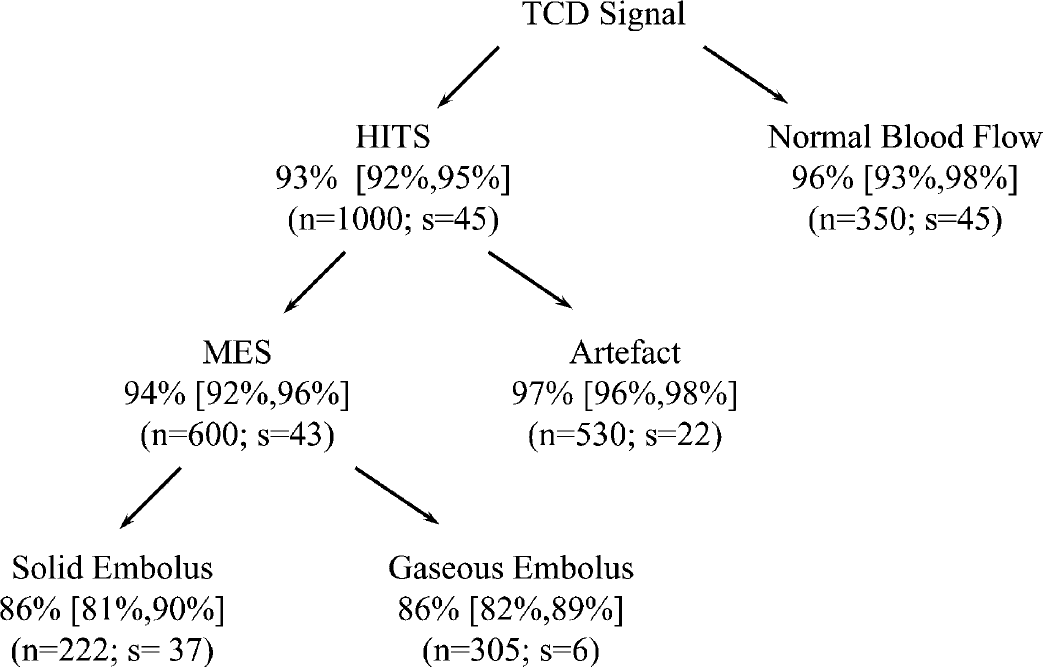
Results for the three steps of transcranial Doppler (TCD) signal analysis. As explained in the section on results the percentages are the sensitivity (probability that a solid embolus can be recognized as such) and the specificity (probability that a gaseous embolus can be recognized as such). In the case of solid/gas separation, the percentages refer to the SVM statistical model (see Material and Methods) with the test set made of emboli of all patients (i.e., the best results). The numbers in the square brackets indicate the 95% confidence intervals. The number n refers to the size of the test set, and s refers to the number of subjects from which the test signals were taken.
Differentiation between true emboli and artifacts
We found that the peak frequency (i.e., the frequency at the peak) is lower for artifacts than for MES (Fig. 4). Thus, the algorithm views signals with a peak frequency below 300 Hz as artifacts and those with a peak frequency above 600 Hz as MES. In the region between 300 and 600 Hz, the decision is based on the time delay between the proximal and the distal signals. For MES, the time delay must be no less than 3 ms. In addition, bursts with a duration below 1 ms are eliminated as artifacts. The sensitivity (i.e., the probability that a MES is recognized as such) is 94%, with the confidence interval (92%, 96%) at the 95% level. The number of MES in the test set is n = 600. The specificity (i.e., the probability that an artifact is recognized as such) is 97%, with the confidence interval (95%, 98%) at the 95% level. The number of artifacts in the test set is n = 530.
Differentiation between gaseous and solid emboli
Here, we will define the sensitivity to be the probability of recognizing solid emboli as such, and the specificity to be the probability of recognizing gaseous emboli as such. The difficulty of this third task forced us to explore three different families of statistical models. The construction of models is now done automatically, i.e., on the basis of some computational procedure. For each one of these three families we explored the relationship between sensitivity and specificity, known as the ROC curve. As the proportion solid emboli increases, so does the sensitivity. As the proportion gaseous emboli increases, so does the specificity (Fig. 4).
Binary decision trees. We found that the most stable trees use two features only, namely 16 and 19, as defined in Table 1. If both are low, the embolus is declared as solid, otherwise as gaseous. The tree is displayed in Fig. 4. The sensitivity and specificity are approximately 81%, the confidence intervals being (76%, 86%) for the sensitivity and (76%, 85%) for the specificity, both at the 95% confidence level. The respective numbers of solid and gaseous emboli in the test set are n = 214 and n = 294. The ROC curve is shown in Fig. 5 (top).
Artificial neural networks. We found that six features in Table 1—namely 1, 4, 5, 12, 16, and 19—were sufficient. The sensitivity and specificity are approximately 84%. The 95% confidence intervals are (79%, 88%) for the sensitivity and (80%, 88%) for the specificity. The respective numbers of solid and gaseous emboli in the test set are n = 224 and n = 302. The ROC curve is displayed in Fig. 5 (middle).
Support vector machines. Here we found that it is best to use the first 20 features of Table 1. The sensitivity and specificity are approximately 86%, the confidence intervals being [81%,90%] for the sensitivity and [82%,89%] for the specificity, both at the 95% level. The respective numbers of solid and gaseous emboli in the test set are n = 222 and n = 305. The ROC curve appears in Fig. 5 (bottom).
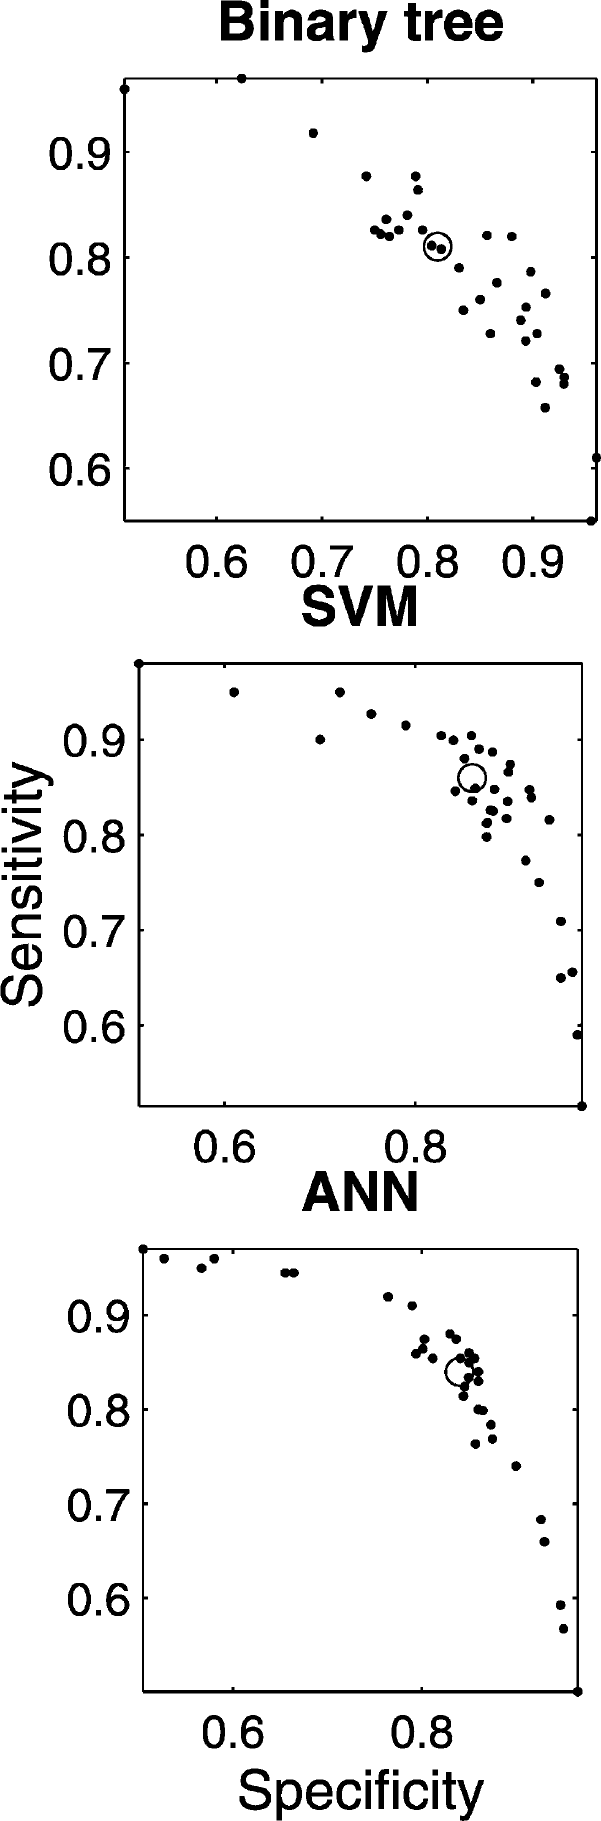
The coordinates of the dots are the specificity and the sensitivity for a series of binary decision tree models, a series of models obtained with algorithms known as SVM (support vector machine), and a series of models obtained with algorithms known as ANN (artificial neural network). In each case, the circle indicates the performance that one may reasonably hope to achieve with a model for which we require the sensitivity and the specificity to be equal.
All the results above, as summarized in Fig. 4, were obtained through a random selection of the data; approximately one third of the signals were assigned to the test set.
DISCUSSION
In CABG and CEA, despite considerable progress accomplished during the last decades, stroke and cognitive disorders remain the cause of significant morbidity (Ackerstaff et al, 2000; Caplan, 2001; Newman et al, 2001a; Selnes et al., 2001). Consequently, brain protection during CABG or CEA has high priority for all vascular surgeons. The entry of microemboli into the cerebral circulation seems to be one of the major causes of stroke or cognitive disorders in the course of CABG or CEA (Ackerstaff et al, 2000; Brillman, 1999; Caplan, 2001; Mark and Newman, 2002; Newman et al, 2001a; Selnes et al., 2001; Stump and Kashemi; 1999). TCD offers the only opportunity to detect embolic particulate matter (Grotta and Alexandrov, 2001). TCD signals also depict artifacts or gaseous emboli, the latter being introduced during open-air surgery. Brain protection to prevent stroke and cognitive decline are warranted, but needs a reliable and automatic Doppler device to classify HITS into artifacts or solid of gaseous emboli.
Because the predominant cause of cerebral infarction is extracranial atherosclerosis, the size and composition of the solid fragments entering the blood flow is an important issue for brain protection. However, to date, TCD ultrasound is not able to say much that is clinically relevant about size (Mackinnon et al. 2004; Russell and Brucher 2002), let alone composition, and one hardly finds any information regarding size in review articles (Davis, 1998; Grotta and Alexandrov, 2001; Mess and Hennerici, 2001). According to the principles of ultrasound physics the energy reflected by a solid embolus is proportional to its size, at least at the insonation frequency that we are using (Moehring and Klepper, 1994). The feasibility of a gross discrimination of particle size was demonstrated in an in vitro experiment (Moehring and Ritcey, 1996). This result, however, rests on the assumption that the interrogated volume of the MCA is uniformly insonated, which is hardly the case in vivo, as was confirmed through a numerical study (Moehring et al., 1996). Though nothing definite is known about the size distribution of solid emboli (Levi et al., 1997; Markus and Reid, 1999; Moehring and Klepper, 1994), it is believed that in the absence of a stroke the emboli do not exceed 240 μm in diameter (Markus, 1996). However, theoretical calculations show that it is virtually impossible to distinguish from the background blood flow in the MCA a solid embolus whose diameter is less than 100 μm (Moehring and Klepper, 1994). The size threshold for microemboli to be considered as benign remains an open question, especially because large numbers of very small emboli might be released during surgical operations (MacDonald and Gaines, 2003; Rapp et al., 2003).
This study leads to three main conclusions. First, our investigation with a large number of signals (over 3,000) confirms that automatic embolus detection and solid/gas separation are possible. Second, solid/gas separation is promising with sophisticated signal-processing methods. This brings us to our third conclusion, which is the necessity of exploring new signal-acquisition techniques for improving solid/gas separation. Let us now discuss in more details these conclusions. For embolus detection (i.e., the differentiation between the HITS and the normal blood flow and the differentiation between the MES and the artifacts), it is possible to build an automatic signal processing system with a success rate around 95%. A success rate of around 95% is sufficient for clinical practice. Our automatic system was tested offline, and it is independent of any commercial device. In principle it could be made to work on-line on any commercial machine based on a single insonation frequency and dual-gate TCD. For the differentiation between solid and gaseous emboli, the currently achievable success rate, in the range of 86%, means that the automatic system is useful for prospective clinical studies. The automatic system may thus provide some trends and help understand the significance of some pathological situations in the context of well-defined clinical studies. For instance, one could explore if there is a tendency to have more solid emboli in patients presenting stroke or cognitive decline after CEA or CABG. As explained earlier, the three types of classifiers—BDT, ANN, and SVM—are based on entirely different principles. They thus represent a realistic representation of what can be achieved for this problem. The ANN and SVM are far more complicated than BDT, yet they do not yield much better results. Thus, a combined approach is still not doing better than 86%. In addition, we cannot be sure that the pool of patients on which the models were built is representing the world of patients sufficiently well because of the heterogeneity of TCD signals.
In the context of solid/gas differentiation, one question that arises is whether the signals that were used to construct and test our automatic system are representative of those in patients undergoing a CABG or a CEA. It is indeed during these operations that an automatic solid/gas differentiation system would be applied. It is clear that one cannot build and test such an automatic system during a CABG or a CEA, because in the course of these operations both solid and gaseous emboli are intricated. Hence, our choice of pure sources of emboli: PFO-stroke patients for gaseous emboli, and patients with symptomatic severe ICA stenosis for solid emboli. There is no definitive reason to believe that these emboli are any different than those occurring in the course of CABG or CEA. However, the size distribution remains an issue (Levi et al., 1997; Markus, 1996; Markus and Reid, 1999; Moehring and Klepper, 1994). The MEPR (Table 1) is usually an important discriminative feature, because solid emboli usually have a lower MEPR than gaseous ones. In vivo, the magnitude of the MEPR depends on a variety of factors. The size of the emboli is certainly one such factor, particularly for solid emboli where the MEPR clearly increases with size (Moehring and Klepper, 1994). Therefore, the question of representativeness may be rephrased as: Did our data set correctly cover the overlap region of solid emboli with a high MEPR and gaseous emboli with a low MEPR? As was explained above, in methods, we did take care of this point. To maximize the occurrence of large solid emboli, we collected signals from patients who had a stroke in the previous 24 hours. To insure a good distribution of bubble sizes, we chose patients with a PFO of varying size. However, the MEPR does not only depend on embolus size, particularly in vivo. Therefore, it is more important to look directly how the values of the MEPR are distributed in our data set (Fig. 6). It does not say that confusion between solid and gaseous occurs only for intermediate MEPR. Thus, our data set certainly contains a sufficient number of weak HITS from PFO patients. If it were not so, the decision tree would classify all MES with a low MEPR as solid. From the point of view of MEPR alone, confusion between solid and gaseous emboli may occur for all emboli whose MEPR is less than 18 dB. The decision tree of Fig. 7, which was found to be the best, is of course fully consistent with the MEPR distributions shown in Fig. 6. The overlap between the top and bottom distributions is indeed strong, and this confirms the soundness of our data set.
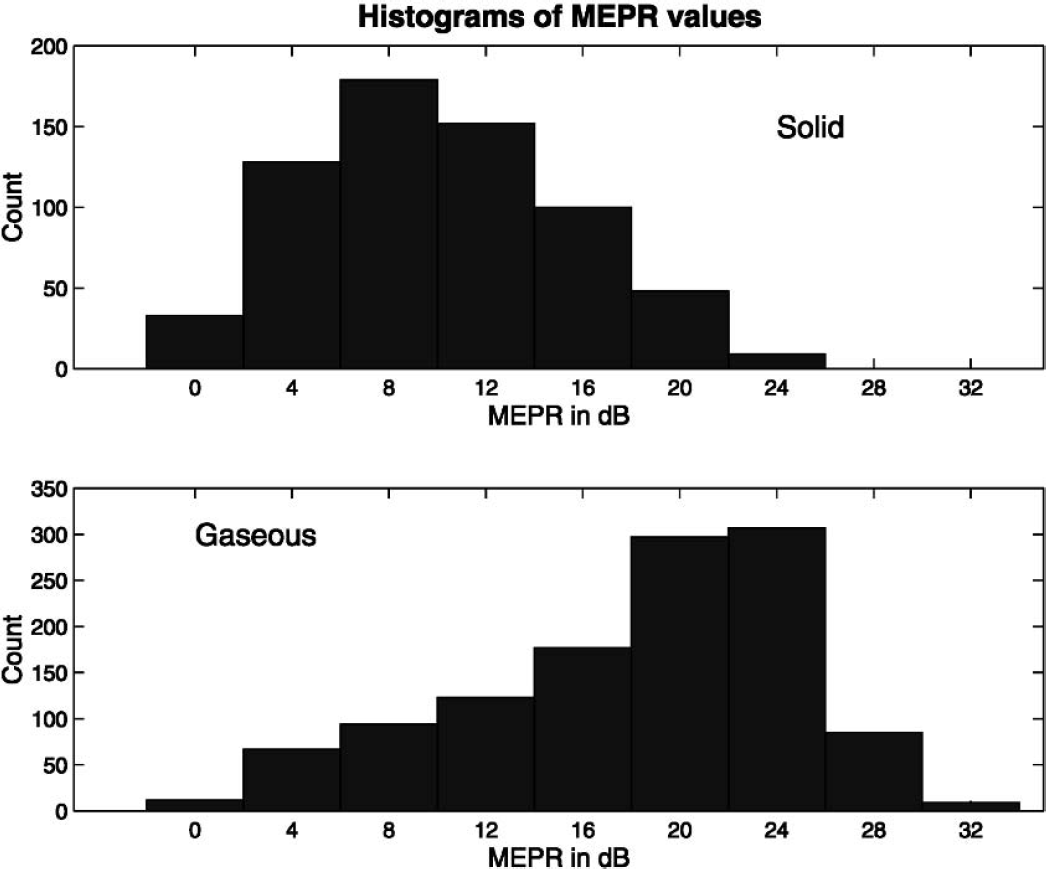
Histograms for the values of the mean embolus power ratio (MEPR) of solid emboli (
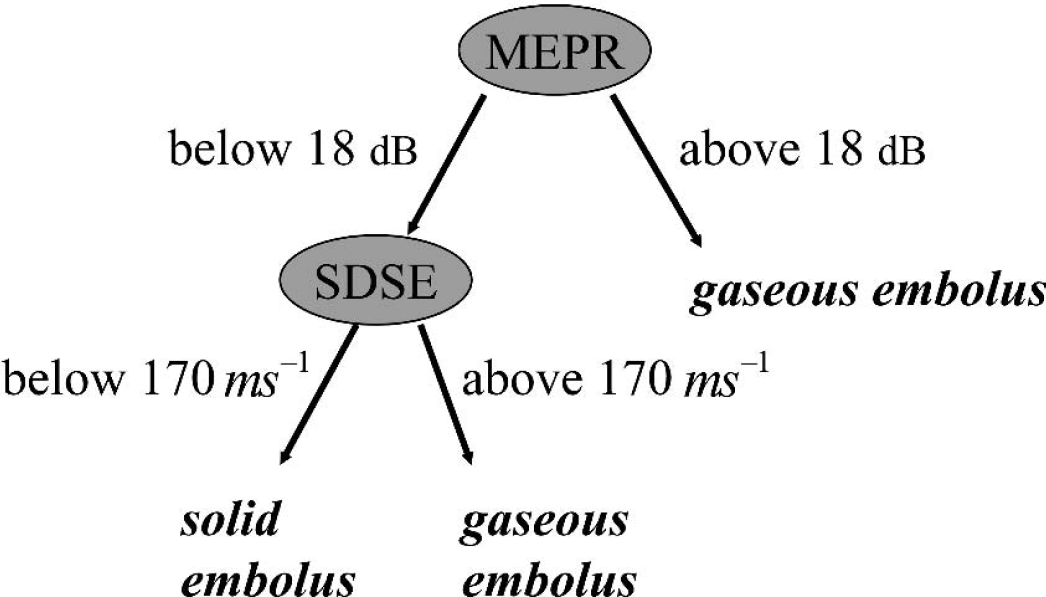
Description of the binary decision tree chosen for solid/gas classification. It uses two features: the mean embolus power ratio (MEPR, in decibels) and the standard deviation of the slopes of the envelope (SDSE, in ms−1). This tree was chosen because it performed well on the validation set.
Another important conclusion of our work concerning the separation of solid and gaseous emboli is that the key problem does not lie with signal processing but with signal acquisition. The current technology for obtaining the ultrasound signals is based on a single insonation frequency and two gates. To improve the solid/gas classification rate, it is necessary to increase the information content of the measured signals. In other words, the technique used for acquiring the signals must be improved. The automatic signal-processing system attempts to extract, in an optimal way, the information carried by the signals, but it cannot add information. To increase the information content with respect to solid/gas differentiation, at least three avenues can be explored. First, two different insonation frequencies—e.g., 2 and 2.5 MHz, as described by Russell and Brucher (Brucher and Russell, 2002; Russell and Brucher, 2002)—could also be used. They argue that solid microemboli reflect more ultrasound power at the higher frequency whereas the opposite is true for gaseous microemboli. Second, we may keep a single insonation frequency, to be denoted by the letter F, and two gates, but instead of recovering echoes only around the basic frequency F we may also recover harmonic frequencies, such as two or three times F. We could also try to recover subharmonic vibrations, such as one half or one third of F. This means using a different transducer or several transducers. The rationale behind such an approach is that the gas/liquid interface of bubbles is more flexible than the solid/liquid interface of clots. As a result, the wall of the bubble is more likely to vibrate and produce harmonic, or subharmonic, echoes (Leighton, 1994). This effect (Palanchon et al., 2001) has been clearly demonstrated with an experimental in vitro bubble generator for bubble sizes ranging from 19 to 200 [im. However, it remains to be shown that this effect can be exploited for TCD signals. Third, Moehring (2001) suggests that using more than two sample gates (up to approximately 30) may help in discriminating between solid from gaseous microemboli because the profile of the embolus through a vessel ought to be different for clots or bubbles.
In conclusion, to further improve solid/gas classification, we suggest to go beyond the current technology standard used in the acquisition of the TCD signal and to introduce advanced signal-processing methods.