
Abstract
Brain capillary perfusion was evaluated in the different states of the wake–sleep cycle—quiet wakefulness (QW), quiet sleep (QS), and active sleep (AS)—in rats. The extent of the perfused capillary network was determined by intravascular distribution of a fluorescent marker, Evans blue (EB); it remained unchanged across the three behavioral conditions, QW, QS, and AS. The anatomical network was assessed by alkaline phosphatase (AP) endothelial staining, which is known to underestimate the number of existing capillaries. The resulting number of AP profiles were, therefore, significantly lower than the number of EB profiles, but the percentage of AP-stained capillaries that were perfused (96%) was also unchanged across the behavioral conditions. The results indicate that no capillary recruitment accompanies the wake–sleep cycle. Capillary surface area is a relevant factor in determining exchanges across the blood–brain barrier. In the absence of capillary recruitment (relative constancy of the surface area), the CBF changes during sleep should preferentially affect flow-limited with respect to diffusion-limited transport.
The scope of this study can be evaluated from two different, symmetrical viewpoints: sleep physiology and brain microcirculation physiology.
Sleep is a complex, physiologically heterogeneous condition in which at least two different states can be identified: (a) quiet sleep (QS), also referred to as synchronized or non–rapid eye movement (NREM) sleep, with low frequency, high amplitude EEG waves; (b) active sleep (AS), also referred to as desynchronized or REM sleep, with high frequency, low amplitude EEG waves, muscle atonia and twitches, and REMs. Studies of global cerebral metabolism during sleep point to a reduction of O2 and glucose consumption during QS with respect to waking levels; during AS, brain metabolism returns to similar or even higher levels than during wakefulness (Greenberg, 1980; Madsen and Vorstrup, 1991; Franzini, 1992). To define the biochemical events associated with the different vigilance states, more needs to be known about the blood to brain and brain to blood exchanges for various substances. In fact, assessing which categories of substances preferentially enter or leave the brain during sleep compared with wakefulness will, in perspective, help to clarify the functional role of the different sleep states.
The amount of a substance crossing the blood–brain barrier depends on blood flow, endothelial capillary surface, and permeability. Sleep-dependent CBF changes have been described in detail (Greenberg, 1980; Madsen and Vorstrup, 1991; Franzini, 1992). This study addresses the issue of a possible variation in the capillary exchange area, a first step toward better understanding the transfer of different substances across the BBB during sleep.
The existence of capillary recruitment (the opening of previously unperfused capillaries) in the brain is still controversial. The direct methodological approach to the problem is based on quantitatively assessing plasma capillary perfusion while manipulating variables known to affect CBF and/or metabolism: anesthesia (Weiss et al., 1982; Buchweitz and Weiss, 1986; Klein et al., 1986; Weiss, 1988; Anwar et al., 1991); hemorrhage (Grover et al., 1986); incomplete forebrain ischemia (Theilen et al., 1993); middle cerebral artery occlusion (Anwar et al., 1988; Buchweitz-Milton and Weiss, 1988; Anwar and Weiss, 1989; Theilen et al., 1994); hypercapnia (Frankel et al., 1989; Goebel et al, 1989; Goebel et al, 1991; Duelli and Kuschinsky, 1993; Villringer et al., 1994); hypoxia (Francois-Dainville et al., 1986; Kissen and Weiss, 1988; Kissen and Weiss, 1991; Sinha et al., 1991); acidosis (Frankel et al., 1992); hyperglycemia (Knudsen et al., 1991); and β-adrenoreceptor Stimulation (Buchweitz-Milton and Weiss, 1990). These studies have been carried out in anesthetized or awake restrained animals, within 3 h of surgery. As a model for evaluating brain capillary perfusion, the sleep-wake cycle responds to the same logic as the above experimental protocols in that changes in metabolism and blood flow in the brain result from changes in the vigilance level. In addition, this study assesses brain capillary perfusion in freely moving animals during spontaneous behavior at least 1 week after surgery; the chronic experiment excludes possible perturbing factors like anesthesia and hypermetabolic immobilization/manipulation stress.
METHODS
The perfused capillary network was evaluated by intravascular injection of a fluorescent marker, Evans blue (EB); histochemical staining of the capillary endothelia identified the alkaline phosphatase (AP) reactive quota of the anatomical population.
The following protocols were approved by the ethical committee on animal experimentation of Bologna University.
Surgery and experimental procedures
Experiments were carried out on 21 male Sprague–Dawley rats (250–300 g each). Under general anesthesia (pentobarbital sodium 40 mg/kg s.c. 30 min after premedication with flunitrazepam 1 mg/kg i.m. and atropine sulfate 0.5 mg/kg i.p.), electrodes were chronically implanted for standard EEG and electromyographic (EMG) (neck muscles) recordings. Two silastic catheters were positioned (0.30 mm I.D., 0.64 mm O.D.) in the abdominal aorta via the right femoral artery for blood pressure (BP), and heart rate (HR), measurements and blood sample withdrawal, and the other (0.51 mm I.D., 0.94 mm O.D.) in the inferior vena cava via the left femoral vein for injection of the fluorescent dye. Calcium heparin (˜80 IU/day) was continuously administered through an osmotic pump (AL-ZET, Palo Alto, CA, U.S.A.) implanted s.c. in the interscapular region. After a 1-week recovery, each animal was habituated for 3 days to the recording apparatus, a plexiglas cylinder (20 × 20 cm) placed inside a thermoregulated box (22°C). An air-pressure operated blade, controlled from outside the box, was mounted on the movable lid of the cylinder. On the second day of habituation, the wake–sleep pattern did not significantly differ from control recordings carried out in our laboratory (AS amounted to ˜11.5% of recording time). There is no evidence therefore for a condition of sleep deprivation or rebound at the time when physiological measurements were obtained. Food and water were available ad libitum. On the day of the experiment, the arterial catheter was connected to a Statham P23 (Hato Rey, Puerto Rico) transducer, BP and HR were recorded, and blood gases were measured (Model 1304, Instrumentation Laboratory, Milan, Italy). The venous catheter was connected to a Sage pump (Cambridge, MA, U.S.A.) and, while the animal was lying down, the blade was appropriately positioned by gently shifting the lid. Then, during a stable vigilance state, i.e., quiet wakefulness (QW), quiet sleep (QS), or active sleep (AS), dye infusion was started. After preliminary trials, the bolus injection was replaced with slow infusion of the fluorescent dye at a rate of 0.6 ml/min in order not to disturb the sleep cycle. Injection time was chosen according to polygraphic (EEG rhythms, BP and HR changes, muscle tonus, and twitches) and behavioral criteria. In particular, theta rhythm of higher amplitude, muscle atonia, and twitches distinguish AS from QW; delta rhythm with reduced muscle tone connotes QS. After 40 s, the animal was decapitated, and the head quickly frozen in liquid nitrogen, stored at −70°C, and processed as described in the following section. The infusion did not affect BP nor, usually, the vigilance state (Fig. 1); in the rare event of an arousal during infusion, the animal was excluded from the study.
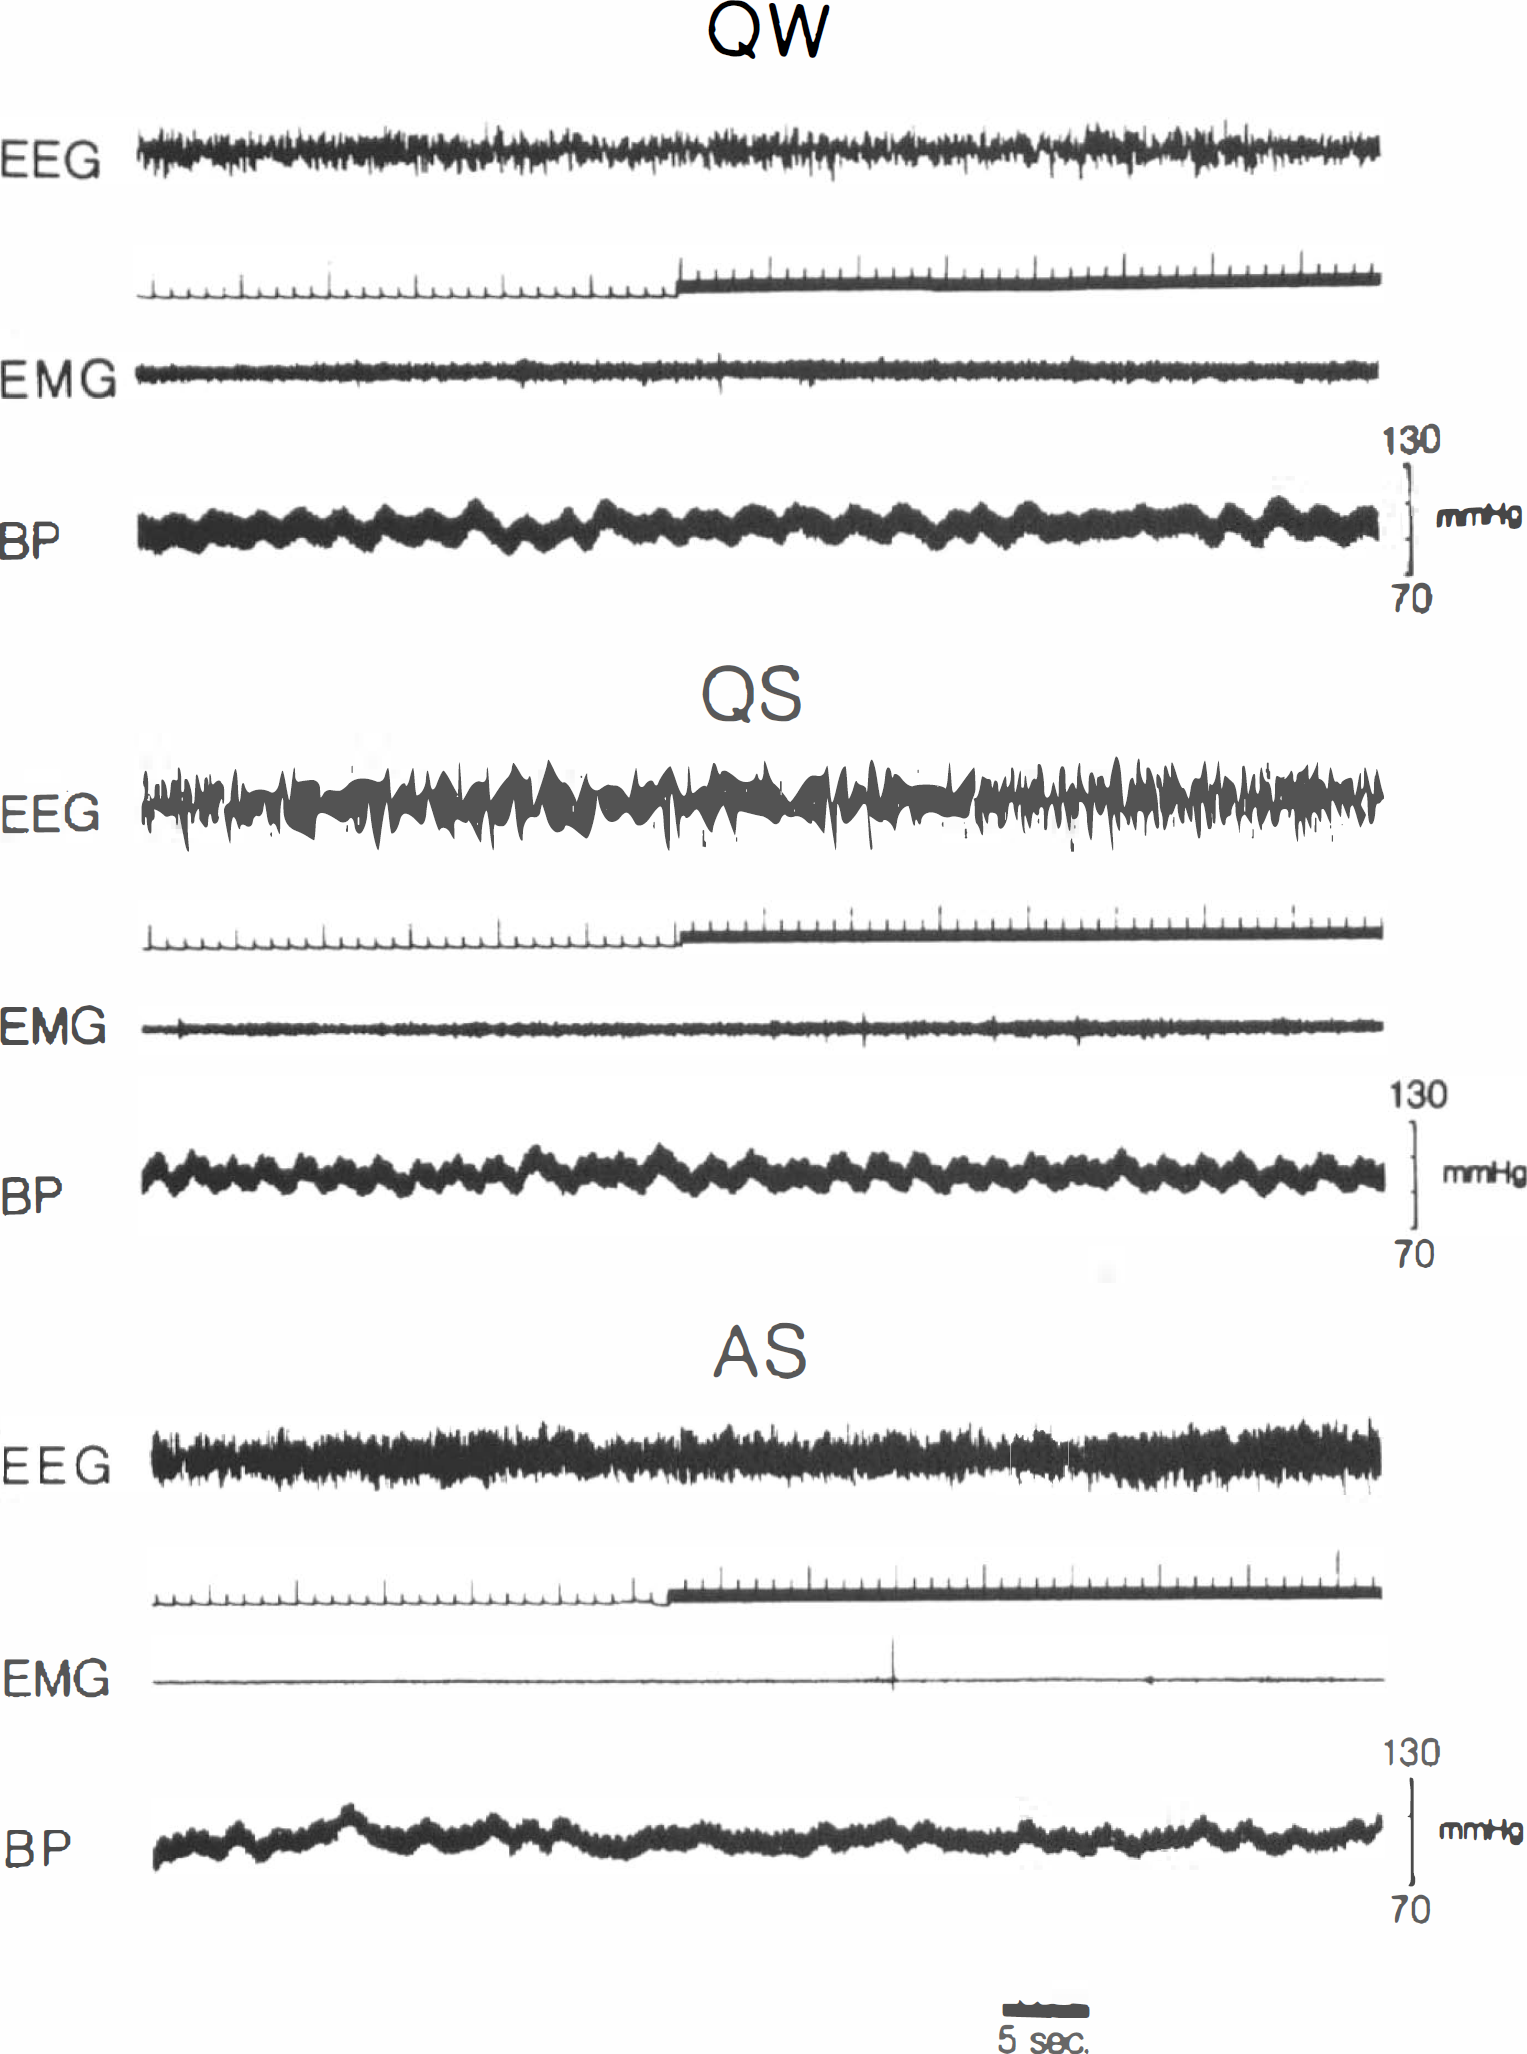
Injections of fluorescent dye (EB) during QW, QS, and AS. Upward deflections of signal marker correspond to injection time (40 s); polygraphic recordings are interrupted at the instant the animal is killed. It can be seen that the behavioral state is not altered by the experimental procedure. EMG, electromyogram; BP, blood pressure.
Taking into account the dead space of our infusion system (internal and external catheters), the dye circulated for 30 s. Weiss et al. (1982) described “a steady state in perfusion” of 13–30 s after injection in anesthetized rats; during this time, the percentage of perfused capillaries ranged from 50.1 to 56.9% according to the different indexes considered. In a subsequent study, no difference was found between anesthetized and awake animals (Buchweitz and Weiss, 1986). Under our experimental conditions, therefore, an infusion time of 30 s was short enough to reveal the possible existence of an unperfused capillary reserve. Goebel et al. (1990) and Vetterlein et al. (1990), on the other hand, found complete perfusion of the existing capillaries after 10 s.
Different fluorescent substances were applied: (a) fluorescein isothiocyanate (FITC) coupled to dextran (70,000 m.w.) (Sigma Chemical Co., St. Louis, MO, U.S.A.), 15 mg/100 g body wt or bovine gamma globulin (Sigma Chemical Co.), 0.2 ml/100 g body wt of a 2% solution in phosphate-buffered saline (PBS); (b) EB (Merck, Darmstadt, Germany), 0.2 ml/100 g body wt of a 2% solution in saline. The specific nature of the experimental protocol requiring injection of the intravascular marker in a sleeping animal, dictated the choice of fluorescent dye. In fact, we were unable to infuse FITC without disturbing the sleep cycle. We noticed a difference between the two FITC labels. When FITC–dextran was njected, the animal would wake up and start scratching, and sustained delayed increase in BP and feet swelling were sometimes observed. This anaphylactoid reaction to dextran infusion has been described previously (Voorhees et al., 1951); the normal sleep cycle would be resumed within 1 h. After FITC–globulin injection, the reaction was milder, i.e., the animal would wake up, but resumed sleep within a few minutes. In contrast, EB injection did not disturb the sleep cycle. While these factors are negligible in anesthetized or awake restrained animals, [since it has been shown, in fact, that the two fluorescent dyes do not differentially affect brain microcirculation (Goebel et al., 1990; Theilen et al., 1993)], because of these sleep disturbances, we excluded, in the present study, all animals injected with FITC; data hereafter reported refer only to animals injected with EB (n = 12).
Histological methods
The frozen head was sliced sagittally using a band saw. From the resulting frozen wafers, round samples (4 mm in diameter) were drilled from the cerebral cortex, thalamus, pons, medulla, and cerebellum. To avoid thawing of the tissue, both wafers and drill were dipped in liquid nitrogen before and after sampling. Each sample was cut on a cryostat microtome at 5-μm section thickness, after discarding the superficial layer to a depth of 0.5 mm. One of every three sections was thaw-mounted on a gelatin-coated slide. After removal from the cryostat, each slide was air dried for 5 min and coverslipped in glycerin. In the same section, both plasma perfused (EB fluorescence) and anatomical (AP endothelial staining) capillaries were evaluated.
Fluorescent microscopy. The section was immediately photographed on a epifluorescent Leitz (Wetzlar, Germany) microscope equipped with an XBO 75W/2 super-pressure mercury lamp, a Leitz fluotar ×40 oil immersion objective, an appropriate filter setting to elicit FITC and EB fluorescence, respectively (Leitz filter systems I2 and N2), an automatic camera, and a computerized X-Y plotting system attached to the microscope stage by means of transducers (Immagini & Computer, Rho, Milan, Italy). For each structure, 30 fields in ≧20 sections were photographed on Tmax 400 Kodak film. The high number of sections limited the exposure time to the lamp, and decreased fluorescence intensity during examination was avoided. The plotter coordinates of each field were annotated.
AP staining. Slides were dipped in PBS to remove the coverslip and then fixed for 1 min in 4% buffered paraformaldehyde containing 7.5% sucrose, washed twice in distilled water, and placed for 30 min at 37°C in the incubation mixture described by Weiss (1988): 3.8 g/L Fast Blue RR, 0.5 g/L α-naphthyl phosphate, 3.8 g/L sodium metaborate, and 1.7 g/L magnesium sulfate in distilled water. Slides were then washed in distilled water, postfixed, rinsed again and coverslipped as described above. Fields previously photographed in fluorescent light were then relocated according to the plotter coordinates and photographed using bright-field illumination.
Image analysis
The image analyzing device included a black and white Panasonic (Osaka, Japan) TV camera and a Matrox (Dorval, Quebec, Canada) PIP 1024B digitizing card, allowing 512 × 512 pixel images and 256 gray levels. Measurements were taken from 9 × 13 cm prints. The AP image, obtained from the camera (Fig. 2, bottom), stored on a frame buffer, and adjusted for proper contrast, was displayed on the screen. The fluorescent image (Fig. 2, top), similarly obtained and contrasted, was matched to the previous one by superposing corresponding capillaries; superposition was achieved by displaying alternate pixels from the two images. AP profiles, fluorescent profiles, and matching AP and fluorescent profiles were counted in the area shared by the two pictures.
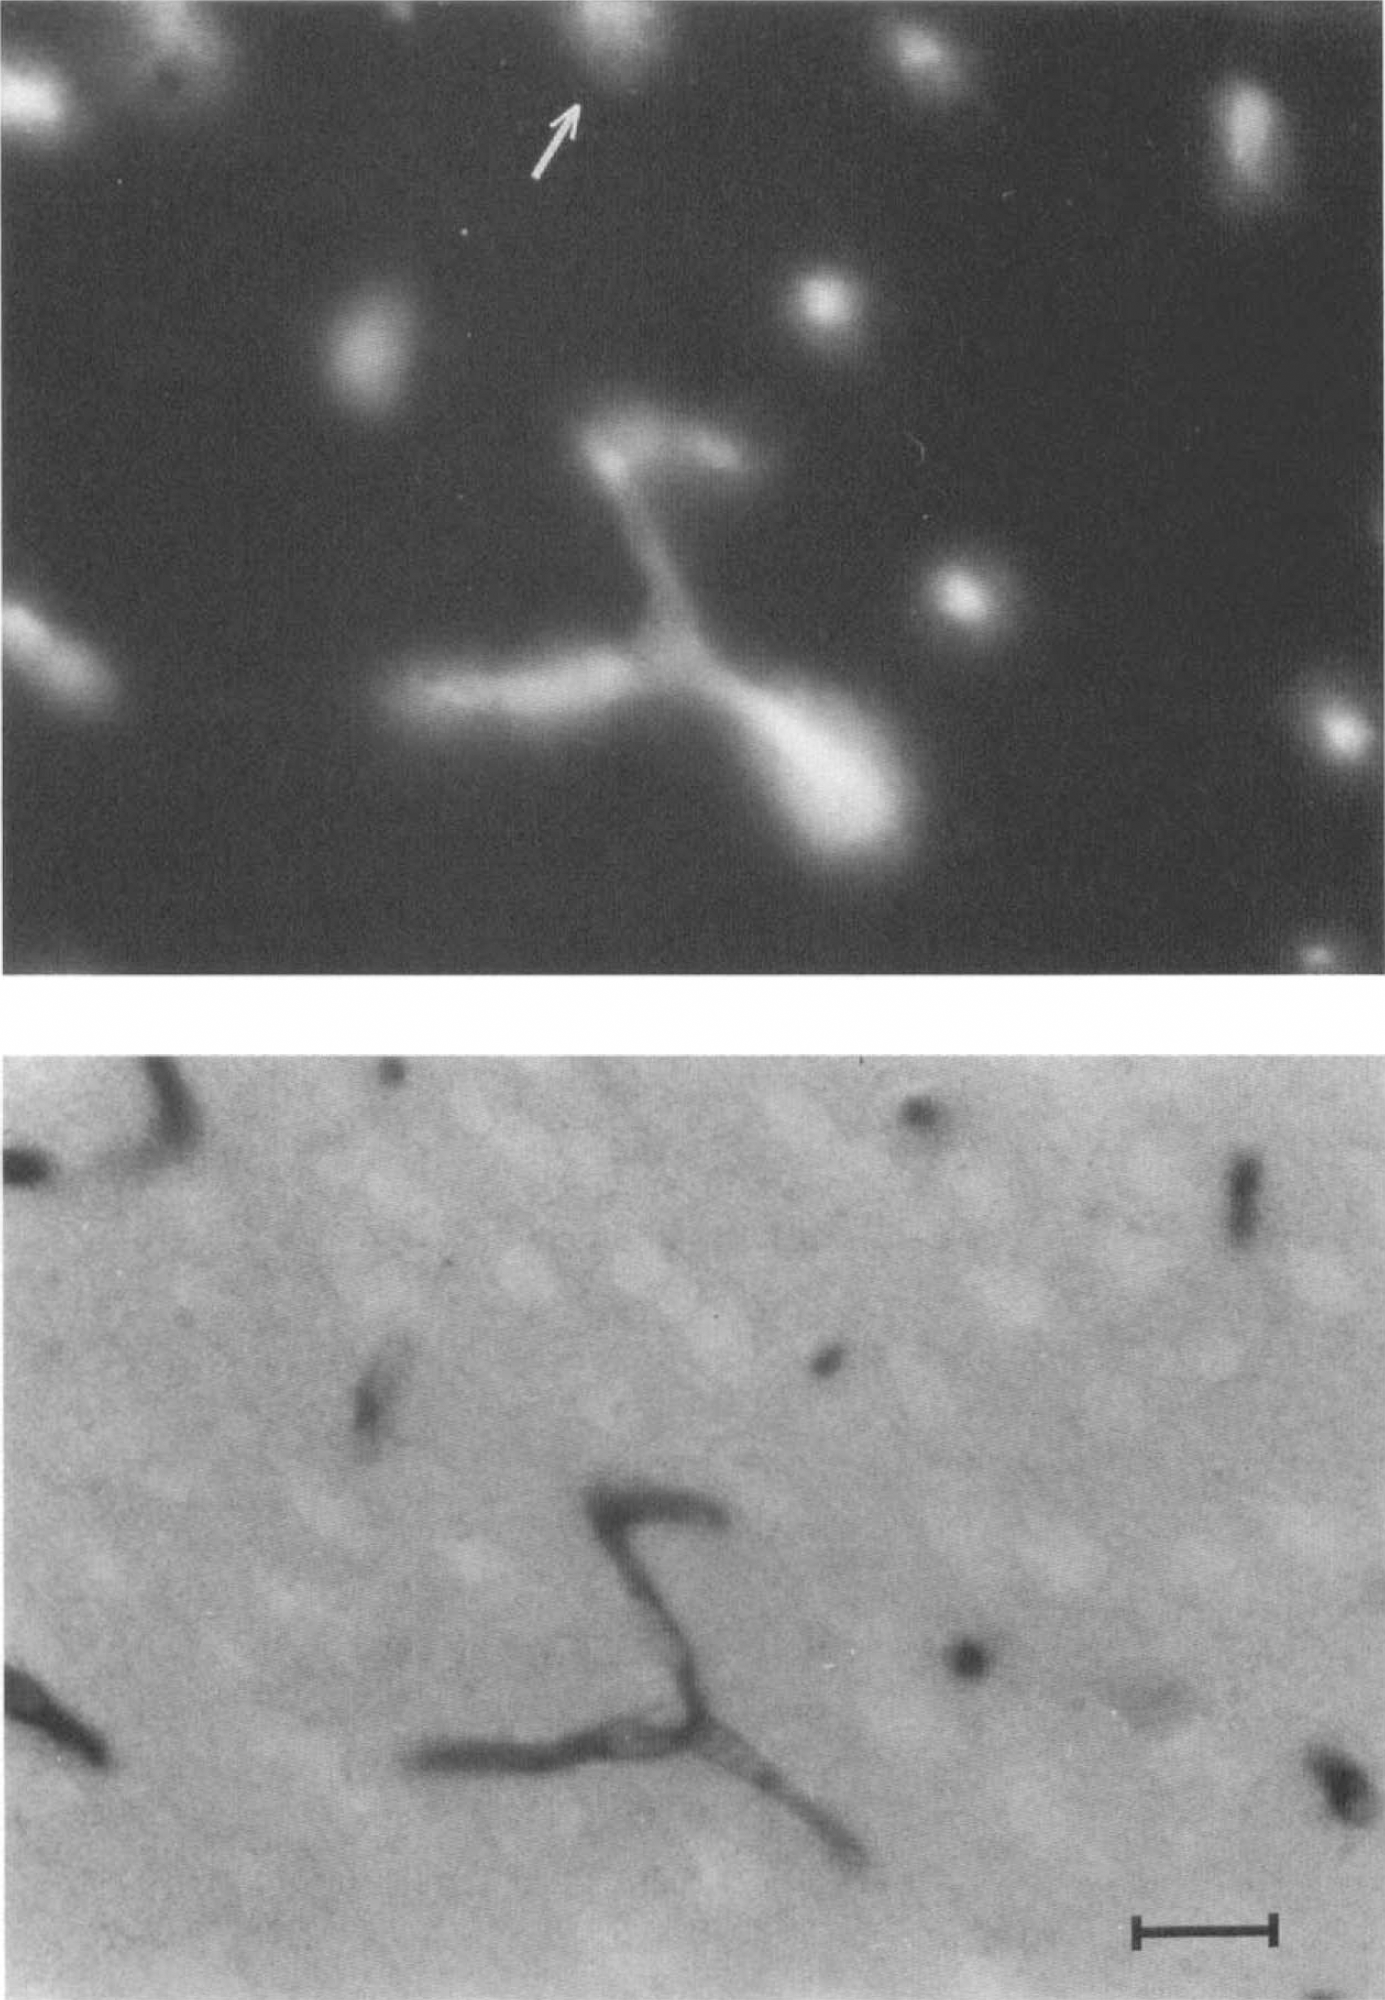
Photomicrographs showing capillary profiles in the rat cerebral cortex.
In each animal, an overall area of ˜0.75 mm2 per region was analyzed.
Statistical analysis
Differences in capillary density (n/mm2) between states, regions, and staining procedures were evaluated by two- and three-way analysis of variance (ANOVA), the factors being vigilance state (three categories: QW, QS, and AS), brain region (five categories: cortex, thalamus, pons, medulla, cerebellum), and staining procedure (two categories: EB and AP).
RESULTS
Circulatory variables during the wake–sleep cycle are presented in Table 1. The only significant changes occurred in mean arterial pressure (MAP) during AS. This BP increment should not affect brain circulation, since it appears quantitatively modest, and autoregulation is still effective during AS, albeit with reduced efficacy (Walker et al, 1994).
Circulatory variables during the wake–sleeping cycle in rat
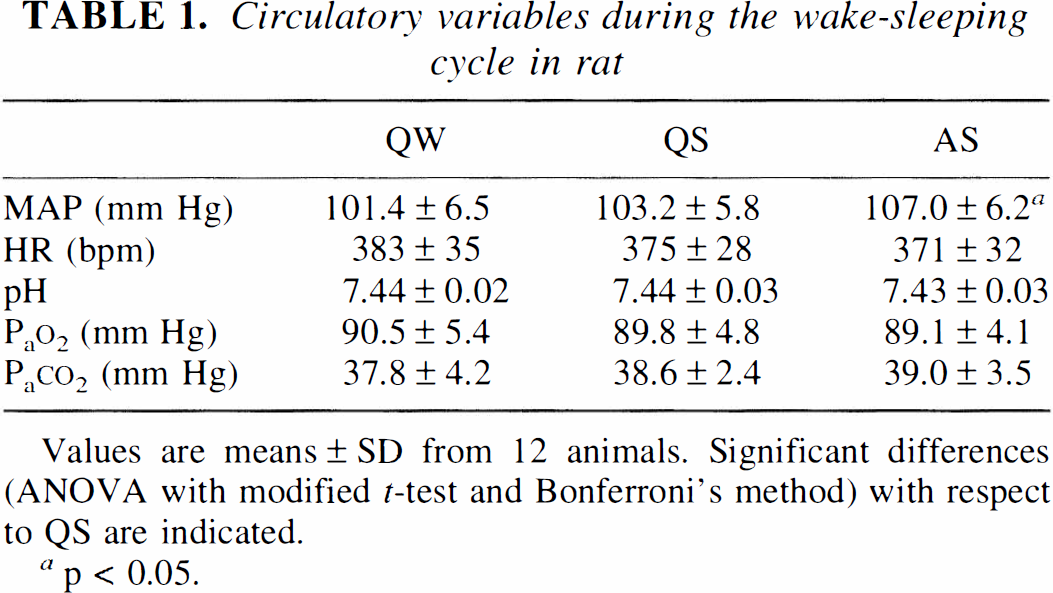
Values are means ± SD from 12 animals. Significant differences (ANOVA with modified t-test and Bonferroni's method) with respect to QS are indicated.
p < 0.05.
Fluorescent capillary counts (n/mm2) (Table 2A) indicate an absence of capillary recruitment during the wake–sleep cycle. In fact, no statistically significant differences in the number of plasma perfused capillaries occurred, either between states (QW, QS, or AS) or between regions. In order to compare our data with those in the literature, we calculated the average number of perfused capillaries (obtained from regional means) that resulted in 405 per mm2; this figure is close to previous findings: 411+73 (Klein et al., 1986) and 425 (Theilen and Kuschinsky, 1992).
Number (n/mm2, mean ± SD) of capillary profiles in different brain regions during QW, QS, and AS
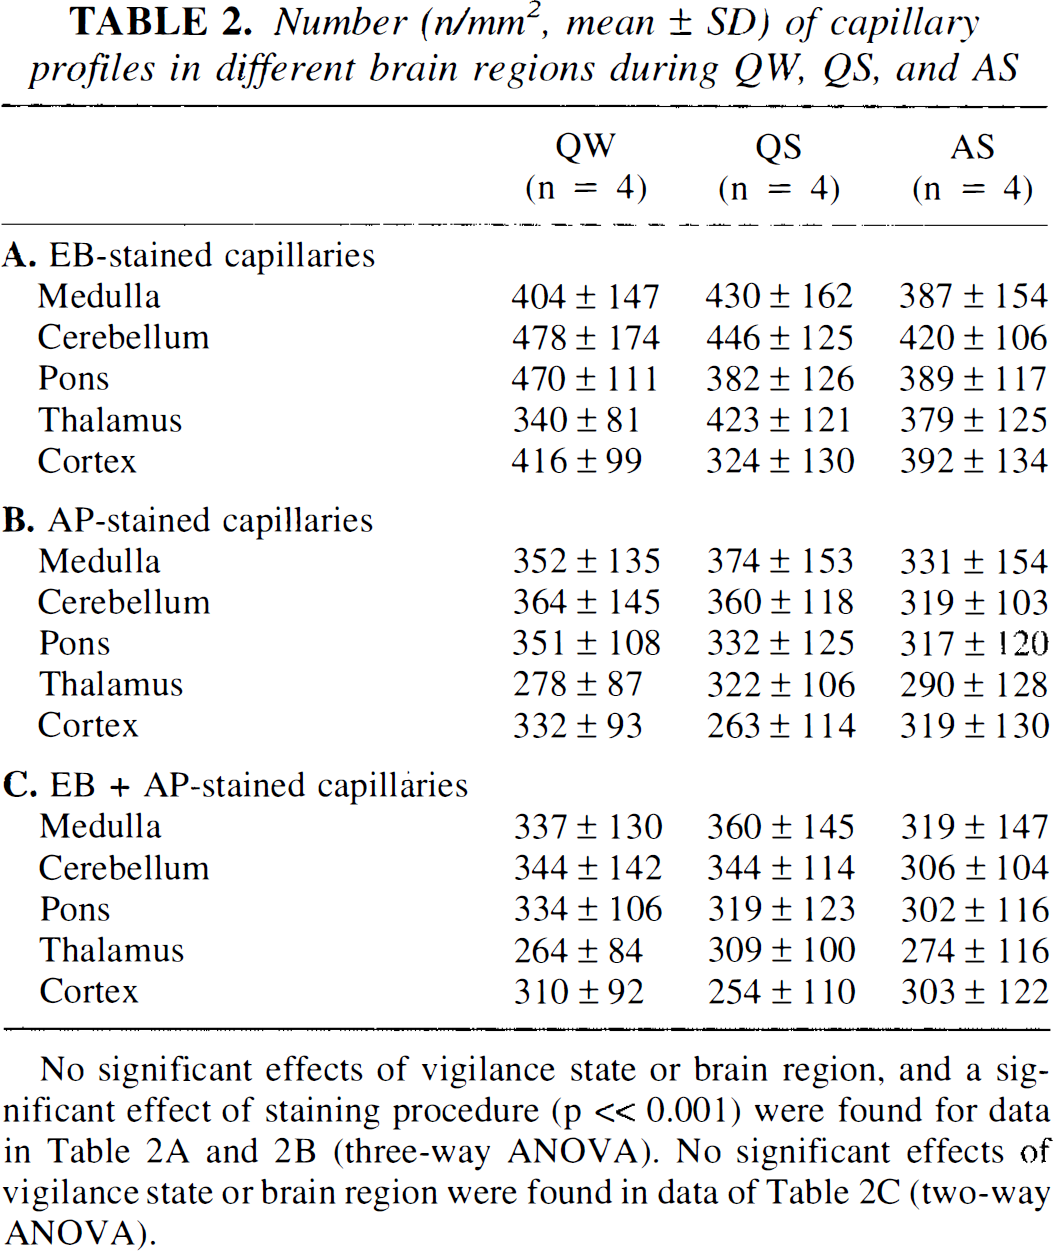
No significant effects of vigilance state or brain region, and a significant effect of staining procedure (p « 0.001) were found for data in Table 2A and 2B (three-way ANOVA). No significant effects of vigilance state or brain region were found in data of Table 2C (two-way ANOVA).
Table 2B lists AP-stained profiles; again, neither state-dependent nor region dependent-differences were apparent. The average number of AP-stained anatomical capillaries resulted in 327 per mm2; this figure is close to the values of 277 ± 118, 330 ± 15, and 314 ± 6 (SEM) previously reported (Weiss et al., 1982; Weiss, 1988; Kissen and Weiss, 1991). AP activity is found in cerebral endothelial capillary cells, but its staining underestimates the number of existing capillaries; Goebel et al. (1990) found a 30% difference when two anatomical counts (AP and fibronectin antibody methods) were compared. In our study, AP counts were compared to EB (perfused) counts; therefore, a slightly lower mean percent (19%) difference was found, but it was, nonetheless, statistically significant (three-way ANOVA, p ≪ 0.001, cf. Table 2A and B). The regional heterogeneity of capillary density in the brain is well recognized (cf. Klein et al., 1986), but in this study, as in others (Weiss et al., 1982), the heterogeneity was not apparent (Table 2), possibly due to the scatter intrinsic in the sampling procedure. Moreover, our method of aligning sections to determine capillary filling is biased toward sampling higher density fields.
Finally, the number of AP profiles matched by EB profiles, i.e., the perfused capillaries in the AP population, was evaluated by image analysis (Table 2
DISCUSSION
The complex methodological issues inherent in the study of brain microcirculation in vivo with a fluorescent marker entail a long history of validation studies.
A first issue concerns the possibility of postmortem redistribution of the intravascular fluorescent marker resulting from the decapitation procedure and the delay before freezing the intravascular content; this possibility, however, has been ruled out (Weiss et al., 1982; Vetterlein et al., 1990; Theilen et al., 1993).
A second, more controversial, issue relates to the possibility that studies of brain capillary perfusion may be affected by changes in the intravascular distribution of the fluorescent dye during the fixation procedure. Warnings have been expressed about the possibility of artifacts, either false-negative (dissipation of the intravascular marker and consequent loss of fluorescent capillary spots) (Goebel et al., 1989; Goebel et al., 1990; Kuschinsky and Paulson, 1992; Theilen and Kuschinsky, 1992) or false-positive (clumping of the fluorescent dye outside the microvascular bed) (Weiss, 1988; Anwar et al., 1990; Frankel et al., 1992).
By referring EB spots to AP stained profiles, the image analysis procedure allowed us to evaluate possible artifacts in the distribution of the fluorescent marker. In fact, since the high perfusion percentage (96%) found in the present study in AP-positive capillary subpopulation excludes a relevant incidence of false-negative results due to loss of fluorescent marker, only the possibility of false-positive results is hereafter discussed. Neither Weiss et al. (1982) nor Weiss (1988) ever detected fluorescent spots unmatched with AP profiles. On the contrary, we reported higher counts for fluorescent than for AP profiles (19%, p ≪ 0.001) (Table 2, Fig 2, top). These higher counts have been accounted for as follows: (a) the fluorescent dye could shine through from deeper layers in the section (Weiss, 1988); our sections, however, are only 5 μm thick; (b) in the fixation procedure, moving fluorescent material outside the vascular bed might be responsible for overestimation of the number of perfused capillaries (Anwar et al., 1990); (c) the AP method may not stain all capillaries; species and regional differences have been described (Bannister and Romanul, 1963; Hansen-Smith et al., 1988; Grim and Carlson, 1990). In particular, AP preferentially stains the arteriolar end of the capillary (Grim and Carlson, 1990; Batra and Rakusan, 1992); therefore, on the venous side, the histochemically identified counterpart of a fluorescent spot may be missing. Goebel et al. (1990) found 30% lower counts with AP compared with an immunofluorescent method, and, in general, the total number of anatomical profiles of capillaries counted with fluorescent antibodies (Grover et al., 1986; Klein et al., 1986; Theilen and Kuschinsky, 1992) are higher than those reported for AP staining (Weiss et al., 1982; Weiss, 1988; Anwar et al., 1990; Kissen and Weiss, 1991). If the higher number of fluorescent profiles results from the first two points considered above (fluorescent spots in deeper layers or fixation artifacts), false-positives may result; by chance, a noncorrelated fluorescent spot might originate a spurious correspondence with an anatomically identified profile.
We believe that the numerical relevance of false-positive results in the present study can be deemed negligible on the following grounds: (a) the presence of fluorescent spots outside the vascular bed has been attributed to alcohol fixation (Weiss, 1988; Anwar et al., 1990), a procedure we did not perform; (b) the probability that a spurious, randomly occurring fluorescent spot may originate a false-positive correspondence can be statistically evaluated by applying the same image-analysis technique to randomly coupled AP and EB pictures of unrelated fields. To this end, we calculated the probability of a single EB spot casually being superposed on a single AP spot (0.034%). From this value, the probability of false-positive correspondences can be calculated for any given value of spot density in the pictures; in our experimental conditions, the probability was negligible (0.15%).
The methodological issue can be summarized as follows. To evaluate the percentage of perfused capillaries in the AP-stained population we followed the experimental protocol established by Weiss et al. (1982). We have no explanation for the discrepancy in the capillary perfusion percentage between the studies (96 versus 57%), although differences in the thresholds for fluorescence detection might cause large variations in the evaluation of perfused capillaries (Goebel et al., 1989). On the other hand, the above discussion indicates that such a large difference cannot be attributed to false-positives in our estimate; nor can it be attributed to the effect of anesthesia, since the same figures have been found in anesthetized and conscious rats (Buchweitz and Weiss, 1986). Recently, a different methodological approach (in vivo confocal microscopy) showed complete plasma perfusion of the cortical capillary bed in anesthetized rats (Villringer et al., 1994).
In conclusion, both the absolute figures of fluorescent profiles and the percentages of perfused capillaries in the AP subpopulation point to the absence of a brain capillary reserve modulated by the wake–sleep cycle. Moreover, changes in capillary diameter accompanying CBF changes during sleep are quantitatively negligible [cerebral blood volume increases by <5% during AS (Risberg and Ingvar, 1973); even if this were confined to the microcirculation, the calculated increment in capillary diameter and surface would remain at <2.5%]. The capillary surface area, therefore, is not a sleep-dependent variable. This suggests that CBF changes during sleep have differential effects on different categories of solutes: (a) substances with high permeability (flow limited: oxygen, carbon dioxide and other lipid-soluble substances). Their transport is most affected by the CBF changes during sleep, especially AS; (b) substances with intermediate permeability. Their transport benefits only in part from a CBF increment not associated with capillary recruitment; (c) substances with low permeability (diffusion limited). Their transport unfolds independently of the CBF changes associated with the wake–sleep cycle.
An attempt to clarify the functional significance of CBF changes during sleep should take in account the above considerations.
Footnotes
Abbreviations used
Acknowledgment:
This work was supported by grants from the Ministero dell' Università e della Ricerca Scientifica e Tecnologica and Consiglio Nazionale delle Ricerche, Italy. The authors would like to thank G. Mancinelli and L. Sabattini for the wiring and mechanical work needed in the adaptation of the recording apparatus and V. Meoni for the photographic work.