
Abstract
It has recently been shown that 17O magnetic resonance (MR) spectroscopic imaging at ultrahigh fields provides a reliable method for measuring CMRO2 during a short period of 17O2 gas inhalation. The mathematical (or complete) model used in the 17O MR method for calculating CMRO2 requires simultaneous measurements of multiple parameters including the concentration of H217O produced in the brain tissue from inhaled 17O2 gas (Cb), CBF, and the input function for the H217O concentration in the feeding artery (Ca). Both invasive and noninvasive measurements are involved in determining all of these parameters. In this article, two simplified methods are proposed and validated for calculating CMRO2 based on 17O MR measurement(s); the first method requires the measurements of Cb and CBF, but not Ca, and the second method only requires a single noninvasive measurement of Cb. The simplified methods were used to calculate CMRO2 in anesthetized rat brain, and the results were compared with those obtained using the complete model. The results from this work show (1) the validity of the simplified methods for quantifying CMRO2, and (2) the feasibility for establishing a completely noninvasive 17O MR approach for imaging CMRO2
Oxidative metabolism of brain under both normal and pathologic conditions can be evaluated through the measurement of the cerebral metabolic rate of oxygen consumption (CMRO2) (Siesjo 1978). This can be accomplished by 15O positron emission tomography (PET), which monitors the concentration change of the metabolic H215O generated by mitochondrial respiration in the brain during an inhalation of 15O2 gas (e.g., (Mintun et al., 1984)). However, this is a complex measurement. It requires independent determinations of cerebral H215O content, CBF, and H215O present in the arterial supply to the brain (the arterial input function) (Mintun et al., 1984); in addition, it is necessary to experimentally determine (Mintun et al., 1984) or make assumptions (Ohta et al., 1992) about cerebral blood volume (CBV). The CBV complication arises because the PET method is unable to distinguish the radioactive signals coming from the 15O2 bound to hemoglobin or freely dissolved in blood from those emitted by the 15O atoms in the metabolically generated H215O molecules.
An alternative approach for measuring CMRO2 is the use of 17O MR spectroscopy (MRS) or MR spectroscopic imaging (MRSI) techniques to monitor concentration changes of metabolic H217O during an inhalation of the oxygen gas enriched with the nonradioactive 17O isotope (i.e., 17O2) (Arai et al., 1990, 1991; Fiat and Kang, 1992; Fiat et al., 1992; Mateescu et al., 1989; Pekar et al., 1991, 1995; Zhu et al., 2002). This is analogous to the PET approach. However, the 17O MR method has two major advantages compared with the PET technique. First, the 17O2 molecules, either in the form of free gas or bound to the hemoglobin in the blood, are nuclear magnetic resonance (NMR) invisible; consequently, 17O MR detects the metabolically generated H217O specifically without the effects of confounding signals from other 17O species (thereby avoiding the CBV complication). Second, the absolute concentration of metabolically generated H217O, and in turn CMRO2, can be precisely calculated by using the natural abundance H217O signal as an endogenous concentration reference; in the absence of enrichment, the 0.037% of water molecules naturally contain 17O atoms. Therefore, the natural abundance H217O content per gram tissue or concentration is known in both brain tissue and blood.
The major disadvantage of the NMR method is the low inherent sensitivity of 17O MR detection due to the small gyromagnetic ratio of the 17O nucleus. We have, however, recently shown that the sensitivity of 17O MR detection is improved significantly at ultrahigh magnetic fields, and an approximately fourfold signal-to-noise ratio gain can be obtained at 9.4 T compared with 4.7 T (Zhu et al., 2001). In view of the sensitivity gains available with the use of ultrahigh-field magnets, and the potential advantages compared with the PET technique, 17O MR approach may provide a viable and more accurate method for measuring CMRO2. The central remaining problem, however, is the determination of all the necessary parameters for modeling and calculating CMRO2.
Even though the 17O MR approach does not have the CBV complication that afflicts the PET technique, it still, in principle, requires three independent determinations of cerebral H217O concentration [Cb(t)], arterial input function for H217O [Ca(t)], and CBF, as in PET. This can be ascertained from a model originally established by Kety and Schmidt (1948a,1948b) (referred to as the “complete model” in this article) and schematically illustrated in Fig. 1. We have recently shown that when all these three parameters were rigorously determined, then the 17O MR approach indeed yielded an accurate measurement of CMRO2 (Kety and Schmidt 1948a,b; Zhu et al., 2002). However, the measurements of two of these parameters required for the complete model, namely the arterial H217O input function and CBF, pose technical difficulties (as they do in the PET method), and ultimately limit the utility of the approach.
(
The determination of the arterial H217O input function, practically requires an invasive procedure such as withdrawing arterial blood (preferably from the carotid arteries) at regular time intervals from the subject and determining arterial H217O concentration, as in PET studies, or using an implanted 17O radiofrequency (RF) coil around the carotid artery, and continuously measuring arterial H217O concentration with 17O NMR (Zhang et al., 2003; Zhu et al., 2002). Both of these approaches are highly invasive; the former can induce physiologic perturbations, especially in small-animal studies (e.g., blood volume and the blood pressure changes), potentially affecting the basal CMRO2 value. The latter, although it is accurate and avoids the deleterious physiologic consequences of blood depletion, does require a complex surgical procedure and is extremely difficult to perform in humans or in nonterminal animal experiments.
Measurement of CBF can be performed directly by using a number of MRI approaches (Detre et al., 1994; Kim 1995; Kwong et al., 1995; Silva et al., 1995). However, the relatively low detection sensitivity of these approaches, especially in the brain areas with lower CBF values (e.g., the white matter), and the difficulty obtaining absolute CBF values using these approaches may lead to significant errors in CMRO2 calculation.
It is, therefore, important to examine the feasibility of determining CMRO2 reliably without having to measure Ca(t) and, if possible, CBF. Using different approximations, attempts have already been made to simplify the measuring procedures and modeling for the calculation of CMRO2 with the 17O MR method. However, the validity of the approximations proposed in these simplified models has not been rigorously tested by experiments and is still intensely debated (Fiat and Kang 1992, 1993; Fiat et al., 1992; Pekar et al., 1991, 1995). In this article, two simplified methods are proposed for CMRO2 calculation with the 17O MRS imaging approach (Zhu et al., 2002). The first method allows calculation of CMRO2 without the need to experimentally measure Ca(t). The second method is an even simpler approach that requires the noninvasive measurement of Cb(t) only, without having to determine Ca(t) or CBF. The proposed models were experimentally evaluated by explicitly determining all parameters involved in the same animal so that CMRO2 can be calculated from the same datasets using either the complete model or the simplified models.
THEORY
General considerations
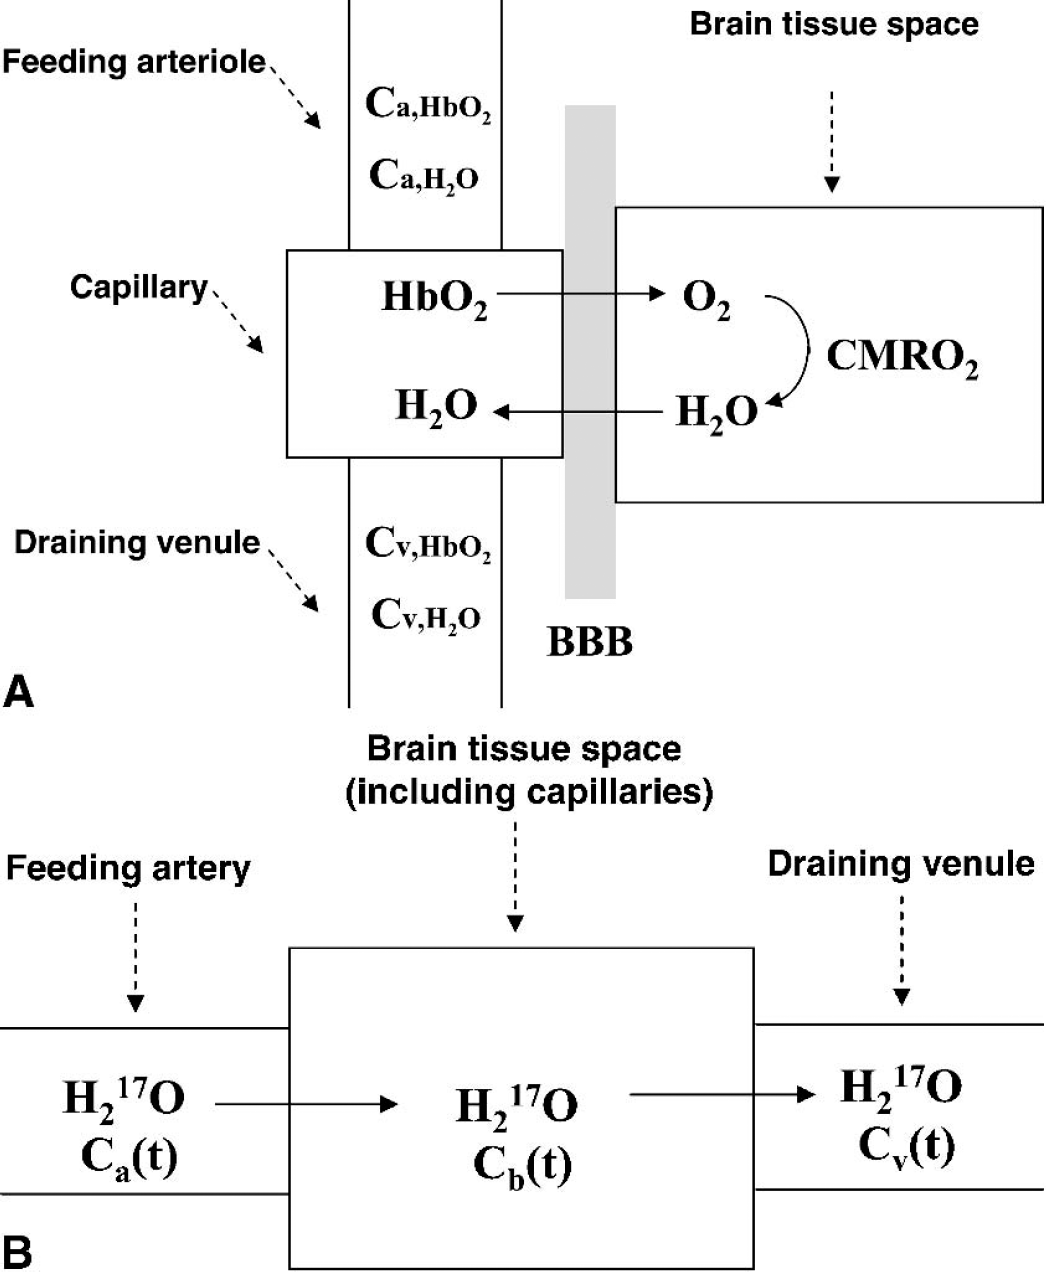
Figure 1A schematically illustrates the transportation and metabolism processes of oxygen molecules in the brain. After gas exchange in the lung, the inhaled O2 molecules quickly bind to hemoglobin (Hb) in the blood, forming O2–hemoglobin complexes (HbO2). Through the feeding arteries and arterioles, the HbO2 complex permeates cerebral capillaries, where the O2 molecules dissociate, cross the blood-brain barrier in the form of free gas, diffuse into the brain tissue (intracellular and extracellular) space, and finally enter mitochondria where they are converted to metabolic water via oxidative metabolism. The metabolic water molecules move out of the mitochondria, traversing the same pathway as O2 entry but in reverse, and are washed out through venules and veins.
The key factor for the success of the 17O MR approach is the detection sensitivity as well as the visibility of 17O NMR. The critical parameters for determining the NMR sensitivity at different field strength are the longitudinal (T1) and the transverse (T2) relaxation times, and the magnetic field strength. The relaxation times of the 17O spin, the only magnetic stable isotope of oxygen, are dominated by quadrapolar interactions (Abragam, 1961). In the case of bulk water (excluding “bound” water in cells), for which the extreme narrowing limit is applicable (i.e., τcω ≫ 1, where τc is the rotational correlation time and ω is Larmor frequency in radians/s), the values of T1 and T2 due to quadrapolar interactions become
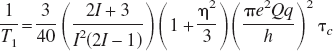
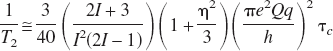
where the term of π
In contrast to 17O water, 17O2, either as free gas or in a dissolved form in water, is strongly paramagnetic because of its two unpaired electrons, and hence undetectable because of the strong dipolar coupling between the electrons and the nucleus. When bound to hemoglobin, the 17O2 resonance is broadened beyond NMR detection owing to the extremely slow rotational motion of the oxyhemoglobin complex with large molecular weight. Saturation transfer electron paramagnetic resonance studies have shown that the τc value for rotational motion of the hemoglobin molecule is 8 × 10⁻⁶ seconds when the hemoglobin molecule is encapsulated within the erythrocyte membrane (Cassoly, 1982). This is approximately 106 times slower than the rotational correlation time of bulk water (10−12–10−11 s) (Steinhoff et al., 1993). Such slow rotational motion leads to extremely fast T2 relaxation and renders the 17O2 molecule bound to hemoglobin invisible in 17O MR data.
In the modified “complete model” for 17O MR measurements (Fig. 1B), the vascular compartment of arteriole is replaced by artery because of the approximately identical H217O contents in arteriole and artery. Another approximation applied in this model is to include the vascular compartment of capillary into the brain tissue. In fact, the contribution of the H217O contents inside the capillaries is negligible because of the small capillary blood volume in the brain (approximately 2%). Henceforth, we will refer to the model in Fig 1B as the “complete model” accounting for all relevant parameters in this modified model.
Complete CMRO2 model for the 17O magnetic resonance approach
As illustrated by Fig. 1B, the mass balance relation of the concentration of labeled H217O in the brain tissue during the period of inhalation of 17O2 gas is given by:
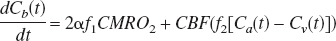
where Ca, Cb and Cv are the H217O concentration expressed 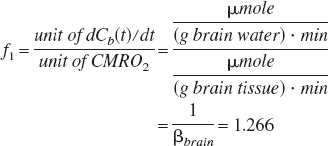
where βbrain is defined as (g brain water)/(g brain tissue) and is equal to 0.79 (Pekar et al., 1995; Ter-Pogossian et al., 1970).
The conventional CBF unit is (mL blood) · (g brain tissue)−1 · min−1. Based on one common assumption that water in the brain tissue is in rapid equilibrium with water in venous blood, Cv(t) is proportional to Cb(t) (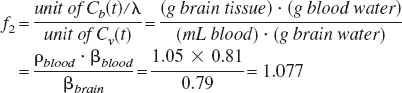
where ρblood = (g blood)/(mL blood) = 1.05 (Altman, 1961), and βblood = (g blood water)/(g blood) = 0.81 (Ter-Pogossian et al., 1970).
Substituting the Cv(t) term in Eq. 3 using the equality 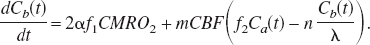
The correction factor
Solving the linear differential equation of Eq. 6 gives:
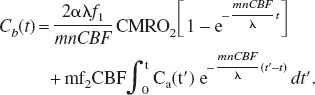
In principle, the CMRO2 value can be precisely calculated using Eq. 7 and the experimental data on Cb(t), CBF, n, and Ca(t). The primary aim of the two methods as presented in the upcoming sections of this article is to simplify CMRO2 calculation without requiring Ca(t) measurement or CBF measurement. In the first method (method I), CBF measurement for each image voxel is required. The second method (method II) provides a further simplified approach for CMRO2 calculation, which does not require CBF and Ca(t) measurements.
Simplified model: method I
The source of labeled water in the arterial input [i.e., Ca(t)] is the metabolically created water in all the aerobic tissues in the entire animal which exchanges with the capillary water and enters into the venous and subsequently the arterial part through the blood circulation. This is often referred to as “recirculation.” Assuming that there are no nonlinear effects introduced by water transport from tissues to capillaries, the concentration of H217O in blood (venous or arterial) should increase linearly during a brief 17O2 inhalation period (e.g., 2 minutes in our experiments). This assumption is justified based on the approximation that the metabolic H217O from all organs can reach equilibrium with the water in venous blood rapidly compared with the rate it is produced by the mitochondria. Therefore, the concentration of H217O in the arterial blood, Ca(t), can be assumed to have a linear dependence on the inhalation time 
where 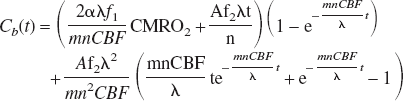
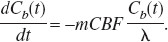
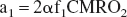
or,
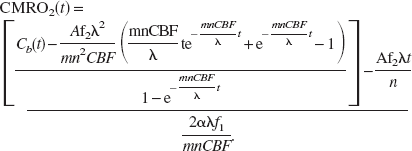
According to Eq. 10, besides Cb(t) and other known constants, both constant A and CBF are required to calculate CMRO2. In our experiments, CBF was measured from the “wash-out” rate of the inert diffusible tracer H217O in the brain tissue after a rapid bolus injection of H217O via a close feeding artery (Zhu et al., 2001). Because metabolic H217O molecules are not generated in the absence of 17O-labeled oxygen gas inhalation (i.e., the contribution from the first term on the right side of Eq. 3 is negligible), and Cb(t) ≫ Ca(t) subsequent to the passage of the bolus of H217O injected via a close feeding carotid artery, then
Solving Eq. 11 gives:

where
During a steady state of oxidative metabolism, CMRO2 values calculated by Eq. 10 at different time points of Cb(t) measurement should be a constant shortly after the onset of 17O gas inhalation when the 17O content in brain reaches a value that exceed the Km of cytochrome oxidase. In the rat, measurements according to the complete modeling for the 17O MR approach revealed that this period was less than 0.5 minutes. Thus taking a derivative of Eq. 10 for time points beyond this initial delay period, yields an equation where the only unknown is
Simplified model: method II
Measurement of CBF is still required in method I. This requirement increases the complexity of the experiment, even though this measurement can be accomplished noninvasively by the arterial spin tagging MR approaches; furthermore, another parameter of constant
According to Taylor's theorem, Cb(t) can be written as

Because all the H217O concentrations are expressed 
with the boundary condition that Cv and Ca are both zero at the beginning of the inhalation; i.e., Cv(0) = Ca(0) = 0. Using these expansions and the boundary conditions, Eq. 3 becomes:
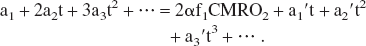
Because Eq. 15 holds for any t value, applying the polynomial theorem to Eq. 15 at t = 0 leads to:
Eq. 17 and all the previous derivations lay the mathematical foundation of method II. If the Cb(t) curve is fitted by a polynomial in the form of Eq. 13 with a0 = 0, the
Fitting a polynomial equation with infinite degree is obviously impossible for real data. In principle, the higher the order of the polynomial is used, the better the fit. However, this notion is only valid when all the data are noise-free. When noise is taken into account, larger variances in the fitted parameters will be potentially induced by fitting the data to the polynomials of larger degrees as the statistical power of fitting decreases; thus, the fitted results will be less reliable. Practically, only linear and quadratic terms were used for fitting our experimental data on Cb(t) including the zero point of Cb(t = 0) = 0 for each voxel to increase the fitting reliability.
Verification of the validity of the two models
The most straightforward way to verify the validity of the simplified methods is to compare the results obtained by using these simplified methods with the results from the complete model which requires determination of all parameters Ca(t), CBF, and
MATERIALS AND METHODS
The details of the experimental measurements used in this study are the same as those previously reported in a study we conducted to explore the feasibility of the 17O MR approach for imaging CMRO2 in a small-animal model during a brief inhalation of 17O2 gas at 9.4 T (Zhu et al., 2002). We briefly describe these measurements here for convenience.
NMR measurements
All NMR experiments were performed on a 9.4-T, 31-cm bore magnet (Magnex Scientific, Abingdon, U.K.) interfaced to a Unity INOVA console (Varian, CA, U.S.A.). The spatial localization of 17O MRS was achieved by using the three-dimensional Fourier Series Window MRS imaging technique (Zhu et al., 2002). The acquisition parameters for acquiring each three-dimensional 17O-MRS image were as follows: repetition time for NMR data acquisition, 12 milliseconds; echo time, 0.4 milliseconds; total scan average, 948; spectral width, 30 kHz; 9×9×5 phase encodes; and 0.1 mL voxel size.
Animal preparation
Male Sprague-Dawley rats were anesthetized with approximately 2% (v/v) isoflurane in a mixture of O2 and N2O gases (2:3) during surgery. After oral intubations, femoral artery and vein were catheterized for physiologic monitoring, blood sampling, and chemical administration. After surgery, anesthesia was switched to α-chloralose using continuous infusion of 0.4 mL/h of 15-mg/mL α-chloralose solution during the entire NMR measurement period (Zhu et al., 2002). The rectal temperature of the rats was maintained at 37°±1°C by using a heated water blanket.
CBF measurements
For CBF measurements, one external carotid artery was catheterized for gaining access to the internal carotid artery without interrupting blood circulation into brain (Zhu et al., 2001). A small amount (0.05 to 0.1 mL) of 40%- to 50%-enriched H217O was rapidly injected into the brain via the internal carotid artery, and three-dimensional 17O MRS imaging was used for monitoring the H217O washout processes and for determining CBF values (Zhu et al., 2001). Fitting the signal decay curve of the H217O tracer in the brain with an exponential decay according to Eq. 12 gave the CBF value in each 17O image voxel.
Ca(t) measurements
An implanted vascular RF coil was designed and constructed for continuously detecting the 17O MR signal changes of H217O in the rat carotid artery at 9.4 T. The coil was based on a modified solenoid coil design combined with an RF shielding (Zhang et al., 2003). The entire coil had a compact physical size and was readily implanted into the rat body and wrapped around the rat carotid artery. The RF shielding ensured that the 17O NMR signal detected by the implanted coil originated only from the artery blood (approximately 7 μL blood volume) covered by the coil, without contaminations from surrounding tissues—therefore, additional spatial localization was not necessary for determining Ca(t). In addition, the RF shielding minimized the electromagnetic coupling between the implanted 17O coil and the head 17O surface coil tuned at the same operating frequency (two-coil configuration), which allowed simultaneous measurements of both Ca(t) and Cb(t) with the same temporal resolution (11 seconds).
17O2 inhalation experiments
For 17O2 inhalation studies, the 17O-labeled O2 gas with 72% enrichment (Isotec Inc. OH, U.S.A.) was mixed with N2O gas (approximately 2:3 volume ratio) and then stored in a cylindrical gas reservoir. The three-dimensional 17O MRS imaging acquisitions started with the normal gas mixture containing nonlabeled O2 gas for 2 minutes; these natural abundance three-dimensional 17O MRS images were used as references for the calibration of metabolic H217O concentrations in the rat brain during and after the 17O2 inhalation. Subsequently, the respiration gas was quickly switched to the 17O2 labeled gas mixture. After 2 minutes of 17O2 inhalation, the gas line was switched back to the normal gas mixture and the three-dimensional 17O MRS imaging acquisitions were continued throughout the measurement, and a total of 100 images were collected in approximately 19 minutes (Zhu et al., 2002).
Determination of constant n
The ratio between the washout rate of the metabolic H217O after the cessation of 17O2 inhalation and the washout rate of the H217O trace from the H217O bolus injection through the rat internal carotid artery gave the value of constant
RESULTS
CMRO2 calculation results using simplified modeling (method I)
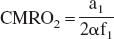
Figure 2A illustrates the simulation results showing the dependence of calculated CMRO2 values on different values of the parameter A in the simplified model of method I (Eq. 10). In this simulation, the values of CMRO2 = 2.2 μmol/g/min, A = 2.0 μmol/(g blood water)/min and CBF = 0.6 (mL blood)/(g brain tissue)/min were assumed. As the A value increases, the CMRO2 values calculated for different time points change from time-dependent with CMRO2 increasing with time, to time-independent and again to time-dependent with CMRO2 now decreasing with time. Only the value of A = 2.0 μmol/(g blood water)/min provided a constant value of CMRO2 = 2.2 μmol · g−1 · min−1 as expected.
(
Simplified method I was applied to the experimental data obtained in the form of images of Cb(t) and CBF measured from seven animals, which were previously published (Zhu et al., 2002). Figure 2B demonstrates one example of simplified method I applied to data from a single voxel from a representative rat. In this calculation, the A value varied from 0 to 10 with the step size 0.05 (μmol · (g blood water)−1 · min−1). As discussed in the Theory section, the correct A value should yield a time independent CMRO2 for this steady state. The first two points (represented by open circles) in this experimental data were not included in this calculation because their signal-to-noise ratio is low due to insufficient H217O buildup and that a delay is expected after the onset of inhalation of the 17O2 labeled gas and before the 17O2 content in brain reaches a value that exceed the Km of cytochrome oxidase; only when the 17O2 concentration exceeds the Km of cytochrome oxidase for O2 should the value calculated for CMRO2 from the 17O data become time independent. Linear least square fitting was used to fit the CMRO2 values calculated according to Eq. 10 based on the experimental Cb(t) data as a function of measurement time as well as the CBF and
CMRO2 calculation results using simplified modeling (method II)
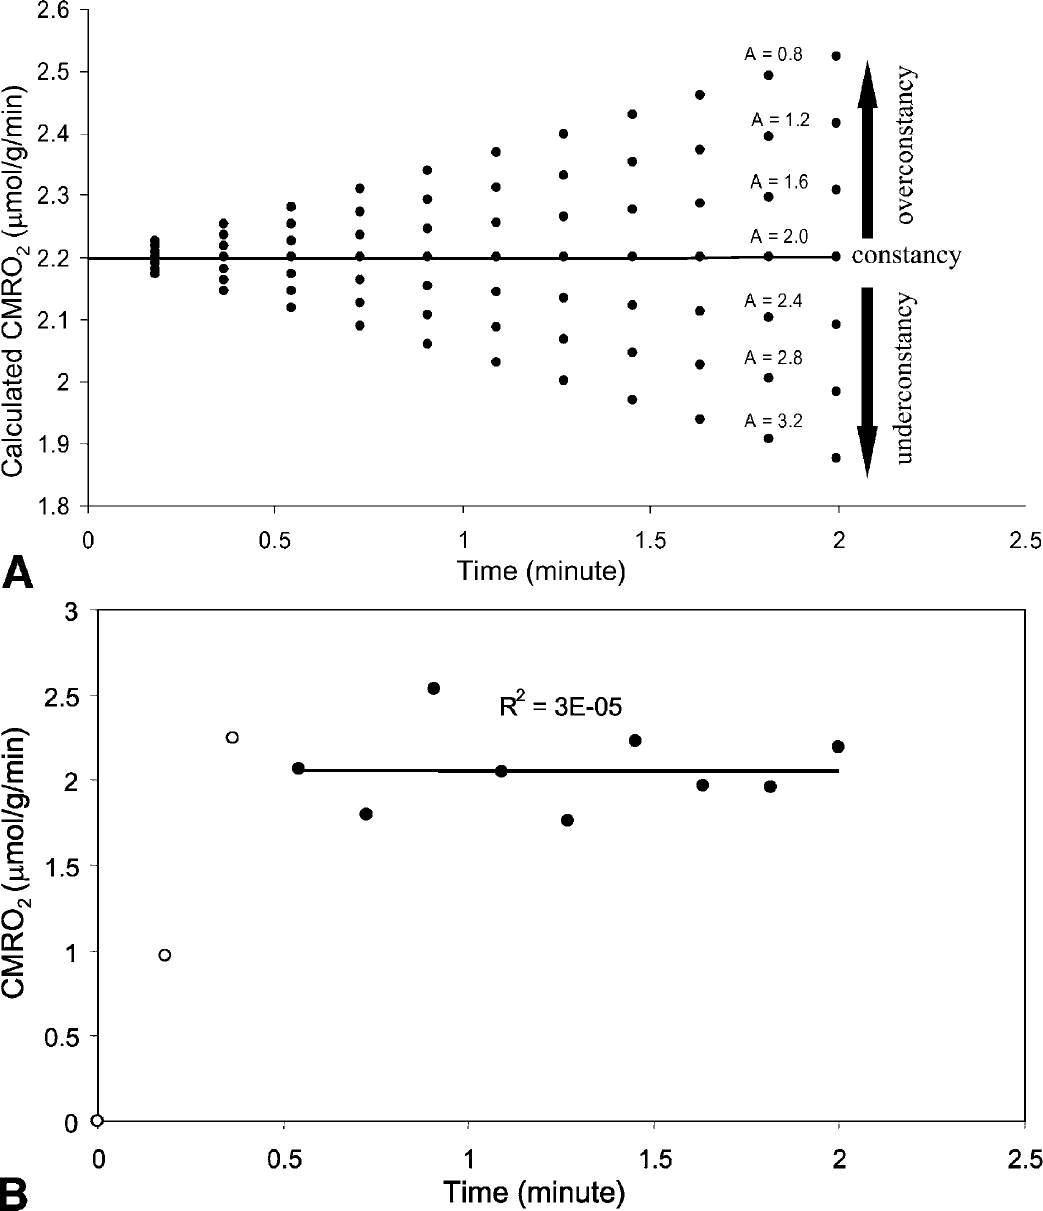
Linear and quadratic polynomials were used to fit the observed Cb(t) curves from individual image voxels as a function of time for CMRO2 calculation using method II as described in Theory. The experimental data and the fits obtained using only a linear or quadratic dependence on time in a representative rat are shown in Figs. 3A and 3B (single voxel results). The averaged CMRO2 values over all voxels in the brain for each individual animal (n = 7) using method II (both linear and quadratic fitting results) are summarized in Fig. 4. In comparison with the gray matter, the fraction of the white matter volume in the rat brain is much smaller than that of other animals (e.g., cats and nonhuman primates) and humans. Therefore, the averaged CMRO2 values in Fig. 4 should approximately reflect the averaged oxygen utilization rates in the gray matter in the rat brain.
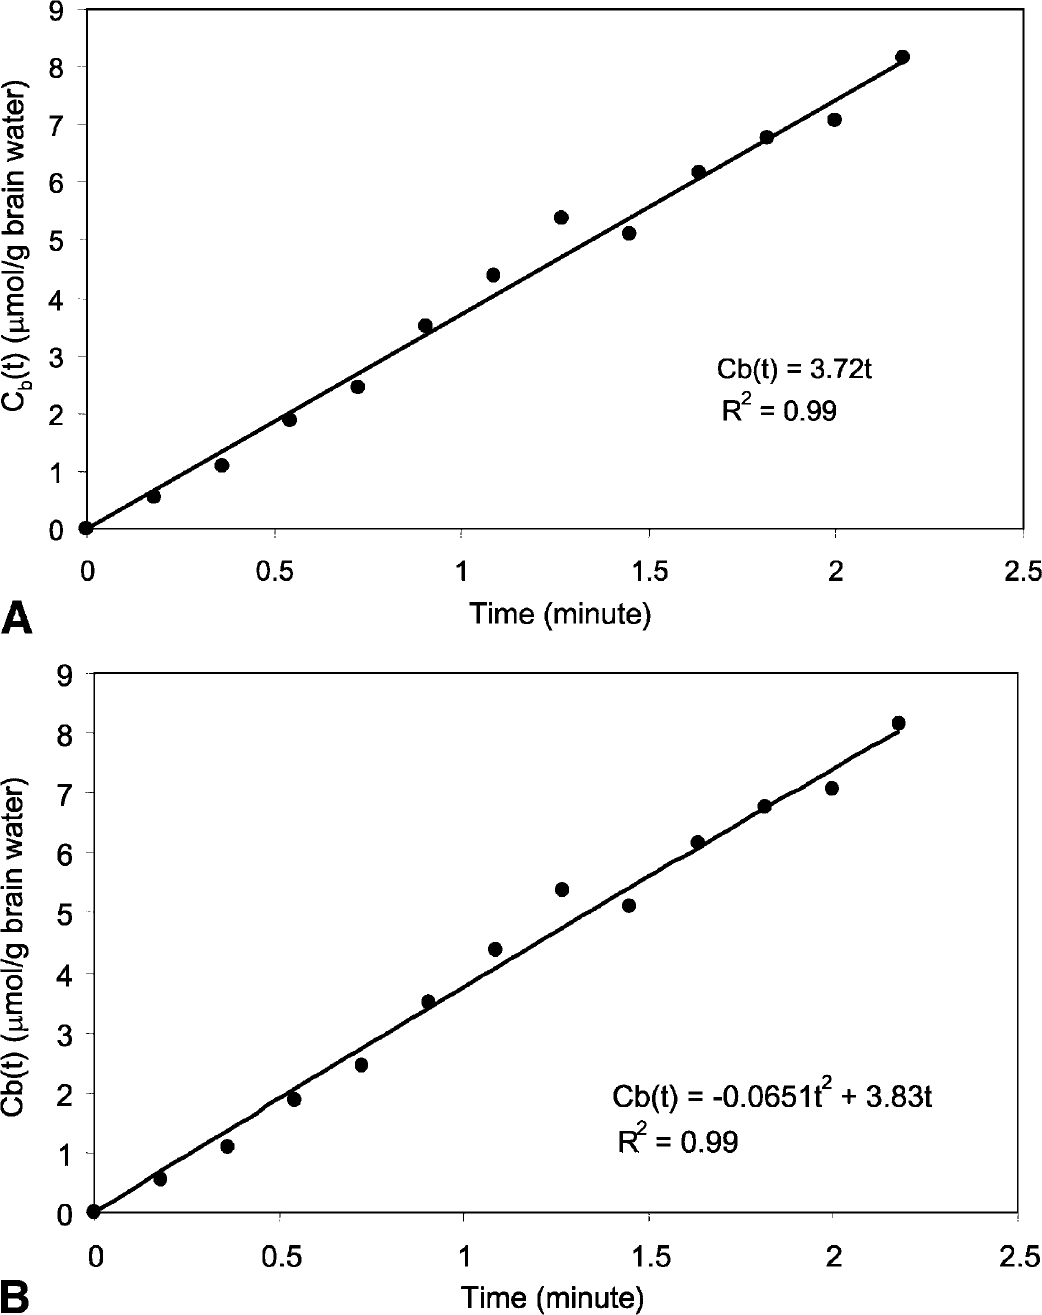
CMRO2 calculation using the experimental data of one single voxel from a representative rat and (
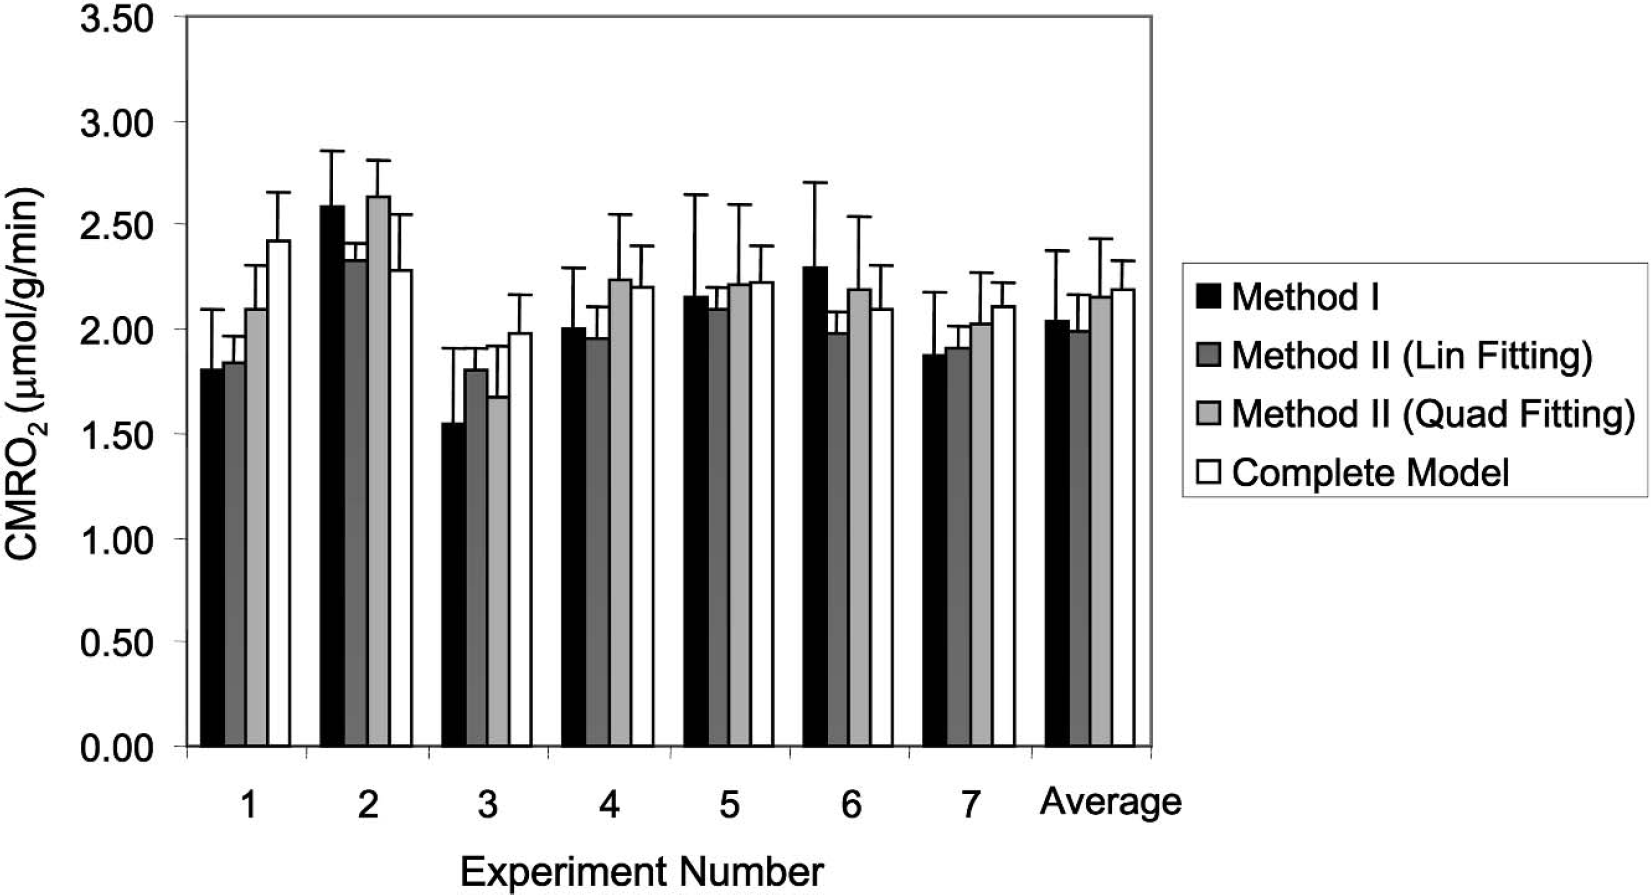
Comparison of calculated CMRO2 results from seven measurements based on the simplified methods (method I; method II using the linear fitting or quadratic fitting approach) and the complete model. The last (right) column represents the averaged CMRO2 value of seven animal measurements. All error bars represent the standard deviation errors.
Validation of two simplified methods
As displayed in Fig. 4, the average CMRO2 values calculated with both the simplified methods were in good agreement with that calculated using the complete model for the 17O MR-based CMRO2 measurements from the same 17O data (Zhu et al., 2002). Paired
DISCUSSION
Method I, in principle, should provide a more accurate CMRO2 value as long as the assumptions made in this method hold. However, because the criterion for the
Eq. 3 indicates that the right side in the equation composes two terms: a constant term 2αF1CMRO2 and a time variable term of CBFF2[Ca(t) − Cv(t)]. If Ca(t) and Cv(t) happen to cancel each other, then Eq. 3 can be readily solved with the solution of Cb(t) = 2αF1CMRO2t. Under our experimental conditions, this condition is likely to be satisfied because of the observation of good approximation for the linear fitting of the experimental Cb(t) curves. In general, however, this condition cannot be guaranteed under all circumstances. When Ca(t) and Cv(t) deviate from each other, the Cb(t) curve as a function of t can deviate from a straight line. In this case, the use of quadratic or higher-order polynomial fitting should provide a better accuracy for CMRO2 calculation.
The fact that the linear fitting approach in method II produces a good approximation for providing CMRO2 values, which are close to the true CMRO2 values determined by the complete model under our experimental conditions, implies that the difference between F2Ca(t) and nCb(t)/λ terms in Eq. 6, where Cb(t) is usually larger than Ca(t), is small and its influence on the CMRO2 calculation is negligible. One crucial observation supporting this notion is the limited water permeability across the mitochondria membranes leading to a small constant
CONCLUSION
The results from this work validate the simplified modeling methods described in this article for calculating CMRO2. They suggest that the 17O MR approach with the simplified modeling is capable of determining and imaging CMRO2 even in the absence of the arterial input function or CBF measurements. The combination of the simplified modeling and ultrahigh-field 17O NMR may potentially provide a robust, reliable, and completely noninvasive tool for studying the central role of oxidative metabolism in brain function and neurologic diseases
Footnotes
Acknowledgments:
The authors thank Drs. Xiaoliang Zhang, Yi Zhang, Runxia Tian, and Hellmut Merkle for their scientific discussion and technical assistance.