
Abstract
Cerebral blood flow (CBF) and cerebral metabolic rate of oxygen (CMRO2) are physiological parameters that not only reflect brain health and disease but also jointly contribute to blood oxygen level-dependent (BOLD) signals. Nevertheless, unsolved issues remain concerning the CBF–CMRO2 relationship in the working brain under various oxygen conditions. In particular, the CMRO2 responses to functional tasks in hypoxia are less studied. We extended the calibrated BOLD model to incorporate CMRO2 measurements in hypoxia. The extended model, which was cross-validated with a multicompartment BOLD model, considers the influences of the reduced arterial saturation level and increased baseline cerebral blood volume (CBV) and deoxyhemoglobin concentration on the changes of BOLD signals in hypoxia. By implementing a pulse sequence to simultaneously acquire the CBV-, CBF- and BOLD-weighted signals, we investigated the effects of mild hypoxia on the CBF and CMRO2 responses to graded visual stimuli. Compared with normoxia, mild hypoxia caused significant alterations in both the amplitude and the trend of the CMRO2 responses but did not impact the corresponding CBF responses. Our observations suggested that the flow-metabolism coupling strategies in the brain during mild hypoxia were different from those during normoxia.
Keywords
Introduction
Cerebral blood flow (CBF) and cerebral metabolic rate of oxygen (CMRO2) are essential physiological parameters in the brain. Variations in the CBF and CMRO2 collectively determine blood oxygenation, the physiological foundation of blood oxygen level-dependent (BOLD) functional magnetic resonance imaging (fMRI).1–3 The exact relationship between focal changes in the CBF and CMRO2 in the working brain has been of great research interest in the field of neuroimaging.
Investigations on the CBF–CMRO2 relationship date back to the 1890s, when focal CBF was first suggested to vary with the local metabolic demand during functional activities. 4 The increased oxygen demand of oxidative metabolism was considered the driving force behind increases in CBF during functional tasks. In the 1980s, Fox et al.5,6 reported that the increase in CBF was 6–10 times greater than the increase in CMRO2 in the areas of functional activation, suggesting that CBF was regulated by factors other than oxygen demand. Thereafter, a substantial amount of research was conducted to find divergent CBF–CMRO2 relationships under various conditions. Factors such as age; 7 the type, 8 frequency 9 and duration 10 of a stimulus; blood CO2 level; 11 and caffeine exposure 12 have been shown to affect the CBF–CMRO2 relationship. However, previous studies have rarely discussed the influence of oxygen availability on the CBF–CMRO2 relationship. The brain is particularly sensitive to changes in oxygen level and is prone to irreversible damage due to long-term hypoxia, which, unfortunately, is often experienced at high altitudes or in the context of brain disorders. The effects of hypoxia on stimulus-induced CBF changes alone have been well studied, and CBF responses have been reported to be unaffected by mild hypoxia.13,14 Nevertheless, the effects of hypoxia on the CBF–CMRO2 relationship are under studied.
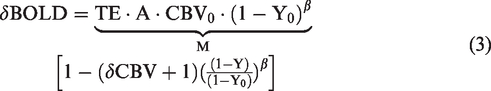
Under normoxic conditions, relative changes in CMRO2 are mostly measured using a robust calibrated BOLD model (hereinafter refers to as the “Davis model”) first proposed by Davis et al. 15 The Davis model assumes that arterial blood is fully oxygenated and that the BOLD signal is related to changes in the volume and deoxyhemoglobin concentration in venous blood. 15 A scaling factor, M, is used to calibrate the change in the BOLD signal against its baseline state. 15 M is usually obtained via gas-related physiological challenges. In hypoxia, however, not only both arterial and venous blood contributes to the BOLD signal, and furthermore, the hypoxic M factor cannot be easily obtained through physiological calibrations. Thus, the Davis model is not valid in hypoxia.
The specific aim of this study is twofold. First, an extended calibrated BOLD model (hereinafter refers to as the “extended model”) incorporating CMRO2 measurements in hypoxia was developed. This extended model calculated an effective deoxyhemoglobin concentration that properly weighted deoxyhemoglobin from both arterial and venous blood and scaled the hypoxic M factor in relation to the normoxic M factor. The extended model was cross-validated with a multicompartment BOLD model proposed by Griffeth and Buxton (hereinafter refers to as the “G-B model”). 16 Second, the effects of mild hypoxia on CMRO2 and its relationship with CBF during brain stimulation were investigated. In this work, mild hypoxia was induced by having subjects breathe a gas mixture composed of 12%O2 and 88%N2. An MRI pulse sequence was implemented with simultaneous acquisition to measure the cerebral blood volume (CBV)-, CBF- and BOLD-weighted signals 17 during graded visual stimulations at 1, 4 and 8 Hz. A hypercapnia challenge task was conducted individually to determine the normoxic M factor. In addition, the effects of mild hypoxia on the task-evoked CBF and CMRO2 responses were evaluated and compared with those under normoxic conditions.
Theory
In the following context, we define
The extended calibrated BOLD model
Boxerman et al.
18
demonstrated that the change in the effective transverse relaxation rate,

Assuming a small

Using a two-compartment model for the vasculature, which assumes that the capillary blood is correspondingly distributed into the arterial and venous blood,

The Fick principle depicts the relationship among CMRO2, CBF and the arterial and venous oxygen content (

The blood oxygen content is the sum of the oxygen bound to hemoglobin and the oxygen dissolved in plasma, as follows
28


Allowing two physiological conditions in one experiment,

Combining equations (3), (4) and (8), the extended model becomes
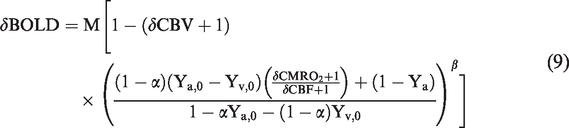

Note that no assumption has been made regarding blood oxygen saturation during the deduction of this extended model. Therefore, equations (9) and (10) can be applied to normoxia, hypoxia and other conditions of oxygen availability.
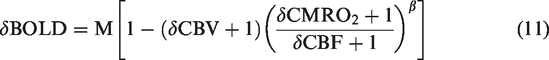
Estimating δCMRO2 under normoxic conditions
In normoxic environments, arterial blood is assumed to be fully oxygenated. Substituting
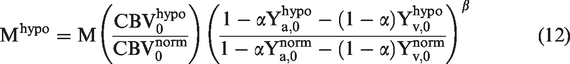
Estimating δCMRO2 under hypoxic conditions
In hypoxic environments, the Davis model is not valid due to reduced oxygen saturation in the arterial blood. Moreover, the M value under hypoxic conditions, denotes Mhypo, cannot be easily acquired from physiological calibrations because breathing hypoxic and breathing other (e.g. normoxic, hypercapnic, or hypoxic+hypercapnic) gas mixtures yield uncorrelated CMRO2 values.
31
However, Mhypo is related to M according to equations (4) and (10)
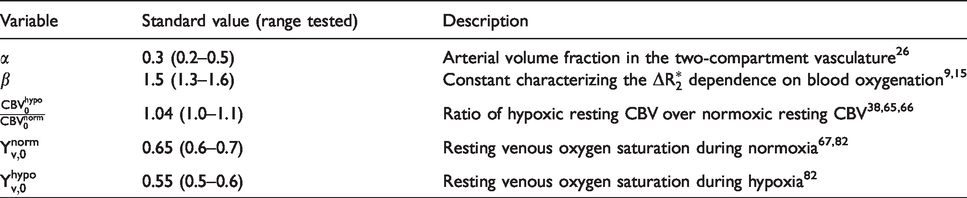
Variables used in the extended model.
Material and methods
Subjects
Fourty-eight healthy subjects (22 females, average age
Gas supply
For the entire scanning session, breathing gases were supplied to all subjects at a constant flow rate of 15L/min via a laboratory-built gas supply system. Three types of gas mixtures were separately stored in three high-pressure gas tanks: (1) medical air, consisting of 21%O2 and 79%N2; (2) a mildly hypoxic gas mixture, consisting of 12%O2 and 88%N2; and (3) a hypercapnic gas mixture, consisting of 5%CO2, 21%O2 and 74%N2. The hypercapnic gas mixture was used to calibrate M as described in the “Theory” section. The three gas tanks, equipped with pressure regulators and flowmeters, were connected to a nonrebreather facial mask by a four-way valve and provided gas to the subjects one at a time.
Experimental procedures
All subjects sequentially performed two runs of the visual task and a hypercapnia challenge task. The arterial oxygen saturation (%SpO2) of each subject was monitored by a digital pulse oximeter (Model 7500FO, Nonin, Plymouth, USA) throughout the experiments.
The visual task was a block-design paradigm of a 12 s dummy period followed by seven 60 s sessions alternating between resting and activation states. Visual stimuli displayed on a desktop monitor were reflected by a mirror placed directly in front of the subjects’ eyes. The subjects were shown a white crosshair located at the center of a black background during the resting states and a black-and-white radial checkerboard pattern flickering at 1, 4 or 8 Hz for each activation state. The orders of the flicker frequencies were randomized (i.e. [1, 4, 8] for one possibility, [4, 8, 1] for a second possibility, [8, 1, 4] for another possibility, and so on), and all six sequential possibilities were counterbalanced across the subjects. The subjects were instructed to focus on the center of the screen throughout the 432 s task duration.
Medical air was provided during the first run of the visual task. The mildly hypoxic gas mixture was switched on upon the completion of the first run and remained on until the end of the second run. The two runs were separated by a 5–7 min rest, allowing the %SpO2 of the subjects to decrease and stabilize. As soon as the second run of the visual task was completed, medical air was switched back on, and another 5–7 min rest was included for the %SpO2 to recover so that the hypercapnia challenge task could start. During the halts, the subjects were briefly questioned about any signs of shortness of breath, discomfort or concentration difficulty; they could answer these questions with simple hand gestures indicating yes or no while keeping their heads still.
During the hypercapnia challenge, the subjects were instructed to remain awake while supplied with medical air for the first 132 s (including a 12 s dummy period) and with the hypercapnic gas mixture for an additional 180 s.
MRI scanning protocol
The data were collected on a 3.0T MRI system (Discovery MR750, GE Healthcare, Milwaukee, USA) equipped with an 8-channel head coil. A single oblique slice passing through the anterior and posterior commissures and extending to the primary visual cortex (V1) was imaged. A sequence that simultaneously acquired vascular space occupancy (VASO), arterial spin labeling (ASL) and BOLD signals
17
was implemented to measure functional changes. The acquisition parameters were as follows:
Data analysis
Images acquired during the dummy periods were discarded, and the remaining images were processed with customized MATLAB scripts (MATLAB 2016, MathWorks, Natick, USA). The VASO/ASL/BOLD images were obtained by surround average/subtraction/average of the adjacent label and control images
33
acquired during the first/second/third echo of the simultaneous acquisition sequence, respectively. Linear detrending was performed on the data from the visual task. Spatial smoothing (
A general linear model was utilized to identify functionally activated voxels, where 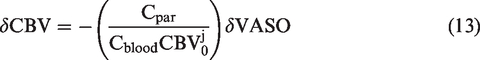
The extended model
In the extended model, M for the normoxic condition was individually determined with equation (11) by replacing δCMRO2 with 0 and the δCBV, δCBF and δBOLD measured during the hypercapnia challenge task. Then,
In addition to the standard values, the effects of physiological variations (reported in Table 1) on the mildly hypoxic δCMRO2 estimated using the extended model were evaluated.
The G-B model
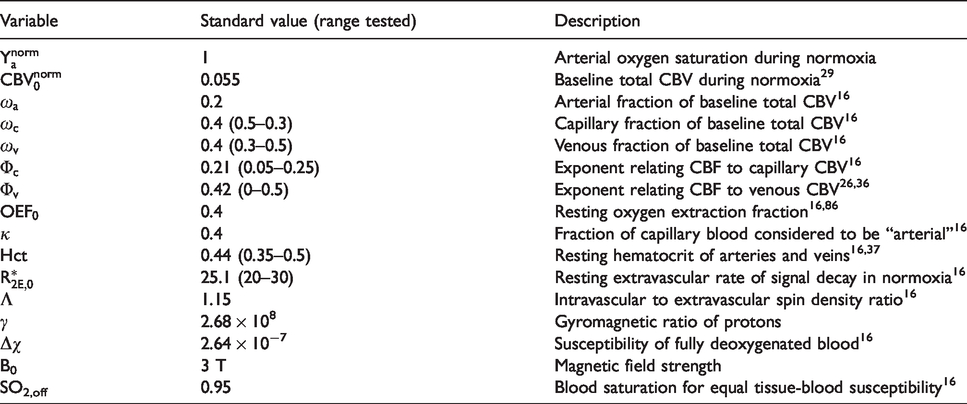
We adopted the G-B model using variables with their standard values originally provided
16
except for a few adjustments to accommodate the content of this study.
To apply the G-B model to the mildly hypoxic conditions,
The effects of physiological variations were also considered for the G-B model. In the original G-B model, a thorough analysis was conducted in normoxia, and variables including hematocrit (Hct), venous fraction of baseline total blood volume (
Variables used in the G-B model.
Once the visual task-induced δCMRO2 was estimated, the flow-metabolism coupling ratio,
Results
The average %SpO2 of the subjects during normoxic and mildly hypoxic conditions was
Figure 1 shows the quantitative δCBV, δCBF and δBOLD maps of a representative subject performing the graded visual tasks in both mildly hypoxic and normoxic environments. The functional maps were superimposed on the anatomical map of this subject. Functional activations were observed in the V1 of this subject for all stimulus frequencies and oxygen conditions. All other subjects exhibited similar activation patterns. On average, mild hypoxia caused significant decreases
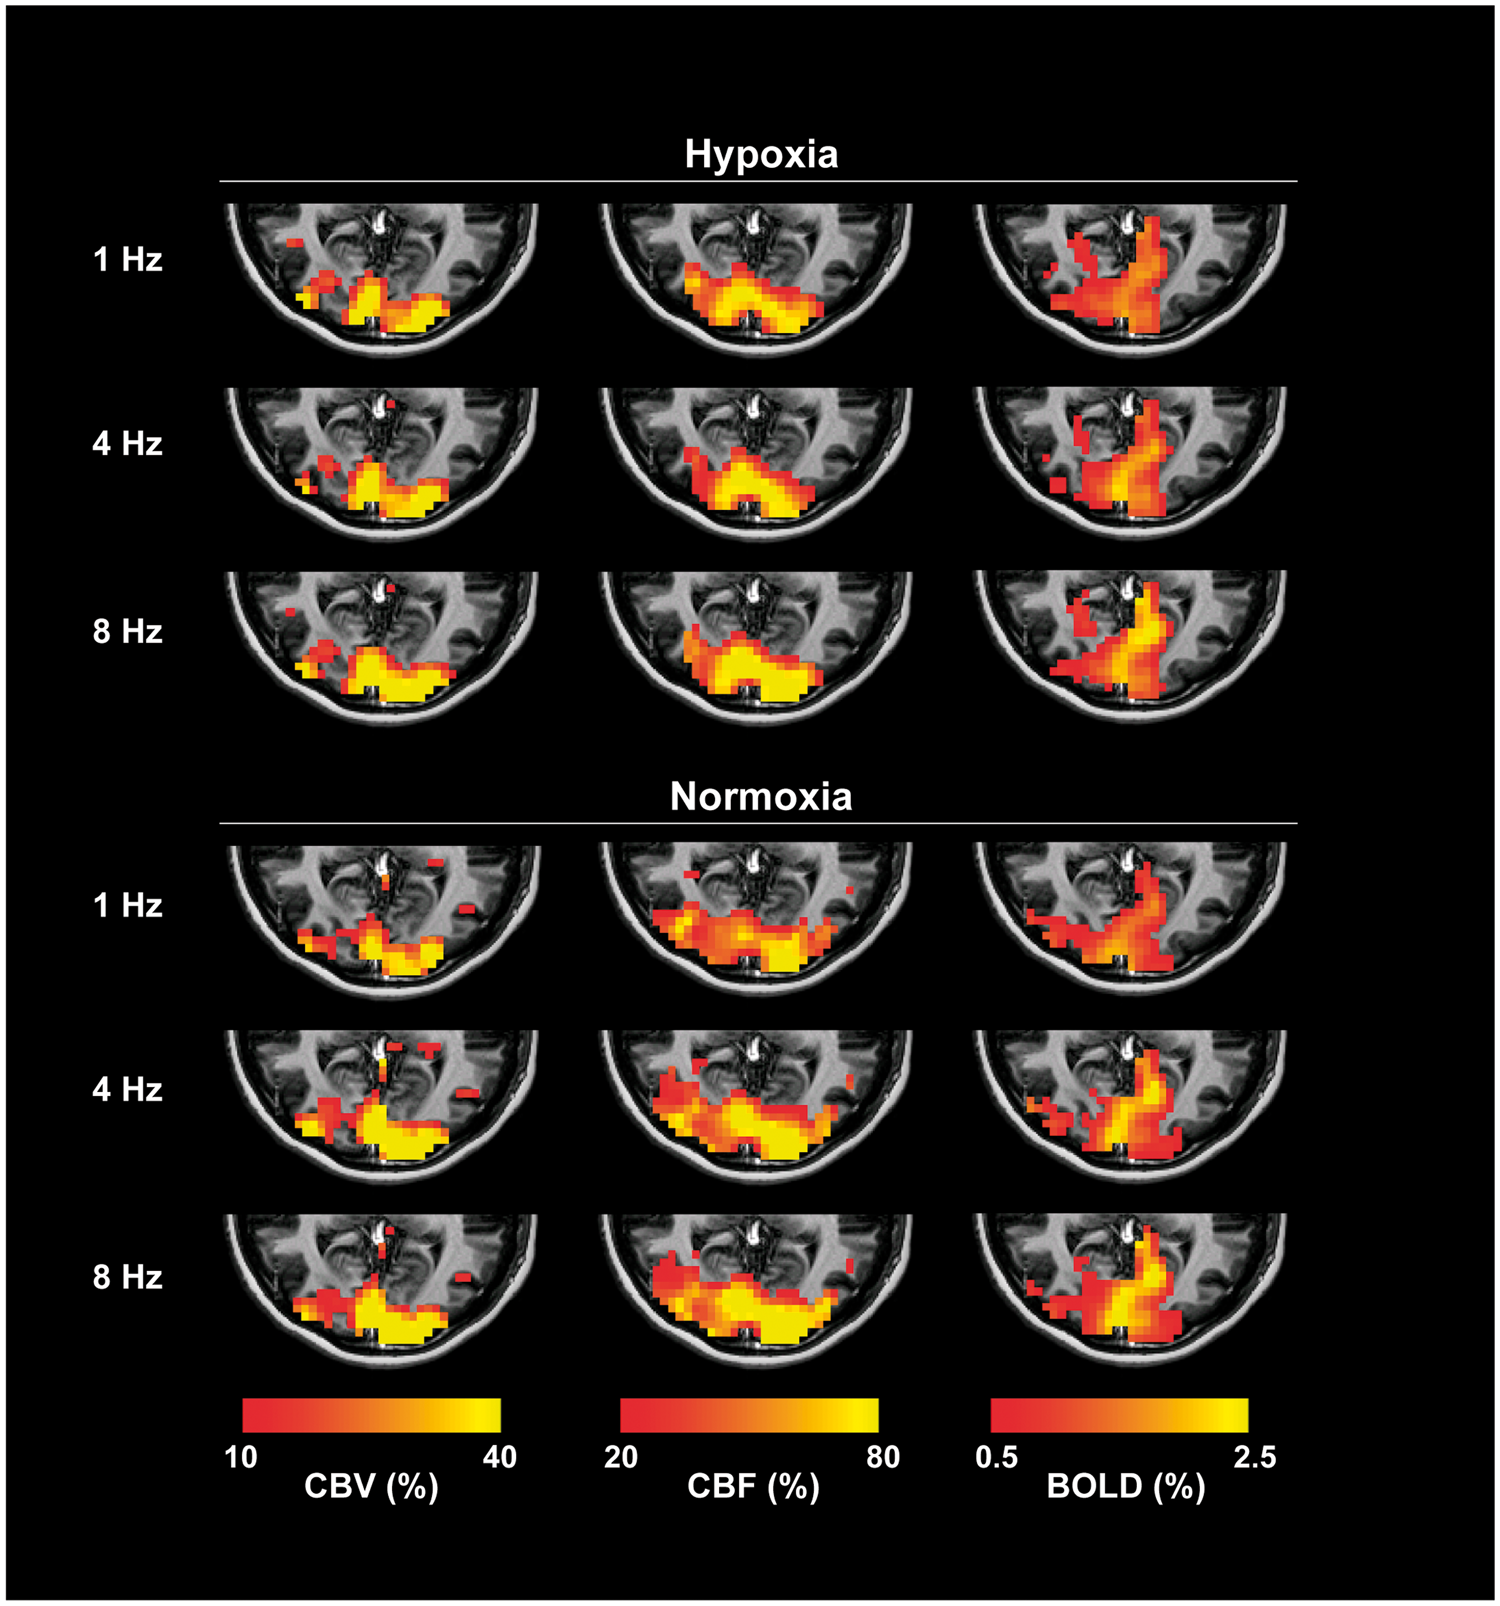
The quantitative δCBV, δCBF and δBOLD maps of a representative subject with activations evoked by visual stimulations at 1, 4 and 8 Hz in normoxic and mildly hypoxic environments. The functional maps were overlaid on the subject’s anatomical image. The functionally activated voxels were determined using a general linear model with p < 0.05 as statistically significant.
Figure 2 shows the quantitative δCBV, δCBF, δBOLD and M maps of a representative subject during the hypercapnia challenge. Hypercapnia challenge caused general signal increases in V1 in all contrasts as expected. Mhypo was calculated from M using equation (12). The average M and Mhypo of the subjects were
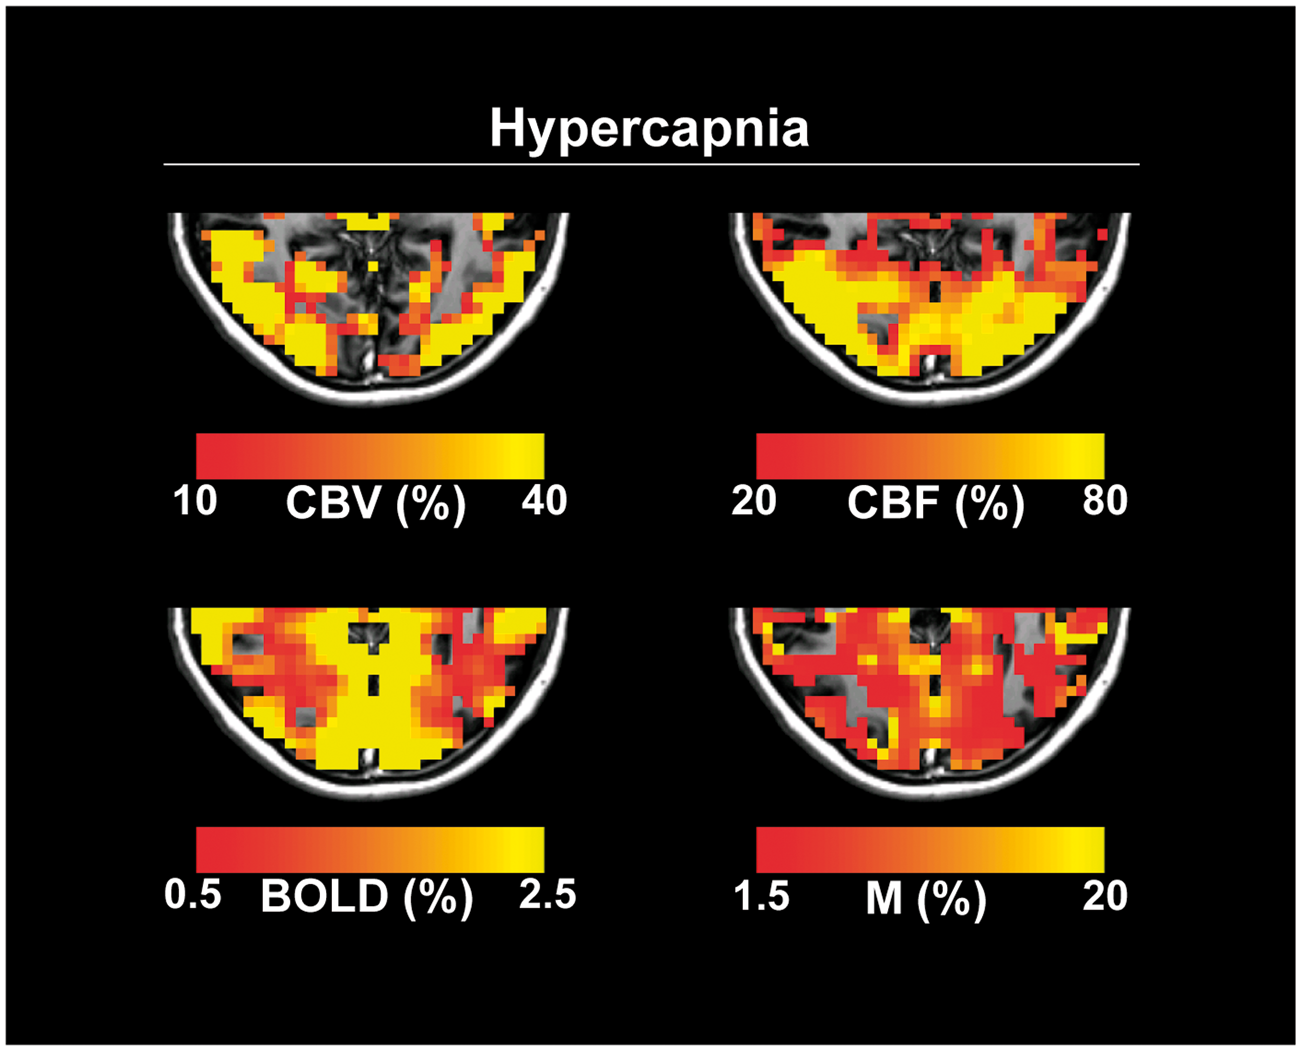
The quantitative δCBV, δCBF, δBOLD and M maps of a representative subject during the hypercapnia challenge. The functional maps were overlaid on the subject’s anatomical image. The activated voxels of the δCBV, δCBF and δBOLD maps were determined using a general linear model with p < 0.05 as statistically significant.
Figure 3(a) shows the average visual task-induced δCBV, δCBF and δBOLD measured using the simultaneous acquisition technique. For both the normoxic and hypoxic conditions, δCBV, δCBF and δBOLD increased with the visual stimulus frequency and attained their peak values at 8 Hz. During mild hypoxia, statistically significant decreases in δBOLD were found (
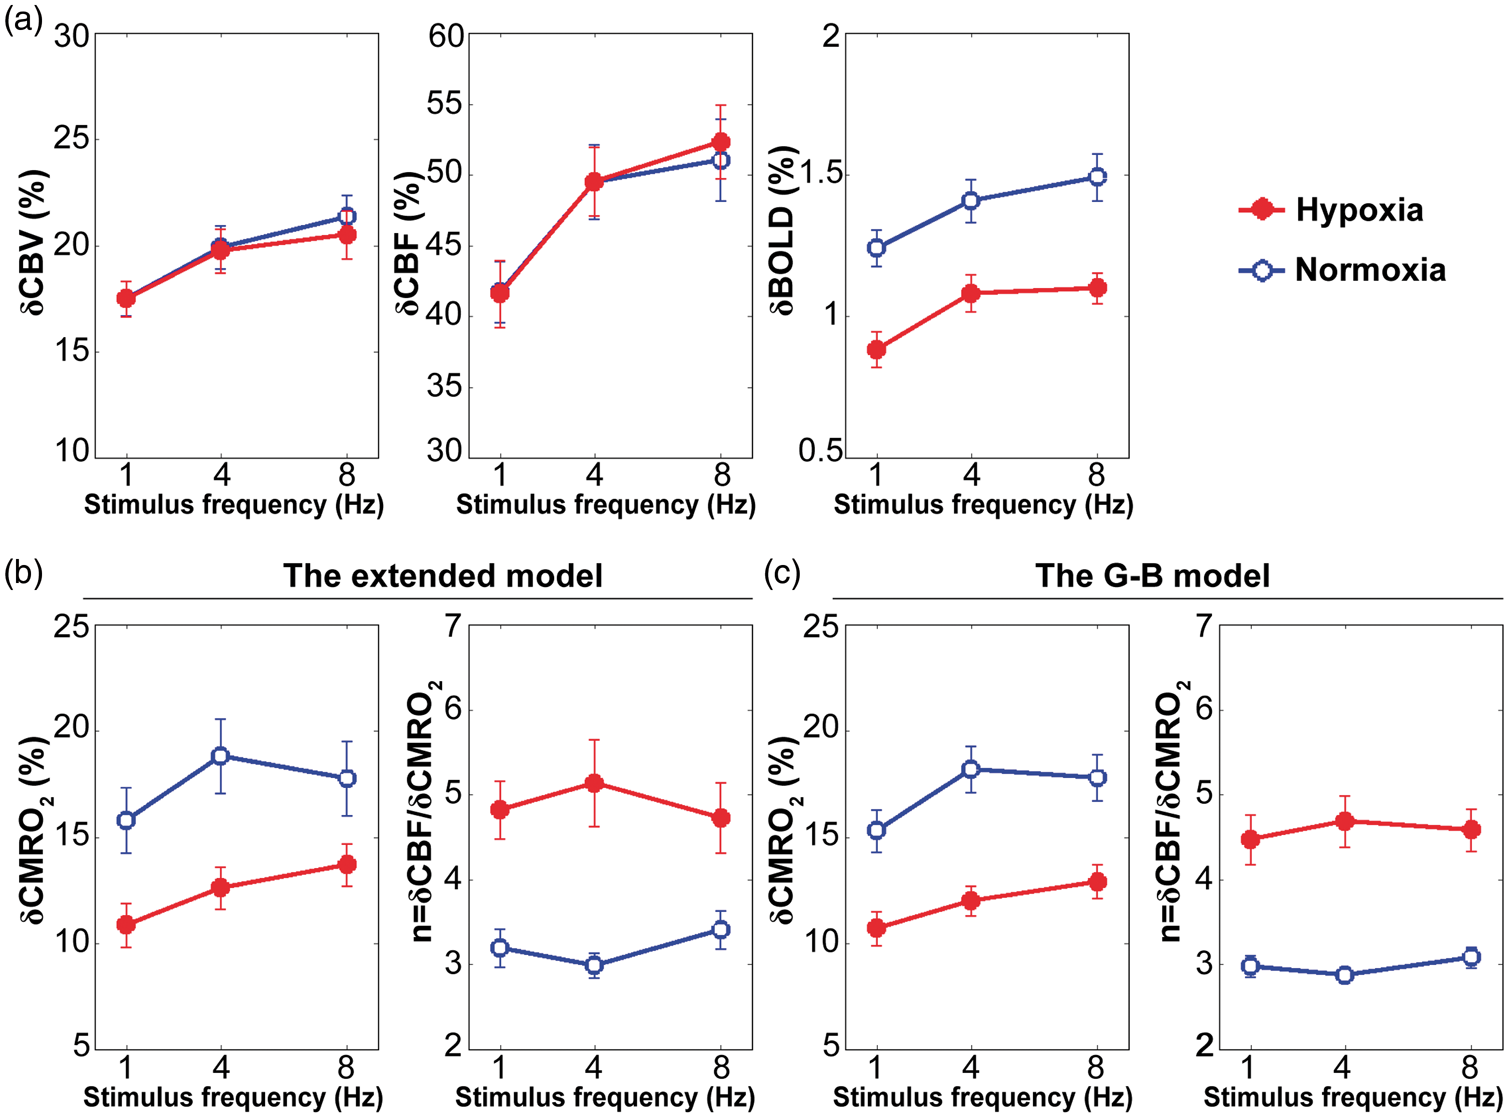
The average (a) δCBV, δCBF and δBOLD measured by the simultaneous acquisition technique; (b) δCMRO2 and n estimated using the extended model; (c) δCMRO2 and n estimated using the G-B model evoked by visual stimulation at 1, 4 and 8 Hz in normoxic and mildly hypoxic environments.
Figure 3(b) shows the average visual task-induced δCMRO2 and n estimated using the extended model under normoxic and mildly hypoxic conditions. For the normoxic condition, δCMRO2 attained its maximum value at 4 Hz, and n changed nonlinearly with the visual stimulus frequency as expected. For the mildly hypoxic condition, δCMRO2 and n were distinct from those observed during normoxia. Specifically, δCMRO2 increased with the visual stimulus frequency, and n attained its peak value at 4 Hz during mild hypoxia. Furthermore, statistically significant decreases in δCMRO2 were found (
Figure 3(c) shows the average visual task-induced δCMRO2 and n estimated using the G-B model under normoxic and mildly hypoxic conditions. Overall, the two models generated comparable results. Compared with the extended model, the results of the G-B model exhibited smaller error bars and flatter trends, indicating that the G-B model was less sensitive to intersubject variations and visual stimulus frequencies. However, no statistically significant difference between δCMRO2 (
The effects of physiological variations on δCMRO2 induced by visual stimulation at 4 Hz were used as an example for representation. The results produced by other stimulus frequencies had similar patterns (data not shown). Figure 4(a) shows the effects of physiological variations on the hypoxic δCMRO2 calculated using the extended model. δCMRO2 was positively related with
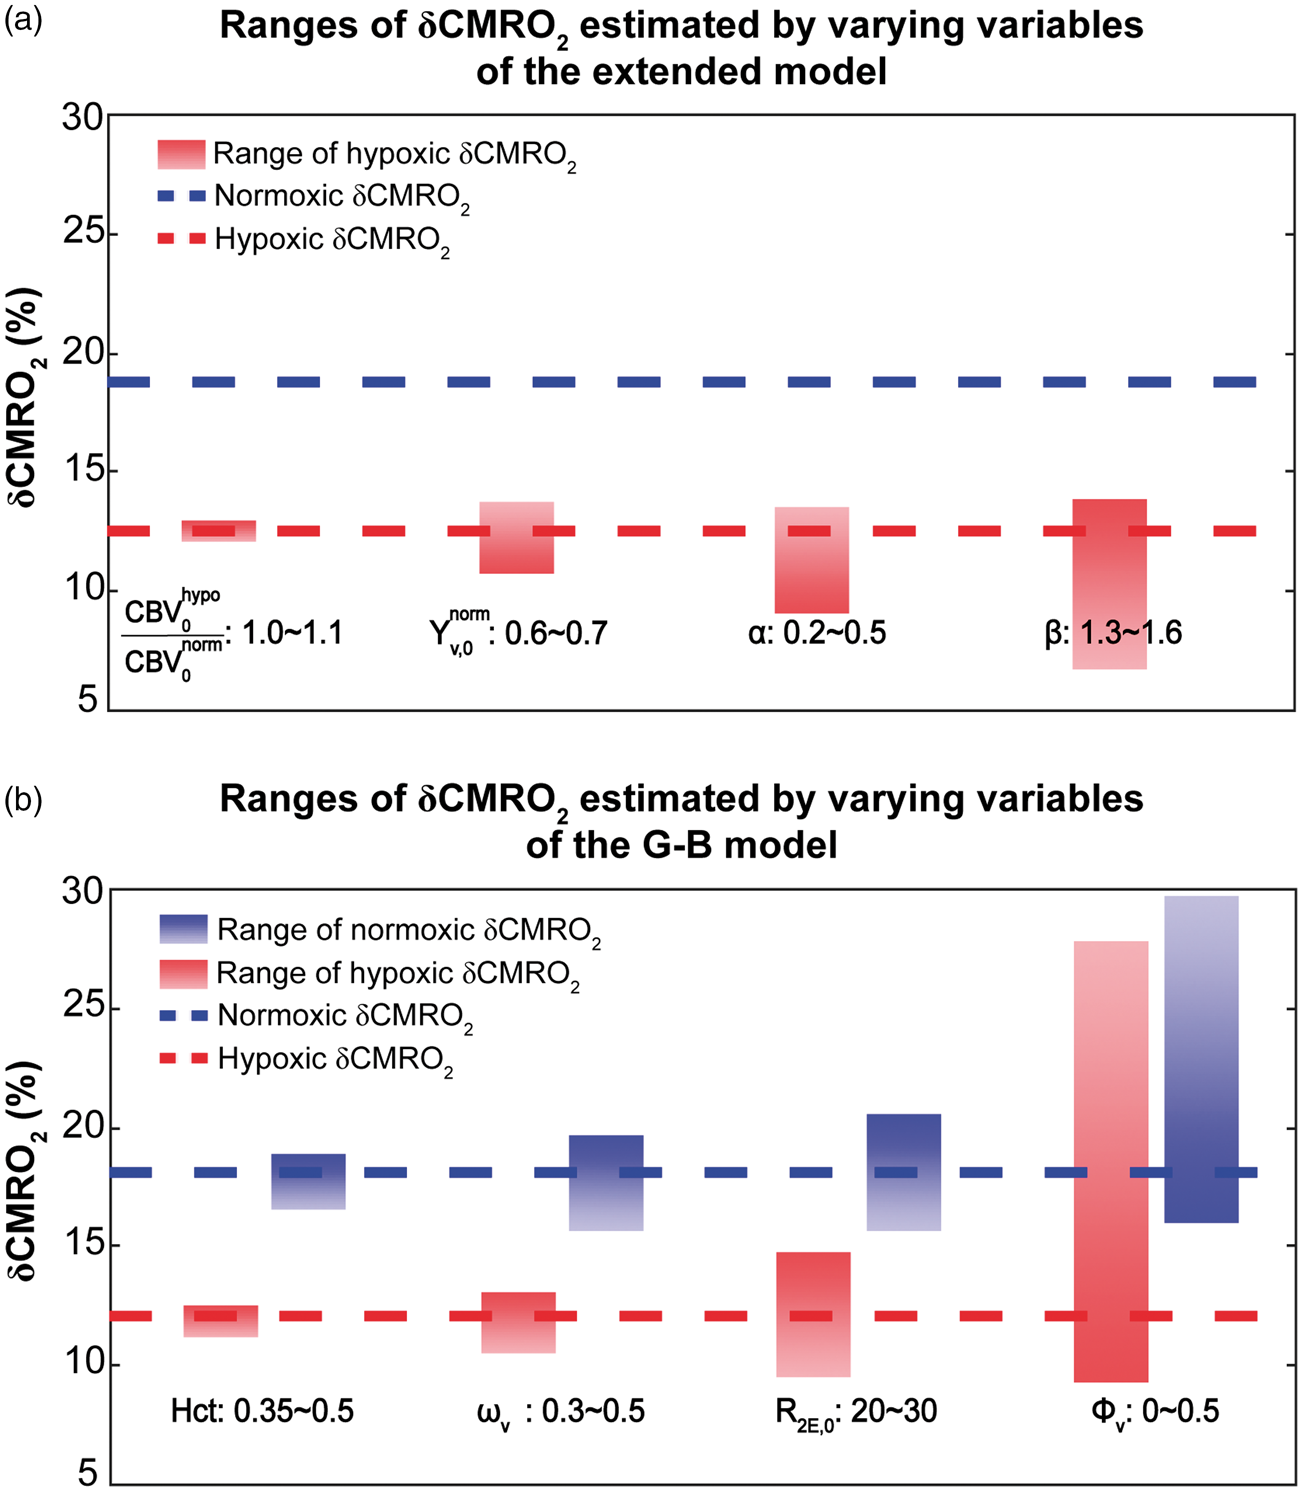
The effects of physiological variations on the δCMRO2 induced by visual stimulation at 4 Hz estimated using (a) the extended model and (b) the G-B model. The blue (red) lines represent the normoxic (hypoxic) δCMRO2 estimated using the standard values. The blue (red) bars represent the ranges of the normoxic (hypoxic) δCMRO2 estimated due to physiological variations. With the extended model, all variables including
Figure 4(b) shows the effects of physiological variations on both normoxic and hypoxic δCMRO2 calculated using the G-B model. δCMRO2 was positively related with Hct,
Discussion
In this study, an extended calibrated BOLD model incorporating the dynamic measurement of δCMRO2 in a hypoxic environment was developed and cross-validated with a multicompartment BOLD model. 16 A simultaneous acquisition technique that allows the CBV-, CBF- and BOLD-weighted signals to be measured in a single experiment 17 was implemented. The CBF-CMRO2 relationship was investigated with graded visual stimulation tasks in both normoxic and mildly hypoxic environments.
Effects of mild hypoxia on visual task-induced δCBV, δCBF and δBOLD
As essential parameters for δCMRO2 estimation, the effects of mild hypoxia on task-induced δCBV, δCBF and δBOLD deserve close attention. Our observations regarding the measurements of δCBV, δCBF and δBOLD evoked by the graded visual stimuli in normoxia agreed well with previous findings.9,40,41 However, to the best of our knowledge, no prior work on the responses of CBV, CBF and BOLD to graded stimuli during mild hypoxia has been reported. Our data indicated that mild hypoxia did not influence the task-induced δCBV or δCBF values for any of the tested stimulus frequencies, which have been demonstrated with monotonic stimuli in several positron emission tomography (PET)13,42 and MRI14,43–45 studies in humans. In addition, our data suggested a significant decrease in task-induced δBOLD during mild hypoxia for all stimulus frequencies, consistent with previous findings of experiments with monotonic stimuli.14,46–48
A confounding factor for accurate measurements of CBV, CBF and BOLD is the fluctuation in the arterial CO2 pressure (PaCO2) during mild hypoxia, which could not be directly recorded in the current experimental setting. Inhalation of 12%O2 has been shown to decrease PaCO2 to
Separate from CO2 perturbation, accurate measurements of CBV, CBF and BOLD can also be affected if hypoxia had caused changes in the blood relaxation times. The blood
Effects of mild hypoxia on the CBF-CMRO2 relationship
In normoxic environment, the visual task-induced δCMRO2 varied nonlinearly with the stimulus frequency, with the maximum value occurring at 4 Hz. In addition, the flow-metabolism coupling relationship, n, varied nonlinearly with the stimulus frequency. These trends in δCMRO2 and n were consistent with the results of earlier MRI and PET studies.29,61 In the mildly hypoxic environment, δCMRO2 and n exhibited different trends with the stimulus frequency compared with the normoxic environment. Specifically, δCMRO2 increased with the stimulus frequency, and n attained its peak value at 4 Hz during mild hypoxia. Moreover, the amplitudes of the visual task-induced δCMRO2 significantly decreased for all stimulus frequencies. Thus, significantly increased mismatches between δCBF and δCMRO2 during mild hypoxia were clearly observed. The literature on stimulus-induced δCMRO2 is very sparse. Only one study investigated the effect of mild hypoxia on δCMRO2 evoked by a monotonic stimulation task; this study estimated δCMRO2 based on an analytical model, which considers the contributions of both extravascular and intravascular (i.e. arterial and venous) compartments to the BOLD signal, and reported results similar to ours. 14 The authors suggested that the decrease in the task-induced δCMRO2 was likely associated with the combined effects of an increased baseline CMRO2 and the constant demand for the absolute CMRO2 evoked by the same task in the mildly hypoxic environment. 14
Overall, mild hypoxia caused significant alterations in both the amplitude and trend of the CMRO2 response to graded visual stimuli but did not impact the CBF response under the same condition. Thus, our observations did not support the hypothesis that a tightly coupled relationship between CBF and CMRO2 exists during functional tasks and is subject to certain diffusion rules in the brain.61–64 In contrast, our experiment demonstrated that CBF is regulated by factors other than CMRO2 during brain stimulation under low oxygen availability.
The extended model versus the G-B model
The extended model is an extension of the Davis model, which has been the mostly applied method to study the relationship between δCBF and δCMRO2 during neuronal activations. While it is credited for its robustness and simplicity, the Davis model considers only extravascular contributions to the BOLD signal. On the other hand, the G-B model considers contributions from the extravascular and intravascular (i.e. arterial, capillary and venous) compartments to the BOLD signal and incorporates information including vessel size, blood volume exchange effect, and so on. 16 As broad and exquisite as it is, the G-B model relies extensively on prior knowledges and assumptions regarding multiple variables and relationships. In this study, these two models were cross-validated and generated comparable results on the estimated δCMRO2 evoked by visual stimulations at different oxygen availabilities.
For the extended model,
For the G-B model, physiological variations can occur in all variables used for the simulation. In the original G-B model, a thorough analysis has been conducted to examine the effects of physiological variations on the estimated δCMRO2 in normoxia.
16
To avoid redundancy, we selected the four variables (i.e.
Efficacy and limitations
We explicitly implemented a simultaneous acquisition technique, first suggested and validated by Yang et al., 17 to acquire the CBV-, CBF- and BOLD-weighted signals simultaneously as opposed to in separate trials. This time-efficient methodology eliminated intrasubject variations in task performance over multiple trials, thus improving the precision of δCMRO2 interpretation. Although this simultaneous acquisition technique has been widely adopted by multiple studies,9,10,29,70–72 it was limited to single-slice acquisition—the amount of information extracted from the brain images is spatially confined. To overcome this problem, Cheng et al. 73 introduced a 3D triple acquisition pulse sequence that allowed 3D acquisition of the CBF, CBV and BOLD signals, a technique with potential utility in future CMRO2-related studies.
We directly measured δCBV in this study. The measurement of δCBV has frequently been omitted in relevant studies, mainly for two reasons. On one hand, measuring δCBV is time-consuming because without a simultaneous acquisition technique, a separate trial is required. On the other hand, δCBV is believed to have a power-law relationship with δCBF: 
Most of the variables used in the two models were global and group-average values, which may blur intersubject and/or regional variations of the results. For instance, in the extended model, the values of
Finally, this study was limited to dynamic estimation of the fractional changes of CMRO2. The effects of hypoxia on the baseline CMRO2 were unknown. Thus, interpretations of the findings of this study should be limited to the scope of the fractional changes in the flow-metabolism relationship caused by mild hypoxia. To further explore the mechanism underlying the effects of hypoxia on the CMRO2 behaviors, paradigms investigating the effects of hypoxia on the baseline physiologies and/or methods allowing CMRO2 quantification in absolute values 85 should be considered in future studies.
Footnotes
Funding
The author(s) disclosed receipt of the following financial support for the research, authorship, and/or publication of this article: This work was supported by the National Natural Science Foundation of China (81430037, 81790650, 81790651, 81727808, 81601484 and 31421003); National Key Research and Development Program of China (2017YFC0108901); Beijing Municipal Science & Technology Commission (Z171100000117012); Shenzhen Science and Technology Research Funding Program (JCYJ20170412164413575); Shenzhen Peacock Plan (KQTD2015033016104926); and Guangdong Pearl River Talents Plan Innovative and Entrepreneurial Team grant (2016ZT06S220).
Acknowledgements
The authors also thank the National Center for Protein Sciences at Peking University in Beijing, China, for assistance with the MRI data acquisition.
Declaration of conflicting interests
The author(s) declared no potential conflicts of interest with respect to the research, authorship, and/or publication of this article.
Authors’ contributions
JG and HL initiated the study. YZ, YY and JG developed the experimental protocol, conducted the acquisition, analysis and interpretation of the data. YZ drafted the article. All authors revised and gave final approval of the article.