
Abstract
The brain's response to functional activation is characterized by focal increases in cerebral blood flow. It is generally assumed that this hyperemia is a direct response to the energy demands of activation, the so-called flow-metabolism coupling. Here we report experimental evidence that increases in oxygen metabolism can occur after activation without increases in flow. When using multimodality functional MRI (fMRI) to study visual activation in human brain, we observed a postactivation period of about 30 seconds during which oxygen consumption remained elevated, while blood flow and volume had already returned to baseline levels. The finding of such a prolonged and complete dissociation of vascular response and energy metabolism during the poststimulus period indicates that increased metabolic demand needs not per se cause a concomitant increase in blood flow. The results also show that the postactivation undershoot after the positive blood-oxygen-level-dependent hemodynamic response in fMRI should be reinterpreted as a continued elevation of oxygen metabolism, rather than a delayed blood volume compliance.
Brain activation is accompanied by a series of physiologic alterations, including focal changes in cerebral blood flow (CBF), blood volume (CBV), and blood oxygenation (Kuschinsky, 1996; Kwong et al., 1992; Ogawa et al., 1992). These hemodynamic responses form the basis of functional brain mapping techniques (Villringer and Dirnagl, 1995), such as positron emission tomography (Fox and Raichle, 1986) and functional magnetic resonance imaging (fMRI) (Kwong et al., 1992; Ogawa et al., 1992). Fundamental to the understanding of such phenomena is the relationship between neuronal activity and blood flow, i.e., how does the increase in neuronal activity elicit an increase in local CBF? Despite intensive studies over the past several decades, the precise mechanism of this neurovascular coupling still is not clear. Currently, the controversy is focused on two working hypotheses: (1) vasodilatation is consequential to increased energy consumption, mediated through metabolites such as H+, CO2, and adenosine, often referred to as the metabolic pathway. (2) Vasodilatation is caused by an increase in neurotransmitter release, in particular glutamate, which binds neurons and/or glial cells and triggers formation of nitric oxide and other mediators. Of these, the metabolic pathway has been most widely accepted, mainly based on the fact that the changes in metabolic demand and CBF have been found to be well correlated (Fox and Raichle, 1986; Hoge et al., 1999). This acceptance has been in spite of a great mismatch between the magnitude of the increases in oxygen metabolism and flow (Fox and Raichle, 1986; Oja et al., 1999), leading to many theories to explain the flow-metabolism relationship under conditions of oxygen deficit (Buxton et al., 1998; Vafaee and Gjedde, 2000).
Recently, the classic interpretation of a CBF response caused by energy needs has been challenged by the notion that the brain has excess glucose and oxygen delivery compared to demand (Mintun et al., 2001; Powers et al., 1996). In addition, there is evidence indicating that the production of metabolites is not sufficient to account for the CBF increase during activation (Pinard et al., 1984). In view of this, Attwell and Iadecola suggested that such a hemodynamic response is coupled to neurotransmitter signaling rather than energy demand (Attwell and Iadecola, 2002). It is not easy to provide conclusive evidence for either mechanism, because all phenomena are closely correlated and may have partial contributions. However, it is important to realize that the existence of a correlation (sometimes even a linear positive correlation) between parameters and even simultaneous occurrence of their changes does not necessarily prove a causal relationship between them. However, when a significant change in one parameter does not result in any change in another, it clearly rules out the possibility of a causal connection. In this study, we use multimodality fMRI to provide experimental evidence of the absence of a causal correlation between transient increases in cerebral energy demand and CBF.
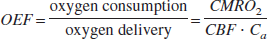
Functional magnetic resonance imaging provides a powerful noninvasive approach to study brain physiology, because multiple MRI protocols (so-called pulse sequences) can be designed to measure different physiologic parameters, including blood oxygenation, blood flow, and volume. Blood-oxygenation-level-dependent (BOLD) fMRI contrast predominantly reflects changes in oxygen extraction fraction (OEF) (Ogawa et al., 1993; van Zijl et al., 1998), a quantity describing the balance between oxygen consumption and delivery (OEF ~CMRO2/CBF). MRI also allows the quantification of CBF using so-called arterial spin labeling approaches (Detre et al., 1992). Although it appears that combined measurements of BOLD and flow using MRI should allow an easy noninvasive measure of the coupling relationship between oxygen metabolism and flow, this dream-scenario is perturbed by the pitfall that BOLD-fMRI signal changes also depend on changes in cerebral blood volume, requiring the additional evaluation of this parameter to properly investigate the extent of the flow-metabolism coupling. The temporal evolution of activation-based changes in blood volume has been studied in animals using long-lived paramagnetic contrast agents (Mandeville et al., 1998), but not in humans, for whom such agents have not yet been approved. Recently a new method to measure CBV changes without the need for a contrast agent (Lu et al., 2003) was developed, for the first time allowing continuous MRI assessment of temporal changes in blood volume during and after activation in humans. This also allows assessment of the blood and tissue fractions during baseline conditions and activation, reducing the number of assumptions in the BOLD theory and allowing the calculation of the cerebral metabolic rate of oxygen (CMRO2) in tissue. We took advantage of the high spatial (3.75 × 3.75 × 5 mm3) and temporal (2 seconds) resolution of fMRI to study the relationship between CBF, CBV, and CMRO2 changes in focal activation regions during and after visual stimulation in humans.
MATERIALS AND METHODS
Magnetic resonance imaging
Experiments were performed on a 1.5-T clinical scanner (Philips Medical System, Best, the Netherlands). The standard setup of body coil transmission and quadrature birdcage head coil reception was used. Functional experiments were performed on a single oblique slice (5-mm thickness) covering the primary visual cortex using VASO (CBV-based) (Lu et al., 2003), BOLD (oxygenation-based) (Ogawa et al., 1992), and arterial spin labeling (CBF-based) (Golay et al., 1999). The acquisition order was pseudorandomized. In the VASO pulse sequence (Lu et al., 2003), an inversion time (TI) of 665 milliseconds was used for optimal blood nulling at repetition time (TR) = 2 seconds; echo time was 10 milliseconds. For BOLD experiments, echo time was 50 milliseconds. Arterial spin labeling was done using the transfer-insensitive labeling technique (TILT) sequence (Golay et al., 1999) with an inversion delay of 1,200 milliseconds to reduce contributions of vascular (arterial, arteriolar, and capillary) water. The labeling slab thickness was 10 cm, and the gap between the labeling and imaging slice was 5 mm. The remaining parameters for VASO, BOLD, and TILT experiments were the same: field of view = 240 × 240 mm2, matrix 64 × 64, flip angle 90°, TR = 2 seconds, number of images acquired: 146.
All subjects (4 men, 4 women, age range 20 to 39) gave informed written consent before participating. The protocol was approved by the Johns Hopkins University internal review board. Functional experiments consisted of visual stimulation (blue—yellow checkerboard, frequency 8 Hz, visual angle 25°) interleaved with fixation on a cross in the center of the dark screen. Stimulation duration was 30 seconds followed by a resting period of 50 seconds to allow complete settling of the hemodynamic response before the next stimulation. Each experiment contained three repetitions of such “on” and “off” blocks, resulting in a total duration of about 5 minutes. Extra resting time (50 seconds) was used at the beginning of each experiment to allow the subject to get used to the scanner noise.
Data processing
Processing was performed on a Sun Enterprise server (Sun Microsystem, Mountain View, CA, U.S.A.) using MATLAB (Mathworks, Natick, MA, U.S.A.). Functional images were realigned, and spatial Gaussian filters of 5 mm full width at half maximum were applied to improve signal-to-noise ratio. Linear baseline corrections were performed to remove baseline drifts. For activation detection, signal time-courses were correlated with a box-car function representing the stimulus paradigm. Because the temporal characteristics of CBV changes are not well established, certain images acquired at the transition between “on” and “off” periods were excluded from the cross-correlation calculation to avoid any assumptions on the rise and decay time of the hemodynamic response. These were 1 time-point after the onset and 10 time-points after stimulus cessation. The cross-correlation coefficient threshold was ± 0.18 (“+” for BOLD and TILT, “–” for VASO). Voxel cluster-size threshold was 3, resulting in statistical significance of P < 0.005. A minimal signal-to-noise ratio of 10 was also required for voxels to be included in the activation map.
The CBV percentage changes were calculated from the VASO signal by assuming a resting state blood volume fraction of 4.7% (Leenders et al., 1990; Lu et al., 2003). Because the arterial spin labeling MR signal is proportional to CBF, the percentage change in arterial spin labeling signal was used as the percentage change in CBF. Hemodynamic response curves were obtained by averaging signals over the selected voxel groups and normalizing this to the baseline signal. Notice that the TILT method is advantageous for measuring CBF hemodynamic time-courses. Most arterial spin labeling techniques use alternation of “labeled” and “unlabeled” scans, the difference of which yields the CBF-weighted images (Detre et al., 1992). This has the drawback that only one difference image is obtained from two scans, resulting in a decrease of temporal resolution (from 2 seconds to 4 seconds for TR of 2 seconds). In TILT, however, an extra slice-selective prepulse is applied to saturate the static signals (Golay et al., 1999). As a consequence, the labeling effects are present in both of the two alternating scans, with the difference being negatively labeled in one and positively in the other. Therefore, subtractions can be performed for each pair of consecutive images, resulting in a series of difference images with a temporal resolution of 2 seconds. However, the exact timing comparison of the TILT curves with the BOLD and VASO curves is not trivial. For BOLD and VASO, signal is based on what is present at the time of excitation, allowing straightforward comparison. In the TILT method (labeling, followed by 1.2 seconds of delay, followed by excitation and 0.8 seconds of recovery time), the flow image reflects the average blood flow during the two labeling periods. Thus, the point of comparison is at 1.6 seconds from the start of the first labeling, or 0.4 seconds after the start of the first excitation.
Quantification of oxygen extraction fraction and cerebral metabolic rate of oxygen
The availability of blood volume fractions in addition to changes in CBV, CBF, and oxygenation allows calculation of OEF and CMRO2 changes with limited assumptions. When dividing the microvasculature into two compartments: an arteriolar one (a, 30%), in which the effective relaxation rate (R2a*) does not change during activation, and a venular one (v, 70%), in which the effective relaxation rate (R2v*) is sensitive to the change in OEF during activation, the BOLD signal in a voxel can be written as:

in which x is the water fraction of the blood in the voxel, R2t* the effective transverse relaxation rate in pure tissue, and TE the echo time. Mi (i= a,v, or t), the magnetization, depends on MRI scan parameters and is defined as:
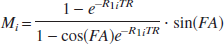
where R1i is the longitudinal relaxation rate (= 1/T1i; At 1.5 T, T1 = 1,000 milliseconds and 1,350 milliseconds for tissue and blood, respectively), and FA and TR are the flip angle and the repetition time of the MR scan, respectively. Upon neuronal activation, the BOLD signal change is:

In above equation, Δx can be obtained from VASO signal changes by (Lu et al., 2003):
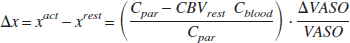
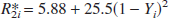
where Cpar = 0.89 and Cblood = 0.87 are the water contents in milliliters water/milliliter substance for parenchyma and blood, respectively. The water fraction, x, can be calculated using literature CBVrest values (Leenders et al., 1990) (0.047 mL blood/mL parenchyma): x = CBVrest · Cblood/Cpar. The R2i* can be uniquely determined from the arterial (Ya) and venous (Yv) blood oxygenation (Silvennoinen et al., 2003):
ΔR2t* can also be calculated using Yv (Yablonskiy and Haacke, 1994):
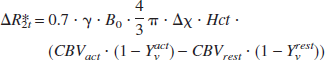
in which Δχ is the susceptibility difference between fully oxygenated and deoxygenated blood (0.31 ppm) (Golay et al., 2001)). Hct is the hematocrit fraction of blood in microvasculature, taken to be 0.36. By assuming Ya = 0.98 and Yvrest = 0.61, Yvact is the only unknown in Eqs. 3 to 6 and can be calculated from the BOLD signal change ΔS/S.
Using the well-known relationship between OEF and Ya, Yv (van Zijl et al., 1998):

we can calculate the dynamics of OEF. The OEF is determined by the balance between oxygen consumption and delivery:
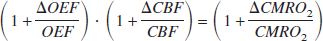
When the arterial oxygen content (Ca) is constant, the CMRO2 changes can be calculated using:
RESULTS AND DISCUSSION
Using multimodality fMRI, we measured the temporal characteristics of blood flow, blood volume, and blood oxygenation in human subjects (n = 8) before, during, and after visual stimulation. Figure 1 shows the time-courses of the hemodynamic responses for these physiologic quantities using a measurement resolution of 2 seconds. All parameters show an increase (positive response) during activation. When selecting all activated image volume elements (voxels) for each of the different fMRI approaches (Fig. 1A), it is found that the responses for oxygenation and flow return to baseline within approximately 8 to 10 seconds after stimulus cessation, whereas the return of the blood volume response takes 5 to 10 seconds longer. The positive BOLD response is followed by a poststimulus undershoot that has been the topic of much debate (Buxton et al., 1998; Mandeville et al., 1999). This oxygenation undershoot and the delayed CBV return have also been observed in rat studies, leading to the proposal that delayed venous/venular compliance may explain this phenomenon (Buxton et al., 1998; Mandeville et al., 1999). However, it can be seen that the BOLD undershoot lasts much longer than the prolonged blood volume increase, as long as 30 seconds after the stimulation is stopped, and thus cannot be explained solely by such a delayed CBV return. This discrepancy becomes even more pronounced when focusing attention on the subset of voxels that show activation in all of the three methodologies (Fig. 1B). To understand this, it is necessary to take into account the spatial origins of the different types of MRI methodologies: BOLD signals reflect oxygenation changes in and around postcapillary, venular, and venous regions (Ogawa et al., 1993; Ugurbil et al., 2000); blood flow changes are derived using so-called arterial spin labeling methods, which contains arteriolar, capillary, tissue, and often some arterial contributions (Detre et al., 1992). The blood volume method is based on changes in vascular space occupancy (VASO) and attributed to tissue regions with microvessels (arterioles, capillaries, venules) of diameter up to 100–200 μm that can adjust in size (Kuschinsky, 1996; Lu et al., 2003). When studying the subset of voxels activated in all three methods, the resulting signals should mainly originate from microvascular areas, which are close to areas of activation. Interestingly, the BOLD effect in this subregion is much larger and the shape reflects the neuronal response measured by Logothetis in a primate model using microelectrodes (Logothetis, 2002). The smaller BOLD signal when including all voxels indicates a spatially heterogeneous response with reduced effect in areas more remote from the microvasculature (i.e., draining veins). This phenomenon may reflect a smaller number of activated neurons per voxel in these downstream regions. The microvascular data in Fig. 1b show a very clear temporal mismatch between the poststimulus BOLD undershoot and the CBF and CBV responses, indicating that this undershoot cannot be caused by vascular dilatation or flow changes. Because no blood volume changes are evident during the poststimulus BOLD undershoot in voxels activated in all three methodologies (Fig. 1B), this negative BOLD effect must be caused by an increase in OEF (Eqs. 3–6). In the absence of flow changes, this undershoot effect can only be interpreted as a continued poststimulus elevation in (Eq. 9).
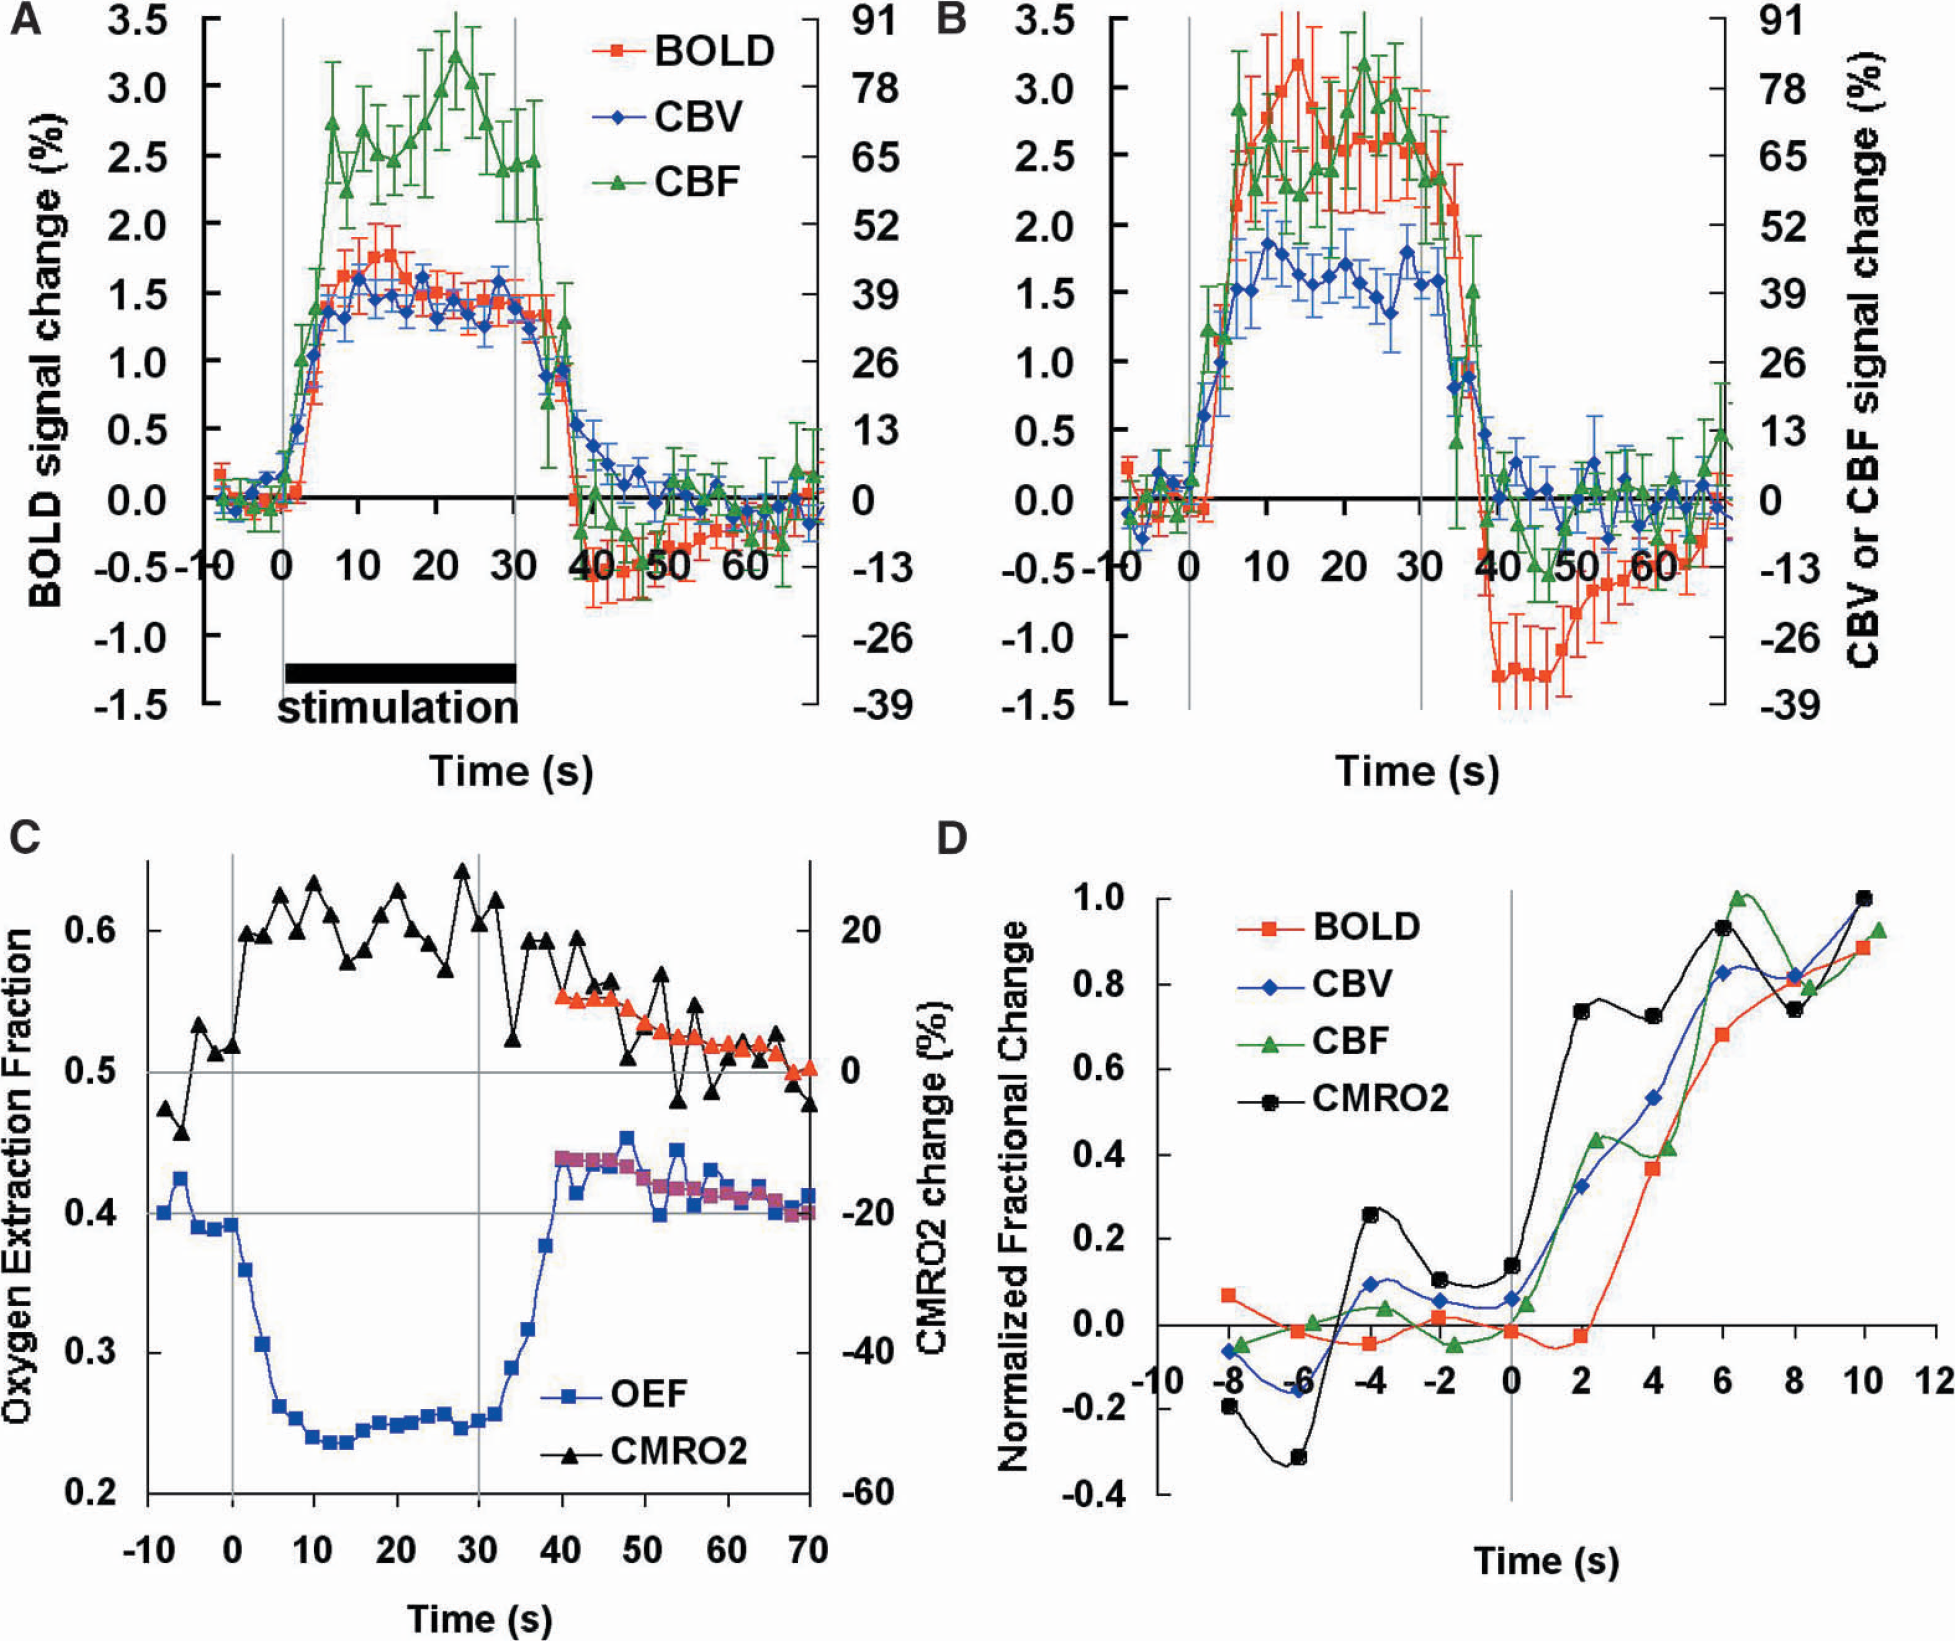
Temporal dependence of physiologic responses caused by visual stimulation (n = 8, error bar = SEM). (
When calculating OEF and the relative changes in CMRO2 with respect to baseline, the results (Fig. 1C) show that CMRO2 is still elevated by more than 10% at a time when CBF and CBV have returned to baseline, and returns to normal levels over a period of about 30 seconds. Such a poststimulus elevation in oxygen metabolism is similar to the so-called “initial dip” (Ernst and Hennig, 1994; Menon et al., 1995) effect at the early onset of activation in that it reflects a CMRO2 increase at a time that CBF is not increased. However, the effect of the initial dip is quickly counteracted by the effect of increasing CBF (within 1 to 2 seconds), and it is unclear whether this hyperemia is caused by the increase in energy use or by other causes. However, the duration of the poststimulus undershoot without concomitant flow increase (~30 seconds) clearly demonstrates a dissociation between microvascular response and brain oxygen consumption. Such a prolonged decoupling has never been reported in the optical and MRI literature, probably because optical studies focused on the initial dip, whereas MRI studies previously did not allow measures of CBV without contrast. When looking in the literature for supporting evidence, we found three recent studies that contain data supporting our finding. The first is an optical imaging study on rodents (Devor et al., 2003) in which total hemoglobin and deoxygenated hemoglobin concentrations were measured during and after brief stimulation of rat somatosensory cortex. Such optical studies, in which deoxygenated hemoglobin and total hemoglobin are used as indicators of oxygen consumption and CBV, respectively, can also be used to study coupling of vascular response and oxygen consumption. The authors focused on the initial effects at onset of activation, where a clear dissociation between increased deoxygenated hemoglobin and constant total hemoglobin was found for the first second after stimulus onset. However, although not discussed in the paper, the dataset also includes several poststimulus images at a time that total hemoglobin has returned to baseline, which show clear increases in deoxygenated hemoglobin, indicating continued oxygen metabolism after vascular normalization. In a second study, single-cell neuronal activity and tissue oxygenation (Thompson et al., 2003) were correlated for cat visual cortex. A brief initial decrease in oxygen tension was followed by a longer increase (presumably because of the vascular response), which, at optimal grating orientations, was again followed by a decrease in oxygenation. In the third study, reporting on changes in oxygen partial pressure and cerebral blood flow (laser Doppler flowmetry) before, during, and after forepaw stimulation in rats, investigators (Ances et al., 2001) found a prominent poststimulus undershoot in oxygen tension while CBF had returned to baseline. The shape of the tissue oxygen pressure curve resembles closely the focal BOLD undershoot in Fig. 1b. The authors attributed this effect to continued oxygen metabolism to compensate for a metabolic debt incurred during the prolonged stimulation. With respect to this, we would like to point out that, interestingly, the time scale of the prolonged elevation in CMRO2 matches well with previous observations in cultured neuronal tissues that a period of 30 to 40 seconds is needed for restoration of ionic gradients (e.g., K+ and Ca2+) after neuronal activity is stopped (Brockhaus et al., 1993; Koch and Barish, 1994), suggesting that the reversal of ions across the membrane is the major component of brain energy use (Attwell and Laughlin, 2001) and the cause of the poststimulus BOLD signal undershoot.
Based on the prolonged and complete dissociation of vascular response and neuronal energy metabolism after activation, we speculate that it is unlikely that the flow response at the onset of activation is directly coupled to energy demands, provided that the CBF regulation mechanisms are similar during and after stimulation. This is in line with theoretical arguments that the brain should have sufficient oxygen reserve for such small transient increases in oxygen metabolism that, contrary to hypoxia, are not expected to significantly alter arterial oxygen pressure (Mintun et al., 2001). Therefore, our data strengthen the plausibility of recent suggestions (Attwell and Iadecola, 2002) that the cerebral blood flow response to activation is predominantly controlled by the neurotransmitter signaling pathway, most likely via the glutamate-mediated Ca2+ influx, rather than by the oxygen metabolism pathway. Previous supporting evidence for this hypothesis comes from approaches in which chemicals are used to disrupt a variety of steps in the neurotransmitter pathway. For instance, when using metabotropic glutamate receptor (mGluR) antagonists and inhibitors of nitric oxide synthase (Li and Iadecola, 1994; Lindauer et al., 1999; Zonta et al., 2003), a significant reduction in arteriolar dilatation during activation was seen. Another direct effect of neuronal activity is the release of K+ from neurons to the extracellular space. A raised K+ extracellular concentration is known to be able to dilate the cerebral resistance vessels (Kuschinsky and Wahl, 1978). However, it has been reported that the return of extracellular K+ concentration after activation takes 30 to 40 seconds (Brockhaus et al., 1993), similar to the prolonged oxygen metabolism. Because this is much longer than the vascular return time, we believe that the K+ is not a major modulator in postactivation CBF control. On the other hand, because of the fast release of K+ as a direct result of the action potentials, its contribution during the onset of activation may be larger. We would also like to point out that our results are for visual stimulation in early visual areas. Because the mechanism of cerebral vascular response has been shown to have regional differences (Gotoh et al., 2001), the coupling dynamics in other brain areas, especially in regions where metabolic rates are significantly lower, may be different.
Finally, despite the limited temporal resolution and signal to noise, it is of interest to look at the CBF, CBV, CMRO2, and BOLD changes at the start of activation. The data in Fig. 1D show that the CBV and CBF responses are preceded by the CMRO2 response but occur before the BOLD response. Interestingly, the BOLD response has not yet reached a maximum at 10 seconds after activation. This is similar to oxygen tension changes measured during somatosensory stimulation (Ances et al., 2001), the time dependence of which showed that the increase in tissue oxygenation after the initial dip was slower than the flow increase.
In conclusion, we have presented experimental evidence that transient increases in cerebral oxygen metabolism for as long as 30 seconds occur after stimulus without the need for a flow response. This implies that increases in energy demand need not result in increases in blood flow. The prolonged poststimulus increases in oxygen metabolism cause the BOLD undershoot, the duration of which corresponds to that needed to restore synaptic ion gradients.
Footnotes
Acknowledgments
Dr. van Zijl is a paid lecturer for Philips Medical Systems. This arrangement has been approved by Johns Hopkins University in accordance with its conflict-of-interest policies.