
Abstract
The perfusion contribution to the total functional magnetic resonance imaging (fMRI) signal was investigated using a rat model with mild hypercapnia at 9.4 T, and human subjects with visual stimulation at 4 T. It was found that the total fMRI signal change could be approximated as a linear superposition of ‘true’ blood oxygenation level-dependent (BOLD; T2/T2*) effect and the blood flow-related (T1) effect. The latter effect was significantly enhanced by using short repetition time and large radiofrequency pulse flip angle and became comparable to the ‘true’ BOLD signal in response to a mild hypercapnia in the rat brain, resulting in an improved contrast-to-noise ratio (CNR). Bipolar diffusion gradients suppressed the intravascular signals but had no significant effect on the flow-related signal. Similar results of enhanced fMRI signal were observed in the human study. The overall results suggest that the observed flow-related signal enhancement is likely originated from perfusion, and this enhancement can improve CNR and the spatial specificity for mapping brain activity and physiology changes. The nature of mixed BOLD and perfusion-related contributions in the total fMRI signal also has implication on BOLD quantification, in particular, the BOLD calibration model commonly used to estimate the change of cerebral metabolic rate of oxygen.
Introduction
The underlying mechanism and quantification of the blood oxygenation level-dependent (BOLD) signal are of great interest, yet still under intense research. The magnitude of BOLD signal measured by functional magnetic resonance imaging (fMRI) is the result of complex interplay among three physiology changes of cerebral blood flow (CBF), cerebral blood volume, and cerebral metabolic rate of oxygen consumption (CMRO2) (Bandettini et al, 1992; Kwong et al, 1992; Ogawa et al, 1992, 1998). From the standpoint of the magnetic resonance physics, BOLD associated with the susceptibility change will affect the transverse relaxation time (T2) or apparent T2 T2(T2*), thus, resulting in a signal change in the T2/T2*-weighted MRI. In contrast, the CBF change and inflow effect associated with the stimulus-induced blood circulation change will affect the apparent longitudinal relaxation time (T1) of the brain tissue water, in particular, when the blood water exchanges rapidly with the brain tissue water through capillaries. The T1 change can result in an MRI signal variation under the MRI acquisition condition with short repetition time (TR) and a relatively large radiofrequency (RF) pulse flip angle, because of so-called magnetization saturation effect. Under this circumstance (an acquisition condition for most fMRI studies), the total fMRI signal change elevated by brain stimulation or physiology change depends not only on T2/T2*-sensitive BOLD effect but also on T1-sensitive flow-related effect. The relative contributions between them depend on many factors, such as magnetic field strength, types of MRI pulse sequence, MRI acquisition parameters, vessel architectures and orientation inside the magnet, and blood velocity (Cohen et al, 2004; Duong et al, 2003; Frahm et al, 1994; Gao et al, 1996; Kim et al, 1994a; Lu et al, 2002; Ogawa et al, 1992). Nevertheless, it is still not fully understood whether the flow-related component could significantly contribute to the total fMRI signal change, and if it could, how much contribution is from microvascular blood circulation or perfusion change?
The primary goals of this study were (1) to quantitatively investigate the relative contributions of ‘true’ BOLD effect and flow-related effect to the total fMRI signal increase detected by gradient-echo echo planar imaging in the rat brain cortex induced by mild hypercapnia (6% CO2) at 9.4 T; (2) to identify the major source of the flow-related signal contribution to the total fMRI signal change induced by hypercapnia; and (3) to further test the flow-related contribution to fMRI signal change with varied TRs in the human primary visual cortex during visual stimulation at 4 T.
Theory
Gradient-echo echo planar imaging (GE-EPI) is one of the most popular MRI sequences used to perform fMRI studies due to its rapid imaging acquisition and high BOLD contrast-to-noise ratio (CNR). The theory described herein focuses on the GE-EPI pulse sequence; nevertheless, it can be extended to other types of MRI sequences (e.g., spin-echo EPI). The GE-EPI signal intensity, S(GE), can be described as:
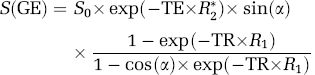
where R2(=1/T2*) is the apparent transverse relaxation rate that is sensitive to the susceptibility effect and BOLD; R1(= 1/T1) is the apparent longitudinal relaxation rate that is sensitive to flow-related signal changes; α is the flip angle of excitation readout RF pulse; TE is the echo time; S0 is the GE-EPI signal intensity when TE = 0, α = 90° and under fully relaxed condition (TR ≥ 5T1). It is known that the cerebral blood circulation changes during brain stimulation or under the hypercapnia condition could induce not only the true BOLD effect but also an increase in R1 due to rapid magnetization exchange between blood and tissue water spins (Kim, 1995; Kruger et al, 1999; Kwong et al, 1992, 1995; Schwarzbauer et al, 1996). The shortened T1 (or accelerated R1) process in the brain tissue water associated with the blood flow increase leads to a reduction in the saturation effect on the measured MRI signal under the MRI acquisition condition with relatively short TR and large α, subsequently resulting in an extra increase in GE-EPI signal intensity that is superimposed onto the total fMRI signal. When TR>4 to 5 T1 and TE> 0, the term of exp(–TR × R1) approaches to zero and equation (1) can be rewritten as:

under this condition, S(GE) becomes independent on R1 and it is solely determined by R2* and its change mainly reflects a ‘true’ BOLD effect.
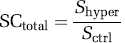
In the following section, we discussed the quantity of GE-EPI signal change induced by hypercapnia, though the same relationship can be applied to other situations, e.g., brain activation. The total GE-EPI signal change (SCtotal) can be quantified by the GE-EPI signals acquired under control (normocapnia, Sctrl) and hypercapnia (Shyper) condition according to equations (3) to (5):
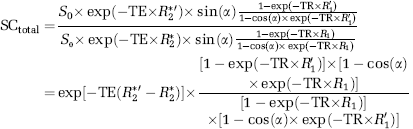

where R2*ʹ and R1*ʹ are the apparent transverse relaxation rate and the apparent longitudinal relaxation rate, respectively, measured under the hypercapnia condition. The first term in equation (4) only depends on the R2* change, thus, reflects the relative ‘true’ BOLD contribution (i.e., the term of SCBOLD in equation (5)) to the total GE-EPI signal change. In contrast, the second term in equation (4) relies on R1 and its change, thus, reflects the flow-related contributions from inflow effect and perfusion change (i.e., the term of SCflow in equation (5)). Under the fully relaxed condition (SCflow ≈ 1), the total GE-EPI signal change measured between normocapnia and hypercapnia conditions relies only on BOLD effect and it equals to the ‘true’ BOLD signal change (i.e., SCBOLD in equation (5)).
However, for the TR regime of 5T1, the total GE-EPI signal change becomes sensitive to both BOLD-related (R2*) and flow-related (R1) effects. The relative contributions between these two physiology effects depend on GE-EPI acquisition parameters, in particular, TR and α. equation (5) can be further approximated by equation (6) when the percent signal changes caused by BOLD effect (ΔSBOLD) and flow-related effect (ΔSflow) during hypercapnia are in a small range of few percents and the cross-term of ΔSBOLD × ΔSflow becomes negligible:
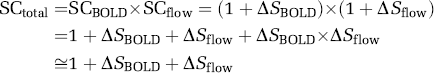
Equation (6) suggests that the total GE-EPI signal change during hypercapnia can be simply considered as the linear addition of the percentage signal changes contributed from BOLD and flow-related effects. Nevertheless, the flow-related R1 change could be attributed to two sources: one is perfusion change that is desired for fMRI mapping and another one is undesired inflow effect from large vessels (e.g., arteries).
It is of great importance to examine if the major flow-related contribution to the total GE-EPI signal change induced by physiology perturbation is from perfusion or large vessels. One effective way to address this question is to apply diffusion-weighting bipolar gradients incorporated into the GE-EPI imaging sequence, thus, to suppress the inflow effect in the large vessels with higher blood velocity but with negligible effects on the perfusion at the capillary level (Boxerman et al, 1995; Le Bihan et al, 1986; Song et al, 1996).
Several studies have shown that the diffusion-weighted fMRI with an adequate diffusion gradient strength has the characteristic of selectively attenuating the intravascular fMRI signal from moving water spins in both arterial and venous sides, thus more closely reflecting the BOLD responses in capillary beds. As a result, it has been suggested that diffusion-weighted images help to improve the spatial and temporal accuracy for mapping neuronal activation (Harshbarger and Song, 2004; Song and Gangstead, 2004). The degree of the attenuation (A) on the measured GE-EPI signal can be quantified by
where D is the diffusion coefficient constant and b is the diffusion-weighting factor that incorporates the amplitude and timing parameters of the diffusion gradients according to
where γ is the gyromagnetic ratio; G and δt are the magnitude and duration of diffusion gradient; T is the time delay between the bipolar diffusion gradients.
Since a large b factor tends to significantly suppress the MRI signal contribution from large vessels with fast blood flow velocity (Harshbarger and Song, 2004; Kennan et al, 1994), the measured fMRI signal becomes more dominant by smaller arterioles, capillaries, and brain tissue. Moreover, it has been shown that the fMRI signal acquired at high magnetic field with high b factors (> 1,000 s/mm2) and a relative long TE had negligible contributions from large vessels, and thus extravascular (or tissue) component becomes a dominant contribution.
In the present study, a large b factor up to 1,019 s/mm2 was applied to measure diffusion-weighted GE-EPI data under normocapnia and hypercapnia conditions at 9.4 T. The fMRI results with zero and higher b factors were compared for testing major source of flow-related signal contribution to the total GE-EPI signal change measured in the absence of diffusion-weighting gradients.
Materials and methods
Animal Preparation and Magnetic Resonance Imaging Measurements
The male Sprague-Dawley rats were anesthetized and intubated using 5% (v/v) isoflurane in an N2O:O2 (60/40) gas mixture. Both femoral arteries and the left femoral vein were catheterized for physiological monitoring and blood sampling. After the surgical operation, the rat was placed in a home-built cradle incorporating ear bars and a bite bar to reduce head movement and ensure proper positioning inside an animal MRI scanner. The animal anesthesia was maintained at 2% isoflurane. Rectal temperature was maintained at 37.0 ± 0.5°C by a circulating water heating blanket. The inspired and expired gases and blood pressure were monitored constantly. The rate and volume of ventilation were adjusted to maintain normal physiology condition determined by blood gas data.
The MRI measurements were performed under control (normocapnia) condition and stable hypercapnia condition, which was induced by switching to an inhalation bag with mixed gases (6% CO2, 34% O2, 58% N2O, and 2% isoflurane) for 20 to 30 minutes.
Animal MRI experiments were conducted on a 9.4-T horizontal animal magnet (Magnex Scientific, Abingdon, UK) interfaced to a Varian INOVA console (Varian, Palo Alto, CA, USA). A butterfly-shape surface coil (long axis of 2.8 cm and short axis of 2.0 cm that is parallel to the animal spine) was used to collect all MRI data. Scout images were acquired using a turbo fast low angle shot (TurboFLASH) imaging sequence with the acquisition parameters: TR = 10 ms, TE = 4 ms, image slice thickness = 1 mm, field of view (FOV) = 3.2 cm × 3.2 cm; image matrix size = 128 × 128. The single-shot GE-EPI pulse sequence was applied for collecting fMRI data using the acquisition parameters of FOV = 3.2 cm × 3.2 cm; matrix size = 64 × 64; three continuous, coronal image slices with 1 mm slice thickness; TE: 22 to 24 ms; 30 ms for acquiring each EPI slice and no extra delay between sequential, multiple-slice EPI acquisitions; and six variable TRs (1.1, 2.1, 3.1, 5.1, 8.1, and 12.1 seconds) arranged in a randomized manner. A number of GE-EPI with varied RF pulse power was scanned under fully relaxed condition. These image data were used for two purposes: to optimize the GE-EPI signal-to-noise ratio in the region of interest (ROI) and to quantify the spatial profile of RF pulse flip angle, α, used in equations (1) to (4). The GE-EPI sequence was further incorporated into the global saturation-recovery pulse segment using a nonslice-selective half-passage adiabatic RF pulse followed by spoiling gradients for imaging apparent T1 with nine saturation-recovery times (TSR: 0.008, 0.1, 0.2, 0.3, 0.4, 0.5, 1.4, 3, and 10 seconds). One of the advantages of saturation-recovery T1 measurement method is that there is no waiting time needed among sequential imaging acquisitions with varied recovery times because the initial magnetization is always forced to approach zero after the saturation preparation. This merit can lead to relatively high temporal resolution, for instance, ∼16 seconds in this study for obtaining one T1 image volume.
Bipolar diffusion gradients in three dimensions were also inserted between the GE-EPI excitation pulse and data acquisition, i.e., within the gradient TE period. Three b factors (0, 518, and 1,019 s/mm2) were achieved by adjusting the diffusion gradient strength up to 45 gauss/cm. Duration of diffusion gradient, δt, was 2.5 ms and the time delay between the bipolar diffusion gradients, T, was 3.6 ms.
All animal experiments were conducted under the protocol approved by the University of Minnesota Institutional Animal Care and Use Committee.
Human Visual Stimulation and Magnetic Resonance Imaging Measurements
Six healthy human subjects (three males and three females, 23 to 49 years old) were recruited in this study and one subject participated twice on different days. The fMRI experiments were performed on a 4-T/90-cm bore human magnet (Siemens, Erlangen, Germany) system with the Varian INOVA console (Varian) using a single-loop RF surface coil (10 cm diameter) located near the occipital lobe. The subjects laid supine in the magnet and the head motion was limited with a foam-padded head holder. During the fMRI activation task periods, an 8-Hz, full-field reversal checkerboard visual stimulation was displayed on a mirror housed a comfortable distance above subject's eyes. Scout images were acquired using the T1-weighted TurboFLASH imaging sequence (TR = 10 ms, TE = 3.8 ms, slice thickness = 5 mm, image matrix size = 128 × 128, FOV = 20 cm× 20 cm). Based on the anatomic images, five continuous, coronal slices covering most of the calcarine fissure of the human primary visual cortex (V1) were selected to acquire fMRI data using the GE-EPI sequence (TE = 30 ms; FOV = 20 cm × 20 cm; image matrix = 64 × 64; 5 mm thickness; 100 ms for acquiring each EPI slice and no extra delay between sequential, multiple-slice EPI acquisitions) with varied TRs. The block-paradigm fMRI studies consisted of four control periods and three task periods were performed in an interleaved way. Fifteen GE-EPI volumes were performed in each period for TR = 1.1 or 2.1 seconds fMRI experiments, while 10 GE-EPI volumes each period for TR = 4.1 or 9.1 seconds fMRI experiments, resulting in a total acquisition time of 2, 4, 5, and 10 minutes for TR = 1.1, 2.1, 4.1, and 9.1 seconds experiments, respectively. Gradient-echo echo planar imaging combined with the saturation-recovery preparation was used for imaging apparent T1 with nine varied saturation-recovery times of 0.02, 0.1, 0.2, 0.3, 0.4, 0.5, 1.4, 3, and 10 seconds under both resting and stimulation conditions. Each T1 image measurement took 1.6 minutes. In addition, a number of GE-EPI with varied RF pulse powers were also scanned under fully relaxed condition to determine the flip angle, α, in the primary visual cortex.
All human experiments were conducted under the protocol approved by the University of Minnesota Institutional Review Board.
Data Processing, Magnetic Resonance Imaging Signal Simulation, and Statistics
All the MRI data analysis was performed using the STIMULATE software package (Stimulate, Center for Magnetic Resonance Research, University of Minnesota, USA; Strupp, 1996) and the Matlab software package (The Mathworks, Natick, MA, USA). For the animal experiments, 14 rats (body weight: 345 ± 73 g) having normal physiology condition and showing positive BOLD change during hypercapnia were analyzed and summarized. Nonlinear least-square fitting program using the Matlab software was applied to perform the T1 regression analysis, and small delays between multiple fMRI slices acquisitions were accounted for determining the saturation-recovery times. Regression accuracy was estimated using the sum squared error and the square of regression coefficient (R2).
For the human studies, the fMRI activation maps were generated using the period cross-correlation method with the boxcar reference function and a cross-correlation coefficient of ≥ 0.4 (Bandettini et al, 1993). The brain ROI covering the activated pixels in the visual cortex based on the fMRI maps measured with shortest TR (= 1 second) was used to perform the R1 regression, comparison of GE-MRI signal percent increases among the fMRI data with varied TRs and to determine the excitation flip angle α in the primary visual cortex.
Flow-related signal change (i.e., SCflow in equation (5)) in the rat brain as a function of TR ranged from 0 to 13 seconds, flip angle α ranged from 40° to 160°, and R1′ increasing from 0.485 to 0.52/s (based on the experimental data of rat brain tissue at 9.4 T; Barber et al, 2005; Kim and Kim, 2005, 2006; Tsekos et al, 1998) was simulated according to the second term of equation (4) without taking the susceptibility (R2*) contribution into account. Saturation-recovery T1 (R1) data taken from an ROI located in the rat sensory cortical region excluding large surface vessels and sinus vein were used to perform the R1 regression analysis. The intersubject averaged T1 (R1) value under normocapnia conditions, T1′ (R1′) value under hypercapnia conditions, and α value in the identical ROI used for calculating R1 and R1′ were applied to simulate and predict total GE-EPI signal change as a function of TR according to equation (4) assuming SCBOLD = 1.
The GE-EPI signal intensities measured with varied TR under normocapnia and hypercapnia conditions were averaged from multiple GE-EPI pixels within the ROI for each animal, and the outcomes were used to calculate the total GE-EPI signal change induced by hypercapnia as a function of TR according to equation (3). The average flip angle of α within the ROI was numerically determined from a number of GE-EPIs with a serial of RF power acquired under fully relaxed condition. Finally, the simulated TR dependence of flow-related signal contribution was regressed using the least square error fitting method to the experimental results of the total fMRI BOLD change for comparison.
The CNR for determining the total GE-EPI signal change induced by hypercapnia is defined as:
where Shyper and Sctrl are the signal intensity at a given TR under hypercapnia and normocapnia, respectively; σ0 is the mean of standard deviation of background noise of control images and is TR independent. The CNR per unit measurement time (CNR*) is described as:
where n is the number of repeated image acquisitions with a desired TR within a fixed period of measurement time. Both CNR and CNR* as a function of TR were calculated based on experimental GE-EPI data or simulated using known variables. To consider practical fMRI applications for mapping brain physiology changes, σ0 in equation (9) was replaced by the brain image signal fluctuation (σ0–SF) that was measured under the normocapnia condition at a given TR with the same total acquisition time (1 minute); and the calculated CNR was denoted as CNR**.
Multiple ANOVA (analysis of variance) statistical analysis was performed to compare the total fMRI signal changes with varied TRs within ROI under different b factors. Oneway ANOVA method was used to compare the R1 and R1′ values under different b factors. R1 and R1′ values obtained under a given b factor were compared using the paired t-test. The results are presented as mean ± standard deviation or standard error, and a P value of < is considered to be statistically significant.
Results
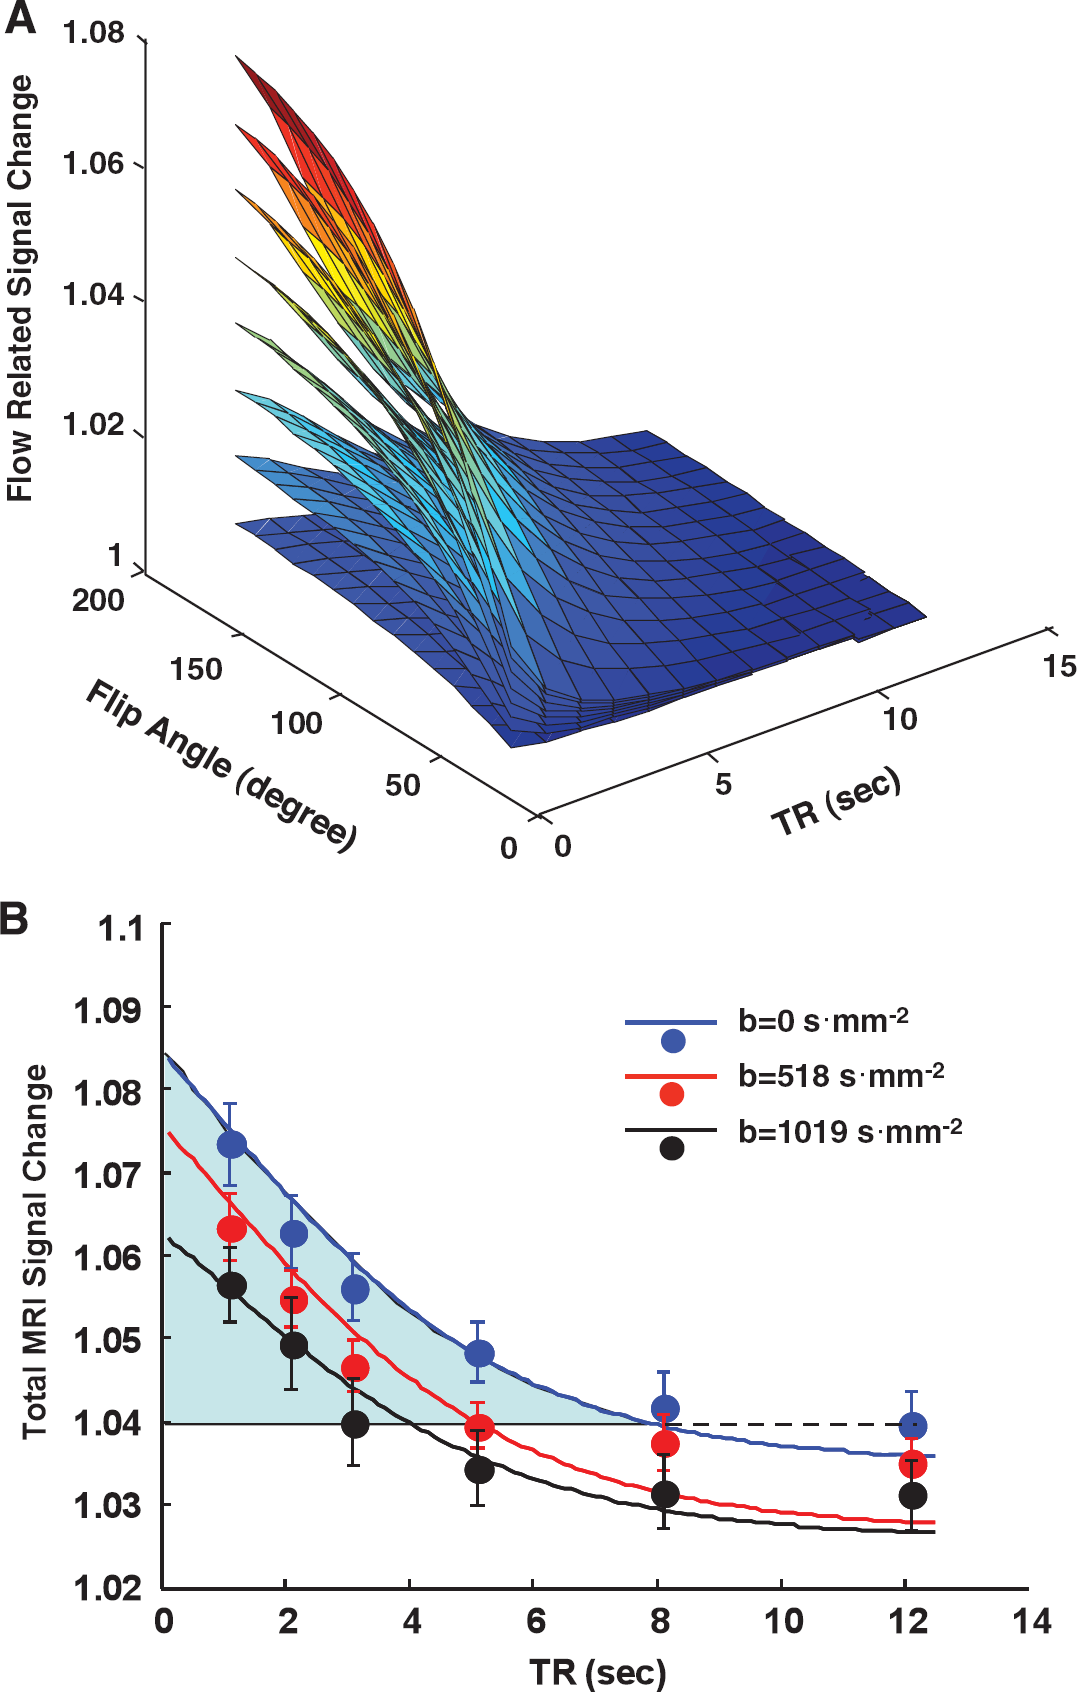
Figure 1A displays the simulation results of flow-related signal increase (i.e., SCflow in equation) and its dependence on TR, flip angle and R1 change caused by hypercapnia based on the rat brain hypercapnia data measured at 9.4 T. In general, shortening TR or increasing flip angle α and R1′ results in a larger percent signal change owing to the consequential reduction of saturation effect after a flow increase during hypercapnia. Figure 1B shows the comparison results between the predicted total GE-EPI signal changes based on the simulation using the measured parameters (R1, R1′, flip angle, ‘true’ BOLD percentage change, i.e., SCBOLD in equation (5)) and the experimentally measured total GE-EPI signal increase (i.e., attributing to both BOLD and flow-related components) induced by hypercapnia as a function of TR under three different diffusion-weighting conditions. This figure was generated in two steps. First, the total fMRI signal changes were calculated according to equation (3) using the directly measured GE-EPI data under varied diffusion weighting as a function of TR (i.e., full cycles in Figure 1B). Second, the flow-related signal change as a function of TR was simulated and predicted by using the experimentally measured values of average α (= 103 ± 18°), R1 and R1′ (see Table 1) according equation (4) under each diffusion-weighting condition; then this predicted signal change was superposed on the ‘true’ BOLD signal that was measured with a long TR of 12.1 seconds (> 5T1), resulting in the predicted plots under varied diffusion-weighting conditions as a function of TR (i.e., solid lines in Figure 1B). There is a good agreement between the experimental results and predicted results under three diffusion-weighting conditions. These comparison results support the rationale that the total GE-EPI signal change induced by hypercapnia could be well described as a linear combination of the ‘true’ BOLD signal and the flow-related signal as described by equation (6).
(
The highlighted blue area drawn in Figure 1B illustrates one example of the flow-related signal increase above the ‘true’ BOLD signal measured under nearly fully relaxed condition in the absence of diffusion-weighting gradients (i.e., b = 0). The relative signal contribution from the flow-related component increased substantially when shortening TR, and it became comparable to the ‘true’ BOLD at TR ≈ 1 second.
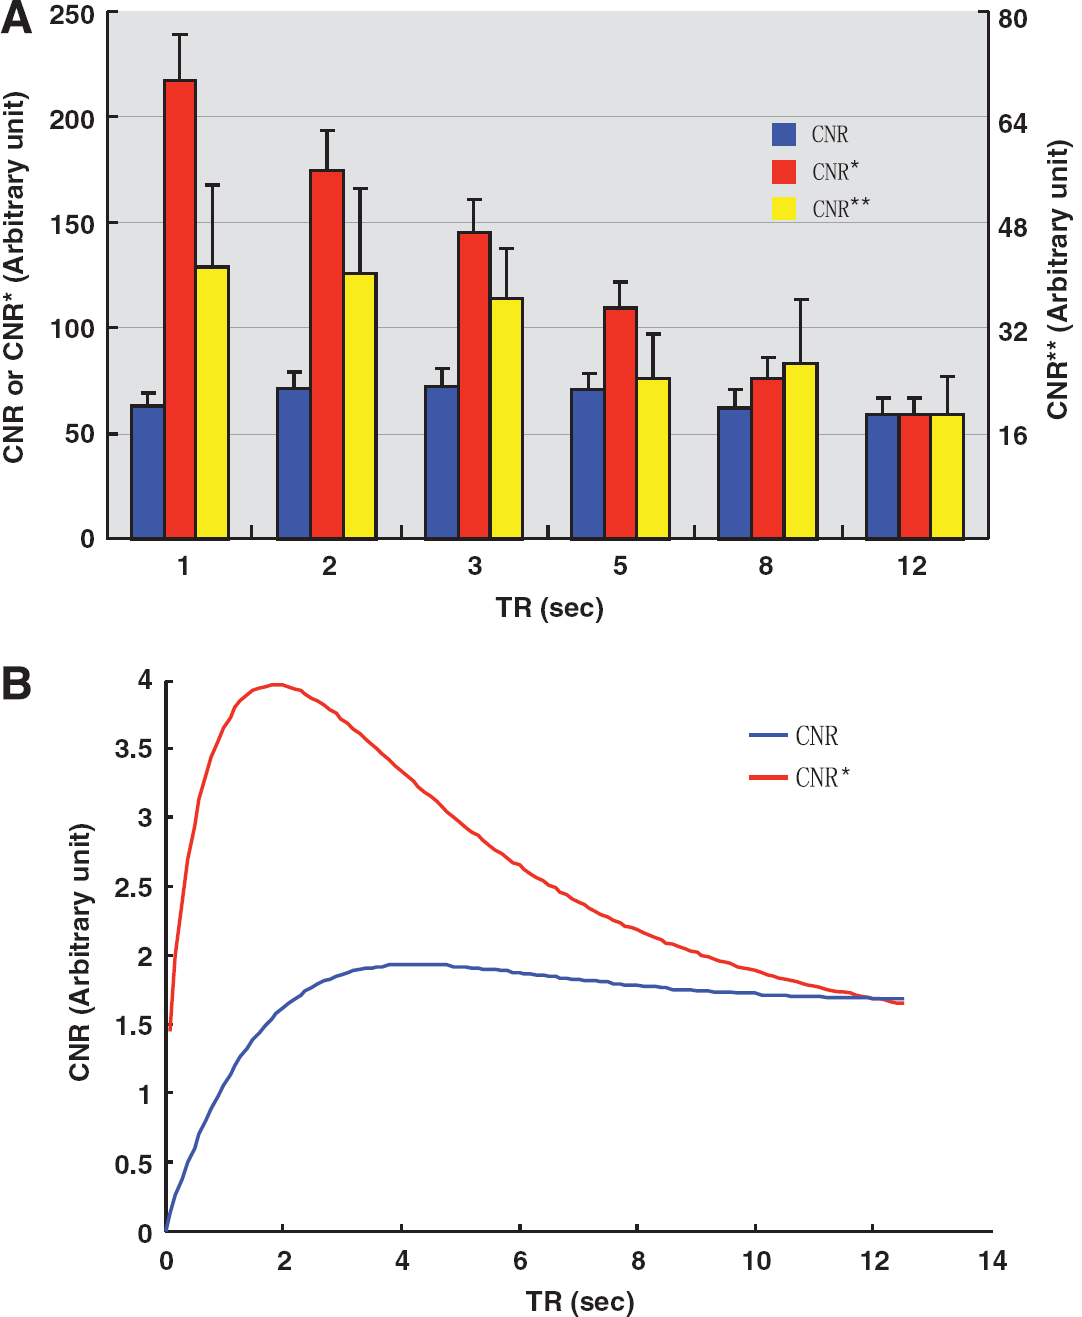
Summary of apparent longitudinal relaxation rate obtained during control (R1) and hypercapnia (R1′) states in the rat brain with different diffusion-weighting b factors (s/mm2) (mean ± s.d.)
ANOVA, analysis of variance.
One-way ANOVA for comparing R1 under different diffusion-weighting b factors, P = 0.80.
One-way ANOVA for comparing R1′ under different diffusion-weighting b factors, P = 0.29.
Paired t-test for comparing R1 and R′1 under a given diffusion-weighting b factor, P <0.001.
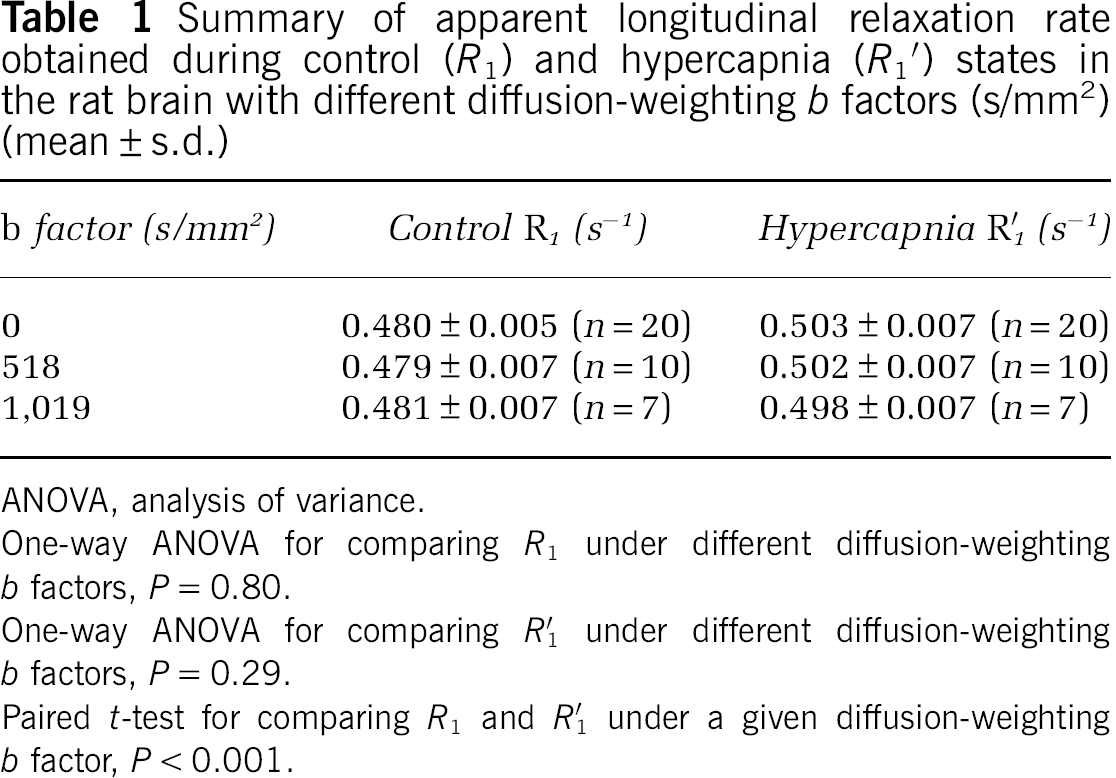
Due to the application of diffusion gradients, the total GE-EPI signal changes at a given TR were statistically different among three b factors (P ≤ 0.04 based on multiple ANOVA statistical analysis). Specifically, when the b factor increased, the total GE-EPI signal change reduced approximately in a parallel manner for different TRs. This trend is also evident in Figure 2A, which shows a coronal anatomical brain image and its corresponding percent change maps of total GE-EPI signal increase during hypercapnia with varied diffusion gradient strengths and TRs from a representative rat. The measured total GE-EPI signal increase became smaller when the diffusion gradient strength was large at a given TR or when TR was longer at a fixed diffusion gradient strength. For example, the BOLD signal measured at TR = 12 seconds in the rat brain was higher in the absence of diffusion gradient than that with the application of bipolar diffusion gradients (see Figures 1B and 2A). Nevertheless, no matter whether the diffusion gradient was applied, the total GE-EPI signal change increased more with TR = 1 second than that with TR = 5 and 12 seconds. Figure 2B shows the discrepant trend of the total GE-EPI signal change as a function of TR at different depth of cortical ROI from the cortical surface. It indicates that the total GE-EPI signal change in the deep cortical region is more sensitive to TR than that of superficial cortical region mixed with large vessels. This result suggests a different extent of susceptible behavior of fMRI signal as a function of TR between superficial large vessels and capillaries in the brain tissue.
(
Table 1 summarizes the mean and standard deviation results of the apparent longitudinal relaxation rates measured during normocapnia (R1) and hypercapnia (R1′) using three different diffusion-weighting b factors. It shows R1 significantly increased (P <0.001) during hypercapnia in the presence or absence of diffusion gradients; however, no statistical difference was found among the three conditions with varied diffusion-weighting factors either for normocapnia (R1, P = 0.80) or for hypercapnia (R1′, P = 0.29) condition. These results indicate that the macrovascular flow contribution to the measured R1 is negligible for the rat brain at 9.4 T.
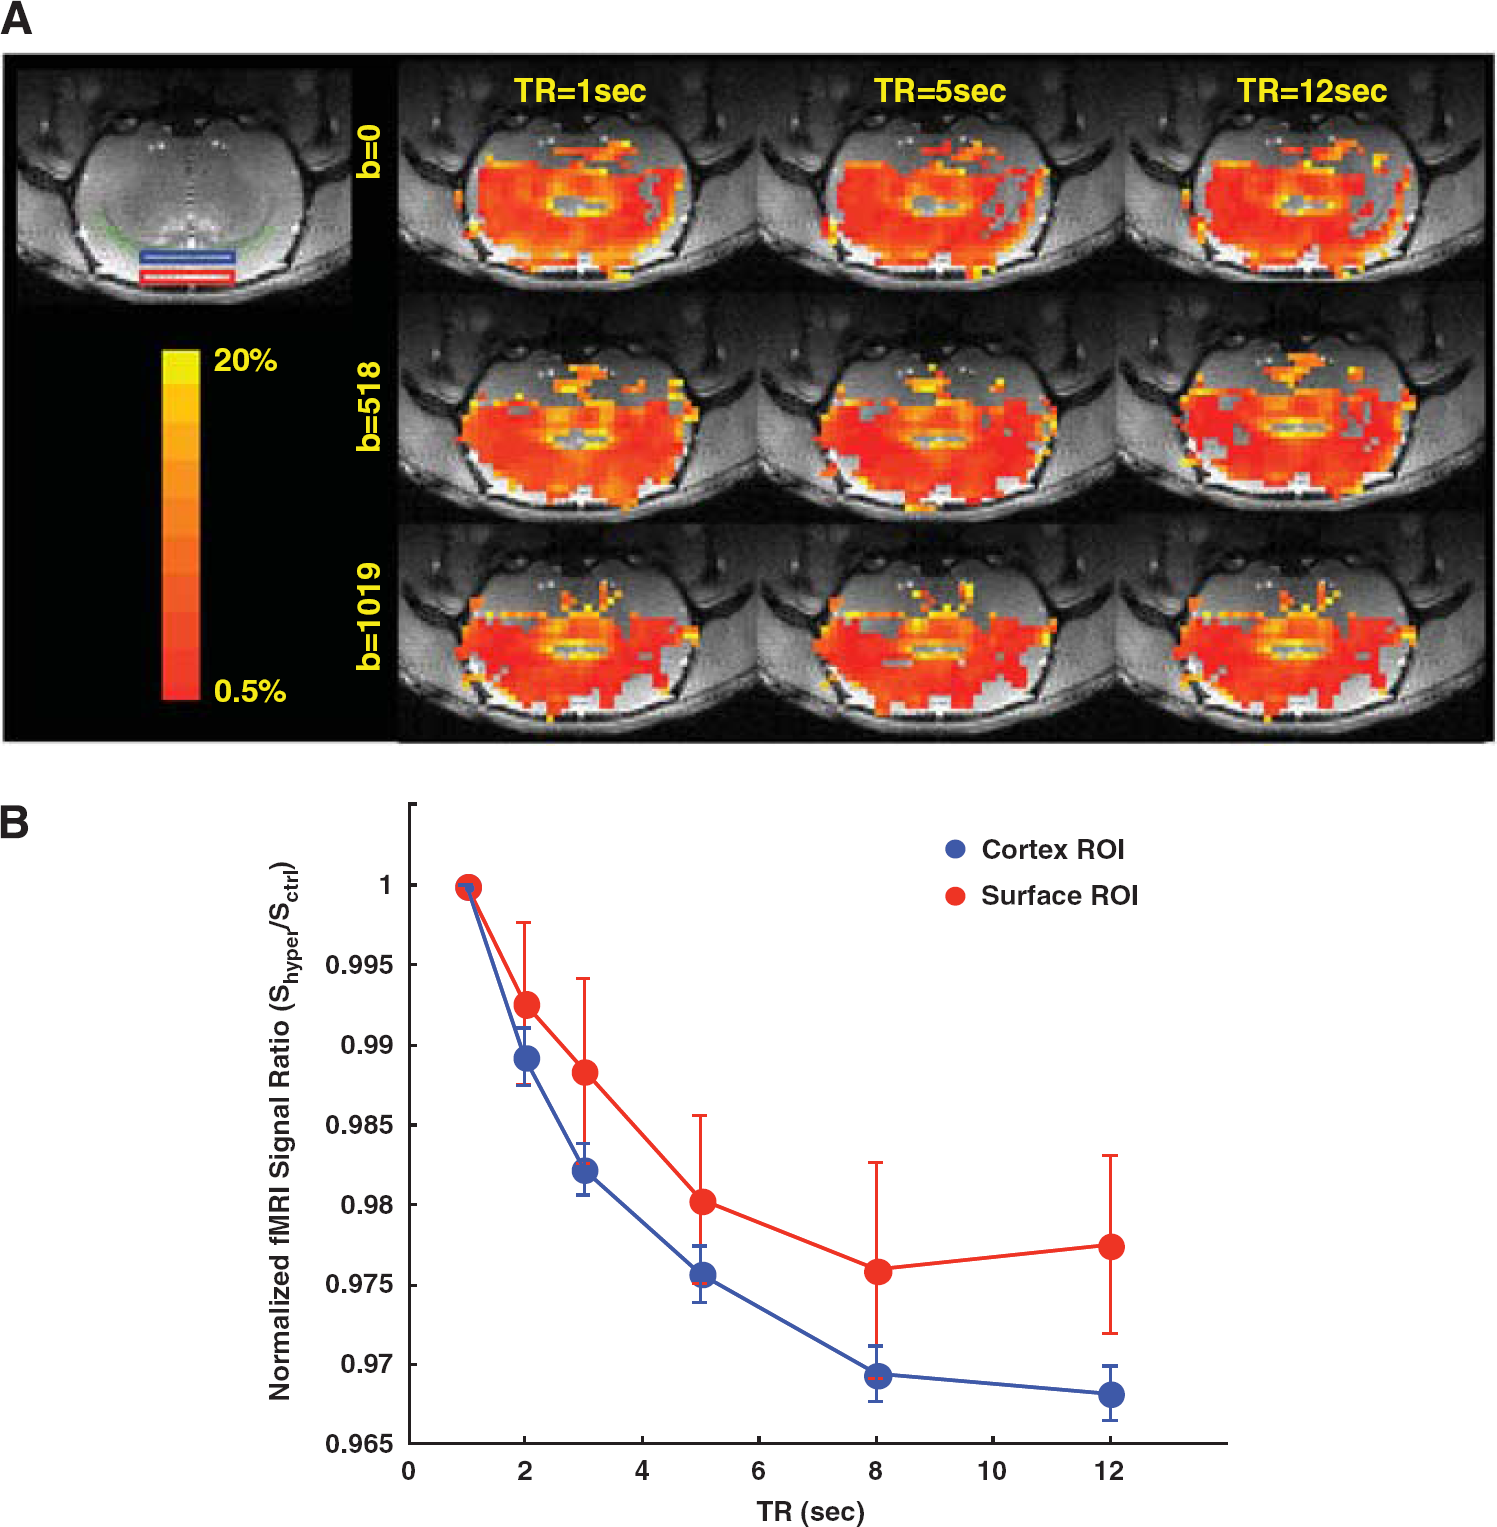
Figure 3A shows the averaged CNR, CNR*, and CNR** results based on the GE-EPI measurements under the hypercapnia condition with different TRs. If one assumes that image noise was theoretically independent of TR (Lu et al, 2002), highest CNR appeared at moderate TR (∼3 seconds, see the blue bars in Figure 3A). However, shorter TRs had a significant advantage for gaining a higher CNR acquired per unit time (i.e., CNR*, see the red bars in Figure 3A) through signal averaging, even though the gain could be slightly compromised by the physiological fMRI signal fluctuation (i.e., CNR**, see the yellow bars in Figure 3A). For example, CNR* at TR = 1 second was 3.7 times higher than that at TR = 12 seconds, in contrast, CNR** was 2.2 times. This observation is not surprising since CNR* was determined by the thermal noise (σ0), while CNR** was determined by the sum of thermal and physiological noises (σ0–SF). Nevertheless, both CNR* and CNR** show similar dependence on TR.
(
Figure 3B shows the simulation results of CNR and CNR* as a function of TR, suggesting a similar trend as the experiment results as displayed in Figure 3A. These figures indicate that the optimal CNR* peak appears around TR = 1 second. When TR is shortened than 1 second, CNR* could further benefit from more signal averaging and enhanced flow-related signal increase; however, the CNR* gain is unable to compensate the substantial loss of GE-EPI signal due to severe saturation effect by a very short TR.
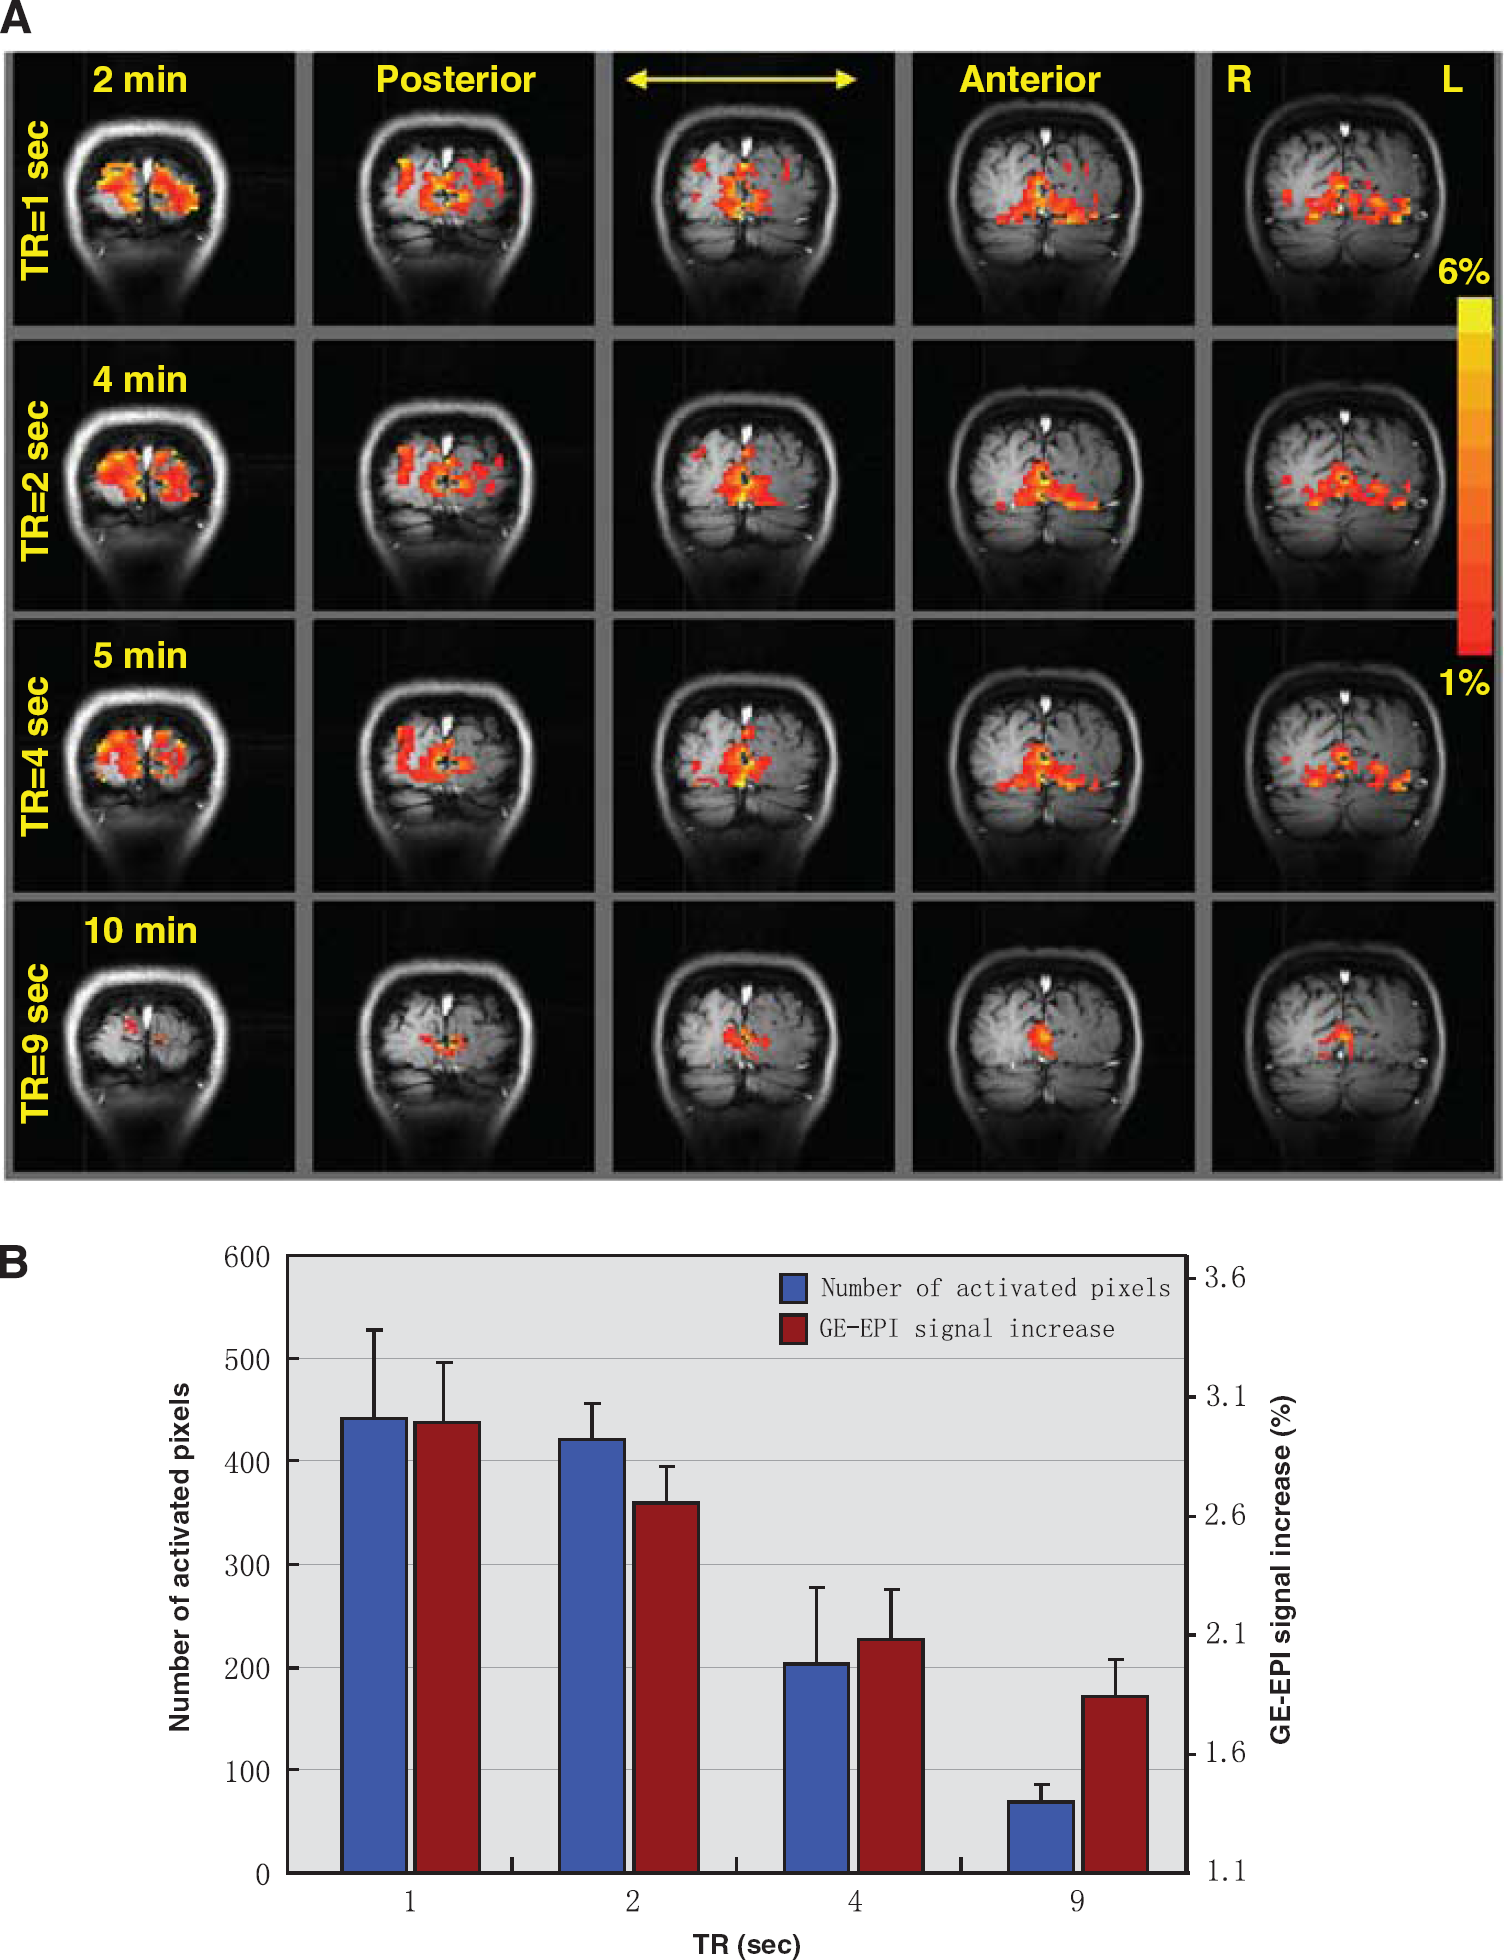
Figure 4A presents the five coronal fMRI activation maps of the human visual cortex in response to visual stimulation obtained with four TRs from a representative subject, showing a significant GE-EPI signal increase in the activated brain regions. It also indicates that both the number of activated pixels with the same statistical threshold and the percent change of total fMRI signal elevated by visual stimulation inside the ROI declined as TR increased. Figure 4B summarizes the average results showing the changes in total number of activated pixels and the percentage of GE-EPI signal increases at varied TRs and their standard error among the seven studies. The mean of total signal increase was 3.0%, 2.7%, 2.1%, and 1.8% for TR = 1, 2, 4, and 9 seconds, respectively. The averaged flip angle for the activated pixels based on the fMRI maps acquired with TR = 1 second was 85 ± 3°. The averaged R1 (or T1) under control condition in those pixels was 0.625 ± 0.007/s (1.6 seconds), this value is consistent with previous reports (Kim et al, 1994b; Rooney et al, 2007). It changed to 0.629 ± 0.007/s (1.58 seconds) under the visual stimulation condition due to the elevated perfusion.
(
Discussion and Conclusion
Enhancement of Flow-Related Contributions to Functional Magnetic Resonance Imaging Signal Using Short Repetition Time
The attenuated magnetization saturation effect is the main underlying mechanism for explaining the significantly enhanced flow-related contribution on the total GE-EPI signal increase as observed during hypercapnia/stimulation. Since the apparent longitudinal relaxation rate increased from ∼0.48/s at control to 0.50/s (see Table 1) in the rat cortex during hypercapnia, the longitudinal magnetization relaxed more rapidly (i.e., less saturated) during hypercapnia than normocapnia condition, resulting in an increase in the detected GE-EPI signal during hypercapnia when the GE-EPI was acquired under nonfully relaxed condition. Such a signal recovery can become substantial when a much short TR is applied. Consequently, the ratio of the GE-EPI signals between hypercapnia (or stimulation) and normocapnia (or control) conditions increases when TR shortens. This ratio change is attributed to the flow-related effect on R1, since the ‘true’ BOLD is independent of TR. This flow-related effect can become surprisingly significant. For instance, the total GE-EPI signal (percentage) increases measured with TR = 1 second (7.4%, 6.6%, and 5.8% under b factor 0, 518, and 1,019 s/mm2, respectively) are approximately twice larger than that with a long TR of 12 seconds (4%, 3.6%, and 2.8% under b factor 0, 518, and 1,019 s/mm2, respectively). The differences in the GE-EPI signal percentage increases measured between short TR (= 1 second) and long TR (= 12 seconds) reflect the contribution from the enhanced flow-related component, which is superimposed onto the ‘true’ BOLD signal measured at TR = 12 seconds. When TR was 1 second, the flow-related signal increase accounted for 46%, 45%, and 52% of the total GE-EPI signal increase in response to hypercapnia under three diffusion-weighting b factors of 0, 518, and 1,019 s/mm2, respectively.
A similar result was observed in the human fMRI study using visual stimulation. Not only more activation pixels passed the statistic threshold when a short TR was used, but also higher magnitudes of fMRI signal change were observed (Figure 4). For instance, the total GE-EPI signal increase (3%) at TR = 1 second is almost twice as large as that with TR = 9 seconds (1.8%). This indicates a substantial flow-related contribution in fMRI signal with a short TR (5T1), which is a common case for the majority of human fMRI applications. This TR-dependent flow-related effect could not only influence the total fMRI signals investigated in the present study but also possibly complicate other types of functional MRI measurements, for instance, using the Vascular-Space-Occupancy technique for imaging cerebral blood volume change during brain activation (Donahue et al, 2009). A longer TR is preferred to accurately interpreting Vascular-Space-Occupancy contrast because the blood null times at different brain states are closer than that with short TRs.
Flow-Related Contributions from Macrovascular and Microvascular Compartments
Close examination of R1 and total GE-EPI signal changes induced by hypercapnia with various diffusion-weighting gradient strengths provides further evidence for supporting the notion that the flow-related contribution to the total GE-EPI signal increase is likely dominated by microvascular components including capillaries and possibly some small arterioles and venules. This is evident from several lines as discussed in the following.
The magnitude of total GE-EPI signal change consistently decreases with the increased b factor. This result is in agreement with other fMRI reports from rat sensory stimulation study (Goelman et al, 2008), cat visual stimulation study (Yacoub et al, 2008) to human visual stimulation study (Duong et al, 2003; Harshbarger and Song, 2008; Michelich et al, 2006; Song et al, 1996). This observation is not surprising because it is known that the bipolar diffusion gradients tend to suppress the macrovascular fMRI signal contributions from both arteries and veins. It is interesting to note that although the intravascular water signal from veins becomes considerably small at 9.4 T due to its short T2* (≈ 9 ms, Lee et al, 1999) and a relatively long TE (= 23 ms) applied to acquire the GE-EPI data in the present study, its contribution to the total GE-EPI signal change is not completely negligible at 9.4 T. This is evident from the observation showing consistent, though small, suppression of ‘true’ BOLD effect measured with a long TR (> 5T1) in the presence of strong diffusion-weighting gradients as illustrated in Figures 1B and 2A.
In contrast to the ‘true’ BOLD dependence on the diffusion gradient strength, the flow-related signal behaves differently. The general relationship between the flow-related GE-EPI signal change and TR does not change significantly by the use of diffusion-weighting gradients, even with a large b factor of 1,019 s/mm2 (see Figures 1B and 2). In another word, the reduction of saturation effect due to the acceleration of apparent R1 relaxation rate during hypercapnia is hardly being suppressed by the diffusion gradients at short TR, suggesting that the flow-related contribution is likely from microvascular compartment or capillary origin.
This notion is also supported by the results of R1 measurements as summarized in Table 1. The R1 values measured under both normocapnia and hypercapnia conditions were found to be independent of b factor (one-way ANOVA P = 0.80 at normocapnia and P = 0.29 at hypercapnia). This result suggests that the inflow effect from macrovascular compartment may not significantly influence the R1 values and its change in the rat cortical regions in response to hypercapnia; otherwise, the apparent R1 values should be expected to decline as the diffusion-weighting increases for suppressing flowing water signals.
The stronger dependence of TR for the total GE-EPI signal increase in the deep cortical region than that of the superficial cortical region in response to hypercapnia shown in Figure 2B also indicates that the flow-related enhancement dominantly originated from microvascular components. The absolute R1 value of deep cortical region was significantly larger (P <0.01) than that of surface cortical region under both normocapnia (0.475 ± 0.002/s versus 0.457 ± 0.002/s, n = 14) and hypercapnia (0.498 ± 0.002/s versus 0.477 ± 0.003/s, n = 14) conditions since the latter region made up of more large vessel blood water spins than the former region. Interestingly, the R1 difference (ΔR1) between the normocapnia and hypercapnia in the deep cortical region was also larger than that in the surface cortical region (0.023 ± 0.002/s versus 0.021 ± 0.002/s, n = 14). This small but statistically significant ΔR1 (P = 0.02) between these two brain regions was consistent with the simulation results in Figure 1A, which shows that the larger ΔR1 should lead to a larger GE-EPI signal increase. In fact, the difference in the trend of the normalized fMRI signal ratio (Shyper/Sctlr) as a function of TR between the deep cortical region and the surface region shown in Figure 2B could become larger if the fMRI signals in these two regions were acquired with the same flip angle, since the large flip angle in the surface area tends to ‘magnify’ fMRI signal change.
The human baseline CBF value and its increase during visual stimulation can be estimated using a previously proposed method (Wang et al, 2009; Wang and Chen, 2010) and the ΔR1 value measured in the present study. Specifically, the absolute CBF increase (ΔCBF) was calculated according to

where λ is the tissue blood partition coefficient for water (= 0.9 mL/g), C is a unit conversion factor (= 60 s/min), and ΔR1 = 0.004/s for the human visual stimulation study. This CBF increase was corresponding to a percentage CBF increase of 40% to 50% as reported in the literature, thus, resulting in a baseline CBF value of 0.43 to 0.54 mL/g per minute that is coincident with the majority of results reported in the literature (Kim et al, 2007; Raichle et al, 1983; Zhu et al, 1998). This comparison suggests a close relationship between R1 and CBF.
The overall results support that the flow-related signal enhancement on the total fMRI signal is likely originated from the extravascular compartment and the perfusion change occurring at the capillary level, although the inflow effect from small arterioles near capillaries cannot be completely excluded.
Impact and Complication
The findings from this study have several impacts. Majority of fMRI applications are conducted with a relatively short TR for improving temporal resolution and gaining signal-to-noise ratio and CNR through signal averaging. In the present study, we show that the shortening TR could significantly enhance the flow-related signal contribution to the total fMRI signal and increase CNR, thus, improving the fMRI sensitivity for mapping brain physiology and neuronal activity changes.
Moreover, fMRI signal acquired with short TRs could significantly improve the specificity for functional mapping of neuronal activity change because the flow-related signal enhancement is likely originated from capillary perfusion and small arteriole inflow effect (at least at high field), reflecting microvascular blood flow processing that is closer to the neuronal activation site than the draining veins. Therefore, fMRI should benefit substantially from the improvements in both CNR*/CNR** and functional mapping specificity due to the enhanced signal from microvascular contribution simply by using an optimal and short TR in combination with a relatively large RF pulse flip angle. One potential and interesting application is to detect the fMRI signal change dominated by the perfusion-related contribution by using ultra-short TE image methods with negligible BOLD (or T2/T2*) contribution in combination with extremely short TR. This combination could provide perfusion-based fMRI maps without the use of artery spin labeling preparation.
This study reveals that the fMRI BOLD signal commonly detected with a relatively short TR does not only reflect the pure BOLD effect, but rather is composed of the ‘true’ BOLD (R2*) and flow-related (R1) components. This nature complicates BOLD quantification, in particular, to the BOLD calibration modeling commonly used to determine the relative change of the cerebral metabolic rate of oxygen consumption in response to brain stimulation based on the hypercapnia calibration (Davis et al, 1998). If the total fMRI signal change contains significant contribution from flow-related signal or perfusion contribution that is usually not considered in the calibration, then it will lead to an over-estimation of ‘true’ BOLD signal, ultimately, an underestimation of percent change of cerebral metabolic rate for oxygen consumption, although this error could be partially compensated by using the identical fMRI acquisition parameters for acquiring both hypercapnia calibration and functional activation data.
Several aspects of potential limitation need to be taken into account. First, the flow-related fMRI signal contribution measured in the brain might have dependence on the orientation of fMRI slices relative to the blood flow direction, for instance, the coronal fMRI slice in the rat brain is perpendicular to the blood flow direction in the large or medium sized vessels while it becomes parallel in the human brain. However, the flow-related fMRI signal enhancement observed in the present study was likely dominated by the microvascular component or perfusion in the capillaries, which could be approximately considered as random distribution in space; therefore, it should not be sensitive to the orientation between blood flow direction and fMRI slices.
One possible confounding factor in determining the apparent T1 (or R1) values using the saturation-recovery approach is related to the arterial transit time, i.e., the traveling time of the blood water from the boundary between the saturated and nonsaturated regions to the fMRI slices. The MRI signal recovery after the saturation preparation may not simply follow the identical exponential recovery function when the saturation-recovery time is shorter than the arterial transit time, in which the exchange between the fresh flowing water and the tissue water in the fMRI slice has not occur, compared with a saturation-recovery time longer than the arterial transit time. The arterial transit time is expected to be much shorter, especially for the rat brain, than the range of saturation-recovery times applied in the R1 measurements. The RF surface coils were applied in this study and their RF saturation profiles were mainly limited to the brain, thus further shortened the effective artery transit time. When the saturation-recovery time is longer than the arterial transit time, the image signal follows an exponential recovery of R1. In contrast, the signal recovery function becomes more complicated when the saturation-recovery time is shorter than the arterial transit time. Nevertheless, the R1 regression based on a single exponential recovery function still provides a good approximation for the rat study owing to the short arterial transit time, prolonged and similar values of apparent brain tissue T1 (= 1/R1) and intrinsic artery blood T1 at high magnetic field. These facts reduced the R1 measurement errors caused by the confounding factor. This is evident by the small sum squared errors of R1 regression and excellent linearity showing in the semilog plots of the magnetization recovery signal versus saturation-recovery time (data not shown herein).
Another potential confounding factor in quantifying the relative flow-related contribution in the total fMRI signal is related to multiple-slice fMRI acquisition. The slice-selective excitation RF pulse for obtaining multiple-slice EPIs could disturb the water spin magnetization within the EPI slice and cause a postacquisition effect on the sequentially acquired EPI slices, in particular, when the delay time between the adjacent EPI slice acquisitions is long. To reduce this confounding factor, we applied a short single-slice EPI acquisition time (30 ms for the rat study and 100 ms for the human study) to minimize the total acquisition time for collecting the entire multiple-slice EPI volume.
In summary, our study shows that the flow-related contribution originated from extravascular component and perfusion can be used to significantly enhance fMRI signal and CNR, and to improve the spatial specificity for mapping activation sites by using optimal TR and RF pulse flip angle. The nature of mixed BOLD and flow-related contributions to the total fMRI signal has a crucial implication on BOLD quantification and cerebral metabolic rate for oxygen consumption calculation. Finally, it should be feasible to separate and quantify the ‘true’ BOLD and perfusion-related signals based on two fMRI measurements: one with a short TR and another under the full relaxation condition.
Footnotes
The authors declare no conflict of interest.