
Abstract
A new functional magnetic resonance imaging (fMRI) technique is proposed based on nulling the extravascular gray matter (GM) signal, using a spatially nonselective inversion pulse. The remaining MR signal provides cerebral blood volume (CBV) information from brain activation. A theoretical framework is provided to characterize the sources of GM-nulled (GMN) fMRI signal, effects of partial voluming of cerebrospinal fluid (CSF) and white matter, and behaviors of GMN fMRI signal during brain activation. Visual stimulation paradigm was used to explore the GMN fMRI signal behavior in the human brain at 3T. It is shown that the GMN fMRI signal increases by 7.2% ± 1.5%, which is two to three times more than that obtained with vascular space occupancy (VASO)-dependent fMRI (−3.2% ± 0.2%) or blood oxygenation level-dependent (BOLD) fMRI (2.9% ± 0.7%), using a TR of 3,000 ms and a resolution of 2 × 2 × 5 mm3. Under these conditions the fMRI signal-to-noise ratio (SNRfMRI) for BOLD, GMN, and VASO images was 4.97 ± 0.76, 4.56 ± 0.86, and 2.43 ± 1.06, respectively. Our study shows that both signal intensity and activation volume in GMN fMRI depend on spatial resolution because of partial voluming from CSF. It is shown that GMN fMRI is a convenient tool to assess CBV changes associated with brain activation.
Introduction
Functional magnetic resonance imaging (fMRI) techniques offer noninvasive means for brain mapping by probing hemodynamic and/or oxygenation changes associated with neuronal activation. Various fMRI techniques have been developed to probe the physiologic changes associated with brain activation, such as, signals governed by blood oxygenation level-dependent (BOLD) response, cerebral blood flow (CBF), and cerebral blood volume (CBV). The most commonly used fMRI technique relies on the BOLD effect (Ogawa et al, 1990, 1992, 1993; Kwong et al, 1992). Blood oxygenation level-dependent fMRI is a robust technique with a good contrast-to-noise ratio (CNR). The BOLD effect depends on a number of physiologic parameters, including oxygen extraction from blood, CBF, and CBV (Ogawa et al, 1993; Boxerman et al, 1995; van Zijl et al, 1998; Buxton et al, 1998). Detection of BOLD fMRI signal changes at, and in the vicinity of, capillary site is thought to provide good spatial localization for neuronal activation, but it is difficult to obtain because of dominant contributions from macrovascular signal (Lai et al, 1993). Although perfusion-based fMRI using arterial spin labeling is capable of revealing CBF changes in microvasculature, the commonly used arterial spin labeling techniques have low signal-to-noise ratio (SNR) and subtraction requirement of labeled and control scans (Wong et al, 1997; Petersen et al, 2006).
An fMRI technique was proposed based on suppression of blood magnetization signal by means of inversion recovery (IR) approach (Lu et al, 2003). This so-called vascular space occupancy (VASO)-dependent fMRI method detects MR extravascular tissue signal change because of expansion of microvascular compartment during brain activation (Lu et al, 2003; Donahue et al, 2006b). The thrust of VASO fMRI is to reveal MR signal decrease in the extravascular gray matter (GM) as a consequence of increase in microvascular CBV on brain activation. Thus, a negative signal change is seen by VASO fMRI to brain activation. This fMRI technique can therefore be considered as an indirect way to measure CBV changes in the brain.
In this paper, we present a new fMRI technique that can directly measure the CBV change by nulling the extravascular GM tissue signal and monitoring the blood signal with an IR sequence. The GM magnetization signal is suppressed using a spatially nonselective inversion pulse with an inversion time (TI) matched to null GM tissue signal according to its T1, in a similar manner as used in the VASO technique. The measured signal change to brain activation is positive, because CBV increase caused by increased CBF is directly detected by measuring blood signal. In this study, we have investigated the characteristics of the GM-nulled (GMN) fMRI signal both theoretically and experimentally and showed the applicability of GMN fMRI technique for functional brain studies.
Materials and methods
Theory
Gray-matter-nulled fMRI is based on the suppression of extravascular GM tissue signal using an IR approach. Figure 1 shows the longitudinal magnetization signal recovery curves for white matter (WM), GM, blood, and cerebrospinal fluid (CSF) after application of an inversion pulse with a TI selected to null GM magnetization. The curves were plotted based on typical T1 of GM (1,122 ms), WM (758 ms), CSF (3,817 ms), and blood (1,627 ms) at 3T (Lu et al, 2004a, 2005a; Donahue et al, 2006a). When a TI value is chosen so as to null GM based on its T1, that is,

the GM magnetization signal becomes zero. Thus the remaining MR signal is only from compartments of blood, CSF, and WM. As T1 of the blood is longer and the T1 of WM is shorter than that of GM, the residual signals are negative and positive in sign, respectively, for each of these components. A large negative signal is left from CSF, because T1 of CSF is much longer than that of blood. The measured MR signal in GMN experiments therefore depends on the relative contributions from each of the remaining compartments, which in turn reflects the proportions of these species within each voxel and their individual relaxations.
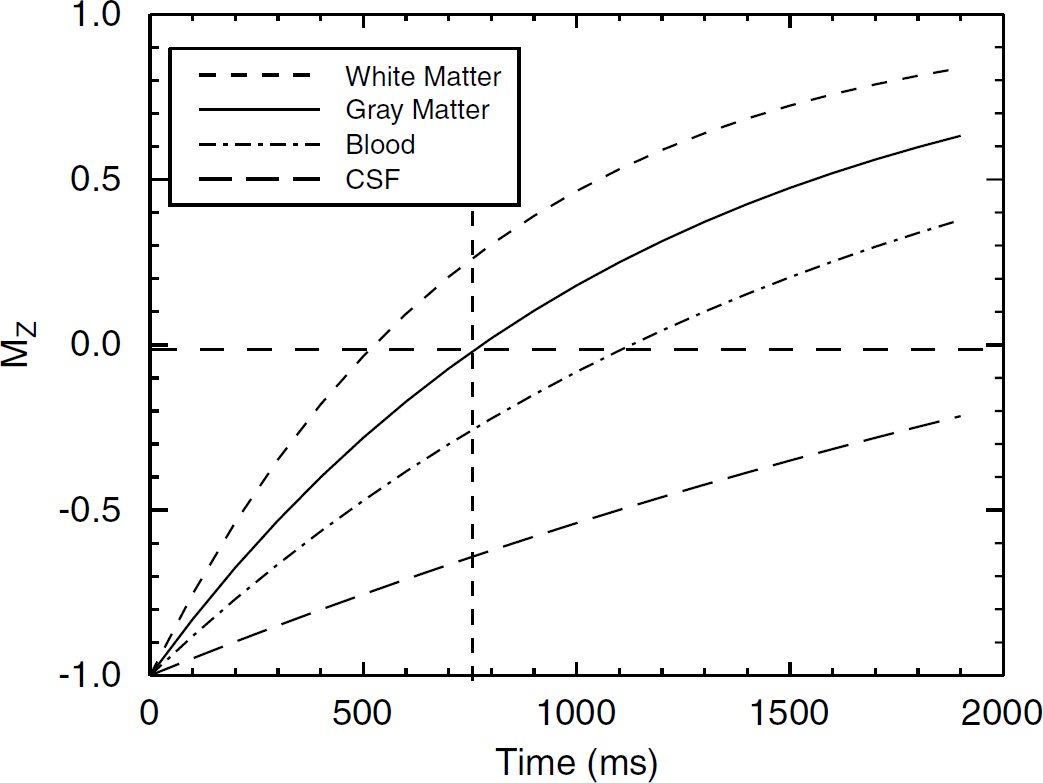
Longitudinal magnetization recovery curves for WM, GM, blood, and CSF after applying a spatially nonselective IR pulse with an assumption of infinite TR.
Using a three-compartment tissue model (Donahue et al, 2006b), in which an MRI voxel comprises of GM, WM, and CSF with each represented by a fraction X, the MR signal can be represented by

where XGM + XWM + XCSF = 1. Parenchymal GM and WM compartments will both contain microvascular blood and extravascular tissue. Considering parameters related to CBV, water proton densities, and MR relaxation rates, MR signals from GM and WM parenchyma can be expressed individually by
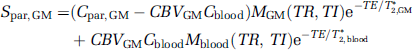
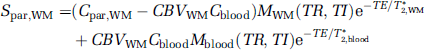
where T*2 is the effective transverse relaxation time, Mx(TR, TI) is the longitudinal magnetization of component x after applying a spatially nonselective inversion pulse, C is the water proton density and CBV is the fraction of blood volume relative to the parenchymal volume in units of mL blood/mL parenchyma. Additionally, the MR signal from CSF can be described by

When the extravascular GM tissue signal is eliminated, MGM(TR, TI) becomes zero and Equation (2) is simplified to:

Assuming that there is no signal change from CSF during brain activation because of the lack of perfusion effects in CSF, the normalized functional signal change can be expressed by
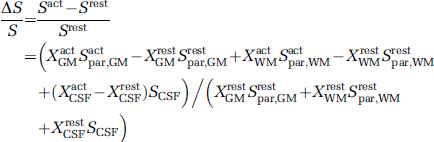
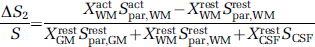
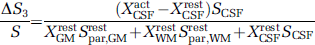
where XrestGM + XrestWM + XrestCSF = 1 and XactGM + XactWM + XactCSF = 1 to account for the differences of tissue compartmental fraction between resting and activation state. Equation (6) shows that the GMN fMRI signal gains contributions from three cerebral components, namely, from the GM parenchyma (S1), the WM parenchyma (S2), and the CSF fraction (S3). Signal changes in these components can be individually expressed by
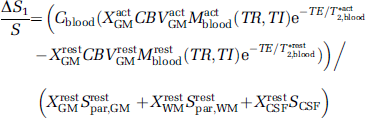
Equation (7) shows that the change from GM parenchyma is associated with the change in CBV but it is affected by the changes in blood magnetization and blood T*2 shown by the numerator of this equation. This change is further weighted by the CSF and WM signals as shown by the denominator of Equation (7). Under GMN conditions, the CSF signal is negative, as is the blood signal. This negative signal, shown in the denominator of Equation (7), adds to the negative signal from the blood and consequently gives rise to an underestimation of the acquired CBV change. In contrast to the CSF, the WM signal in a GMN scan is positive, which is opposite to the sign of the blood signal, thus the presence of WM in the denominator of Equation (7) leads to an overestimation of the acquired CBV change.
The signal from WM parenchyma as shown by Equation (3) includes contributions from extravascular WM and intravascular blood. Under GMN condition, the WM and blood signals are positive and negative, respectively, and their net magnetization amplitudes at GM nulling point (Figure 1) are almost the same. Thus, the signal from WM parenchyma in a GMN fMRI is small because of these combined effects. Consequently, the effect for the signal change from WM parenchyma (Equation (8)) remains small also during brain activation.
Equation (9) defines effects associated with the adaptation of the CSF fraction volume to brain activation. The fraction of blood in an MR voxel will increase during brain activation leading to an adaptive decrease in the fraction of CSF. Consequently, a negative signal change in GMN fMRI is expected (Equation (9)). In contrast, the signal change because of the increase in CBV (Equation (7)) is positive in sign. Thus the expected decrease in the CSF fraction during brain activation will reduce the measured CBV change in GMN fMR images.
On activation, T*2 of capillary and venous blood increases, inevitably causing an increase in T*2-weighted signal, which could lead to overestimation of CBV change by GMN fMRI technique as shown by the numerator of Equation (7). As CBF increases on stimulation, the blood magnetization signal also changes during activation, which makes the measured signal change (Equation (7)), not a pure CBV change but rather an apparent CBV change. As the microvasculature consists of approximately 21% arteriolar, 33% capillary, and 46% venular blood (Sharan et al, 1989; van Zijl et al, 1998), the magnetization for each microvascular compartment has to be determined individually. Considering the CBF effect, the magnetizations in these vascular compartments can be expressed individually by (see Appendix, Equations A11, A15, and A18)
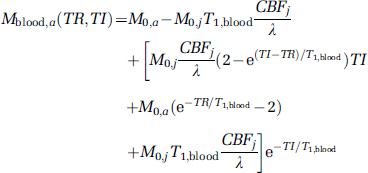
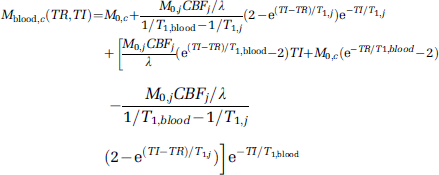
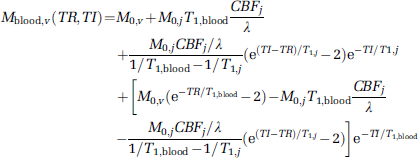
where a, c, and v refer respectively to arteriole, capillary, and venule, j refers to GM or WM, CBF is the blood flow in units of mL/g/s, and γ = 0.9 mL/g is the blood—brain partition coefficient (Herscovitch and Raichle, 1985).
In summary, the signal change measured by the GMN fMRI method represents an apparent CBV change, which is affected by (1) MR acquisition parameters (i.e., TR and TE), (2) change in CBF and CSF fraction, and (3) the partial voluming of CSF and WM.
Simulations
Simulations were conducted based on the theoretical analysis to reveal partial volume effect of CSF and CBF contamination on the GMN signal.
To determine the partial volume effect of CSF, we considered a voxel consisting of GM + CSF covering a range of CSF fractions from 0 to 0.3. We further considered two conditions under which the fractions of components that either change or remain constant during brain activation. Under condition when fraction size changed, we considered that ΔXCSF/XCSF,rest = −2% to show this effect. The simulations were performed with TR = 3,000 ms and TE = 0 ms.
To illustrate the CBF effect, we consider two types of voxels, one comprising GM only and the other a mixed GM voxel of 85% GM + 15% CSF. The simulations were performed with TE = 0 ms and TR ranging from 2,000 to 5,000 ms.
Typical MRI data at 3T obtained from published papers were used in the simulations. Cerebral blood volume values for GM were taken to be 0.05 mL/mL at rest and 0.066 mL/mL during activation (Gu et al, 2006), amounting to an increase in CBV by 32%. Baseline CBF in GM has been reported to range from 51.1 to 63.3 mL/100g/min (Grandin et al, 2005) and the average value of 57 mL/100 g/min was used in the simulations. Increase in CBF during visual stimulation depends on the stimulation paradigm, ranging from 60 to 150% (Uludag et al, 2004). We used a CBF increase of 70% (corresponding to 97 mL/100 g/min during activation) in line with previous reports (Yang et al, 2004; Hoge et al, 2005). Water proton densities (C) of arteriole, capillary, and venule blood were all assumed to be 0.87 (Lu et al, 2002) and water proton densities of GM and CSF were estimated as 0.89 and 1, respectively (Lu et al, 2002). T1 values were set to be equal at rest and under activation and taken to be 1,122 ms for GM, 3,817 ms for CSF, 1,627 ms for arteriole, capillary, and venule blood, respectively (Lu et al, 2004a, 2005a; Donahue et al, 2006a).
Functional Magnetic Resonance Imaging Experiments
Brain activation studies of visual cortex were performed at the University of Birmingham (Birmingham, UK) and the Dartmouth Medical School (Hanover, NH, USA), both equipped with Philips 3T Achieva MR scanners (Philips Medical Systems, Best, The Netherlands). The fMRI protocols were approved by the Institutional Review Boards at both sites. Fourteen normal volunteers (six in Birmingham and eight in Dartmouth) were enrolled (eight men, six women, age range from 24 to 52 years) for the fMRI studies. A signed informed consent was obtained from each volunteer before taking part in the study. Visual stimulation consisted of a full-field black/white checkerboard flashing at 8 Hz. Visual stimulations lasting either for 225 secs (45 secs OFF and 45 secs ON in two cycles) or 330 secs (30 secs OFF and 30 secs ON in five cycles) were used. Subjects were instructed to fixate to a small black cross in the center of the screen during the resting period. The order of fMRI scans was either in the order of BOLD, VASO, followed by GMN, or in the order of BOLD, GMN, followed by VASO. A spatially nonselective IR pulse was applied with TI set for nulling GM and blood signal, respectively. Typical GM T1 = 1,122 ms (Lu et al, 2005a) and blood T1 = 1,627 ms (Lu et al, 2004a) at 3T were adopted for the determination of appropriate TI values. The corresponding TIs for TR = 2,000, 3,000, 4,000, and 5,000 ms were 603, 703, 746, and 765 ms for GMN, and 710, 889, 994 and 1,054 ms for VASO, respectively. A single-shot, gradient-echo echo-planar imaging sequence with a flip angle of 90° was used for all fMRl scans with body coil transmit and SENSE head coil receive. Acquisitions with multiple TEs, multiple TRs, and multiple resolutions were performed for GMN and VASO fMRI scans. In multiple TE data acquisitions, two scans with dual gradient-echo readout (first scan with TE = 10 and 58.6 ms, and second scan with TE = 20 and 76 ms) were performed with TR = 3,000 ms and resolution = 2 × 2 × 5 mm3. In multiple TR scans, TR ranged from 2,000 to 5,000 ms with an increment of 1,000 ms. All multiple TR scans used a single spatial resolution (2 × 2 × 5 mm3) in the data acquisition. A dual gradient-echo readout was adopted with TE = 10 and 56 ms for multiple TR scans. In multiple resolution scans, the data with three different resolutions (3.75 × 3.75 × 5, 1.75 × 1.75 × 5, and 1 × 1 × 5 mm3) were acquired with TR = 3,000 ms and TE = 12 and 67.4 ms with the gradient-echo echo-planar imaging sequence. For BOLD fMRI scans, two spatial resolutions (1.75 × 1.75 × 5 and 2 × 2 × 5 mm3) were used in the scan with TR = 3,000 ms and TE = 48.8 and 40 ms for each resolution. All fMRI data were acquired with a SENSE factor = 2 or 2.5. In addition, 10 dummy scans were applied before starting each fMRI scan to reduce the T1 saturation effect. Additionally, structural T1 images were acquired from the same slice as used for fMRI (six male volunteers) with TI = 200 to 4,000 ms, TR = 10 s, TE = 10 ms, and spatial resolution = 2 × 2 × 5 mm3.
Data Processing
Reconstructed MR image data in Philips PAR/REC format were transferred from the MRI console to a separate PC with the Linux operating system. The image data were first converted to the ANALYZE format using MRIcro software (http://www.mricro.com). The converted images were analyzed using FEAT (FMRI Expert Analysis Tool), part of FSL (http://www.fmrib.ox.ac.uk/fsl). The following pre-statistics processing was applied for all fMRI data: motion correction using MCFLIRT and high-pass temporal filtering with a cut-off time based on one cycle period of visual stimulation. A region of interest covering the occipital lobe was manually selected on a T1-weighted image as a mask and used for all fMRI data process in the use of FEAT as a prethreshold masking to eliminate any voxels outside the visual cortex being identified as active pixels. Time-series statistical analysis was performed using FILM (FMRIB's Improved Linear Model) with local autocorrelation correction by convolution of a block design boxcar function with a γ-variate hemodynamic response model. A Z (Gaussianised T/F) statistic threshold was used for the determination of clusters with Z-score > 2.3 and cluster P-threshold > 0.05. Signal time courses were determined by averaging over all activated voxels for each dynamic image and normalized to the baseline signal under IDL 6.0 platform (Research Systems, Boulder, CO, USA). Signal changes were determined from averaged data in baseline and activation periods. To account for delayed hemodynamic response, the data acquired during the first 8 secs in resting and stimulation periods for each stimulation cycle were not used for the determination of steady-state fMRI signal changes. This is because the typical delay for the hemodynamic response is approximately 6 secs and leaving out the first 8 secs data in each period would be sufficient to avoid contaminating the data with any transient features of fMRI signals.
Image segmentation was performed on the structural T1 data acquired from the same fMRI slice using FAST (FMRIB's Atomated Segmentation Tool), part of FSL, a fully automated segmentation tool based on an expectation maximization algorithm using hidden Markov random field model to segment brain tissues into three types: GM, WM, and CSF. The structural T1 data were averaged from four repetitions to improve SNR. Activated voxels were mapped to the segmentation map to identify which types of tissues activated voxels belonged to.
Experimental SNR of raw image data were calculated as SNRraw = mean (MR signals in the activation regions)/s.d. (standard deviation in a non-brain region). Contrast-to-noise ratio was determined by CNR = (ΔS/S)/s.d. × √N where ΔS/S is the functional signal change, s.d. is the standard deviation in a non-brain region and N is the total number of images acquired in the time series. The fMRI SNR over time series data were calculated by SNRfMRI = ΔS/σ, where ΔS is the signal change between the activation state and baseline, and σ is the variability of these states over time (i.e., the standard deviation of the error signal after model fitting for fMRI time series data).
Results
Simulations
To show CSF effects on GMN fMRI signal, Figure 2 shows the relative GMN signal change as a function of CSF fraction (XCSF,rest) at baseline with and without a change in CSF fraction on brain activation. As shown, the GMN fMRI signal changes decrease gradually as XCSF,rest increases and are substantially smaller than those in the absence of CSF partial volume (XCSF = 0) when XCSF,rest ≥ 0.1. For the case with a change in the CSF fraction (ΔXCSF/XCSF,rest = −2%), the relative signal change will be further reduced.
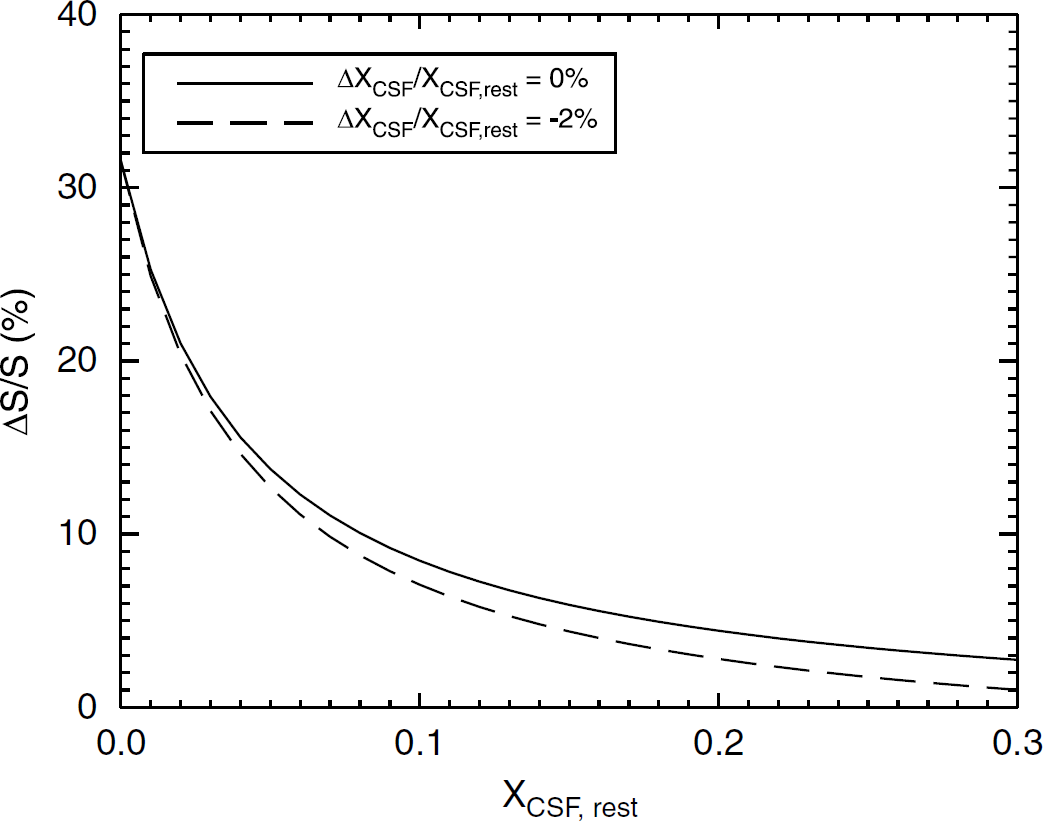
Computed GMN fMRI signal change as a function of resting CSF fraction (XCSF,rest) with and without a change in CSF fraction during brain activation.
To illustrate the effects of CBF on GMN signal change, signal changes as a function of TR are shown in a voxel consisting of GM only (Figure 3A) and 85% GM + 15% CSF (Figure 3B) with and without increase in CBF. In a pure GM voxel, stimulated CBF causes a small reduction in the GMN fMRI signal change (< 0.5%) independently of TR. In the mixed voxel, the GMN fMRI traces are nearly identical, illustrating insignificant effect by increased CBF during brain activation.
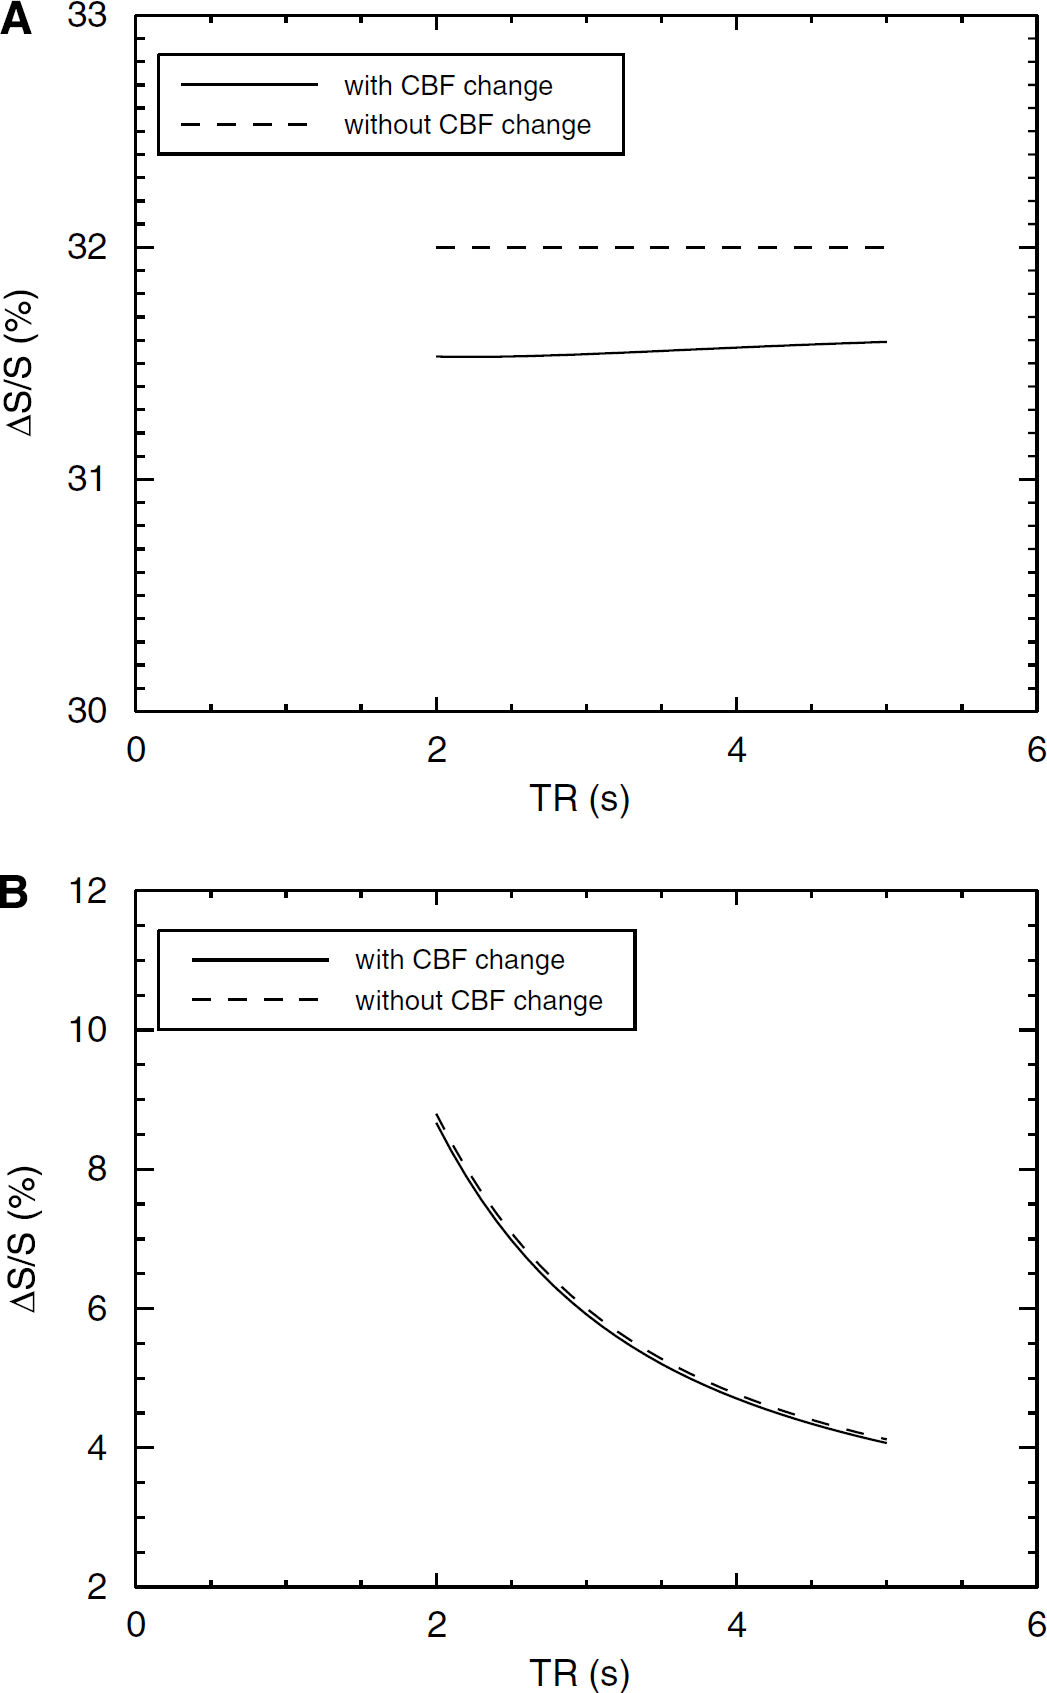
Computed functional signal change with and without effect of a CBF change for GMN fMRI as a function of TR when TE = 0 ms in the voxel consisting of GM only (
Functional magnetic resonance imaging Experiments
Figure 4 shows the activation maps for BOLD, VASO, and GMN fMRI and corresponding signal time courses acquired with TR = 3,000 ms for a typical subject. The activated area is largest for BOLD, but comparable in size for both GMN and VASO fMRI. The covered activation areas are shown to be different for GMN and VASO fMRI. As indicated by the signal time courses, a higher response is observed in GMN than in both VASO and BOLD fMRI scans.
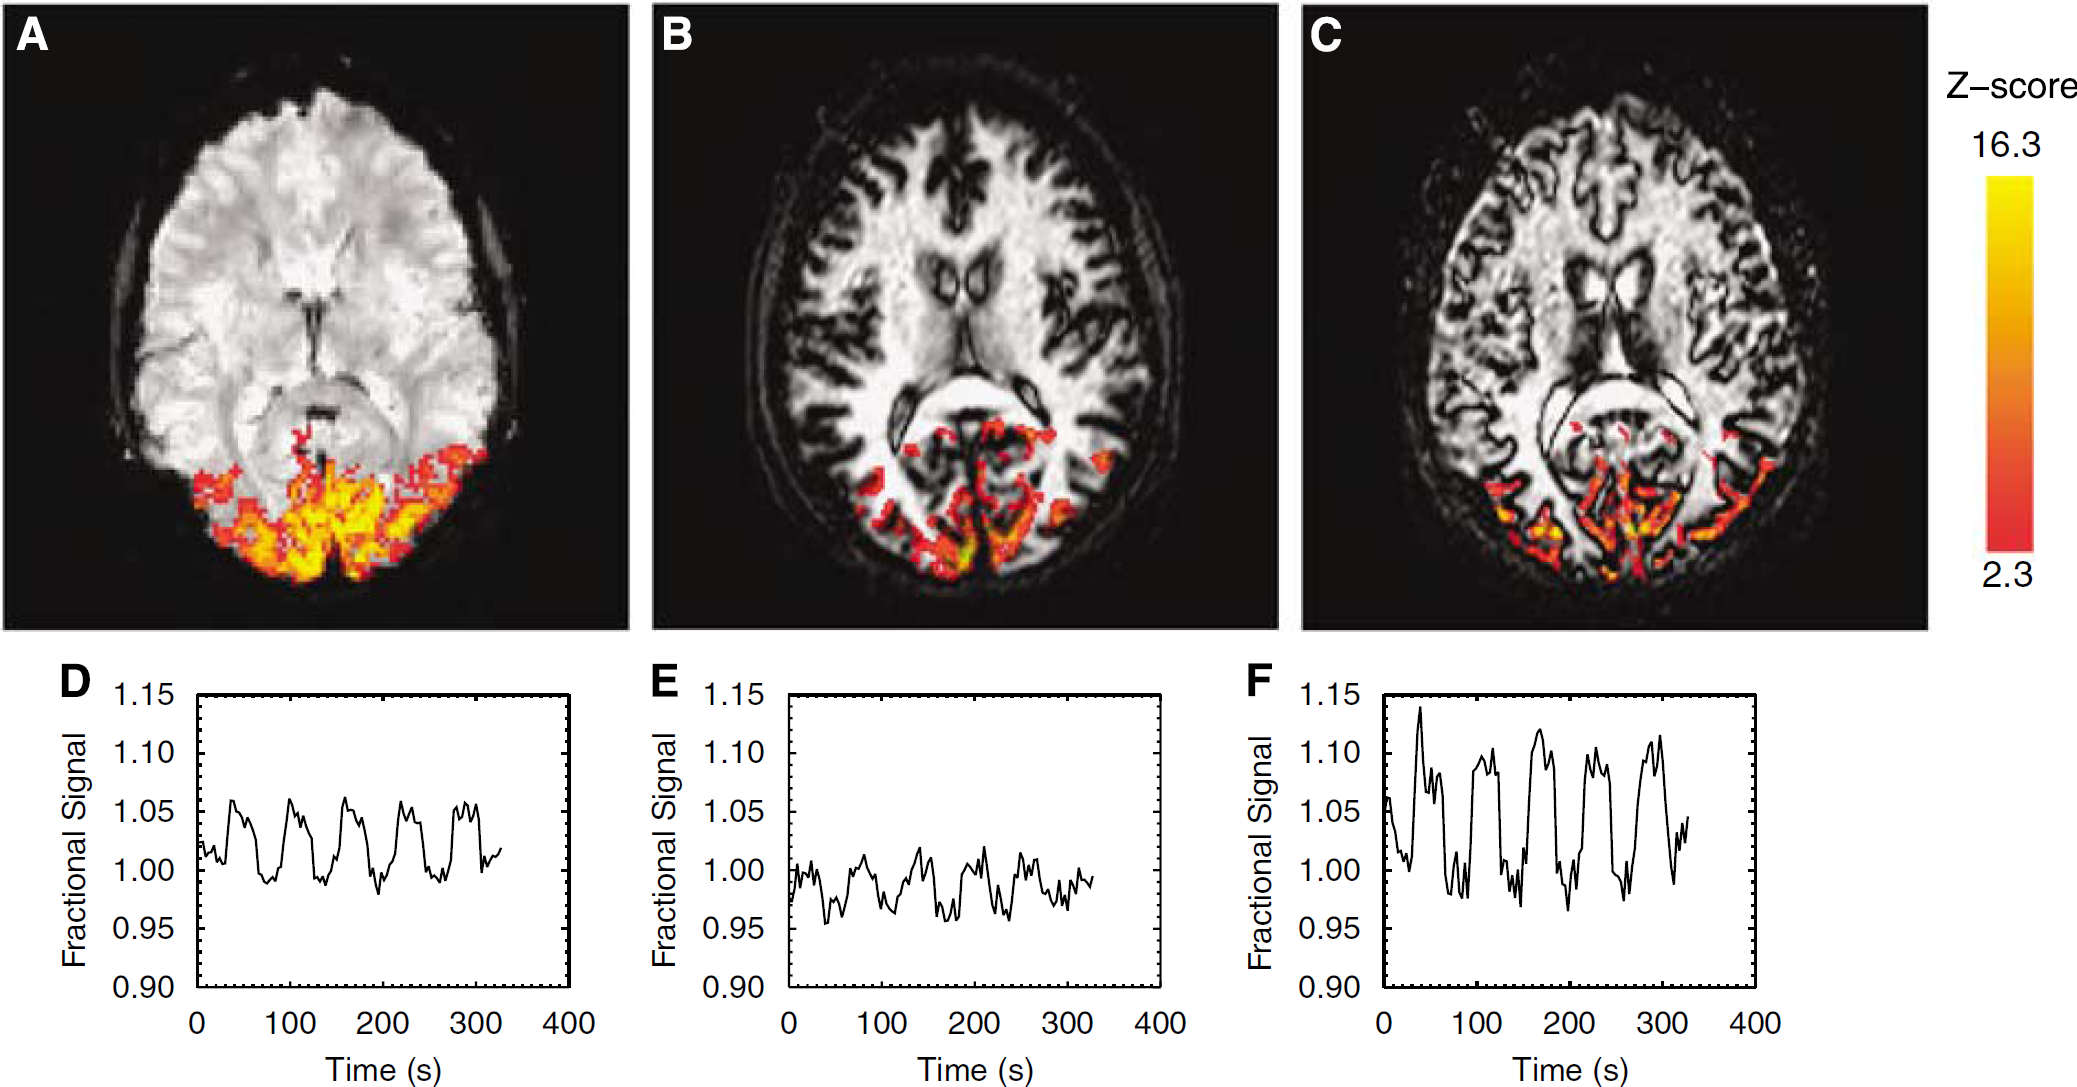
Activation maps for BOLD, VASO, and GMN fMRI (
At spatial resolution of 2 × 2 × 5 mm3, TR = 3,000 ms, and TE = 10 ms, the signal change measured in GMN fMRI scans was 7.2% ± 1.5% (n = 6, mean ± s.d.), which is much higher than both of VASO and BOLD fMRI scans, as the change for VASO fMRI was −3.2% ± 0.2% and for BOLD fMRI (TE = 40ms) 2.9% ± 0.7%. At a long TE (TE = 56 ms), the signal change in GMN fMRI increased by 12.6% ± 3.9%, a response that is 75% greater than that determined at a TE = 10 ms. Note that the signal change measured by GMN fMRI method is smaller than that of the change in absolute CBV (21%), measured by PET in response to visual stimulation (Ito et al, 2001). The number of activated voxels at this spatial resolution was 68 ± 30, 66 ± 22, and 342 ± 50 (corresponding to 1,360 ± 600, 1,320 ± 440, and 6,840 ± 1,000 mm3 in volume) for GMN, VASO, and BOLD fMRI, respectively. Both GMN and VASO fMRI active voxels are nearly completely localized within the BOLD active regions (spatial overlaps by 85% ± 9% and 78% ± 11% respectively). However, the overlap of active GMN and VASO voxels is very low (7.0% ± 5.7%), indicating that the respective fMRI signals originate from different parenchymal components. Even combining GMN and VASO active voxel numbers together, this number is still much lower than that of BOLD. The mismatched region is largely attributed to the substantial macrovascular venous contribution to the BOLD signal (Lu and van Zijl, 2005b). The SNRs of raw data under these experimental conditions were SNRraw,GMN = 139 ± 25, SNRraw,VASO = 138 ± 23, and SNRraw,BOLD = 177 ± 26. The CNR were 44.8 ± 4.4 and 15.1 ± 3.1 in the GMN and VASO fMRI scans, respectively (TE = 10 ms for both). High CNR for GMN fMRI is because of the strong relative signal change, whereas both GMN and VASO images have similar inherent noise levels because of the used IR method. Functional magnetic resonance imaging SNRs were SNRfMRI,BOLD = 4.97 ± 0.76, SNRfMRI,GMN = 4.56 ± 0.86, and SNRFmri,VASO = 2.43 ± 1.06. The VASO fMRI has the differing SNRfMRI to BOLD and GMN fMRI (paired t-test for BOLD and VASO, P < 0.001; paired t-test for GMN and VASO, P < 0.03), whereas the other two have similar SNRfMRI (paired t-test, P > 0.5).
To determine in which parenchymal tissues types GMN- and VASO fMRI-activated voxels were present, T1 segmentation was used as an anatomic reference. 163 ± 43 voxels from a total of 166 ± 41 activated voxels in GMN fMRI reside in the GM parenchyma and only 3 ± 3 voxels were seen in the WM parenchyma, but none in the CSF. In VASO fMRI images, 192 ± 82 voxels from a total of 194 ± 84 activated voxels were in the GM parenchyma and only 1 ± 2 activated voxels were found in the WM parenchyma, again none in the CSF. These results show that the activated voxels from both GMN and VASO scans are almost entirely (> 98%) in the GM parenchyma.
To examine the expected TR and TE effects on the GMN fMRI, GMN signal changes are plotted as a function of TR (Figure 5A) and TE (Figure 5B). For TR effect, the normalized signal change is seen to decrease nonlinearly from 9.0% ± 1.8% to 5.7% ± 1.4% (paired t-test, P < 0.001) as TR increases from 2,000 to 5,000 ms. In contrast for TE effect, the signal change is found to increase almost linearly from 6.0% ± 1.2% to 10.7% ± 1.5% (paired t-test, P < 0.001) as TE changed from 10 to 76 ms.
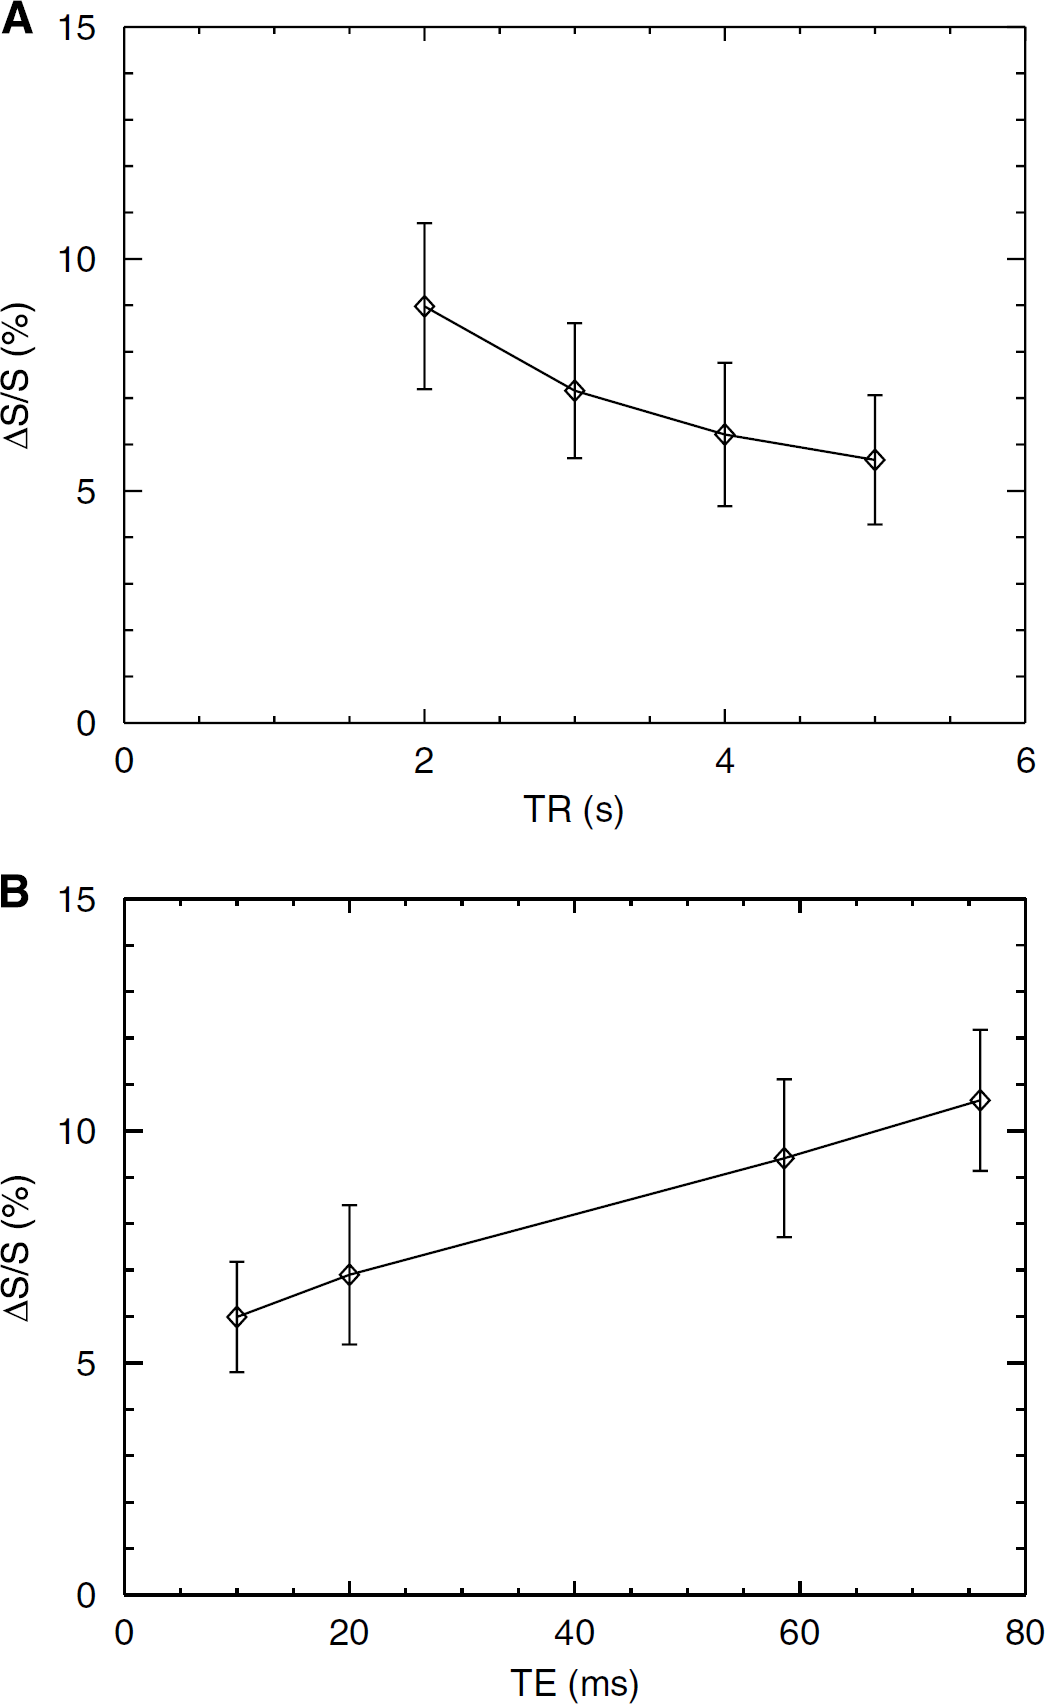
GM-nulled functional signal changes as a function of TR (
Figure 6 shows the activation maps for GMN fMRI acquired with three different spatial resolutions and the corresponding signal time courses for a typical subject. The activation in the brain covers nearly identical regions for three different resolutions. As shown by the time courses, the amplitude of response is different with different spatial resolution, the response with high spatial resolution being larger than that with low spatial resolution.
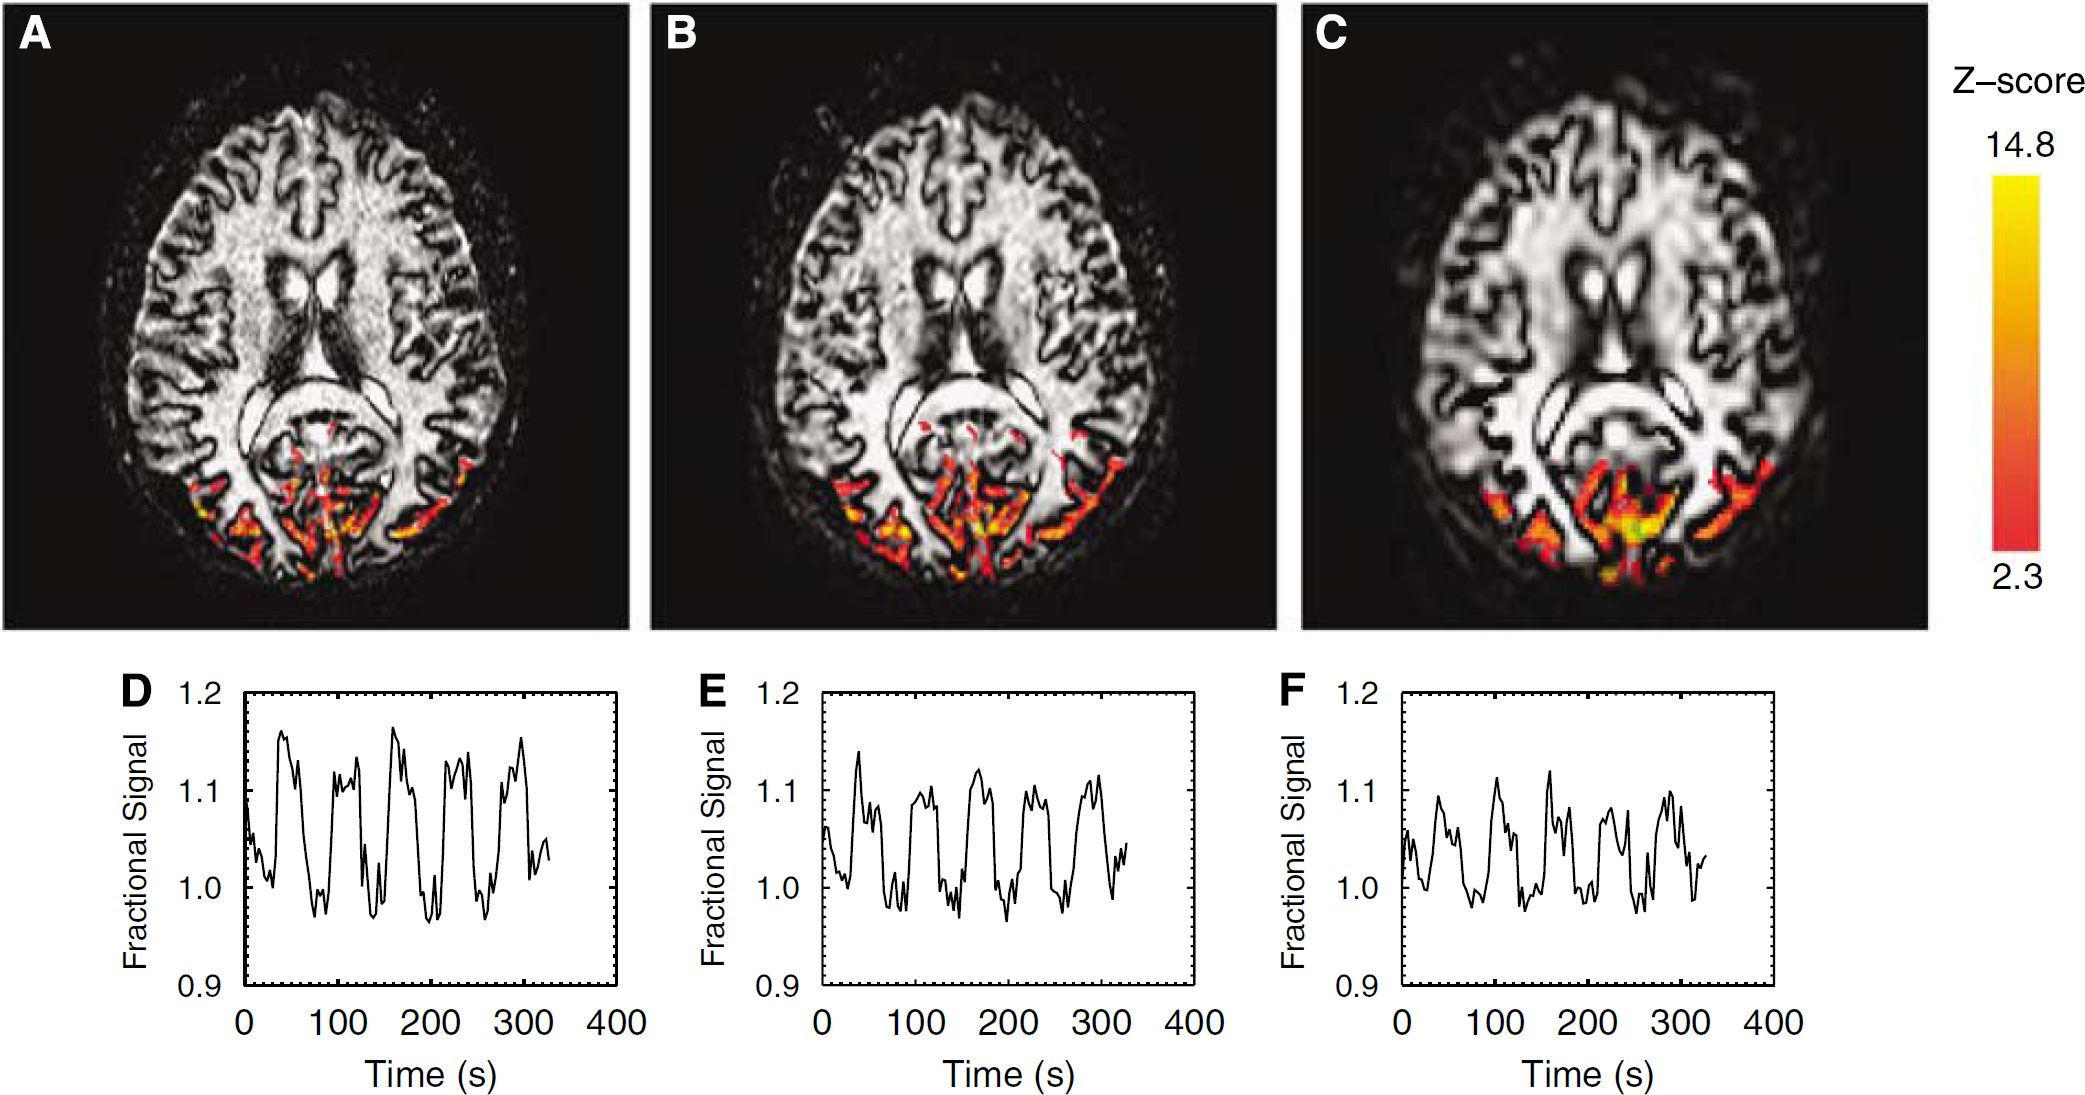
GM-nulled fMRI activation maps with acquisition voxel size in 1 × 1 × 5, 1.75 × 1.75 × 5, and 3.75 × 3.75 × 5 mm3 (A—C) and their corresponding time courses (D—F) for a typical subject measured with TR = 3,000 ms and TE = 12 ms.
Figure 7 shows the GMN fMRI signal change and activation volume as a function of spatial resolution (shown by voxel size). The functional signal change is increased as voxel size is reduced in agreement with the reduced CSF partial volume effect. When the voxel size is reduced from 3.75 × 3.75 × 5 mm3 to 1 × 1 × 5 mm3, the signal change is increased from 7.1% ± 1.0% to 13.0% ± 3.4% (paired t-test, P < 0.01), an increase by 83%. However, the activation volume is reduced as voxel size decreases. The corresponding activation volume is reduced from 19,786 ± 8,238 mm3 to 1,682 ± 833 mm3 (paired t-test, P < 0.01) when the voxel size changes from 3.75 × 3.75 × 5 mm3 to 1 × 1 × 5 mm3.
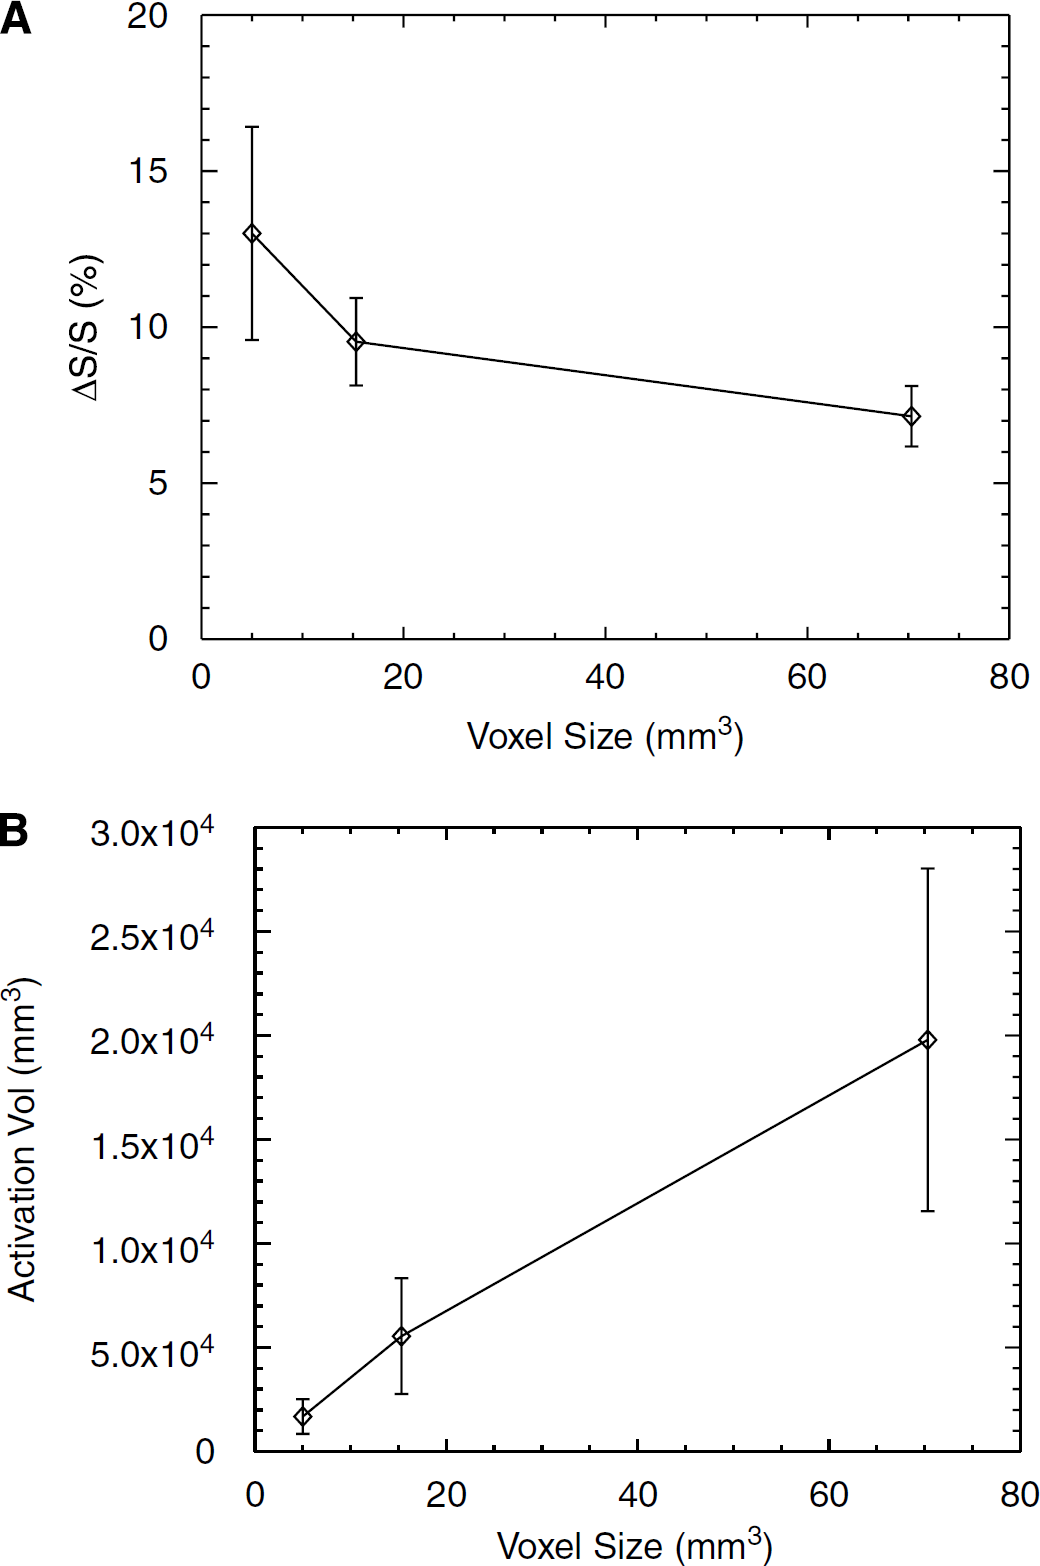
GM-nulled functional signal changes (
Discussion
The signal change because of the increase in CBV is detected directly by means of the GMN fMRI technique. Owing to this, this new fMRI technique provides a signal change with a positive sign as a signature of brain activation. This is in contrast to the VASO approach where the signal change because of brain activation is detected through a decrease in parenchymal MRI signal. Gray-matter-nulled fMRI signal change is two-times larger than that by either VASO or BOLD fMRI acquired with the same TR with a comparable fMRI SNRfMRI to BOLD but twofold greater than that of VASO. One advantage provided by the GMN fMRI technique is that the detected activation localizes to the exact region undergoing CBV increase associated with brain activation almost exclusively to intravascular GM tissues.
The GMN and VASO fMRI methods detect the MR signal changes arising from different parenchymal compartments. The GMN signal arises from vascular blood, in contrast to the VASO fMRI, which probes extravascular tissue signal in the brain parenchyma. This difference illustrates the versatile nature of IR-based fMRI techniques, making it possible to ‘select’ for given compartmental signal for functional imaging studies. It should be noted that the changes in GMN and VASO fMRI are not independent, because these two techniques probe the same physiologic substrate, that is, CBV. Altered CBV will lead to changes both in intravascular blood MR signal (probed by GMN fMRI) and extravascular GM tissue signal (probed by VASO fMRI) within a voxel. This strict difference in MR signal generation mechanisms between GMN and VASO fMRI techniques may explain low spatial overlap for the activated voxels between the two techniques. For GMN fMRI, the activated voxels must have a sufficient amount of blood to make it possible to record a signal change, whereas for VASO fMRI, a sufficient amount of extravascular GM must be preserved for detectable fMRI response.
A common problem for IR-based fMRI techniques is partial volume effect from CSF. This is because CSF is inefficiently suppressed by both GMN and VASO fMRI techniques because of its long T1 and, consequently, a large negative signal remains in MR images. This factor makes absolute quantification of CBV changes very difficult, if not impossible. The presence of negative signal from CSF shows differing effects on the fMRI signals acquired with these two techniques. For GMN technique, the signal from CSF leads to an underestimated signal change in CBV, because the CSF signal is of the same sign as the blood signal. Contamination of CSF signal in VASO fMRI causes an overestimation of CBV because of the opposite sign to the detected parenchymal MRI signal (Donahue et al, 2006b). The CSF effect is proportionally larger in GMN fMRI than in VASO, because shorter TI is used that leads to a large negative CSF signal in the former technique. The contribution of CSF signal is uniquely determined by TR in both fMRI techniques but has different effects based on the sign of CSF signal with respect to the detected signal. A short TR is desirable for GMN fMRI, because the CSF magnetization signal is small. This is a contrary to the VASO approach, where a long TR is desirable for smaller influence on the signal (Donahue et al, 2006b). Short TR also favors practical use of GMN fMRI technique for brain activation studies.
Reducing voxel size in acquired images alleviates the partial volume effect of CSF, as shown here both theoretically and experimentally, because large voxels have severe partial voluming with CSF. A large activated voxel in the images acquired at low spatial resolution corresponds to a few smaller ones in the images acquired at high spatial resolution; these smaller voxels have either higher or lower proportion of CSF than that of the large activated one. Among these smaller voxels, the ones having higher proportion of CSF will not be identified as activated voxels any longer. As a consequence, the total activation volume becomes smaller. High GMN fMRI signal change in the images acquired at high spatial resolution is a direct result from reduced CSF partial volume effect. It should be stressed that the decrease in SNR has to be considered when the image resolution is improved. Our results show that at a resolution of 1 × 1 × 5 mm3 an acceptable image quality is obtained for GMN fMRI at 3T.
Although the CSF partial volume effect can be alleviated by acquiring GMN fMRI at high spatial resolution, complete elimination of CSF effects would require further processes to suppress the CSF magnetization, for example, a double inversion approach to simultaneously null both GM and CSF magnetization signals. It should be noticed that using double inversion approach makes the measured blood signal even smaller than that of single inversion approach and a reduction in SNR in raw data should be considered. In addition, the double inversion approach requires that TR must be sufficiently longer to eliminate both GM and CSF signals. It has been reported that TR = 25 secs is suggested for VASO using double inversion approach (Donahue et al, 2006a).
Our data show that the GMN fMRI signal change to brain activation depends on both TR and TE. TR dependency is mainly attributed to CSF partial volume effect, as explained earlier. TE effect, shown as the signal increase almost linearly with the increase of TE, is attributed to the BOLD effect, which is known to influence intravascular blood T*2 especially in the postcapillary venules and veins during brain activation (Silvennoinen et al, 2003). To minimize the BOLD effect, a short TE is desirable for GMN fMRI.
Note that the remaining blood signal after nulling extravascular GM tissue signal includes both microvascular and macrovascular pools. If brain activation leads to CBV change in both microvascular and macrovascular compartments, the GMN fMRI signal would have contributions from both blood pools. As shown in this study, the activated voxel number for GMN fMRI is much less than that of BOLD, but comparable to that of VASO fMRI. Gray-matter-nulled and VASO fMRI probe CBV either directly or indirectly, whereas BOLD fMRI signal is determined by blood oxygenation level with significant contributions from draining veins. The change in CBV to brain activation has been generally regarded to take place in the parenchyma near microvascular sites rather than in draining vessels (Woolsey et al, 1996; Duong et al, 2001). Keeping this in mind, the GMN fMRI signal change may mainly come from microvascular blood. However, targeting GMN fMRI signal change either solely or chiefly from microvascular sites requires further processing and analysis, because GMN fMRI technique can not separate the magnetizations from both microvascular and macrovascular sites.
The effects of the changes in the fractions of GM, WM, and CSF in the typical MRI voxel during brain activation have been included in the established theoretical analysis for GMN fMRI signal change, because these fractions are likely to change particularly at the boundaries between GM and CSF and/or WM and CSF. Such effects were investigated for VASO fMRI recently (Scouten and Constable, 2007). Here we have assessed partial voluming for GMN fMRI signals using computer simulations. During brain activation, the fractions of GM and WM parenchyma may increase because of the alterations in CBV, and consequently the fraction of CSF in MRI voxel may become smaller. Note that the increased fraction of GM parenchyma in an activated MRI voxel may result in enhanced signal change whereas decreased fraction of CSF would lead to a reduced functional signal change. Consequently, combined effects of these above could potentially reduce global effect of CSF fractional changes on the GMN fMRI signal. The quantification of residual CSF effect in GMN fMRI requires further experiments to determine the fraction of CSF in an activated voxel.
The proposed GMN fMRI approach is a robust fMRI method, offering a direct means to monitor CBV changes associated with brain activation. In the case of a voxel consisting of GM parenchyma only, a pure CBV change to brain activation can be measured (1) when TE = 0 and (2) in the absence of change in blood magnetization, as can be concluded from Equation (7). To achieve these, further developments are required to eliminate these effects. In the case of a voxel consisting of pure GM tissue, the measured signal from that voxel is zero in both resting and activation state, because the extravascular GM tissue signal is suppressed; this type of voxel will not contribute to activation map during postprocessing and the condition that the denominator of Equation (6) becomes zero will not happen when determining the relative signal change from the activated voxels. If an activated voxel is of mixed tissue type, the baseline signal will have contributions not only from blood but also from other compartments, including CSF and WM. The effects of CSF and WM in the baseline signal size will affect the relative signal change to brain activation. In a practical fMRI experiment, the mean signal from activated voxels consists of the collective blood, CSF, and WM signals contributing to all activated voxels. If there were means to determine CSF and WM partial volume effects in absolute terms for activated voxels, the pure blood signal change would become amenable for the GMN fMRI method.
Technically, the GMN fMRI method is easy to implement into most clinical scanners with TI determined by an appropriate GM T1 corresponding to the applied magnetic field strength and can be expanded to multislice, using the so-called Multiple Acquisitions with Global Inversion Cycling (MAGIC) approach, first proposed by Lu et al (2004)b, and optimized for whole brain VASO imaging by Scouten and Constable (2007). Such method would allow GMN fMRI to be used in whole brain fMRI studies.
Conclusions
We have presented a new fMRI technique based on suppression of extravascular GM tissue signal using IR approach. A theoretical framework is established for the GMN fMRI signal change in vivo. The new fMRI technique can identify areas with increased CBV on brain activation and the fMRI experiments show that the GMN signal change in the visual cortex is two-times greater than that obtained by VASO and BOLD fMRI techniques. It is important to note that the CSF partial volume effect to the GMN fMRI data can be reduced by acquiring highresolution images. In addition, the new fMRI approach offers a potentially quantitative way to measure change in absolute CBV. Besides for fMRI studies, the proposed fMRI technique can be used for purposes where CBV measurement is desired.
Footnotes
Acknowledgements
The authors thank Dr Ivan Zimine, Yi Ching Lynn Ho, and Esben Thade Petersen of Singapore National Neuroscience Institute for discussions and Jorge Forero and Michael Pearl of Advanced Imaging Center at Dartmouth-Hitchcock Medical Center for technical assistance.
None.