
Abstract
Uncoupling proteins (UCPs) present in the inner mitochondrial membrane are involved in uncoupling respiration from ATP synthesis. Five UCP isoforms have been identified but information about their presence and level of expression in the central nervous system remains incomplete. To determine the nature and proportion of UCP isoform mRNAs present in brain cortex, we developed and optimized a specific quantitative reverse-transcription polymerase chain reaction procedure. Optimal range of RNA concentrations to be used in the reverse-transcriptase reaction was determined. Primer design and concentration were optimized for each target gene while polymerase chain reaction efficiency was assessed for a range of reverse-transcriptase dilutions. Genomic contribution to the quantitative signal was evaluated for each isoform and minimized. Three reference genes were tested for normalization, and β-actin was found to be the most stable among tissues. Results indicate that brain cortex contains significant amounts of all UCP mRNAs, with UCP5 and UCP4 being the most abundant, as opposed to brown adipose tissue and skeletal muscle, which predominantly express UCP1 and UCP3, respectively. These data provide a first quantitative assessment of UCP mRNA expression in mouse brain, showing the presence of all five isoforms with distinct proportions, thus suggesting specific roles in the central nervous system.
Keywords
Coupling between oxidative phosphorylation, electron transport and production of energy represents a fundamental biochemical process in eukaryotes. Its precise mechanism has been debated over the last 50 years, but it seems that a large consensus has now been reached. According to the chemiosmotic hypothesis (Mitchell and Moyle, 1967), electron transport in the respiratory chain leads to translocation of H+ and the formation of a gradient between the intermembrane space and the mitochondrial matrix. In most cases, dissipation of this H+ gradient is coupled to ATP production via the F1F0 ATPase. In some situations, however, dissipation of the H+ gradient by other means can be used to produce heat rather than ATP. Such uncoupling of oxidative phosphorylation from ATP formation was observed in BAT and give rise to nonshivering thermogenesis as seen notably during cold exposure (Nicholls and Locke, 1984). Heat generation produced by dissipation of the proton gradient in BAT is mediated by a specific uncoupling protein known as thermogenin or UCP1. In recent years, new UCP isoforms have been identified and their tissue distribution is now being explored. Apart from UCP1, which was reported to be exclusively expressed in BAT (Ricquier and Bouillaud, 2000), UCP2 was found to be ubiquitous (Gong et al., 1997; Mizuno et al., 2000; Ricquier and Bouillaud, 2000). In contrast, UCP3 is very abundant in muscle (Gong et al., 1997; Ricquier and Bouillaud, 2000), whereas UCP4 and UCP5 appear to be predominant brain isoforms (Mao et al., 1999; Mizuno et al., 2000; Sanchis et al., 1998; Yu et al., 2000). The fact that different isoforms exist, and that they could be expressed by tissues not known to be involved in thermogenesis, suggests that each UCP might play novel and unsuspected roles. In order to investigate the putative roles of UCPs in the central nervous system, it appears important to determine at this stage which UCP isoforms are expressed and obtain precise quantitative information on their relative abundance. Comparison with other tissues in which specific functions have already been described (e.g., BAT) could also prove to be useful. Unfortunately, the actual tools available to address these questions, mainly antibodies, exhibit rather poor selectivity to distinguish among the different isoforms, are difficult to use (they require to prepare mitochondrial fractions), and do not allow a reliable quantification.
Real-time QPCR is a powerful and very sensitive technique that provides a reliable approach to quantitatively assess the level of expression of various genes. Its use, however, is not straightforward, requiring careful optimization and validation for each specific application. Previous publications have pointed out some of the critical steps that must be controlled to obtain reliable quantitative results. Conditions for the reverse transcriptase reaction (Bustin, 2002), primer design, tissue preparation (Bastard et al., 2002), normalization methods and calculation (Livak and Schmittgen, 2001) are among the main points to be carefully evaluated. These steps are important in all kinds of PCRs, but are particularly important for QPCR to ascertain that results will be truly quantitative. An additional difficulty is the experimental context in which QPCR is applied. RNA quantification by QPCR is particularly well suited for in vitro applications using cell cultures. In such case, a control condition can be used for normalization (Livak and Schmittgen, 2001) to evaluate the effect of a particular treatment by reporting how many fold gene expression varies as compared with the control group. Quantification of RNA extracted from tissues, as realized here, represents a more difficult task. The variability increases not only because efficiency of RNA extraction is less reliable, but also because control and treated animals are different. In such situation the use of the ΔΔCt method (Livak and Schmittgen, 2001) is not directly applicable because the effect of the treatment cannot be compared to a single control animal but to a group of animals. Variability of results will increase and the expression of poorly expressed genes can be misinterpreted.
In this article, we have systematically investigated and optimized conditions for each step of the QPCR procedure to be applied for the quantification of the five known UCP isoform mRNAs in brain cortex as well as in two other more classical target tissues for UCP expression, BAT and skeletal muscle. In addition to provide a critical appraisal of current QPCR procedures and suggest improvements, we show (quite unexpectedly) that all five UCP isoforms are present in brain cortex but also in the other tissues investigated. Moreover, we observed that their expression pattern and quantitative relationships vary among tissues. Considering the new emerging roles of UCPs in processes other than thermogenesis, information gained with such an optimized QPCR method will prove useful in the near future to assess their specific functions in the central nervous system.
MATERIALS AND METHODS
Animals and treatment
Adult OF1 mice (12 to 36 weeks old) were purchased from Charles River Laboratory (Lyon, France). All mice were kept under standard laboratory conditions, with access to tap water and food ad libitum. Animals were killed by cervical dislocation between 10:00 and 11:00 AM; organs were rapidly dissected and frozen in liquid nitrogen. All animal procedures were in accordance with the Swiss guide for care and use of laboratory animals.
RNA preparation and reverse transcriptase reaction
Dissected tissue was ground into a fine powder with a mortar and pestle. Total RNA was extracted from 30 mg of tissue using the total RNeasy kit from Qiagen (Qiagen AG, Basel, Switzerland). Residual genomic DNA was removed on the column using the RNase-Free DNase Set as described in the RNeasy kit. Amount of RNA was determined from optical density (OD) OD260 and OD280 measurements. Integrity of isolated total RNA was electrophoretically verified by ethidium bromide staining and by OD260/OD280 absorption ratio. RNA was stored at -80°C. The RT reaction was performed using the TaqMan reverse-transcription reagents and protocols from Applied Biosystems (ABI, Foster City, CA, U.S.A.). Between 10 pg to 1 μg of total RNA, random hexameters (2.5 mol/L), and the RT buffer (1x) were heated for 10 minutes at 65°C for denaturation. MgCl2 (5.5 mmol/L), dNTP (500 mol/L) for each dNTP), RNase inhibitor (0.4 U/(μL), and the Multiscribe reverse transcriptase (1.25 U/(μL) were added at room temperature. The RT reaction solution was then incubated successively for 10 minutes at 25°C, 45 minutes at 48°C, and 5 minutes at 95°C. Synthesized cDNAs were used preferably the same day for the QPCR; if not, they were stored at -80°C.
Primer design
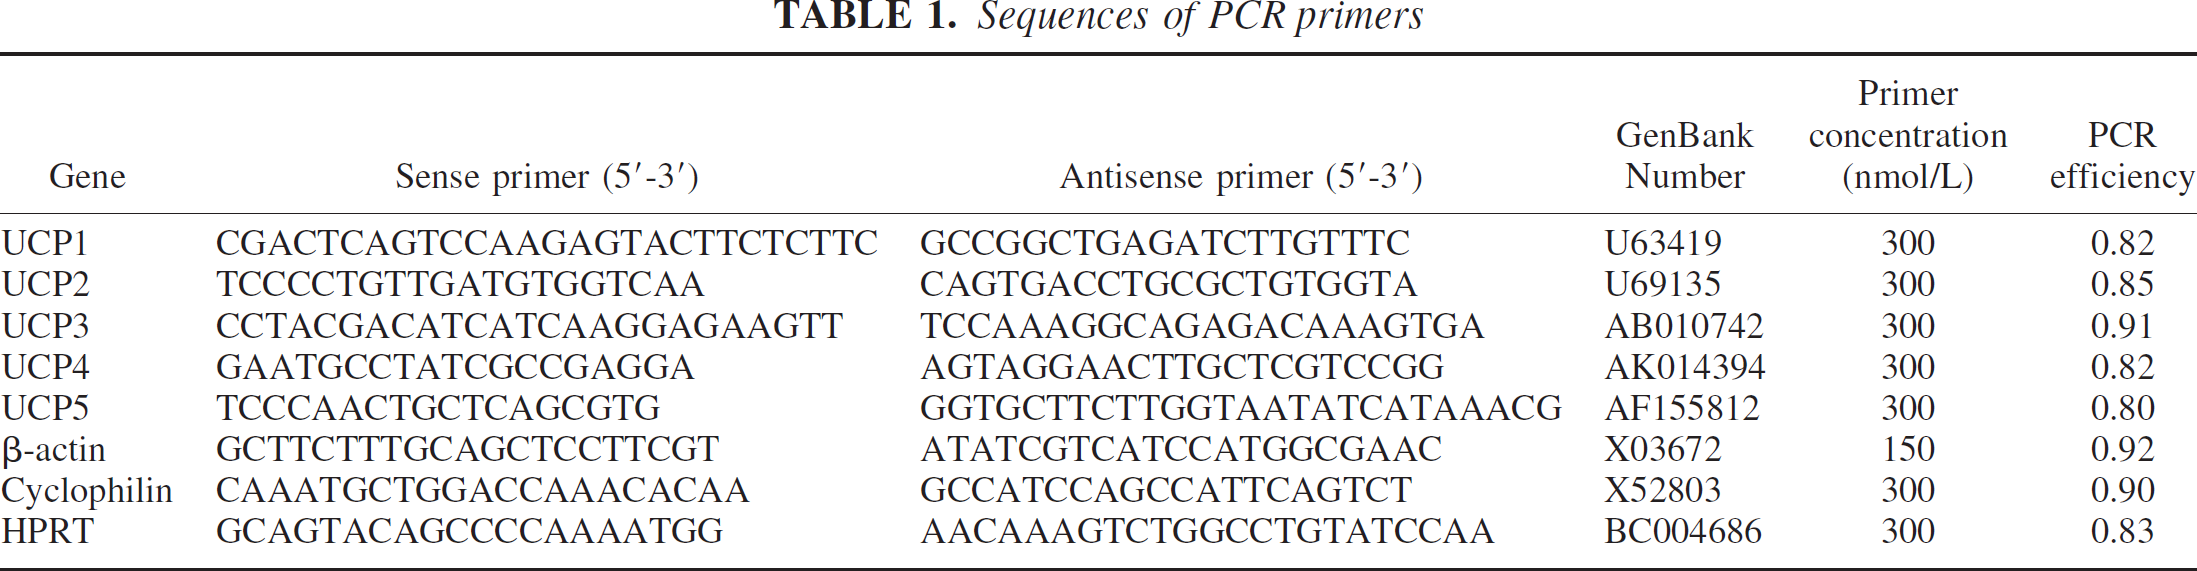
Each set of primer sequences (see Table 1) were designed to meet three criteria. First they had to be specific for one UCP sequence and this was assessed using the ClustalW (1.82) sequence alignment program at the European Bioinformatics Institute (Pearson and Lipman, 1988). Second, each set of primer sequences was controlled for Tm and GC content with the Primer Express program (ABI). The Tm of each primer has to be 59°C (± 1°C) and the GC content should be above 40%, as recommended by the supplier. The third criterion was to design sense and antisense primers in different exons to avoid amplification from genomic DNA contamination. This concerns UCP1 and UCP3 sequences for reasons further discussed.
Sequences of PCR primers
Reverse transcriptase optimization
RNA concentrations in the RT that allow near 100% of transcription were determined by performing RT reactions with different RNA concentrations. The optimal range of RNA concentrations was determined by representing the CT values versus amount of RNA (ng). A linear decrease in CT values corresponding to the increase of the RNA added in the RT reaction demonstrates a maximal efficiency.
QPCR analysis
A range of 0.4 to 20 ng of cDNA was used for PCR reactions. Most of them were performed with 4 ng of cDNA. For example, the RT was run with 200 ng of total RNA in a reaction volume of 50 μL, then 2 μL of this reaction was used for the subsequent PCR reaction. Each PCR reaction for a single gene was made in triplicates. The QPCR mixture (25 μL) was composed of primers (50–300 mmol/L, 1 × SYBR Green PCR master mix (ABI), and H2O. The QPCR mix was then distributed in tubes containing the different cDNAs. QPCR was performed on the ABI Prism 7000 apparatus with the standard PCR profile: 95°C for 10 minutes, 40 cycles of 95°C for 15 seconds, and 60°C for 1 minute. Dissociation curve analysis was performed after a completed PCR, to evaluate the presence or absence of nonspecific amplifications, including primer dimer formation. PCR reactions were heated at 95°C for dissociation of all DNA present in the reaction. Then temperature was decreased rapidly to 60°C. Fluorescence data were continuously collected while slowly ramping the temperature from 60°C to 85°C. The melting profiles display the change in fluorescence as a function of temperature from the SYBR green interacting with double-stranded DNA; thus, any distinct double-stranded DNA can be discriminated.
The CT is the fractional cycle number at which the fluorescence passes the fixed threshold (Gibson et al., 1996). The CT is dependent on the starting template copy number and the efficiency of DNA amplification. Recorded CT values were transformed in absolute copy numbers using a standard curve of digested plasmid DNA as calibrating reference. The OD260 of a linearized plasmid containing the β-actin sequence was determined and served to calculate the copy number in dilutions. The formula used to calculate the plasmid copy number was as follows: Copy number in 1 μL = ([ng/μL] / MW) × Avogadro's number / 1E106. The calculated copy number was introduced in the ABI 7000 program that generates a standard curve at the end of the run. We used this standard curve to express CT values of our samples in copy numbers.
Polymerase chain reaction efficiency
For each primer couple, a titration curve was performed with a series of RT dilutions. The CT value versus the log2 RT dilution was represented and a slope was calculated for each primer pair. PCR efficiency is given by the formula Xn = X0 + (1 + E)n, where Xn is the number of target molecules at cycle n, X0 the initial number of target molecules, and E is the efficiency. The efficiency is given by E = 21/a - 1, a being the slope of the curve.
RESULTS
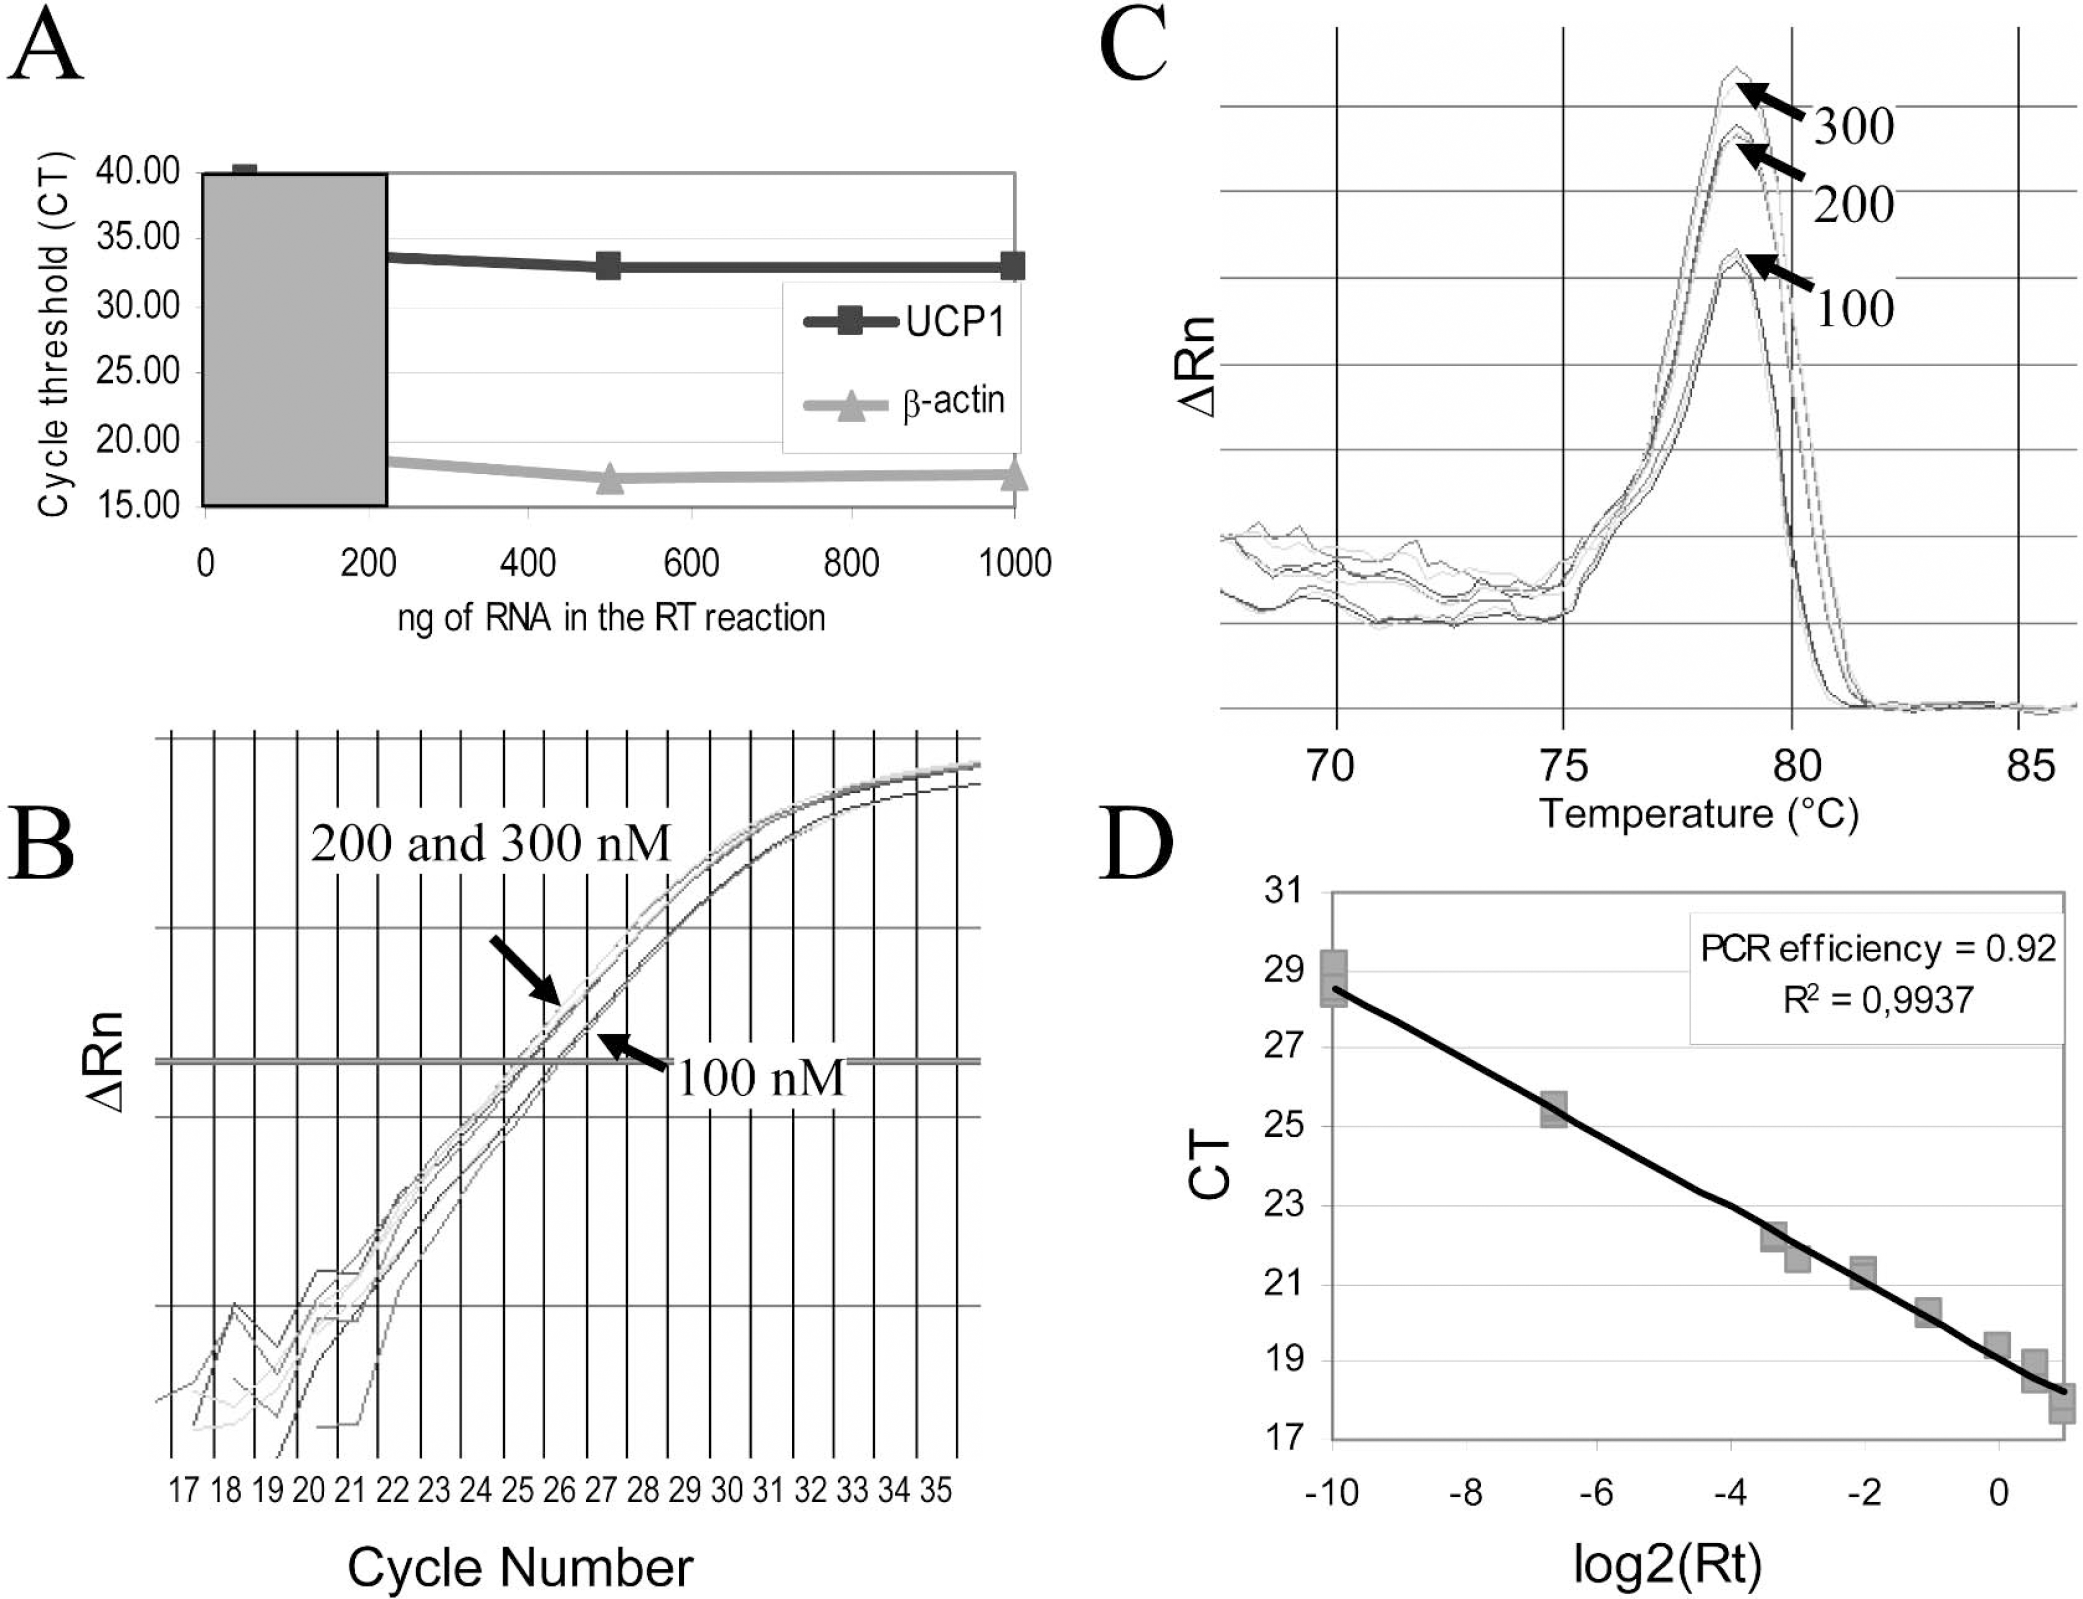
The first parameter to be determined in a QPCR procedure is the RNA concentration range in the RT reaction for which transcription efficiency remains near 100%. Thus, under optimal conditions, even mouse genes present at low expression levels would be reliably quantified. A series of reverse transcriptase reactions were performed with different amounts (10 ng to 1 μg) of total RNA in a final reaction volume of 50 μL. CT values obtained for either β-actin or UCP1 mRNA from brain cortex were found to decrease linearly up to 200 ng of total RNA (Fig. 1A). For any amount above 200 ng, CT values remained the same, suggesting that the RT reaction has reached its limit under the conditions used. Hence, the optimal range of total RNA to be used in the RT reaction is between 10 and 200 ng. The latter was chosen for subsequent investigations.
Conditions for RT-PCR. (
The next important point was the optimization of both primer design and concentration for the QPCR reaction. Primer sequences were chosen by aligning the mouse UCP nucleotide sequences obtained from the Mus musculus sequence database with the ClustalW (1.82) sequence alignment program from the European Bioinformatics Institute (Pearson and Lipman, 1988). Primer sequences were chosen to specifically amplify only one UCP isoform while the specificity of each sequence was subsequently tested against the Mus musculus sequence database using the BLAST program (Altschul et al., 1997). To determine whether unspecific product and/or primer—dimer formation occurred in the course of the QPCR reaction, dissociation curves were performed at three different concentrations for each primer pair; i.e., 100, 200, and 300 nmol/L (Fig. 1B). A single peak of fluorescence corresponding to the Tm of the specific amplified DNA must be obtained. Any unspecific product or primer—dimer formation would lead to peak signals at lower Tm and can be readily detected (Fig. 1C). After the primer titration optimization (Fig. 1B and Fig. 1C), the concentrations listed in Table 1 (showing the lowest CT and no unspecific product) were chosen for each target gene.
The PCR efficiency was assessed for all primer pairs by generating RT titration curves, such as that shown in Fig. 1D. CT values were first determined for a range of RT dilutions. Then, a graph representing the log2 of the dilution versus CT values was generated and the slope of the straight line obtained provided a measure of PCR efficiency. A slope of 1 means that PCR is 100% efficient, ensuring the doubling of the amplified target gene at each cycle. The PCR efficiency values are listed in Table 1. These efficiency values were used to subsequently correct copy numbers (as for example in Fig. 5).
For all determinations, amplifications were performed both with and without RT enzyme (Fig. 2A). This allowed the detection of eventual genomic contaminations. Genomic contribution is very small when copy numbers of the studied gene are abundant, but it can be important for mRNAs present in low quantities. For UCP2, UCP4, and UCP5, primer sequences were selected in the same exon. For these genes, genomic contributions to the signal were found to be 1.15% for UCP2, 2% for UCP4, and 0.5% for UCP5, as determined in brain cortex and in comparison with results obtained with –RT reactions (Fig. 2B). For UCP1 and UCP3, primers were designed to be in different exons, and this completely abolished amplification from genomic contaminations, as evidenced by the absence of amplification from –RT reactions (see the example in Figs. 2A andFig. 2B). The effectiveness of a DNase treatment on genomic contamination was also evaluated. Quantification on RNA treated or not with DNase was performed, and it was found that the DNase treatment completely abolished the signal due to genomic contaminations for all UCP isoforms. It was noticed, however, that all CT values were significantly lower compared with those obtained by subtraction of –RT values in the case of untreated samples (Fig. 3). Moreover, this decrease was variable from one gene to another, ranging from 25% to 47%, and it was also observed with UCP1 and UCP3 genes, which were previously shown not to display genomic contamination. Based on these observations, it was decided to work only on DNase-untreated RNA.
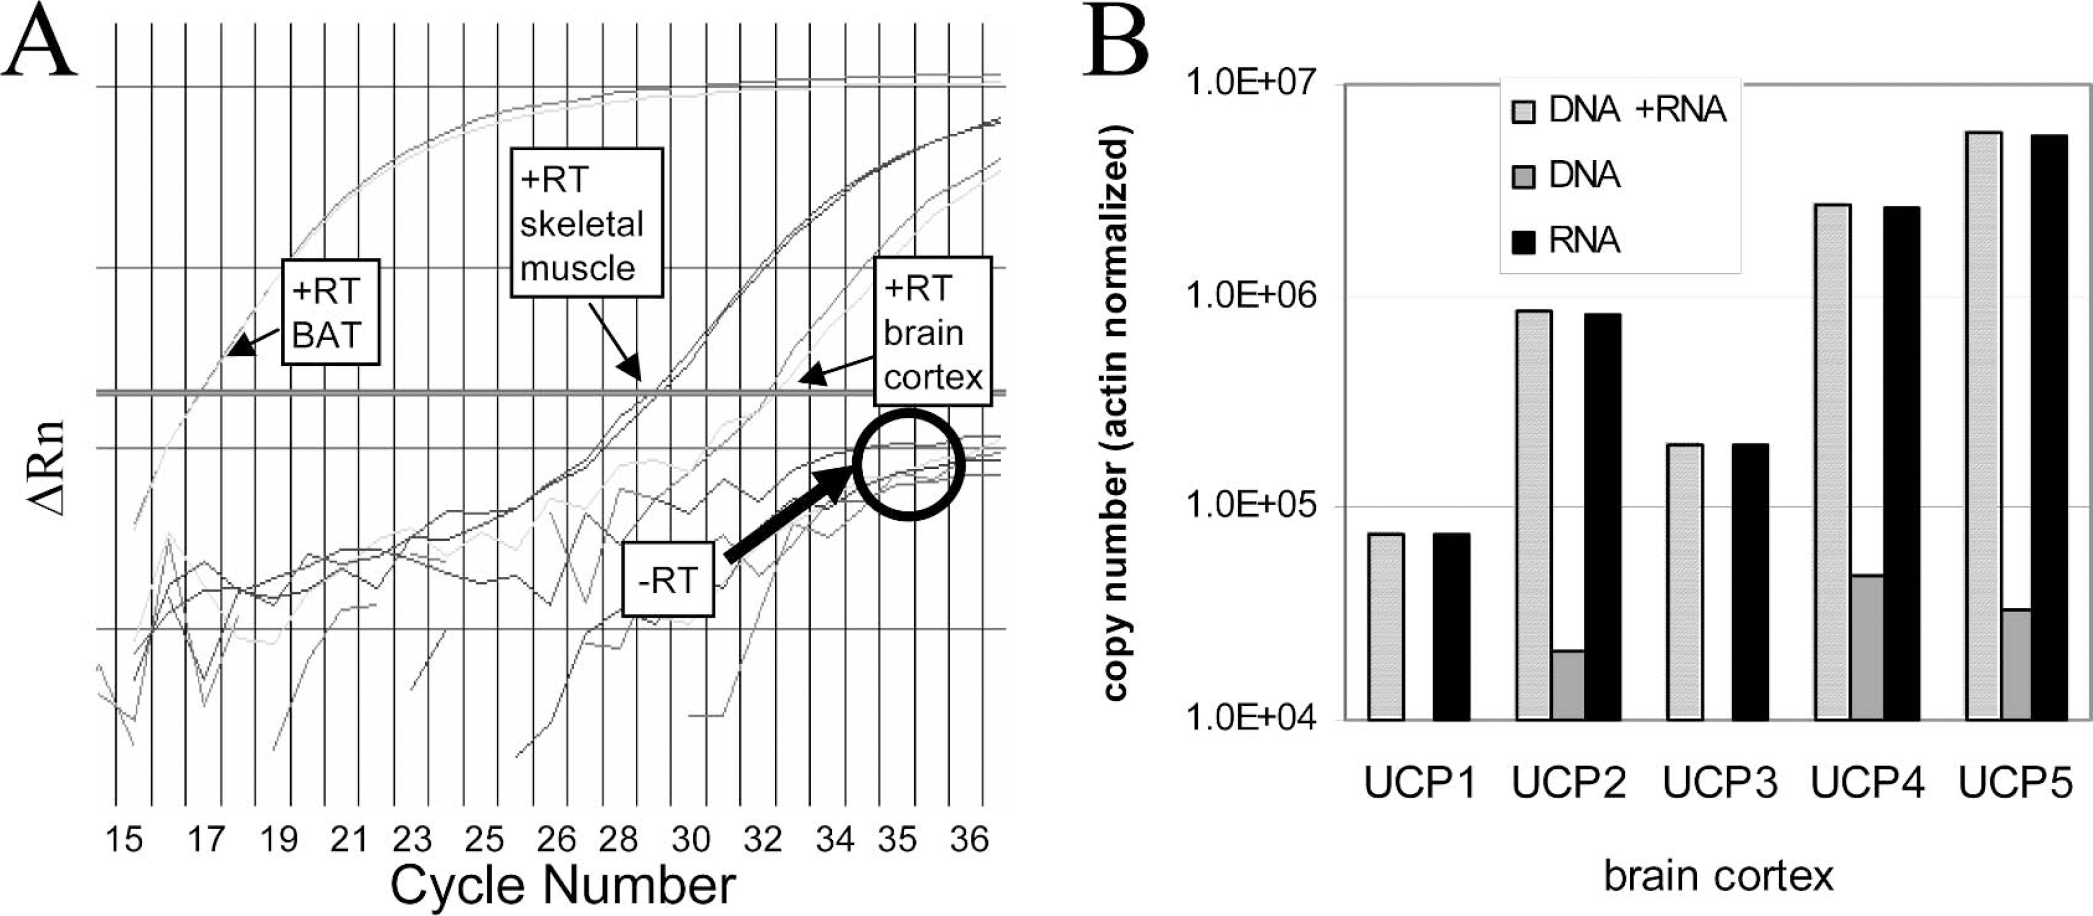
UCP1 amplification from brain cortex, muscle, and BAT reverse transcription done with total RNA extract. (
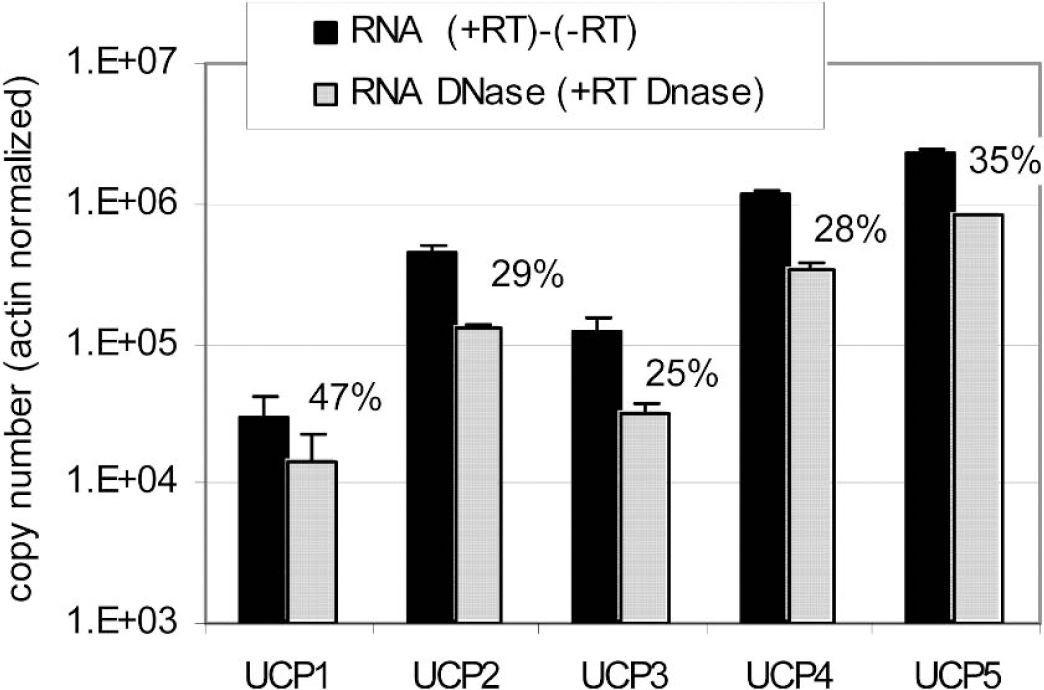
UCP amplification using total RNA from brain cortex treated or not treated with DNase. Black bars are copy numbers calculated from subtraction of –RT from +RT values. Gray bars represent relative copy numbers obtained from DNase-treated samples. No amplification was obtained with the –RT reaction when treated with DNase. Percentages represent the decrease obtained when samples are treated with DNase.
To select a reference gene with a stable pattern of expression among tissues, three different housekeeping genes (β-actin, cyclophilin, and HPRT) were compared on three RNA extracts (brain cortex, BAT, and skeletal muscle). CT values obtained in each tissue were used to generate plots relating the level of expression between two genes (Fig. 4). A linear regression was calculated from each plot. For each gene pair a correlation coefficient (R2) was obtained. Among the three pairs, the best correlation coefficients (closer to 1) were obtained when the β-actin gene was present. For this reason, β-actin was chosen as reference gene for normalization.
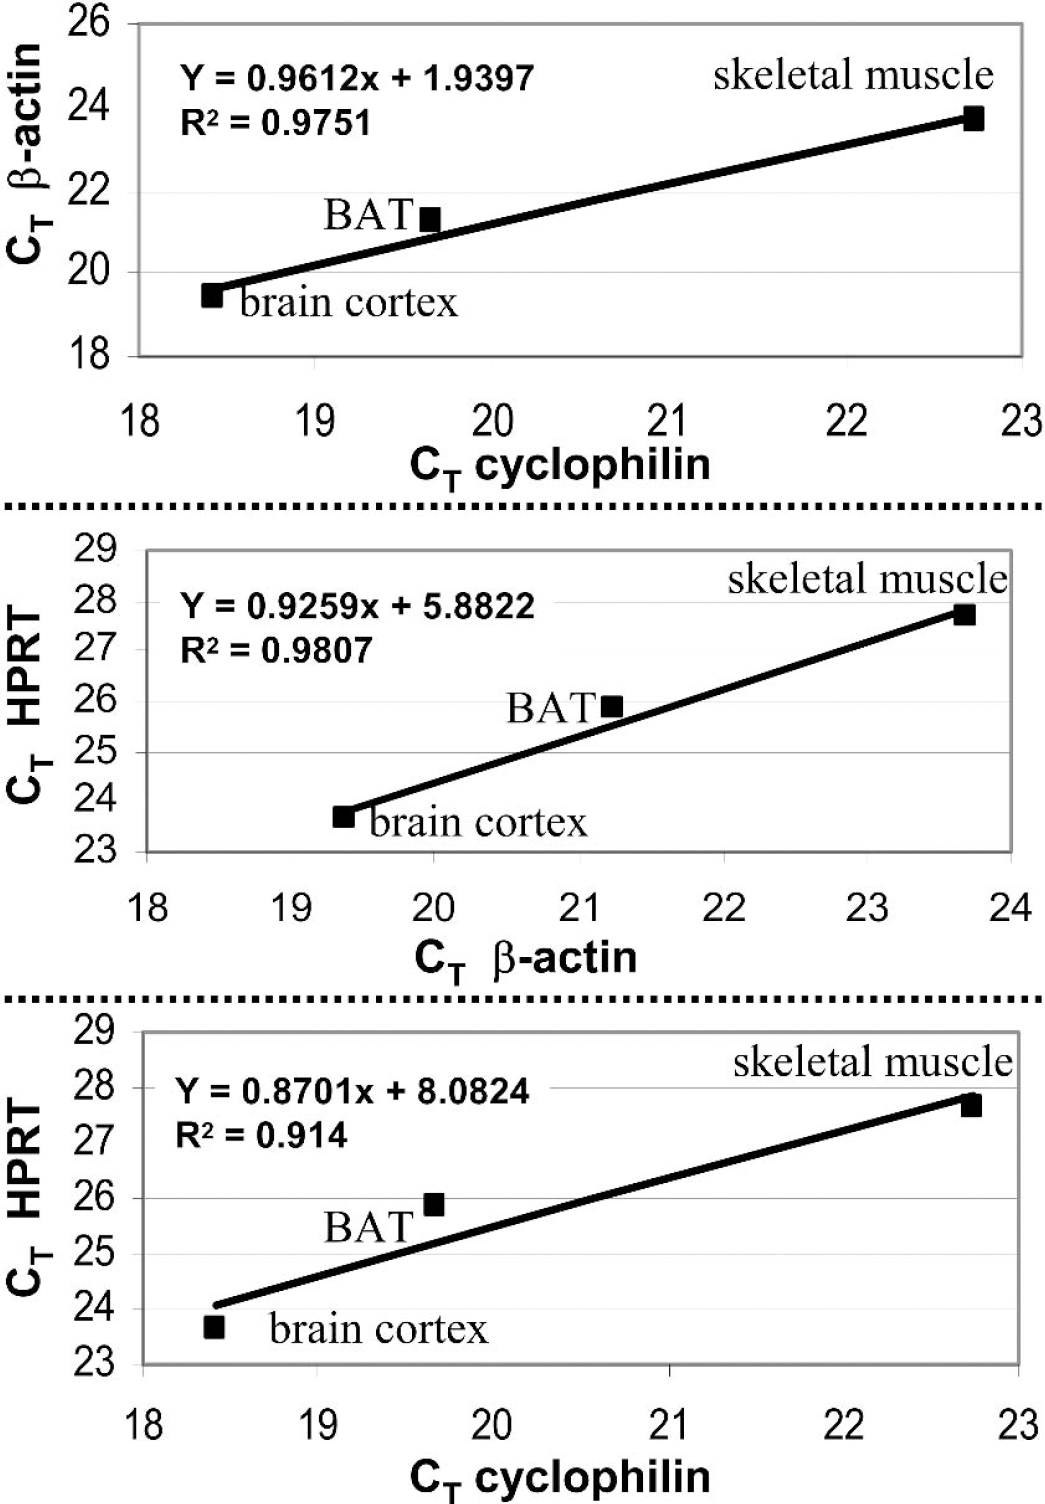
Paired CT values comparison of the three housekeeping genes investigated (HPRT, cyclophilin, β-actin) on each tissue RNA extract reverse transcribed. Correlation coefficient of the linear regression is indicated in each graph.
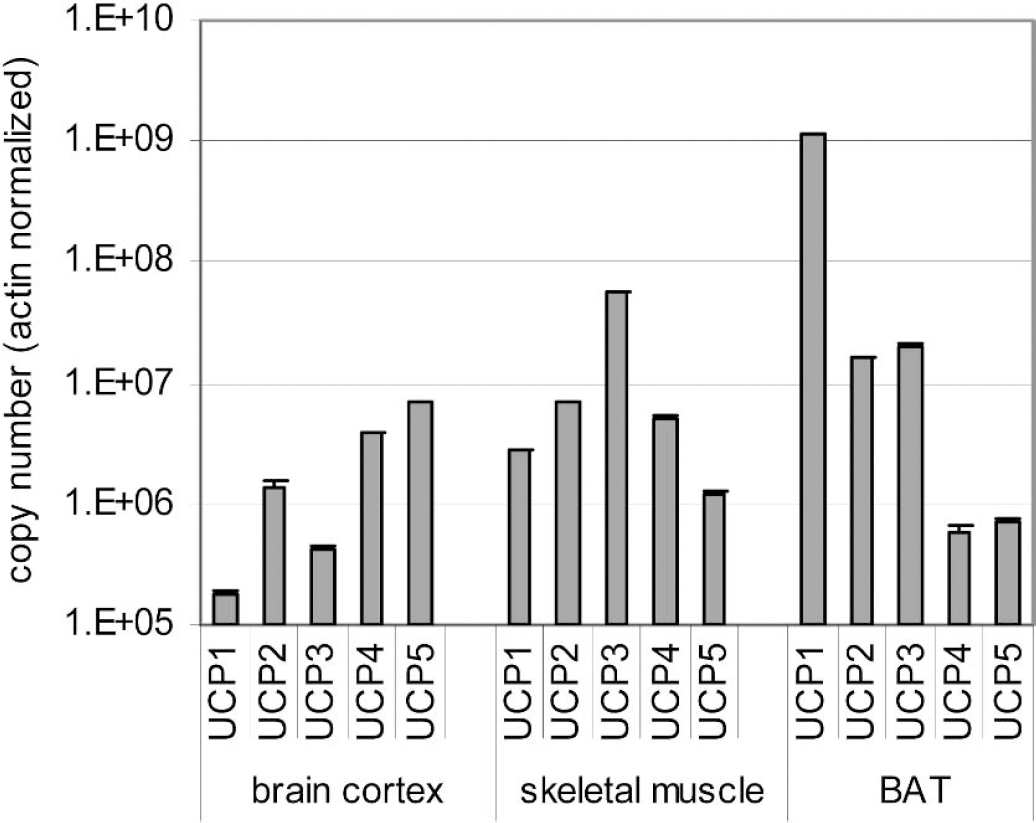
Semilogarithmic histogram representing absolute copy numbers for each UCP isoform in brain cortex, skeletal muscle, and BAT. Values were normalized using the β-actin gene. Each QPCR reaction was performed in triplicates. Copy numbers were corrected as if PCR efficiency was 100%. Total RNA of each organ used for the RT represents the sum of total RNA from six mice added equally in the reaction. Each QPCR experiment was repeated three times, using each time a new total RNA preparation, yielding similar results.
Finally, using the optimized QPCR protocol established above, mRNA copy numbers for UCP1 to UCP5 were determined in mouse brain cortex, BAT, and skeletal muscle (Fig. 5). In BAT, the UCP1 transcript was found to be the major UCP isoform mRNA, as expected. UCP1 mRNA represents 97% of all isoforms mRNAs present in BAT. UCP2 and UCP3 mRNAs were present at levels 100 times lower than for UCP1. UCP4 and UCP5 were also present but copy numbers for these two isoforms were 10,000 times less than for UCP1 in this tissue. In skeletal muscle, the major isoform expressed was UCP3 (78% of all isoforms). Copy numbers for UCP2 and UCP4 were comparable but 10 times less than for UCP3. UCP1 and UCP5 mRNAs were also detected but represented only 4% of all UCP isoforms for this tissue. In brain cortex, like in the other organs, the five isoforms were detected. UCP5 (also called BMCP1 for brain mitochondrial carrier protein-1) is the major isoform (approximately 54%), followed by UCP4 (30%). UCP2 mRNA is present at a level just slightly less than that found in skeletal muscle and BAT, thus confirming its ubiquitous nature. Copy numbers for UCP3 and UCP1 in brain cortex were very small in comparison with the other UCP isoforms, but they were still detectable.
DISCUSSION
Quantification of mRNA by QPCR represents a major technical progress compared with previously available techniques, such as Northern blots. To take advantage of this sensitive method however, a number of critical steps must be carefully controlled. First of all, conditions for the RT reaction need to be optimized to obtain near 100% of reverse transcription. As recognized previously (Bustin, 2002), some of the parameters that will determine RT efficiency include reaction temperature, choice of enzyme, and amount of template in the reaction. This last point is critical, because oversaturating the reaction with too much RNA would lead to unreliable transcription, causing variations in the level of transcription between different genes. This phenomenon would be particularly important for rare genes. Although increasing the amount of template RNA will improve the quantification of poorly expressed genes, contribution to the signal from genomic contamination will also increase with the quantity of template added in the reaction. These two aspects must be taken into consideration when determining the best concentration of total RNA to be used without saturating the RT reaction. The choice can be guided by CT obtained for a highly expressed gene and a less abundant one in RTs containing various amounts of total RNA. As exemplified here for β-actin and UCP1 mRNAs in brain cortex, the lowest RNA concentration that still gives the highest CT values for both genes usually represents a good initial choice. The choice of enzyme for the RT reaction is also important, as acknowledged previously (Alfonso et al., 2002). The Multiscribe enzyme from Applied Biosystem was used for the RT reaction in the current study because this enzyme represents a good compromise, displaying important activity at 48°C. There are several other enzymes active at higher temperatures, which would avoid secondary structure problems, or displaying a better sensitivity, but no better enzyme combining these two optimal features was found. Although the use of a standardized procedure for the RT reaction that takes into account the previous points usually resolves the problems of reproducibility, variations can still appear when one compares different tissues. This is often related to the amount and purity of the extracted RNA that can vary from one tissue to another depending on the purification method used (Bastard et al., 2002). Commercial kits for RNA extraction have improved the procedure, but attention is still required to ensure that cells are broken to a sufficient extent in each case (Bastard et al., 2002).
Primer design is obviously another important point to consider before performing QPCR, especially when it is necessary to distinguish between different isoforms of a protein family with high sequence homology among its members. The ClustalW 1.82 (Pearson and Lipman, 1988) sequence alignment program, accessible via the Internet from the European Bioinformatics Institute, was used for this task. What makes design more problematic than usual, however, is that all primers need to meet the same criteria (melting temperature of 59°C, GC content above 40%, no dimer formation). If respected, the standard cycling protocol set by the supplier can be applied. The advantage of this procedure is that any set of genes can be combined without changing the cycling parameters. A reduction in genomic contamination signal can be achieved when primer design is made such that it comes across an exon—exon junction. This approach, however, can be applied only for genes whose genomic organization has already been described in a database, and this is not yet the case for all described mRNAs. For reasons related to constraint imposed by primer specificity, as well as exon mapping, the design of primers in different exons was possible only for UCP1 and UCP3. Although it could not be done for UCP2, UCP4, and UCP5, genomic contribution for these three isoforms was evaluated by comparison with –RT reactions and found to be negligible. This procedure was more satisfactory than DNase treatment. Indeed, DNase treatment decreased copy numbers even for UCP1 and UCP3 genes, despite the fact that primer design should have abolished signal from genomic DNA. Even worse, the extent of decrease varied among transcripts. Other authors previously reported that DNase treatment abolished the genomic contamination signal, but they did not mention whether this treatment had an effect on copy numbers for their tested genes (Vandesompele et al., 2002a). Thus, it is recommended to use an approach based on a comparison with –RT reactions for all genes for which primers could not be designed in different exons.
Once primer sequences have been established, their most efficient concentration must be determined. This was done by running the reaction with various primer concentrations and from the observation of dissociation curves, the concentration that gave the lowest CT value without leading to any unwanted additional peak that would be the sign of primer—dimer formation was chosen. This control step is important because any unspecific amplification will give a signal that cannot be discriminated from the specific signal with the SYBR Green dye. Then, using the chosen primer concentration, an efficiency curve with various RT dilutions was plotted to calculate the coefficient of efficiency for each pair of primers. The optimal coefficient would be equal to 1, meaning a duplication at each cycle of the template copy. It is important to note that the correction for PCR efficiency increases with the number of cycles (Pfaffl et al., 2002). An extreme example here is the comparison between UCP1 in BAT (CT = 31.5) and in brain cortex (CT = 17.3). The correction level between these two samples is about 15%, but compared to the expression difference (9999.8%) of this gene in these two tissues, the correction becomes negligible. Such a correction is nevertheless important here because we wanted to report absolute copy numbers. Another important point to note is that efficiency factors found here are relatively similar among them, such that without corrections, a similar bias would be introduced in all values. Comparing genes displaying very different PCR efficiency could introduce serious biases and this aspect must be taken into account when comparing any set of genes. Conversion of CT values into absolute copy numbers for comparison purposes was made using a standard curve that was established from plasmid dilution series. This method of calculation was adopted instead of the more practical ΔΔCT method (Livak and Schmittgen, 2001) because the latter requires a control condition as reference, which was not possible here with comparison of expression levels among tissues.
Data normalization is necessary to compare data obtained from different samples and this can be made by different means. The number of cells, the amount of RNA (Vandesompele et al., 2002a), or an internal control gene (Macdonald et al., 2001; Medhurst et al., 2000; Vandesompele et al., 2002b) can be used for normalization. The number of cells is not applicable with excised tissues, whereas the amount of RNA is not necessarily reliable because the presence of DNA or proteins can interfere with the measure of RNA extracted from tissues. Normalization of RNA copy numbers with an internal control gene known to be stable during the experiment represents an effective procedure to correct for any difference in RNA levels due to experimental errors (Thellin et al., 1999; Vandesompele et al., 2002b). To be reliable, however, an internal control gene must be of the same type of RNA as the target genes; i.e., mRNA if targets are mRNAs, such that purification efficiency remains similar. It would be also better if target and control genes are in the same range of copy numbers to ensure similar efficiency for the reverse transcriptase reaction. Obviously, a critical issue is that expression of the internal control gene needs to be constant and should not vary even in the case where a treatment is applied. Unfortunately, some classical housekeeping genes used as internal controls have been described to vary depending on the treatment or conditions tested (Bustin, 2000). To find the best reference gene for the present study, we made pair comparisons between three classical housekeeping genes: β-actin, cyclophilin, and HPRT. If stable, copy numbers for these three genes would be expected to correlate among the three organs tested. In contrast, variation in expression of one of these genes would be reflected in a decrease in the correlation coefficient when these genes are considered in pair comparisons. This approach led to the conclusion that the best-suited gene for use as an internal control was (β-actin. Although this is true for the present study, it might not be the case under different conditions (e.g., other tissues, specific treatments), and the suitability of β-actin would then need to be reevaluated.
After optimization, the quantitative RT-PCR procedure was applied to establish the expression profile of the five known UCP isoforms in brain cortex and two other selected tissues, BAT and skeletal muscle. Partial information about the expression of UCP isoforms in these tissues had been obtained previously by other methods like Northern blot or immunoblots (for review, see Macdonald et al., 2001; Ricquier and Bouillaud, 2000). UCP1 was found to be highly expressed by BAT (Ricquier and Bouillaud, 2000). UCP2 had a ubiquitous distribution but displays different levels of expression among tissues i.e. BAT > brain > muscle (Gong et al., 1997; Mizuno et al., 2000; Ricquier and Bouillaud, 2000). UCP3 was predominantly expressed in muscle (Gong et al., 1997; Ricquier and Bouillaud, 2000). Finally, UCP4 and UCP5 (also designated as BMCP1) were described as being major brain isoforms (Mao et al., 1999; Yu et al., 2000). Our analysis not only confirmed most of these findings, but also further extended them. First, all five isoforms were detected in brain as well as in the other tissues, in contrast to previous reports, suggesting a wider distribution than previously thought for most UCP isoforms. The pattern of expression was strikingly different among these three tissues, and precise quantitative relationships could be established among UCPs within the same tissue, as well as for each UCP between different tissues. It is necessary to be cautious, however, because mRNA expression levels are not necessarily a direct reflection of protein expression and/or activity, especially for UCPs that are well known to be both translationally regulated (Pecqueur et al., 2001; Ricquier et al., 1991) and subject to modulation of their activity by fatty acids and by free radicals (Matthias et al., 2000). Nevertheless, indications provided by quantitative RT-PCR suggest a quite intricate picture specific for each organ, with different isoforms possibly fulfilling different roles. In addition to the well-described implication of UCP1 in thermogenesis as observed in BAT, new roles for UCPs have started to emerge, and some of them could be particularly relevant for the central nervous system. Their role in the control of reactive oxygen species production (Arsenijevic et al., 2000), in the regulation of neurotransmitter release (Yamada et al., 2003), as well as in muscle contractility (Nibbelink et al., 2001), and more generally in a number of ATP-dependent processes in various tissues (Erlanson-Albertsson, 2003), has been suggested. Furthermore, it is not excluded that the level of expression of each of these UCPs could be selectively modified by various stimuli to produce the appropriate UCP isoform for a special need. For this purpose, application of the quantitative RT-PCR procedure established here on diverse preparations of the central nervous system promises to be very helpful to investigate these aspects in the near future.
Footnotes
Acknowledgments
The authors thank Maude Marti for excellent technical assistance and Dr. Igor Allaman for critical comments made on the manuscript.