
Abstract
Repeated functional magnetic resonance imaging (fMRI) during learning and recovery can inform us about functional reorganization in the brain. We examined how, in the absence of reorganization, simple task repetition affects measures of fMRI activation. We studied fMRI activation over 10 consecutive sessions of silent word generation in a healthy subject. Additionally, we performed functional transcranial Doppler sonography (fTCD) to learn about the temporal pattern of corresponding changes in cerebral blood flow velocity (CBFV) and pulsatility. With repetition, word generation-associated increases in heart rate diminished steadily. Task repetition also led to a net increase in CBFV bilaterally and to a bilateral increase in the number of activated voxels on fMRI. As a result, whereas the absolute interhemispheric difference of activated voxels remained constant, there was a decrease in the standard fMRI index for language lateralization [LIfMRI = 100 (activated voxels in left hemisphere - voxels in right)/(voxels in left + voxels in right)]. Thus task repetition can lead to changes in task-related autonomic drive and an augmentation of bihemispheric blood flow. This can mimic increasing bilaterality of brain activation.
Keywords
Functional magnetic resonance imaging (fMRI) and positron emission tomography (PET) can be used to map cerebral reorganization during recovery of function in patients after stroke (Cao et al., 1999; Gold and Kertesz, 2000; Musso et al., 1999; Rosen et al., 2000). Thus increased bilaterality of language related brain activation has been observed in serial studies after stroke to left hemisphere language regions (Silvestrini et al., 1993; Weiller et al., 1993). This increased bilaterality has been speculated to be the result of a transhemispheric reorganization recovery (Thulborn et al., 1999). It could constitute a major basis for language recovery (Weiller et al., 1995). To better understand transhemispheric reorganization, patients need to be scanned at different time points during recovery. This way, we have a chance to observe functional brain repair online. However, care must be taken not to confuse repair-specific changes in brain activation with cerebral blood flow changes associated with repeated scanning.
Activations on fMRI are affected by a number of factors, which may change from one session to another (McGonigle et al., 2000). These factors include technical ones, like magnetic field inhomogenities, and physiologic ones, like autonomic drive, arousal, attention, and strategy. Therefore, the reproducibility of fMRI activation patterns within sessions or between two or more sessions is variable (DeYoe et al., 1994; Gozal et al., 1994; Karni et al., 1995; Loubinoux et al., 2001; Noll et al., 1997; Ramsey et al., 1996; Rombouts et al., 1998; Silva et al., 1999; Tegeler et al., 1999; Yetkin et al., 1996).
To circumvent confounding variations in cerebral blood flow or blood oxygenation level dependent (BOLD) signal, data are frequently normalized. For example, in studies on the interhemispheric reorganization of the language system after stroke, interhemispheric differences in activation are mostly related to the total (bihemispheric) number of activated voxels. The formula used is as follows: (activation in the left hemisphere – activation in the right hemisphere)/(activation in the left hemisphere + activation in the right hemisphere) (Lehericy et al., 2000; Vikingstad et al., 2000). The assumption underlying the use of this formula is that global, that is, bihemispheric signal changes, will cancel out.
In the present study, we challenged this approach by repeating fMRIs during word generation over a total of 10 sessions. To learn about the dynamics of blood flow changes in the supplying arteries during the language task, we additionally measured the cerebral blood flow velocities (CBFV) in the middle cerebral arteries (MCA) by functional transcranial Doppler ultrasonography (fTCD. For a review of the technique see Deppe et al. (1997) and Stroobant and Vingerhoets (2000).
METHODS
Functional MRI and functional TCD were performed in a single subject over 10 consecutive sessions within 2 months with variable intersession intervals. During each session, the subject was examined by fMRI and fTCD using a silent word generation task (see below for details). For each fMRI session, the number of activated voxels and two types of language lateralization indices (LIfMRI and LIfMRI-%) were calculated. During each fTCD session, the CBFV changes in the insonated MCAs during task performance relative to rest condition and the fTCD language lateralization index (LIfTCD) were assessed (see sections below).
Subject
One healthy German-speaking female (24 years of age) participated in this study after giving informed consent. A small hourly expense allowance was paid. The subject was righthanded according to the Edinburgh Handedness Inventory (degree of handedness = +69) (Oldfield, 1971).
Functional magnetic resonance imaging.
Word generation.
For language activation, the subject was required to silently find as many words as possible beginning with a given letter (A, O, L, B, D, and E). Task commands and letter stimuli were presented acoustically using a nonmagnetic headphone. The acoustical letter presentation time was 0.5 seconds. During the resting state, the subject was requested to relax and received no further instructions.
The fMRI session was designed according to a classical “boxcar” paradigm. The first five images of each fMRI session were discarded to account for saturation effects of the MR signal. The fMRI scanning sequence then comprised three activation intervals of silent word generation (SWG-I, -II, -III) separated by two resting periods (R-I, -II). To control for compliance, the last activation interval (SWG-III) was followed by a speaking interval (SP) in which the subject was requested to report the words aloud she found in the previous activation interval (SWG-III). Each activation interval and resting period covered 10 image acquisitions. In the speaking interval (SP), five images were acquired. The scanning sequence was performed three times in succession. Thus, in the whole fMRI session, a series of 3 ϗ (10 + 10 + 10 + 10 + 10 + 5) = 165 images were acquired.
Functional magnetic resonance imaging data acquisition.
FMRI sessions were performed on a 1.5 Tesla Magnetom Vision scanner (Siemens; Erlangen, Germany) using a circular polarized head coil. Data acquisition was conducted using echo planar imaging sequence [EPI; echo time (TE) 64 ms; repetition time (TR) 3 seconds; flip angle 90°; 64 × 128 pixel acquisition matrix, reconstructed to 128 × 128 pixel; 210 mm × 210 mm field of view; slice thickness 3 mm; slice gap 0.75 mm] for functional imaging. Ten axial slices at a distance of 3.75 mm were acquired oriented parallel to the intercommisural plane. Additionally, 10 T1-weighted images (TE 15 ms; TR 350 ms; flip angle 90°) in the same orientation of the EPI planes were acquired to facilitate the anatomic assignment of the functional images.
High-resolution T1-weighted reference images in sagittal scanning direction (MPRAGE sequence; 256 mm × 256 mm field of view, slice thickness 1 mm, voxel size 1 mm × 1 mm × 1 mm, TR 11.4 seconds, TE 4.4 seconds, flip angle 15°) were additionally obtained to relate the activation pattern to neuroanatomic structures. Standardized head fixation devices for clinical sessions (head and neck padding) were used to reduce head motion artefacts.
Functional magnetic resonance imaging data analysis.
Image preprocessing and statistical analyses were performed using the SPM99 software package (Wellcome Department of Cognitive Neurology, London, UK). SPM was used for realignment, coregistration, smoothing, and creating statistical maps of significant relative regional BOLD response changes (Friston, 1995a, b ).
The first five images of each time series, during which the MR signal reaches a steady state, were omitted from further analysis. All other functional images were realigned using sinc interpolation to the first remaining image (corresponding to the sixth acquired image) to correct for motion artefacts. A mean functional image was calculated from the realigned images. Subsequently, the functional images were smoothed using a Gaussian kernel of 4 mm × 4 mm × 9 mm (FWHM) corresponding to an anisotropic voxel size of 1.64 mm × 1.64 mm × 3.0 mm. The anatomic image was coregistered to the mean functional image.
The functional data from each session were analyzed using a general linear model approach as implemented in SPM99. A reference waveform corresponding to the alternating activation and control conditions was constructed and convoluted with an estimate of the hemodynamic response function. Specific effects were tested by applying appropriate linear contrasts to the parameter estimates for the experimental condition, resulting in a t-statistic for each voxel. Voxels were identified as significant if they passed a P value of 0.001 uncorrected and belonged to a cluster of activation with an extent of at least 10 voxels. The significance level of P = 0.001 (uncorrected) was selected because it represented the P value where the language lateralization index LIfMRI (see below) showed the maximal reproducibility and was nearly independent of moderate changes in P. If, for example, P = 0.05 (corrected for multiple comparisons) was applied, the longitudinal reproducibility of LIfMRI decreased.
Functional magnetic resonance imaging lateralization index.
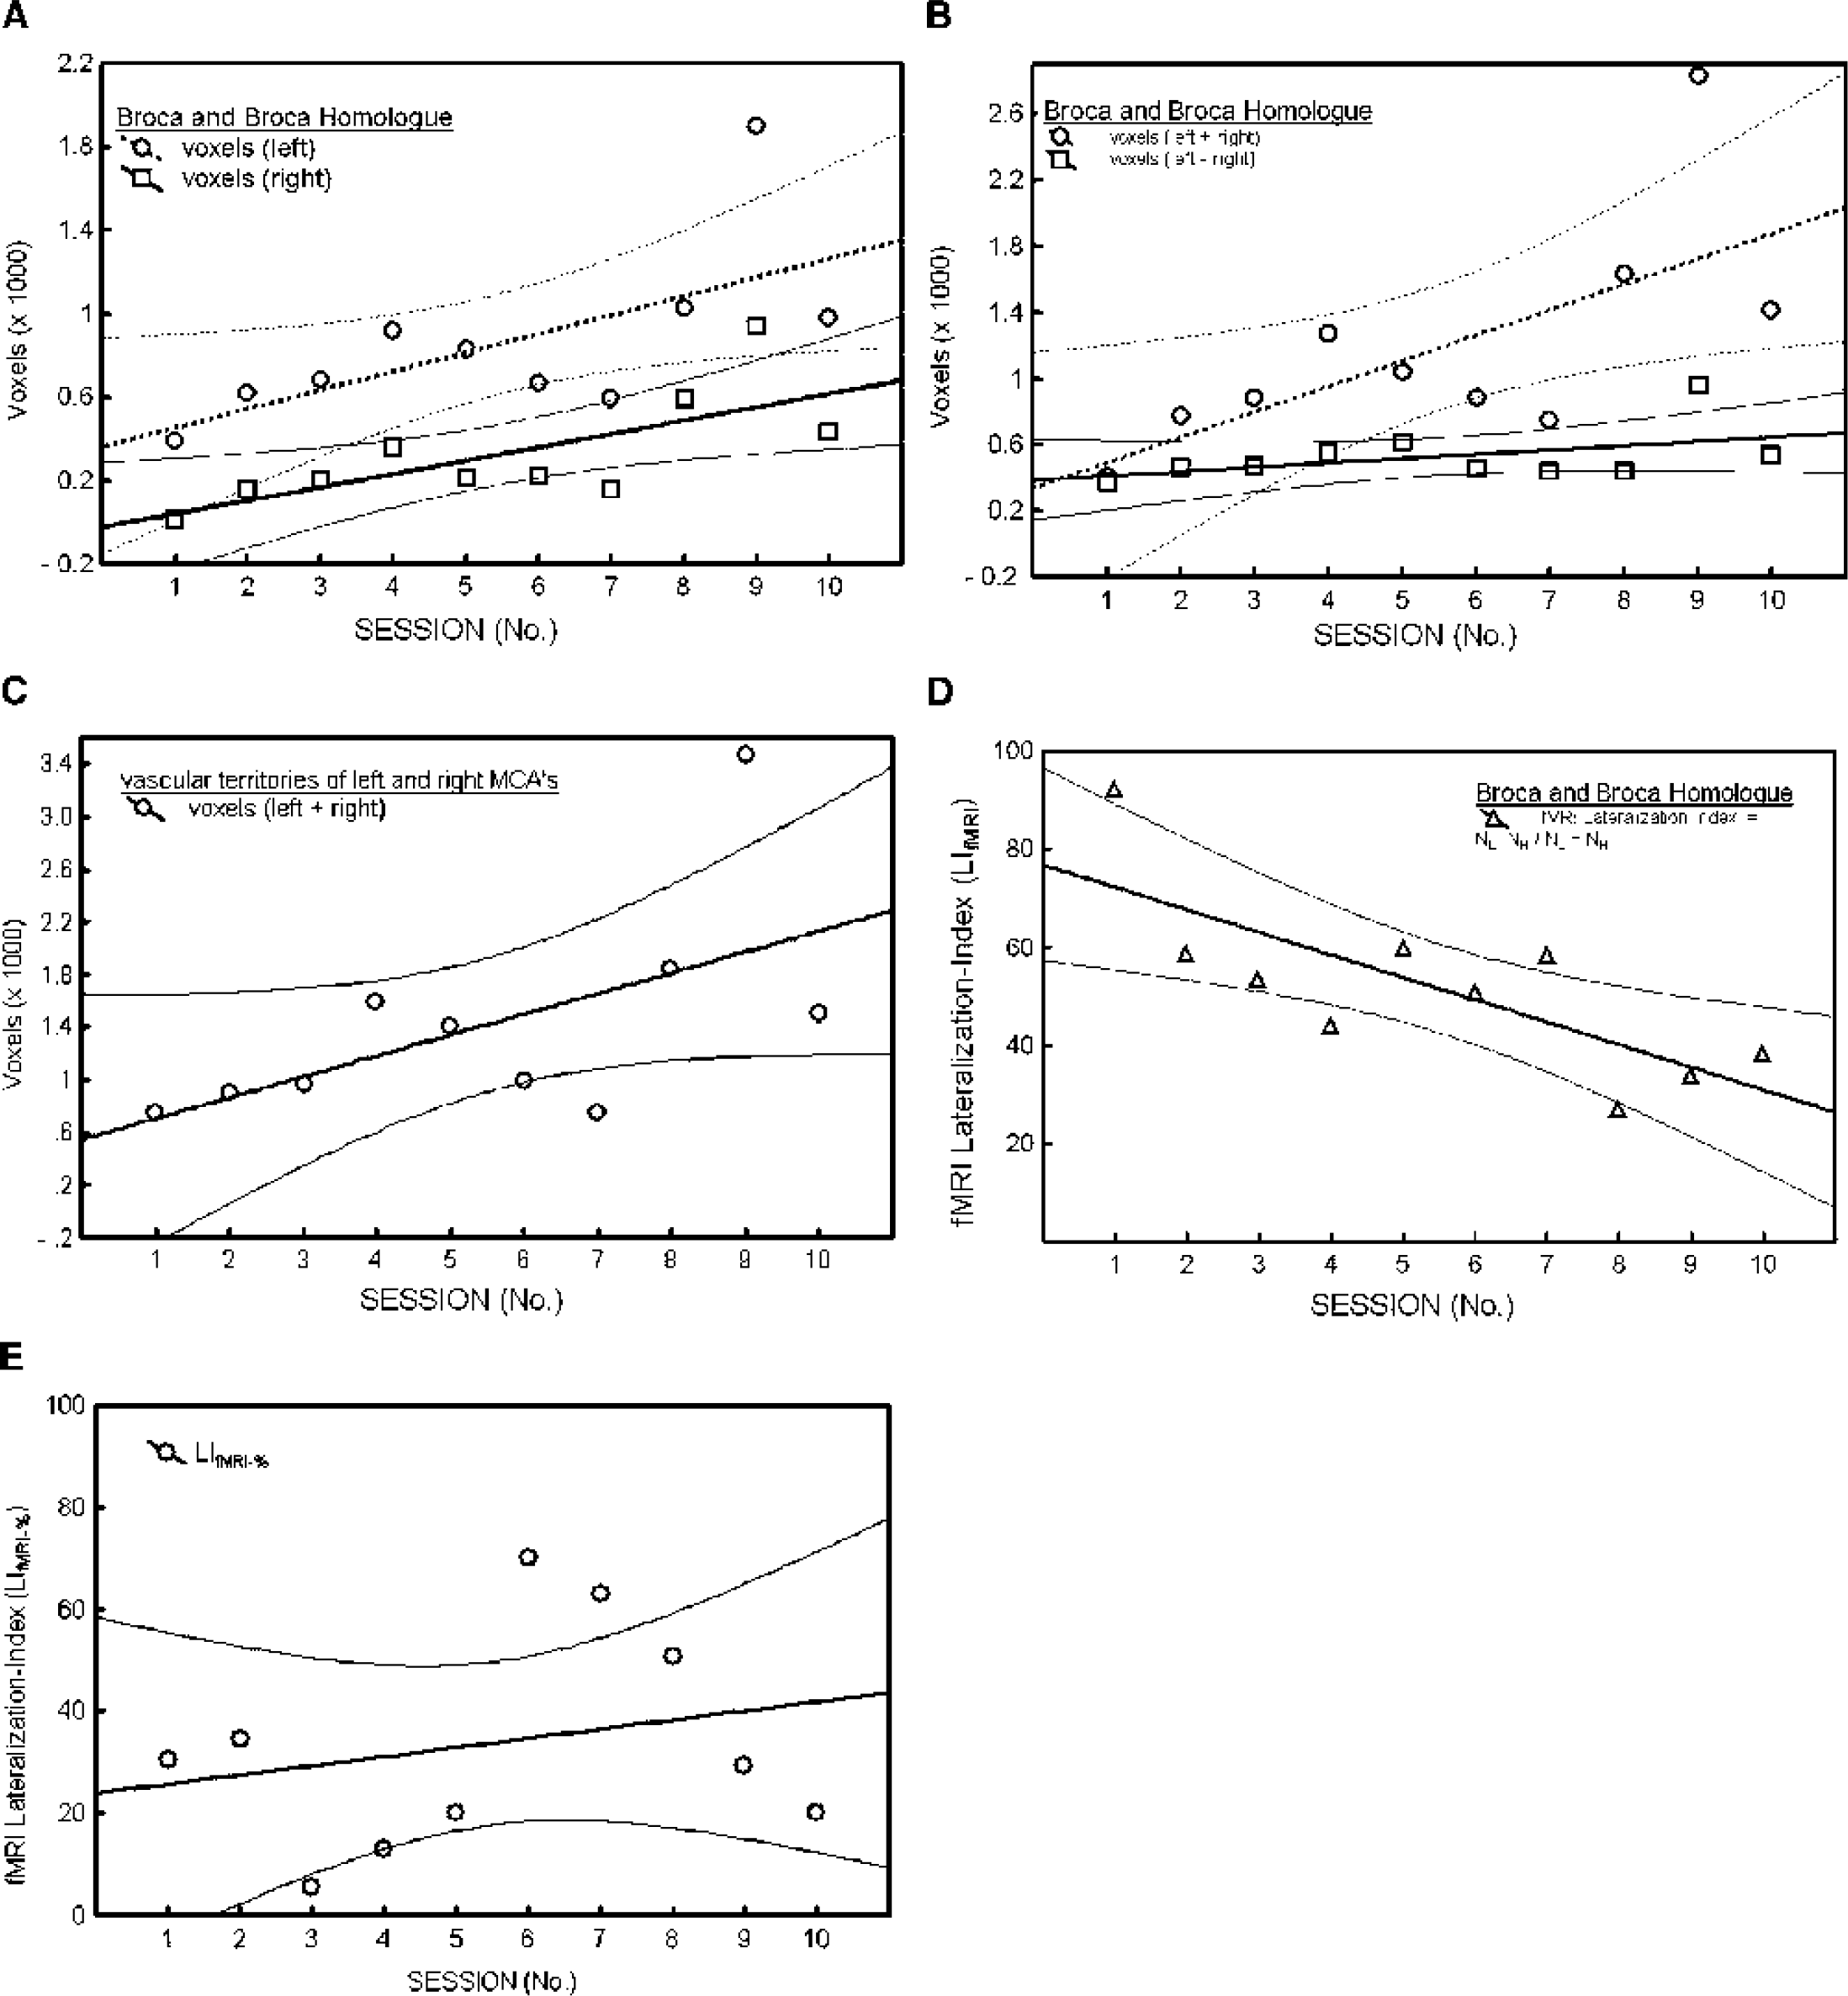
The calculation of the functional magnetic resonance imaging lateralization index (LIfMRI) was based upon the activated voxels within a specified region (see below). The LIfMRI was calculated for each session by the following formula:
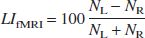
where NL and NR refer to the number of activated voxels within the regions of interest (ROI). Positive values indicate increased numbers of activated voxels in the left hemisphere relative to the right hemisphere and thus reflect left-hemispheric dominance and vice versa.
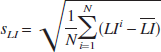
Two different ROIs were defined. First, all activated voxels in the whole brain (without cerebellum) were accepted to determine global brain activation. Second, language-related ROIs were defined for the experimental task: Based upon experiences from previous fMRI language lateralization studies using word generation tasks, language-related ROIs were restricted to the anterior section of the vascular territory of the MCAs (see Fig. 1). Anatomic landmarks identified in T1-weighted images acquired before functional scanning guided the determination of the language-related ROIs. ROIs comprised areas surrounding the inferior frontal gyrus, including the classical Broca's area and their contralateral homologues (Binder, 1997; Binder et al., 1997).
Functional magnetic resonance imaging lateralization index based upon percentage signal change.
A second fMRI lateralization index (LIfMRI-%) was calculated according to Equation 1, but the number of activated voxels was replaced by the mean change of the BOLD signal within two spherical ROIs of 20 mm diameter within the left and right hemispheres. The center of the left ROI was adjusted to the center of mass of the most significant cluster corresponding to Broca's area (BA 44/45). The position of the right ROI (contralateral homologue of Broca's area) was determined by mirroring the left ROI to the right hemisphere.
Functional transcranial Doppler sonography
Word generation
The hemispheric language lateralization was assessed by a standardized word generation task used in a number of previous studies and validated by direct comparison with the Wada procedure (Deppe et al., 2000; Knake et al., 2003; Knecht et al., 1998; Wada and Rasmussen, 1960). In short, during the fTCD session, the subject was expecting a target letter on a computer screen 5 seconds after a cueing tone. The subject was instructed to then silently generate as many words as possible with the given letter within 15 seconds (silent word generation phase). For control, the subject was requested to report the words aloud after a second cueing tone. A third tone initiated a resting phase of 30 seconds. Each session consisted of 20 trials. Each trial began with a different target letter. The order of the target letters was randomized. The letters “X” and “Y” were excluded from presentation.
Data recording.
During the word generation task, the event-related cerebral blood flow velocities (CBFV) in both MCAs were recorded using a 2 MHz-pulsed Doppler device (DWL Multi Dop T; Siplingen, Germany). The transducer probes were attached to a headband and fixed at the temporal bone windows bilaterally. The spectral envelope curves of the Doppler signal of both MCAs were recorded at a sample rate of 28 points per second. The data were stored for further data analysis. Further technical details and information about practical techniques of the sonographical assessment have been published elsewhere (Ringelstein et al., 1990).
Data analysis.
Offline data analysis was performed by the computer program AVERAGE, a software package for functional CBFV data analysis introduced by one of the authors (Deppe et al., 1997). Data analysis involved several processing steps, that is, artefact reduction, filtering, cardiac integration, and normalization of the data. The continuously acquired data set of 20 trials was segmented into 20 epochs related to the onset of the cueing tone. The epochs range from 15 seconds before to 35 seconds after the first cueing tone. The mean velocity in the 15-second precueing interval (Vpre.mean) was chosen as the CBFV baseline value in the resting phase. Relative changes of the CBFV (dV) in the word generation task were calculated by the formula:
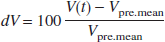
where V(t) is the CBFV over time.
Functional transcranial Doppler sonography lateralization index.
The Functional transcranial Doppler sonography lateralization index (LIfTCD) was computed by the following formula:
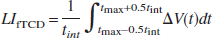
where

was the difference between the relative CBFV changes in the left and right MCA. The time point tmax represents the latency of the absolute maximum of V (t) within the word generation interval (5 to 22 seconds). As the integration interval, a time period of tint = 2 seconds was chosen. The LIfTCD defines the maximum of relative CBFV changes in a preset period within the silent word generation phase in comparison with the CBFV baseline. A positive value of the LIfTCD represents a relative increase of the CBFV in the left MCA during the word generation phase and vice versa. Thus a positive value of LIfTCD indicates left hemispheric language processing.
Accuracy.
The coefficients of variability (CV) for all three lateralization indices (CVfMRI, CVfMRI-%, and CVfTCD) were defined by the following formula:

where
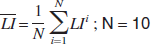
is the mean of all 10 consecutively measured LIs and
is the corresponding standard deviation. A lower CV represents lower relative variation of the LIs assessed by one method and thus better accuracy.
Cardiovascular parameter.
During the fTCD sessions, the heart rate was monitored to assess changes in cardiovascular drive. This was accomplished by a program option offered by the software AVERAGE (Deppe et al., 1997).
Statistical analysis
Linear regression functions (Spearman's R, two-tailed) were computed to examine the time dependency (independent variable) of the following parameters (dependent variables):
Number of activated voxels in the defined ROIs (see Figs. 3A–C)
Degree of two fMRI lateralization indices (LIfMRI and LIfMRI-%) (see Figs. 3D–E)
Changes in the heart rate during fTCD task performance relative to rest (see Fig. 5 and Table 2).
Language task-related regions of interest: the vascular territories of the three basal cerebral arteries are indicated in green (middle cerebral artery), red (anterior cerebral artery), and blue (posterior cerebral artery). The anterior sections of the vascular territory of the middle cerebral arteries (areas marked in linked grey bars) were defined according to the program VOXELMAN (Höhe, 1997).
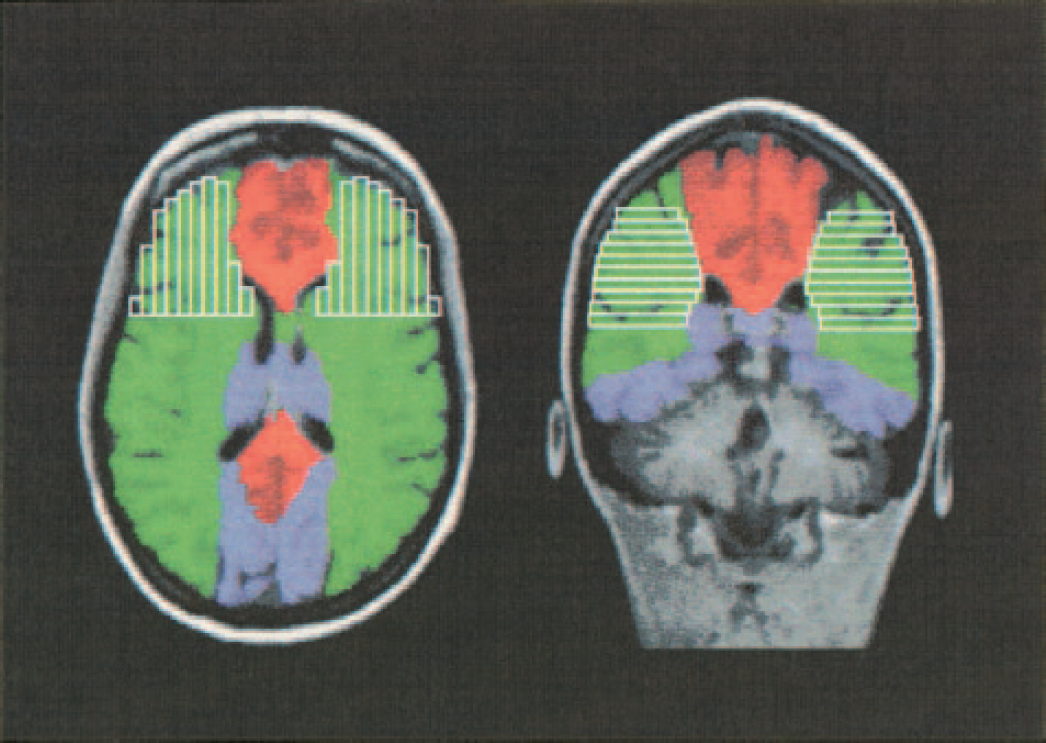
Distribution of activated voxels during word generation in every second (1, 3, 5, 7, and 9) session, illustrated by one identical functional axial slice: there is a clear left-sided asymmetry of activated voxels and a clustering within Broca's area, superimposed by an increasing bilateral activation.
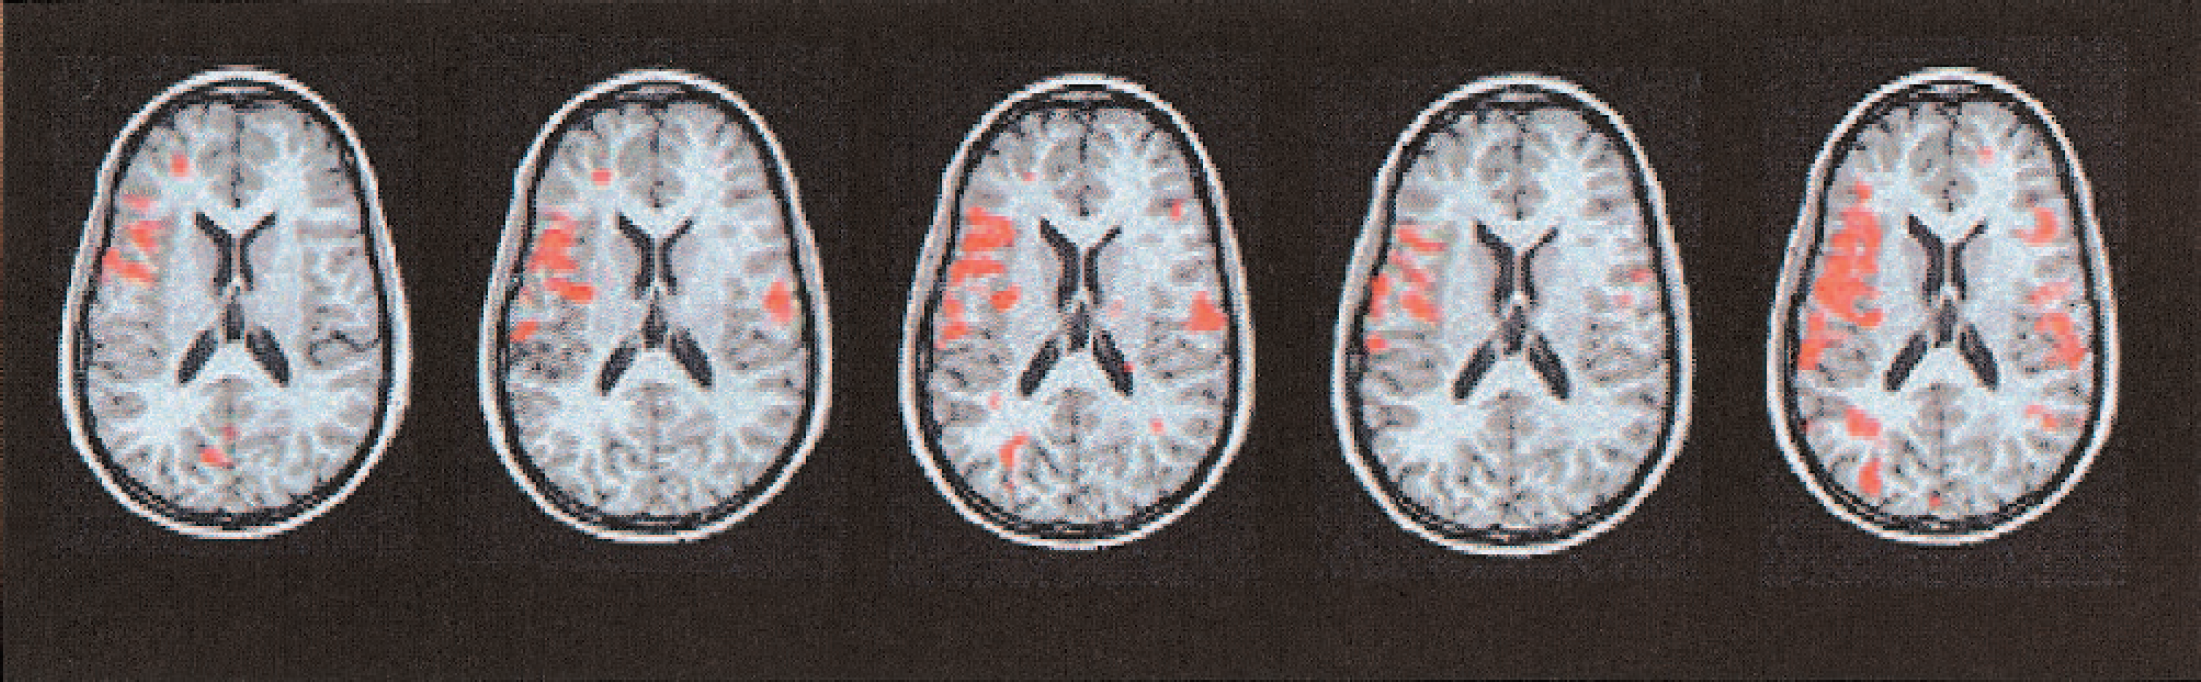
(A) Increase in activated voxels over the course of 10 sessions in the regions corresponding to the anterior vascular territories of the middle cerebral arteries (MCAs; loosely termed Broca and Broca Homologue). (B) Difference of activated voxels (lower curve; VL - VR; squares) in the anterior vascular territories of the MCAs, indicating a slight but not significant increase, whereas there is a substantial bilateral increase within the (left) Broca region and its (right) homologue (upper graph; NL + NR; circles). (C) The same trend is found within the whole vascular territory of the MCAs, indicating a global increase of activated voxels. (D) As a consequence from the changes depicted in B, lateralization indices LIfMRI decrease with repeated examinations. (E) In contrast, the lateralization indices based upon percentage change (LIfMRI-%) were variable without a statistically significant trend. Trends, thick solid and dotted lines; regions of confidence, 95%, thin solid and dotted curves.
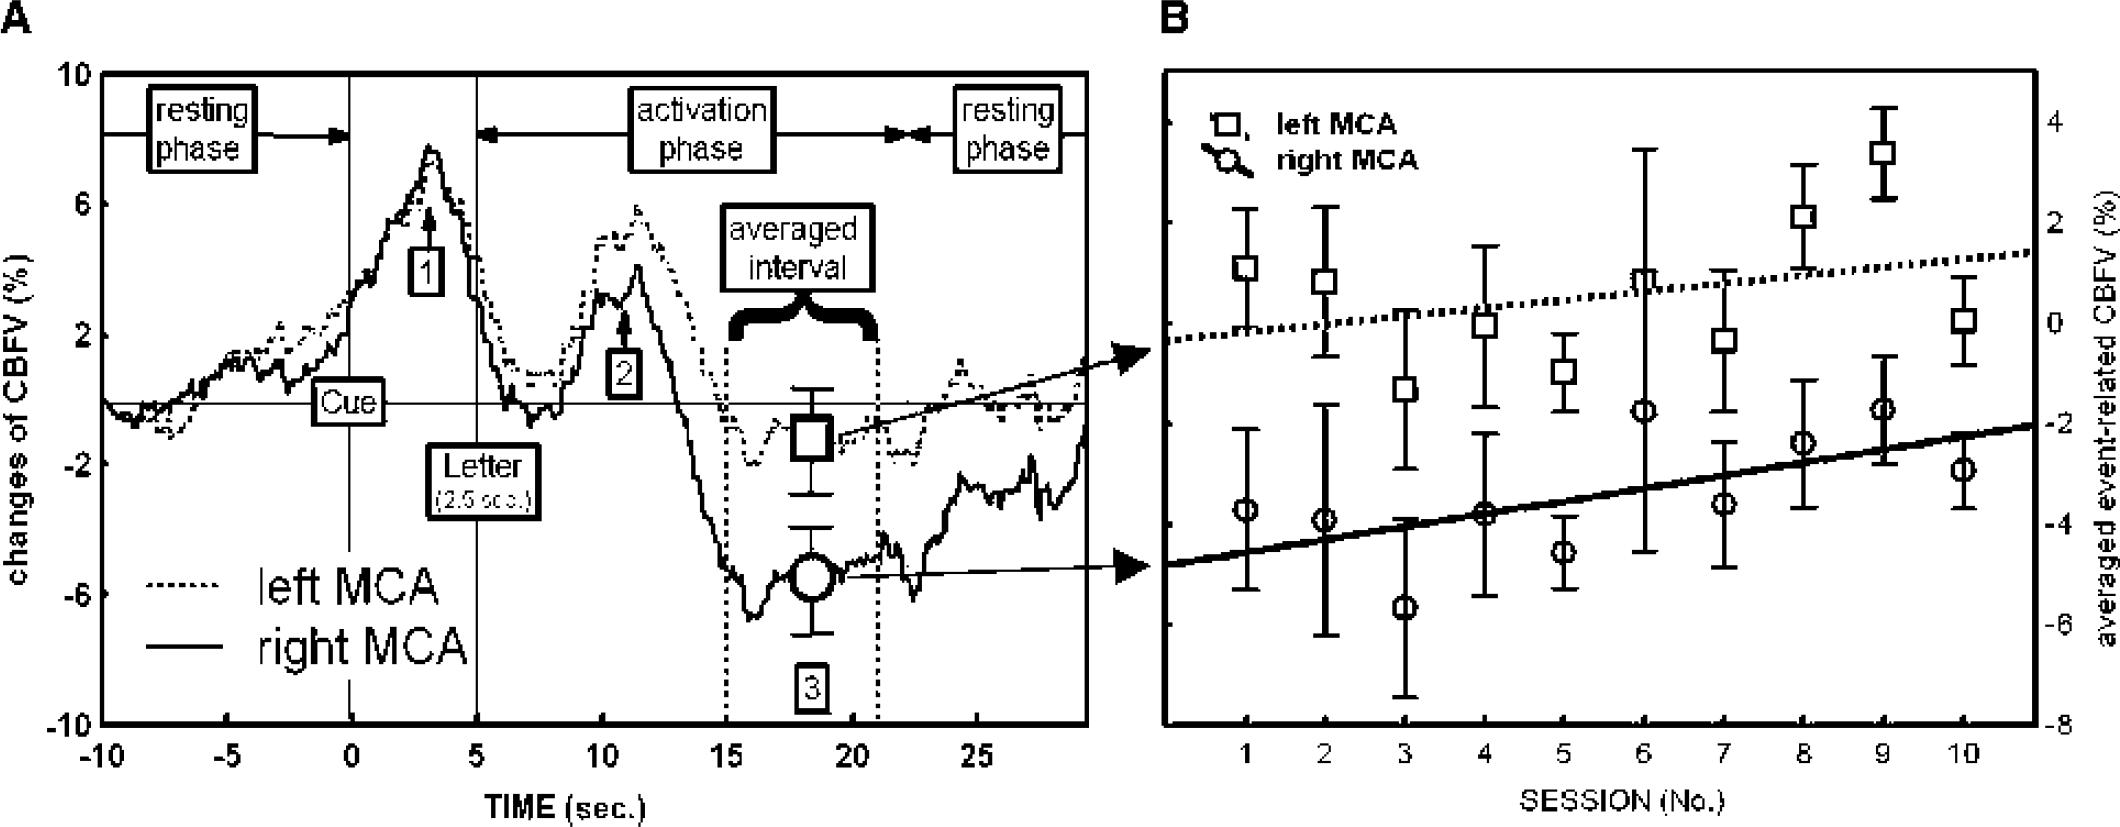
(A) Averaged changes in CBFV in the left and right MCA assessed by fTCD during task performance relative to resting condition. Note that the CBFV in the left MCA increases more in comparison with the right MCA, reflecting language processing in the left hemisphere. (B) Averaged event-related CBFV in the left and right MCA with standard deviation (bars) and trends (solid and dotted lines). The bilateral decrease in CBFV (Fig. 4A) diminishes over the course of the 10 sessions. This results in a global increase of cerebral perfusion in both hemispheres. The three phases of CBFV changes are marked with numbers for later discussion. CBFV, cerebral blood flow velocity; MCA, middle cerebral artery; fTCD, functional transcranial Doppler sonography.
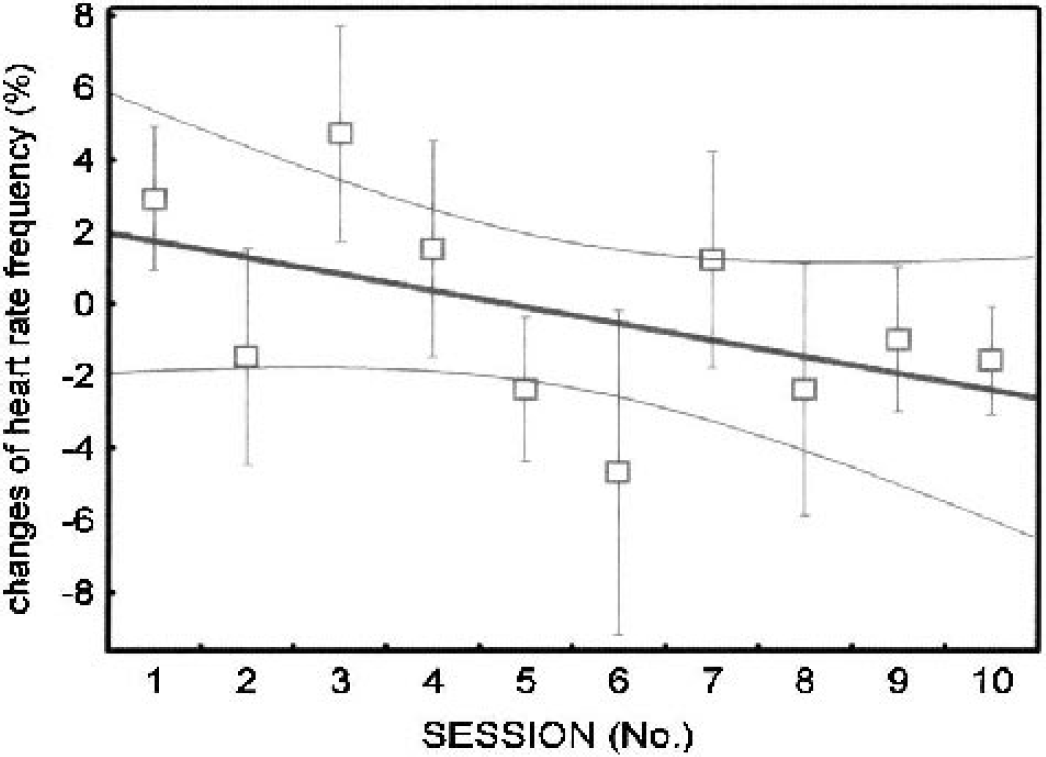
Heart rate changes during the word generation phase relative to the resting condition averaged over 20 trials in each session. Trends, solid lines; regions of confidence, 95%, dotted curves.
RESULTS
Functional magnetic resonance imaging
Initially, word generation led to activation in the left inferior frontal lobe. Over the course of repeated examinations, this left-sided activation was superimposed by a bilateral increase in activated voxels (Fig. 2). Numerical analysis indicates a significant increase in activated voxels in the regions corresponding to the anterior territories of the left and right middle cerebral arteries (see Figs. 3A and 3B, upper panel; for trend statistics, see Table 1, nos. I, II, and IV) and the entire vascular territory of the left and right MCA (see Fig. 3C; for trend statistics, see Table 1, no. VI).
Conversely, the difference between the activated voxels in the left versus right anterior vascular territory of the MCA did not change significantly (see Fig. 3B, lower panel; for trend statistics, see Table 1, no. III).
In each of the 10 sessions, positive LIfMRI and LIfMRI-% were found, indicating left hemispheric language processing. Over repeated sessions, the LIfMRI decreased significantly (see Fig. 3D; for trend statistics, see Table 1, no.V) in contrast to the LIfMRI-% (Fig 3E; Table 1, no. VII).
Functional transcranial Doppler sonography
In all 10 fTCD sessions, positive LIfTCD were obtained, indicating left hemispheric language dominance. Unlike in the fMRI assessments, no substantial trend in the language lateralization index (LIfTCD) was observed over time (for trend statistics, see Table 2, no. I).
Repeated fMRI sessions: trend statistics
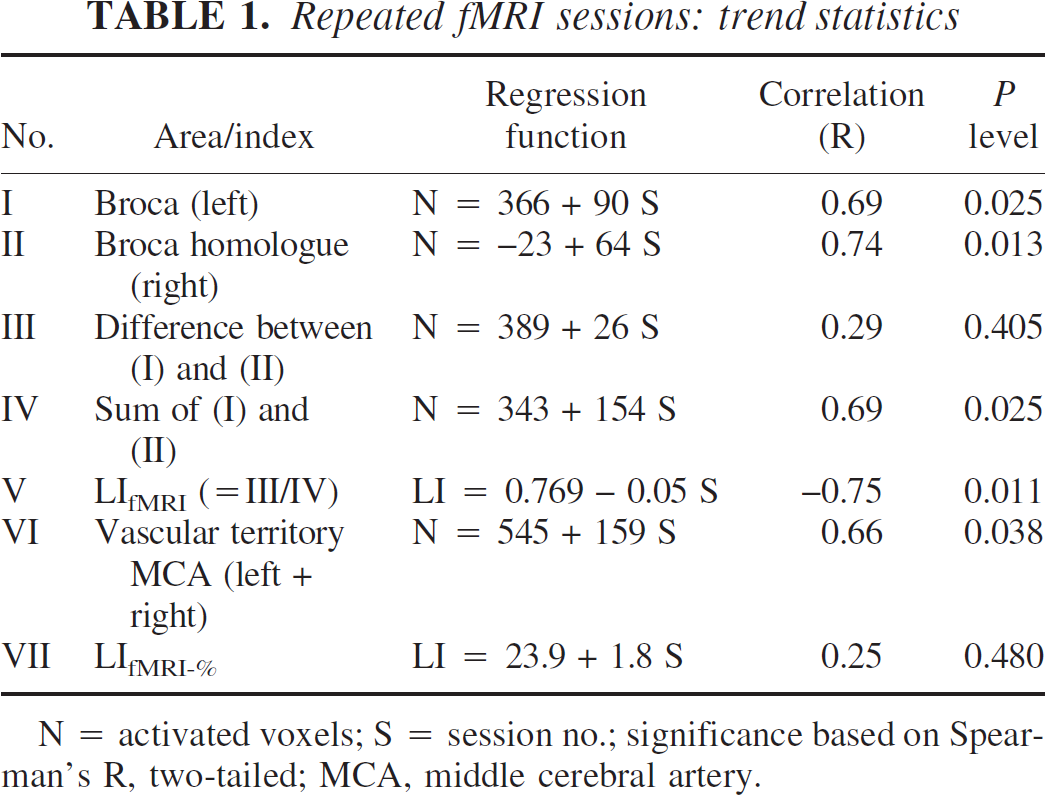
N = activated voxels; S = session no.; significance based on Spearman's R, two-tailed; MCA, middle cerebral artery.
Repeated fTCD sessions: trend statistics
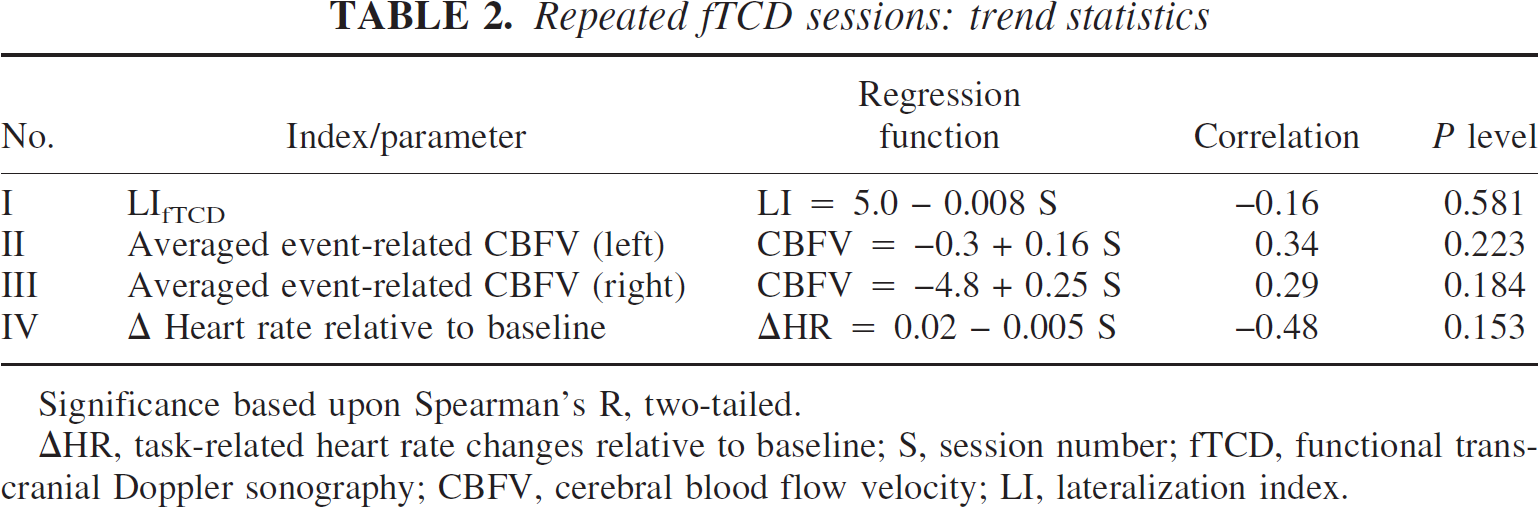
Significance based upon Spearman's R, two-tailed.
HR, task-related heart rate changes relative to baseline; S, session number; fTCD, functional trans- cranial Doppler sonography; CBFV, cerebral blood flow velocity; LI, lateralization index.
The hemodynamic response in both MCAs during task performance is shown in Fig. 4. All following data are based upon averaged event-related cerebral blood flow data processed by the software AVERAGE (Deppe et al., 1997). They represent the mean CBFV data of 20 trials during a specific session. Figure 4A shows the typical hemodynamic response pattern in the left and right MCAs during rest and task performance. The graph plots the percentage of CBFV changes during task performance relative to the resting condition. During task performance (time period, 0 to 23 seconds), the CBFV modulation in both MCAs is characterized by a biphasic increase in response to the cueing (first peak, Fig. 4A, mark 1) and the letter presentation (second peak, Fig. 4A, mark 2), followed by a marked bilateral decrease (Fig. 4A, mark 3). Figure 4B demonstrates that the bilateral decrease in CBFV at the end of word generation diminished over the course of the 10 sessions. This resulted in a relative bilateral increase of the CBFV over the course of the 10 sessions (for statistics, see Table 2, nos. II and III) relative to the resting condition. The pattern of a relative bilateral CBFV increase was confirmed in a second subject (female, 31 years of age; regression functions: averaged event-related CBFVleft MCA = 2.01 + 0.44 S; R = 0.58, P = 0.06; averaged event-related CBFVright MCA = 0.35 + 0.33 S; R = 0.61, P = 0.07M) (unpublished data)
The heart rate during the word generation phase relative to the resting condition was approximately 103% (first session) and showed a negative trend with repetition of the task (Fig. 5 and Table 2, no. V for trend statistics). No such trend was observed during the resting phase.
Accuracy
The coefficients of variability were CVfMRI-% = 0.63, CVfMRI = 0.35, and CVfTCD = 0.17, respectively.
DISCUSSION
The present study demonstrates that repeated fMRI examinations during word generation lead to a systematic decline in the fMRI lateralization index, calculated by the formula LIfMRI = 100 (VL - VR)/(VL + VR). This decrease is caused by an increase in bilaterally activated voxels, whereas the difference between activated voxels in left and right hemisphere remains constant. Functional TCD demonstrates that the bihemispheric increase in activated voxels is caused by a bilateral increase in the event-related cerebral blood flow velocity.
Methodologic considerations
We did not conduct a group study. Pseudoincrease in bilateral blood flow was demonstrated in two subjects examined by fTCD and confirmed in one of them by fMRI. The effect was a consistent and incremental phenomenon over the 10 repeated examinations by fTCD as well as fMRI. We cannot exclude that there are individuals who will not show such response properties, but we believe that our data prove the principle.
Two different approaches have been taken in the past to calculate the fMRI hemispheric lateralization index for brain functions. The first is to measure brain activity based upon the extent of the activated brain region, that is, the number of activated voxels in a predefined ROI at a chosen statistical threshold (e.g., Binder et al., 1996; Deppe et al., 2000; Desmond et al., 1995). The second is to measure the magnitude of the fMRI signal change in a ROI (e.g., Adcock et al., 2003; Cohen and DuBois, 1999).
For clinical studies, the first approach is still the most popular (Binder et al., 1996; Pujol et al., 1999; Springer et al., 1999; Thulborn et al., 1999). Therefore, we focused the data analysis on this method. However, a number of recent studies showed that the stability of this measure is relatively poor. It is biased by several factors, most of all by the statistical threshold used to identify activated voxels (Nagata et al., 2001). Furthermore, its reproducibility is low (Adcock et al., 2003; Cohen and DuBois, 1999; Nagata et al., 2001; Rutten et al., 2002). Therefore, we recalculated the lateralization index using the signal change between the task and control condition as measure of activity (LIfMRI-%). No choice of threshold is involved in calculating these indices.
The lateralization index based on the magnitude of signal change does not show a significant correlation with time (r = 0.25, n.s.). However, this is caused by a lower accuracy (CVfMRI-% = 0.63) compared with the lateralization index based upon voxel statistics (CVfMRI = 0.35) and fTCD (CVfTCD = 0.17). The two latter approaches demonstrated congruently bilateral increases in perfusion. We acknowledge that our findings may not be a general phenomenon but specific to our case. Nevertheless, our results show that calculating a lateralization index based upon the magnitude of signal change does not necessarily produce more stable results.
Potential explanations
There are several different mechanisms that could explain our findings. The effect could be related to variations of hardware characteristics of the MR scanner, increasing practice and proficiency on the task, or autonomic habituation.
Changes in brain activation across fMRI sessions can be influenced by a number of technical factors. In our scanning series, all scanning parameters were kept as constant as possible. However, it cannot be excluded that there were still variations in some hardware characteristics, such as magnetic field inhomogenities (Howseman et al., 1998). These variations should lead to random fluctuations in the number of activated voxels. In contrast, our fMRI data indicate a systematic increase of bilateral activated voxels across sessions. That makes it unlikely that technical factors are responsible for the systematic increase of activated voxels. Furthermore, our fMRI results are corroborated by the concomitant fTCD data, which are based upon completely different physical phenomena, that is, the CBFV-dependent Doppler shift of ultrasound waves. Event-related CBFV responses increased across sessions, corresponding to the fMRI findings. FTCD and fMRI both measure blood flow increases. Different studies report a close relationship between regional cerebral blood flow (rCBF) as measured by fMRI and CBFV changes as measured by fTCD. The results by the one technique can be translated in a linear fashion into that by the other (Deppe et al., 2000; Sitzer et al., 1994).
Only a few studies have investigated the effect of practice on changes the pattern of brain activation (Petersen et al., 1998; Raichle, 1994). Changes in brain activation associated with practice effects during a lexical verbal fluency task have not been examined so far, to our knowledge. One could argue that task repetition leads to more bilateral brain activation because of an increasingly easier word retrieval and more effective lexical search recruiting distributed (bilateral) cerebral networks. Because of a limited number of target letters in the fMRI experiment, the same trials have to be presented more than once. However, results from our own laboratory do not support this idea. From a previous fTCD study, we know that differences in performance in a word generation task do not influence the degree of hemispheric activation among subjects (Knecht et al., 2000). Dräger and Knecht found no increased bilaterality in CBFV during a word generation task within subjects when task difficulty is increased (Dräger and Knecht, 2002).
Thus the present findings seem to be best explained by a change in the interplay of autonomic factors. Such changes take place when cognitive tasks are performed repeatedly. They are most marked for task-related arousal and attention (Näätänen, 1992). They involve rate and volume of respiration, as well as cardiac output and heart rate (Faucheux et al., 1989; Frey and Siervogel, 1983; Rombouts, 1982). It has been known for a long time that with task repetition cerebral blood flow changes even during the resting phases (Blauenstein et al., 1977; McHenry et al., 1978; Warach et al., 1988). Our CBFV data indicate that autonomic habituation has also occurred in our study. The confrontation with the experimental setting can be conceived as a novel stimulus, which arouses and attracts attention that then diminishes with repeated exposure (Warach et al., 1992). Respiration changes during the orienting response when a subject focuses attention to a stimulus or reacts to it (Näätänen, 1992).
Respiration affects CBFV (Tiecks et al., 1995). After cueing and during word generation, subjects usually breathe in deeply. Tiecks and colleagues demonstrated a breathing-related bilateral decrease in CBFV, which was similar to that observed in our study. Inspiration reduces venous return and can lower cardiac output which is then compensated by an increased heart rate via the Bainbridge reflex (Bainbridge, 1915). This could explain why fTCD showed a CBFV pattern consistent with a task-related CBFV increase superimposed upon a global CBFV decrease during word generation (Fig. 4A, phase 3). Additionally, this scenario could explain an increase in heart rate during the task. Increasing familiarity with a task should attenuate changes in respiration. This could explain why global CBFV during word generation increased and heart rate decreased with task repetition.
Our data show that the usual normalization procedure used in measuring task related lateralization of brain activation by fMRI cannot compensate for the confounding effect of task repetition. This is critical in studies on brain activation during learning or recovery of function. To control for the influence of a changing global signal, alternative statistical approaches have been proposed for fMRI activation. In a single-subject fMRI scanning series, McGonigle and co-workers demonstrated that the inclusion of session-by-condition interaction (i.e., influence of session context on the activation effect) explained a significant amount of error variance (McGonigle et al., 2000). The use of a statistical random-effects-analysis was recommended to account for both within- and between-session variance. However, this requires an appropriate sample size (i.e., number of sessions), which is not feasible in most clinical settings. As an alternative, a covariate could be introduced to the analysis of covariance, which models the shifting global signal (Desjardins et al., 2001; Friston et al., 1990). Defining such a covariate could involve the use of a control task. Our findings underscore the importance of accounting for repetition-related changes to improve the validity of fMRI as a tool for understanding reorganization. Distinguishing changes in brain activation patterns related to task repetition will help us to more precisely identify the changes related to the dynamic process under study, such as brain repair. This in turn will give us a better basis for understanding the underlying mechanisms of functional recovery.