
Abstract
The impact of different neuronal populations on local cerebral blood flow (CBF) regulation is not well known and insight into these relationships could enhance the interpretation of brain function and dysfunction from brain imaging data. We investigated the role of sub-types of inhibitory neuron activity on the regulation of CBF using optogenetics, laser Doppler flowmetry and different transgenic mouse models (parvalbumin (PV), vasoactive intestinal peptide (VIP), somatostatin (SOM) and nitric oxide synthase (NOS)). Whisker stimulation was used to verify that typical CBF responses were obtained in all mice. Photo-stimulation of SOM-cre and NOS-cre mice produced significant increases in CBF that were similar to whisker responses. In NOS-cre mice, CBF responses scaled with the photo-stimulus pulse duration and frequency. In SOM-cre mice, CBF increases were followed by decreases. In VIP-cre mice, photo-stimulation did not consistently produce significant changes in CBF, while slower increases in CBF that peaked 14–18 s after stimulation onset were observed in PV-cre mice. Control experiments performed in non-expressing regions showed no changes in CBF. These findings suggest that dysfunction in NOS or SOM neurons can have a significant impact on vascular responses that are detected by brain imaging methods like functional magnetic resonance imaging (fMRI).
Introduction
The mammalian brain consists of numerous neuronal and non-neuronal cell types whose function is supported by an extensive network of blood vessels. Neurons are the main processing unit in the brain, coordinating and processing complex functions, including movement, memory and cognition. Neurons do not store substrates for energy generation and require a continuous supply of blood to provide them with oxygen and glucose for energy. It has been shown that different levels of activity elicit commensurate changes in cerebral blood flow (CBF) and cerebral blood volume (CBV).1–4 In fact, human brain imaging studies, such as BOLD fMRI (blood oxygen level dependent functional magnetic resonance imaging), use these changes in blood oxygenation which are influenced by changes in CBF to infer neural activity.5,6 In most studies, increases in blood oxygenation result from disproportionate increases in CBF relative to oxygen metabolism.7,8 There is increasing evidence that certain types of neurons can play a significant role in blood flow regulation.9–15 For example, slice experiments show vaso-dilatory and -constrictive effects from stimulation of vasoactive intestinal peptide (VIP) and somatostatin (SOM)-expressing interneurons, respectively.9,10 Understanding what types of neurons regulate cerebral blood flow will provide vital insight for a more accurate interpretation of fMRI data in health and disease conditions. Since brain disorders are often associated with neuronal dysfunction which can alter functional hyperemic changes,16–19 understanding the role of different neuronal sub-types on cerebral blood flow might enable the use of vascular-based fMRI methods like BOLD fMRI, CBF fMRI (e.g. arterial spin labeling) 20 or CBV fMRI (e.g. vascular space occupancy or VASO)21–23 to detect brain dysfunction as well as monitor disease progression.
There are two general types of neurons, excitatory and inhibitory. Excitatory neurons propagate activity to their connected network, which includes inhibitory neurons. Inhibitory neurons suppress the propagation of spiking activity via the release of the neurotransmitter GABA. They work to shape and restrict the activity encoded by neural networks. In addition, it is known that some inhibitory neurons can release vasoactive molecules, such as nitric oxide (NO), which is catalyzed by the enzyme nitric oxide synthase (NOS). It has also been reported that some inhibitory neurons are located close to intra-cortical arterial vasculature.10,24 These properties position inhibitory neurons as potentially vital regulators of local blood supply. Numerous signaling pathways have been identified, both direct and indirect, by which neuronal activity can produce local changes in arterial diameter and blood flow. 11 Since the arterio-venous pressure difference is roughly constant, blood flow regulation is essentially accomplished via dilation and constriction of vascular contractile elements (e.g. smooth muscle) in cerebral arteries, arterioles and some capillary segments.25–28 Studies focusing on excitatory neurons (glutamatergic) have shown they release vasoactive molecules, such as prostaglandin E2, following pyramidal cell and NMDA receptor activation.29,30 Studies focusing on inhibitory neurons have shown they can increase local cerebral blood flow separately from excitatory neuron activity.10,13,14,24 It is evident from these studies that neurons do not regulate blood flow in the same manner, and that not all neurons may be capable of generating changes in local perfusion.
The goal of this work is to determine the role of some populations of inhibitory neurons on CBF regulation. To this end, we used cre-recombinase transgenic mouse lines that target different populations of inhibitory neurons to insert the optogenetic protein Channelrhodopsin-2 (ChR2) by viral transduction and directly stimulate the cells of interest using narrow-band light (e.g. 473 nm). We performed the experiments in mice that expressed ChR2 in the following protein targets of inhibitory neurons: parvalbumin (PV), vasoactive intestinal peptide (VIP), somatostatin (SOM or SST) and nitric oxide synthase (NOS). These genetic targets are not all independent, mice targeting PV- and VIP-expressing neurons show little overlap,31,32 while many NOS-expressing neurons also express SOM.33,34 In general, PV neurons are very active in response to sensory input and are also known to fire spontaneously at high rates.35,36 VIP neurons show similar but more complex activity patterns compared to PV neurons. 37 SOM neurons on the other hand tend to fire at lower rates and even become hyperpolarized during sensory input (e.g. whisking), indicating a potential role in enhancing sensory processing.34,35,38 The function of NOS neurons is less clear, but they have been implicated in sleep regulation. 39 Since these inhibitory neuron populations compose a large fraction of all inhibitory neurons with accessible genetic targets, they were selected for experimentation and whisker stimulation was used to verify that neuro-vascular regulation is present in each mouse model. We considered the following guiding hypotheses: (1) inhibitory neuron populations expressing NOS are able to regulate CBF in a dose-dependent manner, (2) inhibitory neuron populations that do not express NOS do not have a significant impact on CBF regulation, and (3) inhibitory neuron populations capable of firing at high rates (i.e. PV) can regulate CBF in a dose-dependent manner but only at high stimulation frequencies (likely due to metabolic depletion).
Materials and methods
Animal preparation
A total of 29 mice (male, 23–32 g; three to nine months old) were obtained from the Jackson Laboratory (Bar Harbor, ME) coding for the enzyme cre-recombinase in the genome of the targeted inhibitory neurons (PV-cre, n = 8 strain B6.129P2-Pv(albtm1(cre)Arbr)/J; VIP-cre, n = 7 strain VIP(tm1(cre)Zjh)/J; SOM-cre, n = 8 strain B6N.Cg-SST(tm2.1(cre)Zjh]/J; NOS-cre, n = 6 strain B6.129S-Nos1(tm1.1(cre/ERT2)Zjh)/J). All procedures performed followed an experimental protocol approved by the University of Pittsburgh Institutional Animal Care and Use Committee (IACUC) in accordance with the standards for humane animal care and use as set by the Animal Welfare Act (AWA), the National Institute of Health Guide for the Care and Use of Laboratory Animals and ARRIVE (Animal Research: Reporting in Vivo Experiments). Expression of the optogenetic protein Channelrhodopsin-2 (ChR2) was achieved by intra-cortical injection with AAV-DIO-ChR2(H134R)-YFP obtained from the University of North Carolina Viral Vector Core. Mice were anesthetized with ketamine (75 mg/kg) and xylazine (10 mg/kg) and placed in a stereotaxic frame (Narishige Inc., Tokyo, Japan) for craniotomy, head-plate installation, and viral injection. Supplementary oxygen (40% balanced by air) was administered via nose cone at 500 mL/min. Body temperature was maintained at 38℃ (measured under the abdomen) using a DC feedback unit. Surgery consisted of removing the skin over the skull and exposing the bone until dry. The aluminum head plate (Narishige Inc.) contains an 8 mm round opening that was positioned over the area of interest and then the plate was cemented onto the skull using VetBond (3M Inc.) and dental cement. A craniotomy 4-mm in diameter was performed over the somatosensory cortex centered around 3 mm lateral and 1.5 mm posterior from the Bregma. Mice were then placed under the microscope to visualize the virus injection (Figure 1(a) and (b)). A glass micro-pipette was used to inject small amounts of virus at depths of 300 µm and 600 µm into the somato-sensory cortex. A small amount of fluorescent dye (200 µM SR-101) was used to visualize virus delivery in the targeted locations. The total injected volume was about 0.1 µl. A custom cover glass consisting of a 4-mm round cover glass glued on a 5-mm round cover glass (CS-4R and CS-5R, Warner Instruments Inc.) was cemented onto the skull to maintain visual access to the brain. Aseptic procedures were followed and mice were allowed two to three weeks for recovery. During recovery the mice were acclimated to a custom treadmill for awake head-fixed data collection. The NOS mouse model is an inducible creER line, and Tamoxifen (75 mg/kg) was administered one to two weeks post-surgery following protocol described in the Jackson Laboratory’s website.
Experimental setup and experimental paradigm description. (a) Mice were placed under a fluorescence microscope for virus injection in barrel cortex as well as during experiments to identify the expressing region in the somato-sensory cortex for placement of the photo-stimulation optic fiber (473 nm light delivery, blue cylinder) and laser Doppler flowmeter (LDF, red probe) for CBF measurements. LDF and the optic fiber were positioned at a 60° angle to facilitate placement under the microscope. (b) Sample image taken under green-yellow light (570 nm) of the mouse brain, while under the microscope illustrating virus injection as well as optic fiber and LDF probe placements (these took place separately during surgical preparation and experimental data collection, respectively). Whiskers were also stimulated by air puffs at 30 psi. (c) Description of the photo-stimulation and whisker-stimulation paradigm. Stimulation was delivered over D seconds every ISI seconds. Trains of stimulation pulses were delivered with duration (d), interval (I) and amplitude (A), repeated N times to match the stimulation period duration (D).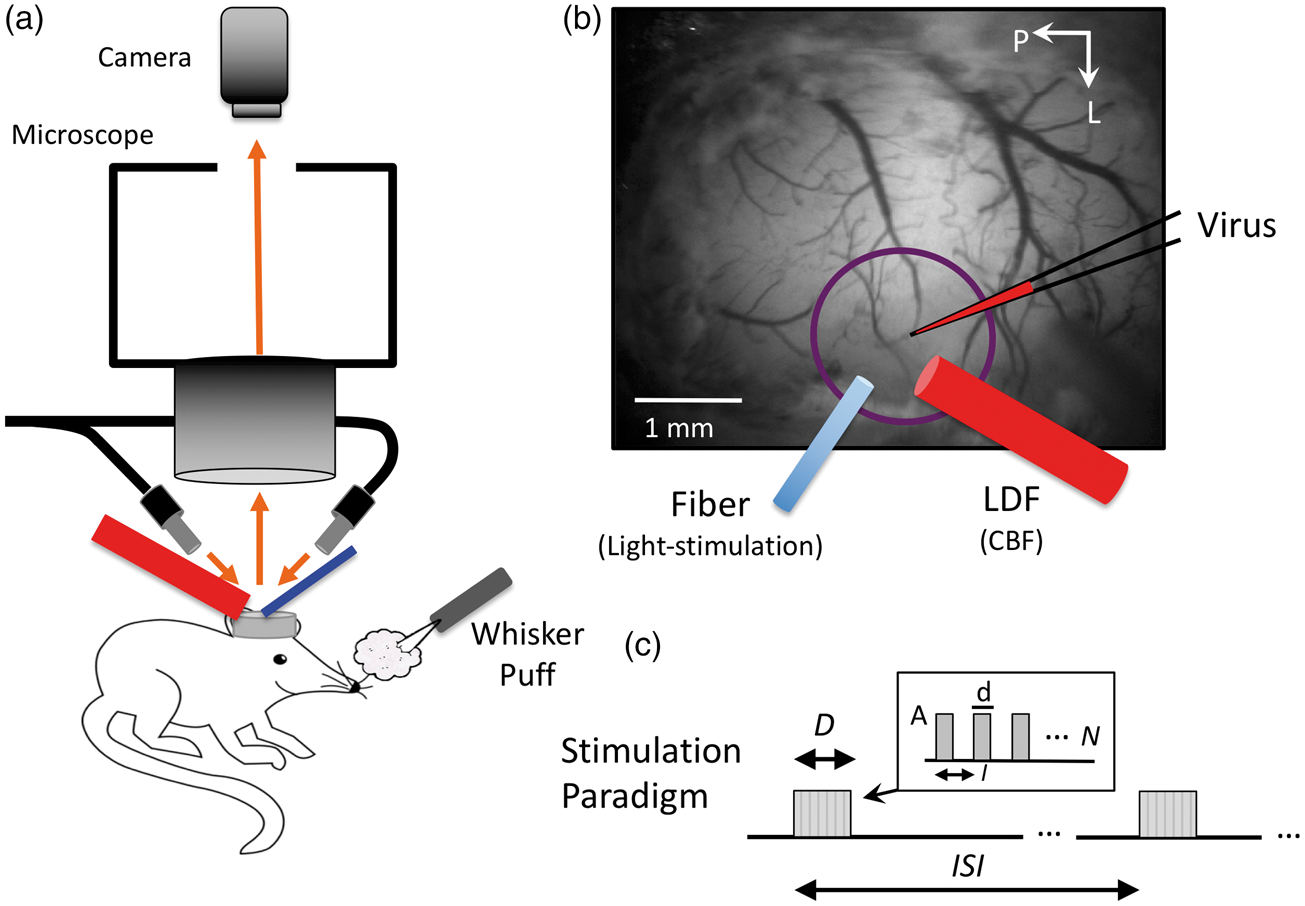
Probe placement
A fluorescence microscope (MVX-10, Olympus Inc., Japan) was used to identify the ChR2-YFP expression region (whisker somato-sensory cortex). A Laser Doppler Flowmeter (LDF; Periflux 5000/411, Perimed AB, Jarfalla, Sweden) and an optic fiber (S-405-HP, core diameter of 125 µm; ThorLabs, Inc., Newton, NJ) were placed over the cover glass facing the expressing region while avoiding large surface vessels (Figure 1(a) and (b)). LDF was used to acquire CBF data and the optic fiber was used to deliver the photo-stimulus. The LDF probe used has a tip diameter of 450 µm and operating wavelength of 780 nm. Because each probe was placed under the fluorescence microscope, the fiber and probe were placed at a 60° angle. An air puffer was also placed in front of the contralateral whisker pad to stimulate the somato-sensory cortex (Figure 1(a)).
Experimental design
Photo-stimulation and whisker stimulation experiments were performed in all animals under awake head-fixed conditions. The photo-stimulus was delivered using a power-adjustable, TTL-controlled, 473 nm laser diode unit (CrystaLaser Inc., Reno, NV) connected to the optic fiber. The laser power at the tip of the fiber was set to 1 mW measured using a power meter (Melles Griot 13PM001, IDEX Inc., Rochester, NY). Air puffs were delivered using a pressure injector (Toohey Spritzer, Toohey Company, Fairfield, NJ) set to 30 psi. The photo-stimulus pulse duration and frequency were varied to modulate the amount of evoked activity and examine its impact on hemodynamic responses. The photo- or whisker stimulation paradigm is described in Figure 1(c). In short, pulses of light (d = 30, 10 or 2 ms in duration; A = 1 mW) were delivered at an interval (I) corresponding to frequencies of either 5, 10, 20 or 40 Hz over a stimulation period (D) of either 1 s every 30 s (inter-stimulus interval or ISI) or 4 s every 40 s. At least 10 stimulation trials were collected for each stimulation parameter set. These photo-stimulation parameters were selected based on previous experiments from our group.14,40,41 For whisker stimulation, the pulse duration and frequency were fixed to 50 ms and 5 Hz, respectively. Although photo-stimulation and whisker stimulation initiate cortical activity in different neuronal populations (inhibitory and excitatory, respectively), whisker stimulation allowed us to verify that the physiological neurovascular mechanism was not disrupted. Additional experiments were conducted in a subset of mice to serve as control experiments. In these experiments, the optic fiber and LDF probe were positioned in a non-expressing region of the visible cortex. Control experiments were also performed in NOS-cre mice (NOS-creER) prior to Tamoxifen administration. In these experiments, the LDF probe and optic fiber were placed over whisker somatosensory cortex. Stimulation triggers and LDF data were recorded at 1 kHz (MP150, Biopac Systems Inc., Goleta, CA).
Data analysis
All data were analyzed using Matlab (Mathworks, Natick, MA, USA). Time series of the changes in cerebral blood flow evoked by whisker or photo-stimulation were obtained from the LDF data. Time series spanning 40 s were obtained from all trials starting 5 s prior to stimulation onset. The LDF time series were low-pass filtered with a rectangular cut-off of 4 Hz and down-sampled to 10 Hz. Small linear trends were removed from each trial by considering only data over the 4 s preceding stimulation onset (baseline) and the last 4 s of each trial. Lastly, time series from trials with common stimulation parameters were averaged and then normalized by their pre-stimulation baseline level. Changes in CBF were measured from the average time series as the average value 1 to 4 s after stimulation onset (for 1-s photo-stimulation) or 4 to 7 s after photo-stimulation (for 4-s photo-stimulation). The time-to-peak was also measured directly from the time series. Significant differences in CBF response amplitude were tested relative to baseline using a t-test (p < 0.05). 42 In addition, a linear mixed-effect model was used on the CBF amplitude as a function of pulse duration and frequency to test for significant relationships and account for multiple comparisons 42 (p < 0.05). We considered a particular inhibitory neuron population to play a significant role in regulating CBF if photo-stimulation evoked significant changes from baseline in at least three out of six parameters tested and showed a significant relationship to either pulse duration or frequency. We report average values ± standard deviation throughout the manuscript and figures.
Immunostaining
Mice were anesthetized with sodium pentobarbital (Euthasol Solution, Virbac Animal Health Inc., Fort Worth, TX) and sacrificed by transcardial perfusion with 0.1 M phosphate buffer solution (PBS) followed by perfusion with 4% paraformaldehyde (PFA; EMS, Hatfield, PA, USA) in 0.1 M PBS (pH 7.4). Brains were removed and fixed in 4% PFA solution overnight at 4℃, and then left in 30% sucrose for two nights at 4℃. Sections were cut on a freezing microtome from frontal to parietal cortex covering the cranial window area and series of 20 to 50 µm thick coronal sections were mounted on Superfrost Plus slides for storage at −80℃ until use, or collected into a 24 well culture plate filled with PBS for storage at 4℃. Glass or free-floating sections were washed three times in PBS for 5 min each and were blocked and permeabilized overnight at 4℃ in a solution containing 0.2% Triton X-100, 5% bovine serum albumin and 10% donkey serum in PBS. The following primary antibodies were then applied for 72 h at 4℃: YFP (1:500, chicken anti-GFP polyclonal, ab13970, Abcam Inc., Cambridge, MA), Parvalbumin (1:500 rabbit anti-parvalbumin polyclonal, ab11427 Abcam), VIP (1:600, rabbit anti-VIP polyclonal, Immunostar, Hudson, WI), SOM (1:600, rabbit anti-SST polyclonal, HPA019472 Sigma-Aldrich, St. Loius, MO), NOS (1:500, goat anti-NOS1 polyclonal, NB100-858, Novus Biologicals, LLC, Centennial, CO). After washing in PBS for 30 min, the tissue was incubated with the cross-absorbed secondary antibody donkey anti-chicken Alexa488 for YFP, donkey anti-goat Alexa594 for NOS, and donkey anti-rabbit Alexa594 for PV, SOM, and VIP for 2 h at room temperature with secondary antibodies diluted 1:500 in PBS. The slides were thoroughly rinsed in PBS before sections were mounted with cover glass.
Immunostained sections were imaged by confocal microscopy (Nikon A1 Spectral Confocal, Japan) using a 40× objective lens. Imaging settings were optimized to eliminate background staining in all channels after calibrating the laser intensity, signal offset and amplifier gain on slices treated without primary antibody. Other than making moderate adjustments for contrast and brightness, the images were not manipulated. Images were acquired from sections covering the YFP-expressing region in the somato-sensory cortex (four to five sections). We used ImageJ (NIH, USA) to analyze the images and count cells.
Results
All animals injected with AAV-DIO-ChR2(H134R)-YFP showed expression of Channelrhodopsin-2 in somato-sensory cortex around one week post-virus (or Tamoxifen) injection. Expression was verified using fluorescence microscopy (Figure 2(a) to (d)) and two-photon microscopy as evidenced by the fluorescence of YFP along cell membranes (Figure 2(e) to (h)). Experiments were performed after the expression stabilized, two to three weeks post-injection, during which time they were acclimated to our awake head-fix treadmill for experimentation.
Fluorescence microscopy images over the entire cranial window (a–d) as well as high resolution two-photon microscopy images (e–h; maximum intensity projections over 10–30 µm) of intra-cortical sections from the respective mouse models showing ChR2-YFP expression. In some mice, a red intravascular dye was used to visualize the vasculature (Texas Red Dextran, 50 µl 2.5% solution). The inset in panel H shows another image of a nearby neuron. Images of YFP expression were acquired two to three weeks after injection. Arrows point towards the whisker region of somato-sensory cortex. The scale bar for the images in each row is located in the left-most image. In 2(h), the scale bar in the inset represents 50 µm.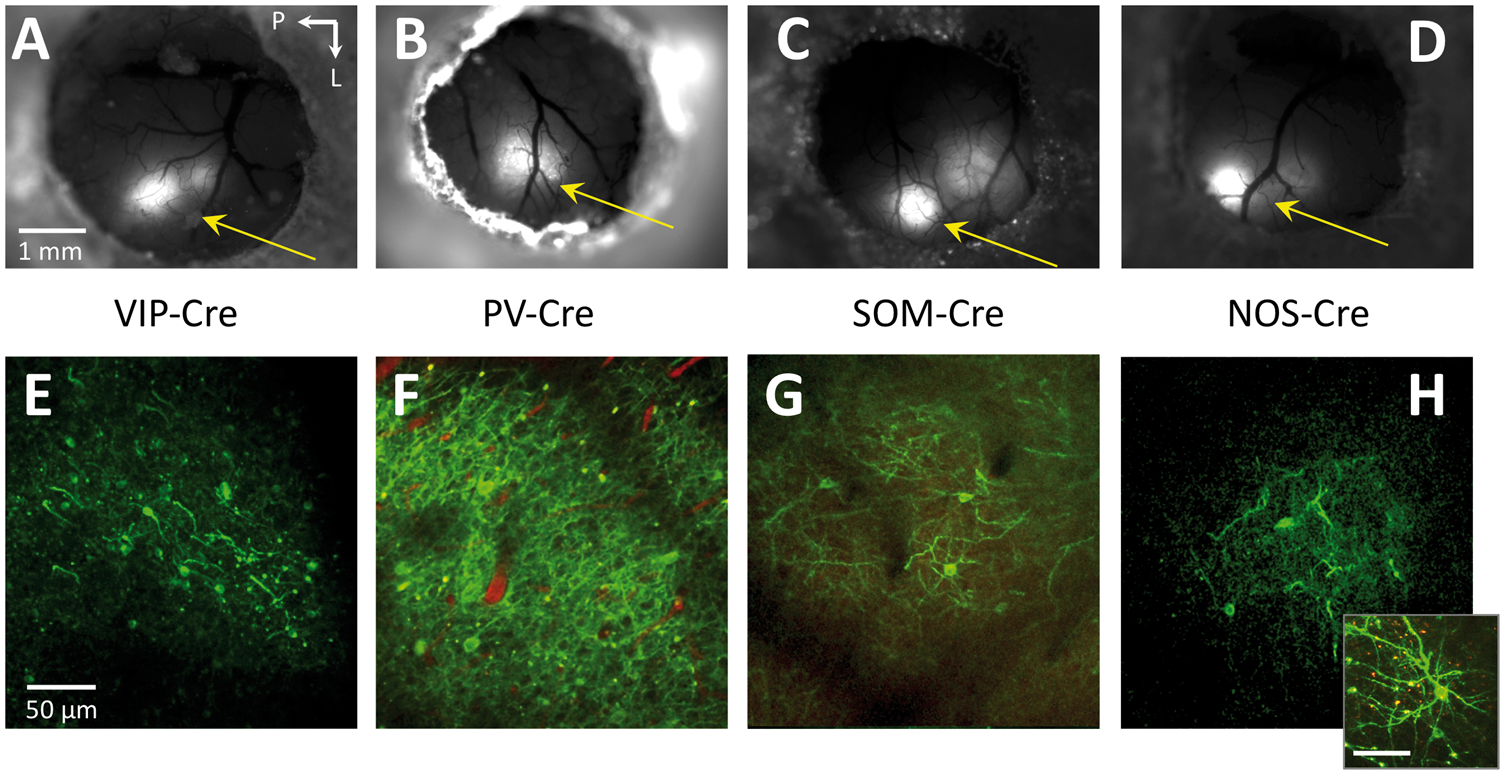
Expression assessment
To determine the specificity of the neuronal populations targeted, we first describe the expression profile by immunostaining. In VIP-cre mice, expression was similar to previous reports.43,44 Bitufted anatomical features were evident in VIP and YFP-labeled cells (Figure 3(a)). There was a tendency for VIP+ cells to preferentially exist in Layers II/III, although immunostaining also showed them in high numbers in deeper layers. Counter-staining for YFP showed that most of ChR2-YFP(+) cells in this region were also VIP+ (74.4%, Table 1). In general, VIP immunostaining was faint and positive identification often required verification among adjacent sections. Many of the YFP+/VIP− cells appeared to have bitufted anatomical features suggesting that these cells are also VIP− but the staining was sufficiently faint to prevent positive identification. Nonetheless, a large fraction of YFP+ cells were also VIP+.
Confocal images of immunostained brain sections from (a) VIP-cre, (b) PV-cre, (c) SOM-cre and (d) NOS-cre mice. For each mouse, larger field-of-view images are shown on the left panels and zoomed images on the right panels (white rectangle on left panels shows zoomed location for images on the right panels). The top panels show staining for the model of interest (red), middle panels show staining for ChR2-YFP (green) and the bottom panels show color merge images. White arrows show location-matched cells between zoomed panels from the same mice. Immunostaining summary of the number of neurons expressing ChR2-YFP (YFP-positive or YFP+) in the different inhibitory neuron types of interest (INTI). Note: Total number of cells are reported over all mice examined (number of mice indicated in parenthesis in the first column).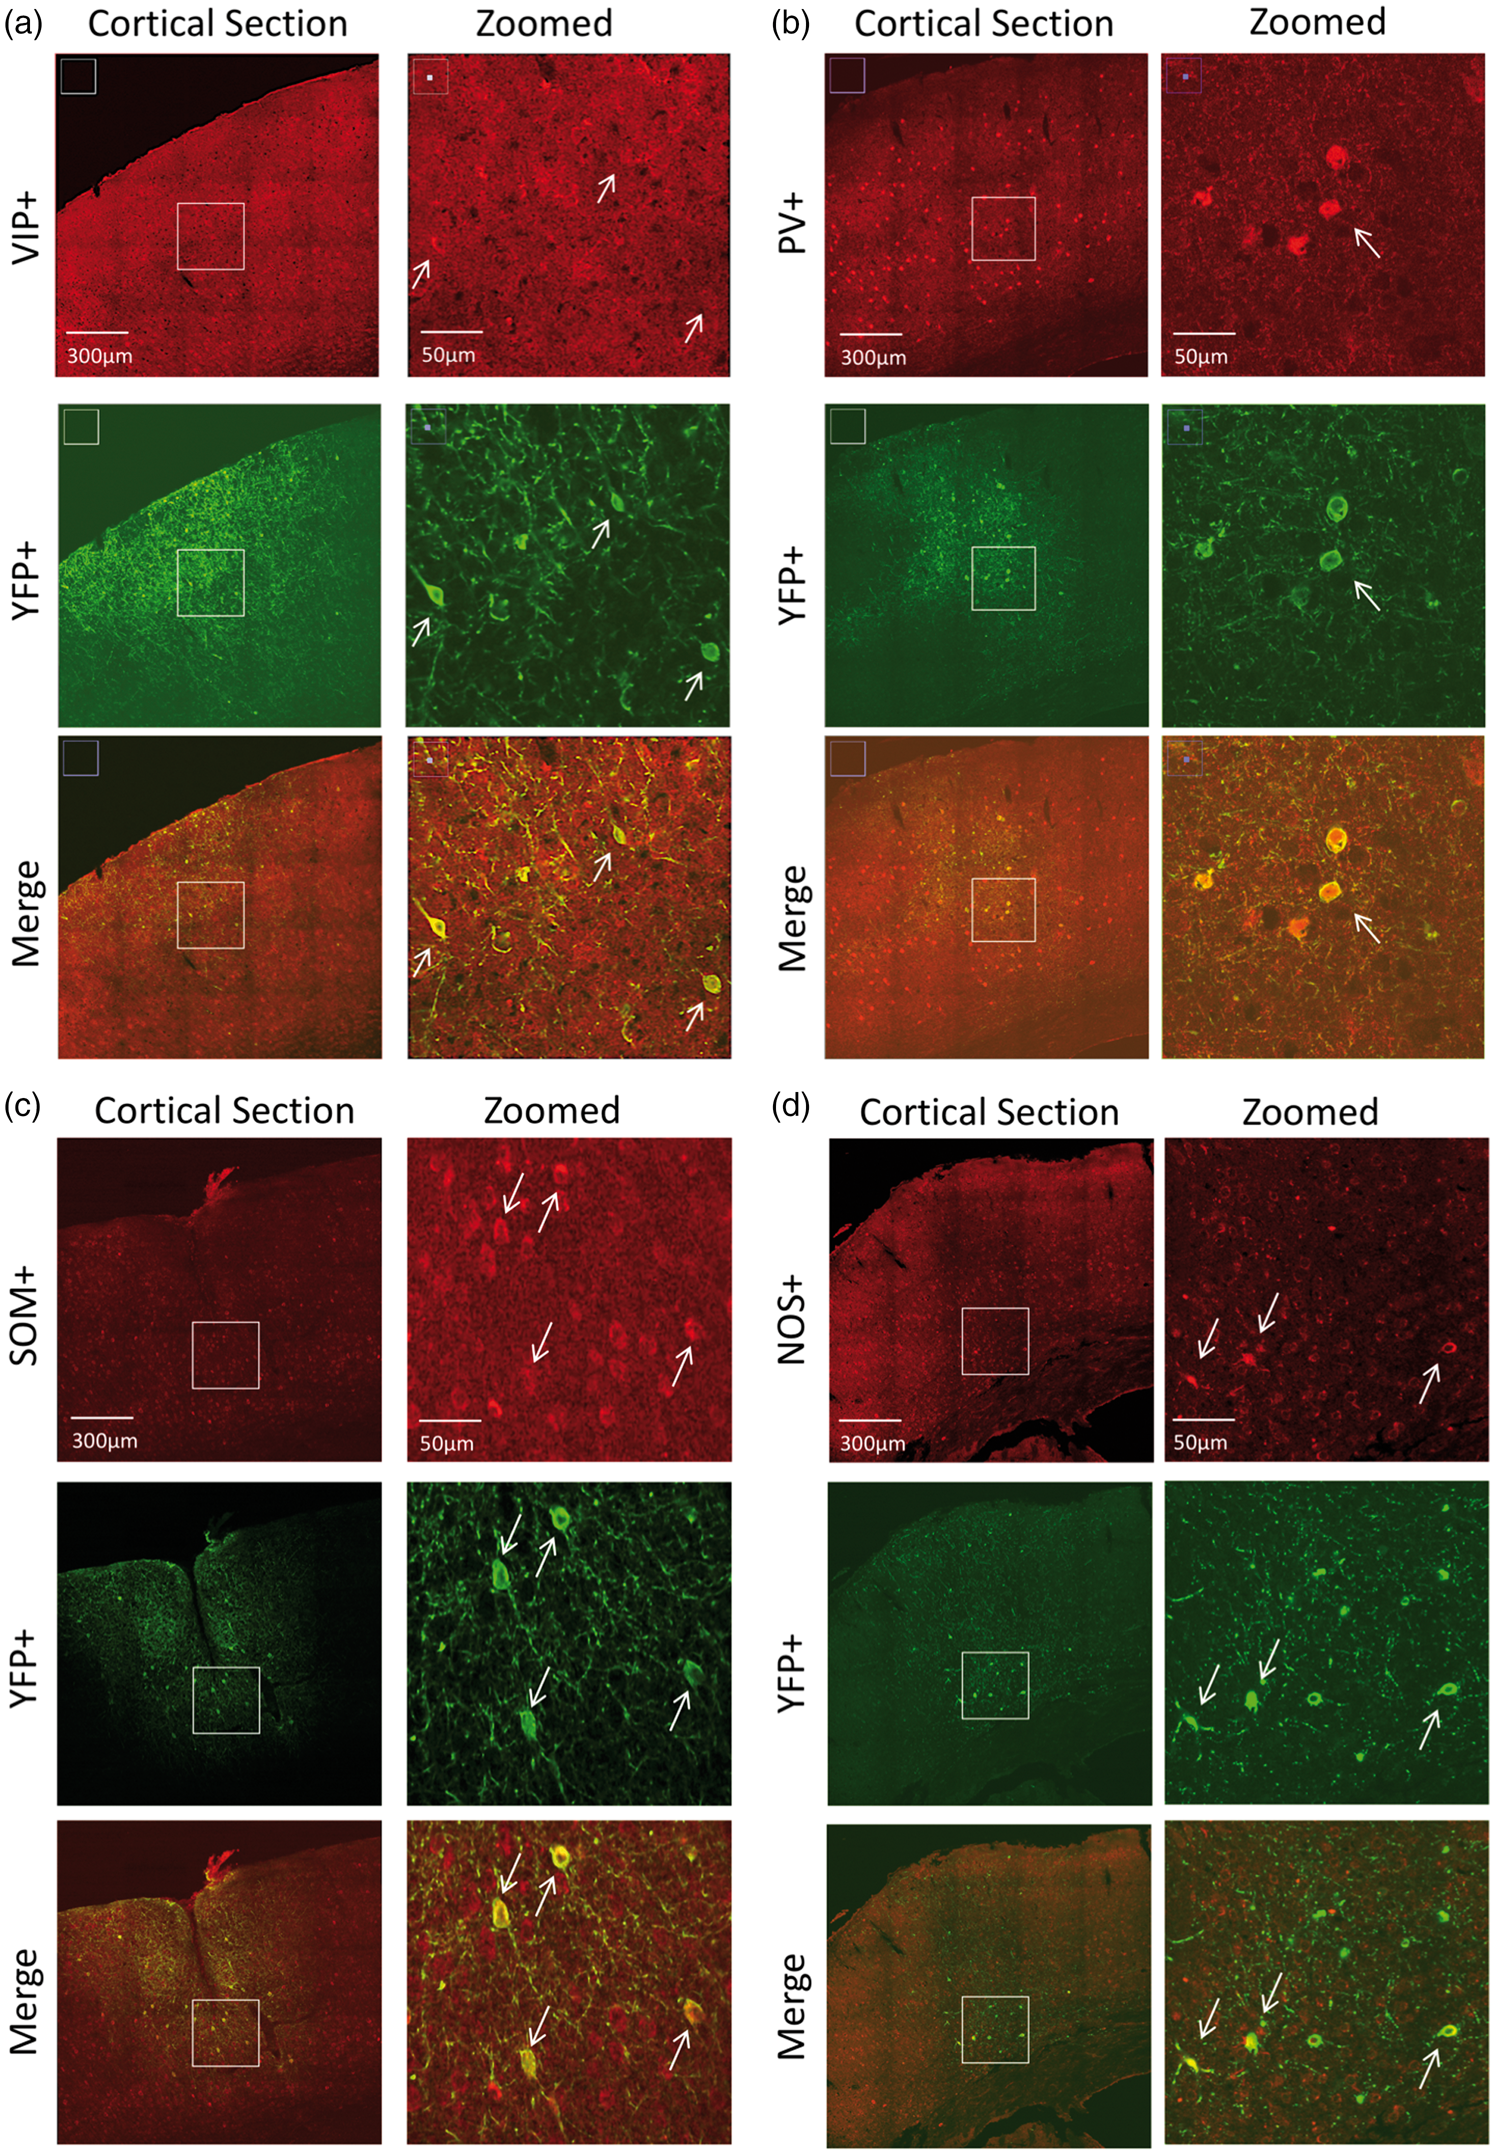
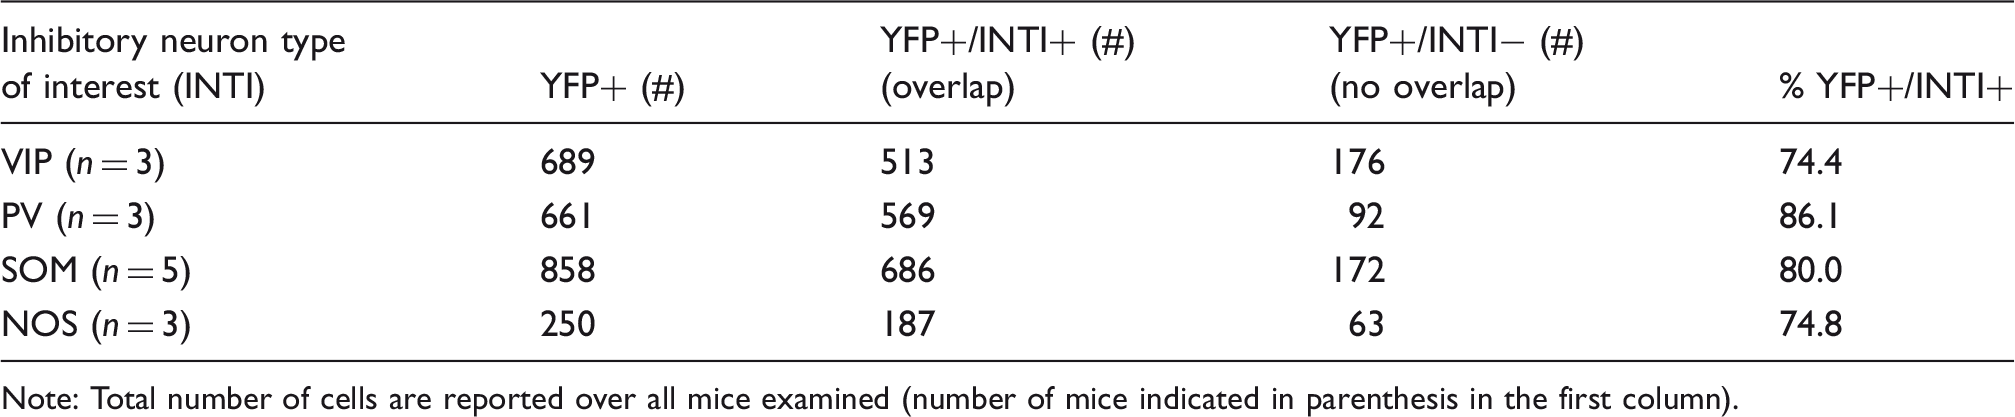
In PV-cre mice, expression was similar to that published in this mouse model.31,32,45 PV+ cells were found in higher numbers in middle and deeper cortical layers (Figure 3(b)). Counter-staining for YFP expression showed co-labeled PV+ cells in this region, especially in deeper layers (Figure 3(b)). Quantification of labeled cells showed that 86% of YFP+ cells were also PV+ (Table 1). No apparent preference for YFP+/PV− negative was observed, also these cells did not appear to be pyramidal based on negative long-range projections extending out of this region.
In SOM-cre mice, SOM and YFP immunostaining showed large numbers of positive cells throughout the somato-sensory cortex. SOM labeled cells spanned layers II–VI, with higher preference to Layer II/III (Figure 3(c)). Co-labeling for YFP showed that most YFP+ were also SOM+ (80%, Table 1 and Figure 3(c)). Our findings are in agreement with previous reports for the distribution of somatostatin neurons.31,34,46
In NOS-cre mice, NOS+ cells were also found throughout the cortex, similar to SOM-expressing cells (Figure 3(d)). YFP co-labeling showed some cells with significant arborization that remained in the local region and most cells were present in upper Layer II/III and also Layer VI (Figure 3(d)). This is consistent with previous reports indicating that NOS+ cells can be preferentially located in these layers.33,43 Most YFP+ neurons were also NOS+ (74.8%, Table 1) and, similar to the other models, no evident features from other cells types for YFP+/NOS− cells were observed. We also observed high and low expressing NOS neurons in some sections, in agreement with previous reports of Type I and II NOS populations. 33
Whisker and photo-stimulation of VIP-cre, PV-cre, SOM-cre and NOS-cre mice
To verify that photo-stimulation did not elicit changes in CBF in the absence of ChR2, we performed two types of control experiments. Data acquired from non-expressing regions in the experimental mouse models did not show significant changes in CBF following photo-stimulation. In addition, data acquired from whisker somatosensory cortex of NOS-cre animals prior to Tamoxifen administration showed no significant changes in CBF for any of the photo-stimulation parameters tested. Therefore, we compiled results from both groups and show average results in Supplementary Figure 1. These findings are in agreement with previous studies by our group using similar photo-stimulation parameters in non-transgenic mice or mice expressing GFP. 40
Whisker stimulation for 1 or 4 s evoked detectable CBF responses in all mice (Figure 4, black lines). On average, 1-s whisker stimulation generated increases in CBF of 15.8% across the mouse models used, while 4-s whisker stimulation generated average increases of 10.6%. The average time-to-peak measured from the LDF responses was 2.6 s for 1-s whisker stimulation and 2.9 s for 4-s whisker stimulation. Although some variability was observed in these responses, all but one were significant with p < 0.02 (Figure 5, black bars). Altogether, whisker stimulation generated CBF responses with typical temporal features in all mice indicating that the neurovascular mechanism is not impaired.
Average CBF changes measured by LDF in response to photo-stimulation for 1 s at 5 Hz and various pulse widths (30 ms in blue traces, 10 ms in red traces, 2 ms in green traces), as well as whisker stimulation (black traces) in VIP-cre (a), PV-cre (c), SOM-cre (e) and NOS-cre (g) mice. Similarly, average CBF changes in response to photo-stimulation and whisker for 4 s in VIP-cre (b), PV-cre (d), SOM-cre (f) and NOS-cre (h) mice. The photo-stimulus amplitude was fixed to 1 mW. The shaded blue rectangle denotes the photo-stimulation period. For reference, the average time-to-peak for CBF responses evoked by 1-s whisker stimulation were 3.0 ± 2.0, 2.4 ± 1.1, 2.7 ± 1.7 and 2.4 ± 1.2 s for VIP-cre, PV-cre, SOM-cre and NOS-cre models, respectively, and 2.7 ± 1.6, 3.0 ± 1.2, 3.5 ± 2.1 and 2.4 ± 0.9 s to 4-s stimulation in these models, respectively. Summary of the changes in CBF evoked by photo-stimulation in the different transgenic mouse models used (VIP-cre, PV-cre, SOM-cre and NOS-cre). Error bars denote standard error. Since typical vascular responses evoked by stimulation peak several seconds after stimulation onset, we measured CBF changes 2–4 s after onset for 1-s stimulation (panels a, b, e and f) and 4–7 s after onset for 4-s stimulation (panels c, d, g and h). Significant differences from baseline are denoted by (white *, p < 0.05). Linear regression analyses were performed to determine whether significant relationships were observed with respect to the photo-stimulus pulse duration (panels e and g) and frequency (panels f and h). Significant relationships are denoted by a (black *, p < 0.05).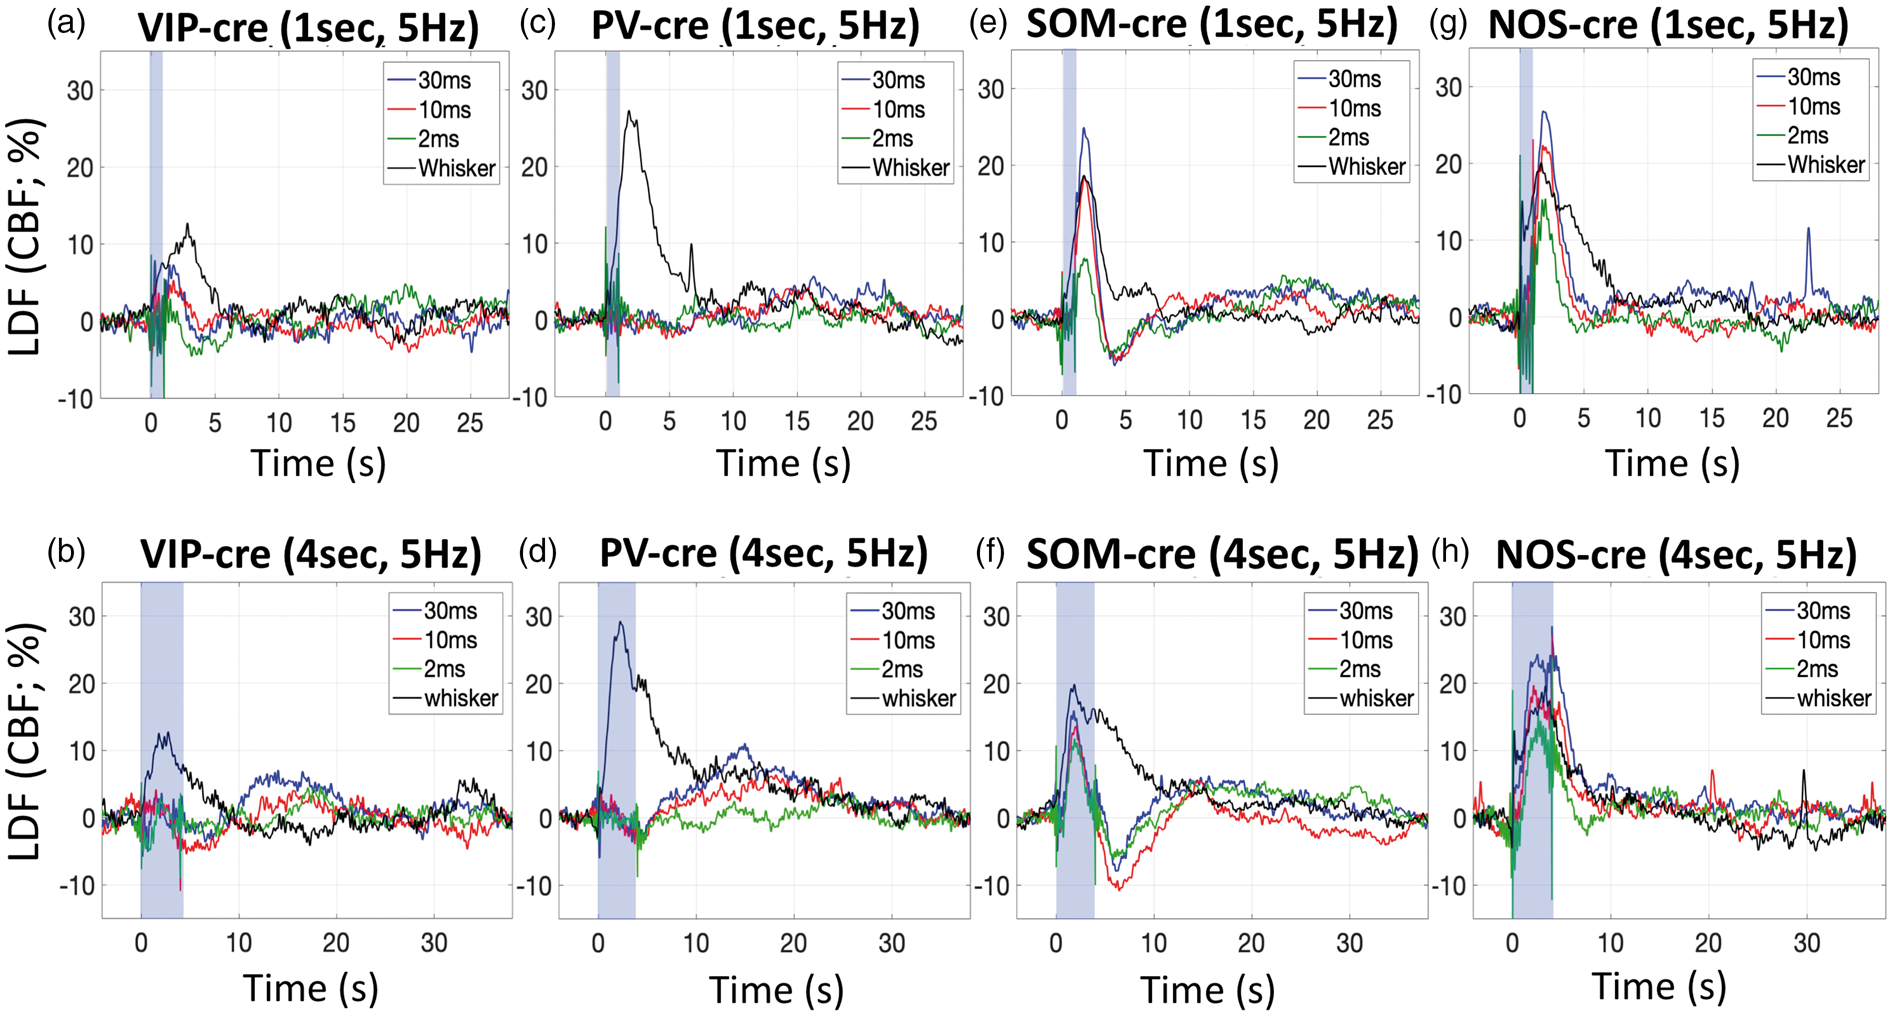
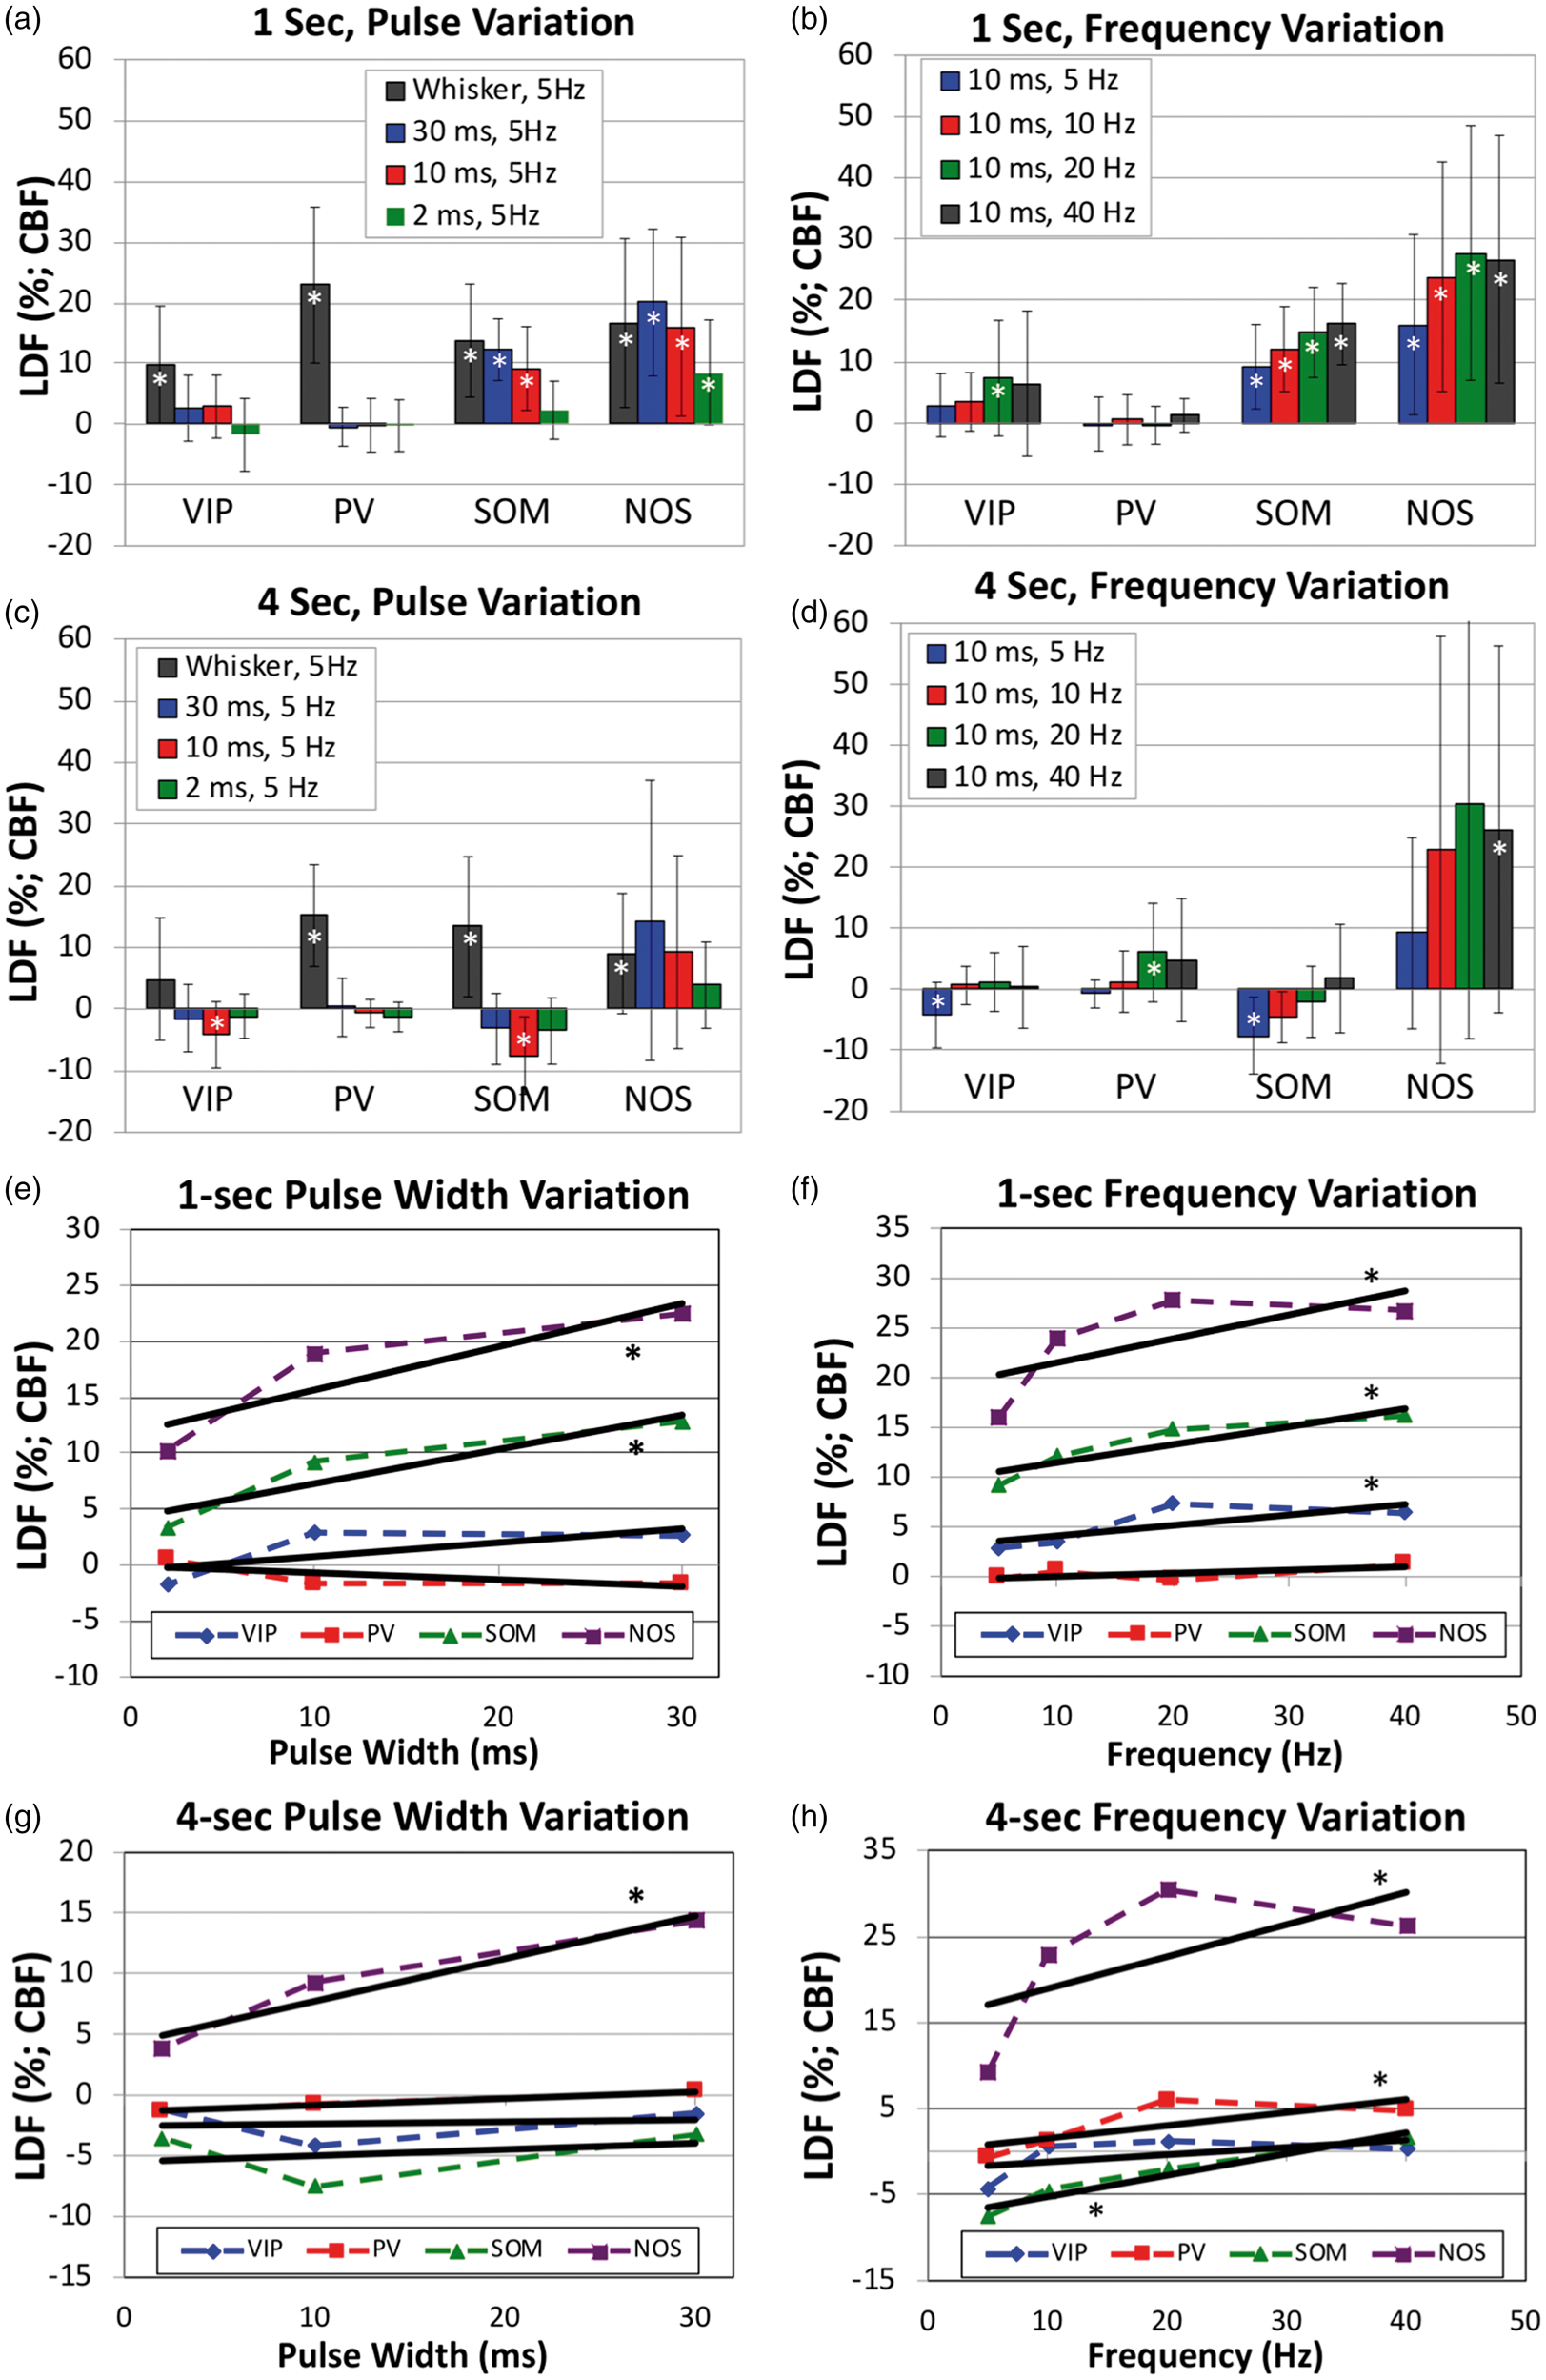
In VIP-cre mice, photo-stimulation for 1 s appeared to evoke small increases in CBF after the stimulation period, but these increases did not reach significance except for photo-stimulation at 20 Hz (p = 0.043; Figure 4(a), Supplementary Figure 2(a), Figure 5(a) and (b)). These responses peaked around 2 s after stimulation onset when present, and peaked faster than the whisker response. Fast changes in LDF signal around photo-stimulation (shaded blue bar in Figure 4) onset and off-set are artifactual and due to interference between the LDF probe and the photo-stimulus. The change in CBF amplitude immediately following 4-s photo-stimulation was not significant for most of the photo-stimulation parameters tested (Figure 4(b), Supplementary Figure 2(b), Figure 5(c) and (d)). The amplitude of the CBF changes appeared to scale with the photo-stimulus pulse duration for 1-s photo-stimulation (Figure 5(e)), but this trend was not significant (p = 0.09) and not present for responses evoked by 4-s photo-stimulation (Figure 5(g)). On the other hand, the amplitude of the CBF response scaled with stimulation frequency for 1-s photo-stimulation (p = 0.02; Figure 5(b) and (f)) but not 4-s photo-stimulation (Figure 5(g) and (h)).
In PV-cre mice, photo-stimulation for either 1 or 4 s at 5 Hz did not evoke typical CBF responses (Figure 4(c) and (d)), especially when compared to the responses evoked by whisker stimulation. Evident latent increases in CBF were observed 14 to 18 s after stimulation onset where the amplitude depended on the stimulus duration and pulse duration, with 10 ms and 30 ms photo-stimulation pulses delivered for 4 s producing larger latent increases in CBF (Figure 4(d) vs. (c)). This slower and latent CBF increase was observed especially at higher stimulation frequencies (20 and 40 Hz; Supplementary Figure 2(d)). Linear regression analyses showed no relationship between the CBF response amplitude immediately after stimulation and the photo-stimulus pulse duration or frequency (p > 0.44) except for 4-s photo-stimulation at different frequencies (p = 0.026; Figure 5(d) and (h)). However, the relationship between the latent CBF response (14 to 18 s after stimulation onset) and the stimulation frequency was significant (p < 0.008) for 1- and 4-s photo-stimulation experiments.
Different from VIP-cre and PV-cre mice, 1- and 4-s photo-stimulation at 5 Hz in SOM mice evoked evident increases in CBF (Figure 4(e) and (f)). Temporally, the increase in CBF that follows stimulation onset peaked between 1.7 and 2.1 s for both 1 and 4- s photo-stimulation periods. In addition, the increase in CBF was consistently followed by a CBF undershoot that bottomed around 4 s for 1-s photo-stimulation and around 6 s for 4-s photo-stimulation. For the 1-s photo-stimulation experiments, the CBF response amplitude was significantly modulated by the photo-stimulus pulse width (p = 0.0001/0.004/0.1 for 30/10/2 ms pulse durations, respectively; Figure 5(e)) and frequency (p < 0.0008 for 10, 20 and 40 Hz, respectively; Figure 5(f)). A significant relationship was observed for the CBF response amplitude following 4-s photo-stimulation at different frequencies (Figure 5(g)). The CBF increase evoked by 4-s stimulation occurred during the photo-stimulation period (shaded blue region), which is artifactually impacted by the photo-stimulus but mostly restricted to the onset and offset periods (Figure 4(f) and Supplementary Figure 2(f)). For this reason, we only considered CBF responses following the stimulation period. More importantly, a latent increase similar to that observed in PV mice was also observed around 15 s following stimulation onset that was significantly (p < 0.0001) modulated by the stimulation frequency (Supplementary Figure 2(f)).
For NOS-cre mice, photo-stimulation for 1 s also generated significant increases in CBF that shared similarities with the responses obtained in SOM-cre mice, but with notable differences. NOS-cre mice showed robust increases in CBF following optogenetic stimulation, but did not show an undershoot or latent increase following stimulation (Figure 4(g) and (h) and Supplementary Figure 2(g) and (h)). All CBF increases to 1-s photo-stimulation were significant (p = 0.005/0.022/0.029 for 30/10/2 ms pulse duration, respectively, and p = 0.013/0.011/0.012 for 10/20/40 Hz, respectively; Figure 5(a) and (b)). The peak CBF response was between 1.8 and 2.3 s for 1-s photo-stimulation and between 2.7 and 4.8 s for 4-s photo-stimulation. We observed larger variability for the CBF responses to 4-s photo-stimulation partly due to the fast CBF response peak and return to baseline. Increasing the frequency of 4-s photo-stimulation induced prolonged CBF increases that returned to baseline 25 to 30 s after stimulation onset (vs. 5 to 10 s for all other responses in NOS-cre mice). Linear regression analyses showed significant relationships between CBF response and all photo-stimulation parameters tested (Figure 5(e) to (h) with p < 0.01). Interestingly, photo-stimulation for 1- or 4-s with pulse durations of 10 or 30 ms produced CBF responses that were similar (or larger) in magnitude to whisker-evoked CBF responses. Similar increases were also observed in SOM-cre mice (Figure 4(e) to (h)). Photo-stimulation of NOS-cre mice for longer pulse durations or higher stimulation frequencies produced the largest CBF increases out of all the mouse models tested (Figures 4 and 5).
Discussion
We investigated the role of sub-types of inhibitory neurons on the regulation of cerebral blood flow using different transgenic mouse models (PV-cre, VIP-cre, SOM-cre and NOS-cre). Channelrhosopin-2 was virally expressed in somato-sensory cortex. To ensure the neurovascular mechanisms were not perturbed by surgery or viral transduction, whisker stimulation was used to determine whether typical CBF responses were present in all mouse models. We observed typical CBF responses evoked by whisker stimulation, with average peak amplitude of 13.2% taking place 2 to 4 s following onset and subsided 10 to 15 s after stimulus cessation. Photo-stimulation of SOM-cre and NOS-cre mice produced significant increases in CBF that were similar to that evoked by whisker stimulation. Photo-stimulation in NOS-cre mice produced significant CBF responses (overall average increase of 19.2%) that scaled with the stimulus pulse duration and frequency. The amplitude of the CBF responses in these mice was similar to those produced by whisker stimulation; however, in SOM-cre mice, CBF increases (11.1% on average) were followed by prominent post-stimulation undershoots. Photo-stimulation in VIP-cre mice did not produce significant changes in CBF except for 1-s photo-stimulation at frequencies over 5 Hz. Also, photo-stimulation in PV-cre mice did not produce typical increases in CBF, rather slow and latent increases in CBF were observed that scaled with stimulus duration and frequency and peaked 14 to 18 s after stimulation onset. Control experiments performed in non-expressing regions of these mice or in NOS-cre mice prior to Tamoxifen administration showed no changes in CBF following photo-stimulation. Collectively, our results indicate that NOS-expressing inhibitory neurons are able to strongly regulate local CBF, while SOM-expressing inhibitory neurons can both increase and provide an undershoot in CBF. On the other hand, VIP and PV-expressing neurons do not appear to play a significant role in local CBF regulation. These findings build on previous studies to clarify the role and impact of sub-populations of neurons on local blood flow regulation. More importantly, our findings suggest that dysfunction in NOS or SOM neurons can have a significant impact on CBF responses that could be detected by vascular-sensitive brain imaging methods, like BOLD, CBF (e.g. arterial spin labeling) or CBV (e.g. VASO) fMRI.
Two-photon microscopy images acquired prior to experimentation revealed numerous ChR2-YFP neurons in the somato-sensory cortex of all models used. Immunostaining post-experimentation verified that the mouse models successfully targeted large fractions of the inhibitory neuron cell types of interest (INTI). We cannot rule out the possibility that non-overlapping YFP+ expression can introduce unwanted, non-specific responses. We believe non-specific effects are not significant for several reasons. First, anatomical assessment of this population cells (YFP+/INTI−) did not reveal long-range connections to thalamus or the contra-lateral hemisphere, suggesting that these neurons are not pyramidal. This reinforces the notion that non-specific effects, if present, likely stem from other types of inhibitory neurons. Second, the targeted neuronal populations are, in general, genetically distinct, with the exception of SOM and NOS mice. Third, all the models we tested show slightly different CBF response features. Cross-talk between models would likely show more similar responses between models.
An important consideration in our experiments is that in some mice, YFP expression was biased to the upper layers (see Figure 3). It is possible that some of our results preferentially report regulation properties from cell populations that preferentially exist in upper layers. However, we consistently observed expression spanning Layers III and V, with most variability in Layer VI expression. Inhibitory neurons that preferentially exist in this layer tend to be PV+ or NOS+. In addition, considering that photo-stimulus delivery at the surface of the cortex has difficulty reaching deeper layers, it is possible that our experiments did not completely capture the role of these cells. Nonetheless, previous experiments from our laboratory suggest that the photo-stimulus parameters chosen influence Layer V/VI neuron activity.14,40 We also note variability in the CBF responses evoked by whisker stimulation. We believe this might be due to several possibilities, such as mice whisking frequently especially after whisker stimulation, 47 variability of the expressing region not completely overlapping with the whisker region, and variable placement of the puffer. Although we used systematic methods to minimize these sources of variability, our primary goal for whisker stimulation was to verify that neuro-vascular regulation was present in our experimental models, which we observed.
It is not surprising that NOS- and SOM-expressing inhibitory neurons are able to regulate or influence local CBF. Nitric oxide is freely diffusible and a potent vasodilator. NOS-expressing inhibitory neurons also generally express SOM,24,33,48 such that vascular regulation is likely mediated by the activity-dependent release of NO from these neurons. Their vascular association has been investigated, 24 although differences relative to other neuronal populations, layer distribution, or location along the vascular tree remain unknown. Somatostatin is a neuropeptide expressed by SOM neurons and this neuronal population is more genetically diverse, at least compared to PV and VIP-expressing inhibitory neurons, with additional sub-types. SOM-expressing inhibitory neurons include neurons that express NOS, neuropeptide-Y (NPY), calbindin (CB), calretinin (CR), cholecystokinin (CCK) and substance-P.34,49 Previous studies have highlighted the role of activating VIP, SOM and NOS neurons on neurovascular coupling and CBF responses. In vitro studies in brain slices with direct electrical stimulation or neuropeptide application showed VIP and NOS neurons produce increases in local microvascular diameter, while NPY and SOM produced vasoconstriction. 10 Similar findings were reported in slice experiments by Perrenoud et al., 24 where neuronal stimulation via bath application of serotonin produced dilations and constrictions. In this study, application of an NPY-receptor antagonist blocked vasoconstriction, while application of a NOS inhibitor blocked vasodilation, indicating that NPY interneurons mediate vasoconstriction and NOS neurons mediate vasodilation. A recent in vivo study corroborated the activity of NPY inhibitory neurons in the generation of vascular constrictions. 13 While we did not study this particular sub-type, our in vivo results are consistent with these reports since photo-stimulation of SOM neurons can target both NOS- and NPY-expressing inhibitory neurons and yielded increases and undershoots in CBF following photo-stimulation as observed in Figure 4. While it is evident that NOS-expressing neurons can produce prominent increases in CBF, experiments in SOM mice with the application of a NOS blocker could also be performed to further evaluate neuro-vascular constrictions. Lastly, it is worth noting that a small fraction of PV neurons can be targeted in the SOM-cre mouse model we used, which could partly explain the latent increase observed in photo-stimulation responses at higher frequency in these mice (Supplementary Figure 2(f)). 50
VIP is expressed by 10–15% of GABAergic cells in the barrel cortex. 44 The largest concentration (60%) of VIP-expressing neurons is in layer II/III, although VIP cells can be found in all cortical layers, and are anatomically characterized by vertically spanning arborizations that are bipolar/modified-bipolar and bitufted.43,44,51 VIP neurons are not fast spiking and are active during various brain states including but not limited to locomotion, non-locomotion, visual stimulation, and even under light anesthesia.44,52 Optogenetic stimulation of VIP-cre mice showed small increases in blood flow following stimulation that were smaller compared to the whisker CBF response. Additional experiments would be necessary to determine whether these increases can reach significance. Nonetheless, our results show some capacity by VIP neurons to generate vasodilation as reported by Cauli et al. 10
Although large numbers of PV+ cells expressed ChR2-YFP, optogenetic stimulation of these cells did not produce typical changes in CBF. Higher stimulus frequencies did produce latent increases in CBF (Figure 5(a) and (b)). This is interesting considering PV interneurons comprise about 40% of all GABAergic cells in the cortex. 31 They generally consist of basket and chandelier-shaped cells and are known for their fast spiking, non-adapting properties.51,53 In the somatosensory cortex, they are responsible for high frequency gamma oscillations, which are associated with strong cortical network activity. 54 More importantly, gamma oscillation strength is also known to correlate strongly with blood flow changes, including slower hemodynamic fluctuations.55–57 The slow increases in CBF observed with PV neuron stimulation show, to first approximation, a complex relationship. Our findings are different from a previous study where photo-stimulation of PV+ neurons elicited vasoconstriction of local arterioles in brain slices. 45 This difference might be due to in vitro vs. in vivo experimentation. PV neurons are not known for their vasoactive properties, weakly expressing nitric oxide and having little or no expression of vasoactive intestinal peptide.32,33 Their high-frequency spiking properties would imply high metabolic demands upon high-frequency stimulation which might explain the latent increase in CBF we observe with high-frequency photo-stimulation. Another possibility can be a rebound in activity from the pyramidal neurons that were previously inhibited, causing an increase in CBF. Considering their abundance in cortex and their connections to other cells (mainly pyramidal cells), they may indirectly regulate blood flow by inhibiting VIP or nitric oxide (NO) release through cortical circuits. Additional studies are necessary to determine the physiological mechanism underlying these slow increases in CBF, including electrophysiological monitoring of cortical activity.
Our results show similarities and differences compared to experiments performed in our laboratory using VGAT-ChR2 mice. 14 Photo-stimulation of VGAT-ChR2 mice under light ketamine anesthesia produced temporal CBF responses that were similar to those produced by NOS and SOM mice in this study. For more direct comparison, we also performed awake head-fixed experiments in VGAT-ChR2 mice (n = 4, Supplementary Figure 3). Interestingly, optogenetic stimulation under awake conditions produced CBF responses that peaked a few seconds earlier (and showed a milder modulation to optogenetic pulse duration) compared to our previous study. We verified these CBF response features by performing experiments in these mice under light-ketamine anesthesia (data not shown). In our previous study, we also found that pharmacological blockade of NOS suppressed increases in CBF evoked by inhibitory neuron activity. 14 Since VGAT-ChR2 mice target inhibitory neurons, we hypothesize that of photo-stimulation of most inhibitory neurons would produce, at least to first approximation, a weighted combination of photo-stimulating individual sub-populations. This hypothesis of course ignores the impact of initiating activity in sub-populations of inhibitory neurons on network activity and vascular regulation. It is also important to consider that differences in the experimental condition (light anesthesia vs. awake) might make comparisons difficult. Nonetheless, CBF undershoot responses were observed following CBF increases for stronger photo-stimuli (i.e. 30 ms pulse duration at 5 Hz or 20 Hz frequency), but not as evident as those observed in SOM mice. Interestingly, CBF undershoot responses were also observed after NOS blockade in our ketamine-anesthetized VGAT experiments. Therefore, our studies support the notion that SOM-NPY neuron activity likely generate decreases or undershoots in CBF.
Implications and future work
Our findings corroborate the strong influence of NOS- (and SOM) expressing inhibitory neurons on cerebral blood flow by producing increases in CBF that are similar or even exceed those produced by sensory stimulation. Our findings suggest that dysfunction in NOS neurons can attenuate the positive CBF response, while dysfunction in SOM neurons can work to attenuate both positive (via dysfunction in NOS sub-types) and negative (via dysfunction in NPY sub-types) CBF responses. Our results also show minor influences from PV and VIP inhibitory neurons, suggesting that dysfunction in these neurons will not have as significant of an influence on CBF responses. However, dysfunction in these neuronal populations is likely to have a profound impact on network activity, which might disrupt changes in CBF in a more complicated manner. The metabolic contribution of these neuronal populations also needs to be investigated since changes in local oxygen consumption can also impact fMRI signals. Studies in additional mice including pharmacological strategies and electrophysiological recordings are necessary to further establish the mechanisms and relative contributions of our findings.
Lastly, while photo-stimulation of these neuronal populations is essential to determine whether these cell types can modulate local CBF, this mode of stimulation does not engage neuronal activity in a physiological manner. Physiologically relevant approaches could involve pharmacological intervention or the up- and down-regulation of spiking activity using optogenetic silencers, step-function opsins or chemogenetics. These approaches would more directly uncover the impact of dysfunction in specific cell types on local CBF modulation. Our group is currently testing these approaches.
Funding
The author(s) disclosed receipt of the following financial support for the research, authorship, and/or publication of this article: This work was supported by NIH grants R01-NS-094404 (to AV), F31-NS106764 (to CR) and R01-AR063772 (to SR).
Supplemental Material
Supplemental Figures - Supplemental material for Optogenetic assessment of VIP, PV, SOM and NOS inhibitory neuron activity and cerebral blood flow regulation in mouse somato-sensory cortex
Supplemental material, Supplemental Figures for Optogenetic assessment of VIP, PV, SOM and NOS inhibitory neuron activity and cerebral blood flow regulation in mouse somato-sensory cortex by Michael B Krawchuk, Catherine F Ruff, Xiaoling Yang, Sarah E Ross and Alberto L Vazquez in Journal of Cerebral Blood Flow & Metabolism
Footnotes
Acknowledgements
We would like to thank Dr. Edith Hamel for her comments on this work. Also, we would like to thank the Center for Biological Imaging (CBI) of the University of Pittsburgh for their help imaging histological samples as well as Dr. Karl Deisseroth and the University of North Carolina Viral Vector Core for generously providing and facilitating access to the optogenetic constructs used in this work.
Declaration of conflicting interests
The author(s) declared no potential conflicts of interest with respect to the research, authorship, and/or publication of this article.
Authors’ contributions
MBK, XY, CFR, SER and ALV contributed to the concept and design of this work. MBK, XY, CFR and ALV contributed to the data acquisition and analysis of the data. MBK, CFR, SER and ALV contributed to the interpretation of the data.
References
Supplementary Material
Please find the following supplemental material available below.
For Open Access articles published under a Creative Commons License, all supplemental material carries the same license as the article it is associated with.
For non-Open Access articles published, all supplemental material carries a non-exclusive license, and permission requests for re-use of supplemental material or any part of supplemental material shall be sent directly to the copyright owner as specified in the copyright notice associated with the article.