
Abstract
The cerebral blood flow velocity (CBFV) in the basal arteries during a word-generation task was assessed by functional transcranial Doppler ultrasonography (fTCD) and by functional magnetic resonance imaging (fMRI). The study investigates how event-related CBFV modulations in the middle cerebral artery (MCA) relate to regional cerebral blood flow (rCBF) changes. Both fMRI and fTCD were used in 13 subjects (7 men, 6 women, aged 21 to 44 years). The maximum difference of relative CBFV changes between the left and right MCA during the word-generation task was used as the language laterality index (LIfTCD). For the fMRI examination during the nearly identical language task, the corresponding index was defined by LIfMRI = 100(NL − NR)/(NL + NR), where NL and NR refer to the numbers of voxels activated in the left and right hemisphere, respectively. The evoked CBFV changes expressed by LIfTCD and the corresponding laterality index, LIfMRI, estimated by fMRI showed a close linear relation (regression analysis: r = 0.95, p < 0.0001). The results of this study demonstrate that language-related velocity changes in the MCAs relate to rCBF increases in a linear fashion. Since the laterality indices assessed by fMRI and fTCD are in such close agreement both techniques can therefore be used in a complementary way.
Keywords
Assessment of hemispheric language dominance (HLD) is a necessary preparation for resective surgery for the relief of medically refractory focal epilepsy. It also is important as a basis for the evaluation of transhemispheric language restitution after stroke. Previously, a reliable determination of HLD was possible only by the invasive intracarotid injection of amobarbital (Wada and Rasmussen, 1960). This technique carries a small but definite risk of fatal complications (Loring et al., 1992; Woods et al., 1988). The measurement of the hemodynamic response to language tasks has emerged as a non-invasive alternative in the assessment of language areas (Binder et al., 1996; Desmond et al., 1995; Knecht et al., 1998a). Functional magnetic resonance (fMRI) is particularly helpful in imaging spatially localized brain tissue oxygenation changes associated with various aspects of language. Functional magnetic resonance of the brain using blood oxygenation level-dependent (BOLD) contrast relies on the changes of paramagnetic deoxyhemoglobin concentration, which affects brain parenchyma and draining venous vessels. The technique has a unique set of problems, limiting its general applicability to subjects able to lie still in a scanner for an extended period of time and cooperate adequately with the cognitive task. Functional transcranial Doppler sonography (fTCD) of the averaged hemispheric perfusion difference over multiple repetitions of a language task is another method to establish cerebral activation associated with language (Bishop et al., 1986; Droste et al., 1989; Gomez et al., 1990; Hartje et al., 1994; Kelley et al., 1992; Njemanze et al., 1992; Bulla-Hellwig et al., 1996; Droste et al., 1996; Knecht et al., 1996; Deppe et al., 1997a). This technique contents itself with the measurement of the cerebral blood flow velocity (CBFV) in the middle cerebral arteries (MCAs). Combined with the continuous control of performance, fTCD thus provides a robust index of lateralization. Moreover, since the Doppler probes are firmly attached to the head of the subjects, fTCD is an easily applicable and mobile technique allowing for determination of language lateralization in large series of subjects and in patients not capable of full cooperation. It is not possible to use fTCD in approximately 5% of subjects for lack of a temporal bone window.
Both fMRI and fTCD have been independently validated by direct comparison with the intracarotid amobarbital procedure and provided concordant results with the Wada test in every single case and a high overall correlation (Desmond et al., 1995; Binder et al., 1996; Knecht et al., 1998a).
Therefore, fMRI and fTCD ideally should complement in the noninvasive, reliable and valid assessment of language, that is, in the evaluation of patients before brain surgery or in the scientific investigation of the variability of language lateralization in large cohorts.
However, fMRI and fTCD record different phenomena, that is, the cerebral oxyhemoglobin-deoxyhemoglobin ratio and the CBFV in the basal arteries, respectively. The relation between these measures has not been investigated empirically for hemodynamic responses to cognitive tasks. Specifically, it is not known whether the results by one technique translate into that by the other in a linear fashion. Therefore, in the current study, we performed a direct comparison of language lateralization determined by fMRI and fTCD.
METHODS
Subjects
We studied 13 healthy volunteers (7 men, 6 women), ages 21 to 44 years (mean age 27.6 years ± SD 6.0 years). Subjects gave their written informed consent to participate in the study. All were native German speakers. Nine of the volunteers were right handed and four left handed by the Edinburgh handedness inventory (Oldfield, 1971). Functional MRI and fTCD evaluations were performed by two different examiners, both blinded to the results obtained with the other technique.
The work was part of the Münster functional imaging study on the variability of hemispheric specialization in health and disease (Deppe et al., 1997b; Knecht et al., 1997, 1998a, 1998b, 1999). Of 188 healthy subjects investigated by fTCD, we randomly chose 6 volunteers with right and 7 with left HLD by fTCD for fMRI. No selection criteria other than side of lateralization were used.
Functional transcranial Doppler ultrasonography
Setup. Assessment of HLD by fTCD was performed by a standardized word-generation paradigm used in several previous studies and validated by direct comparison with the intracarotid amobarbital injection (Knecht et al., 1996; Knecht et al., 1997; Knecht et al., 1998a). Subjects were presented a letter on a computer screen 2.5 seconds after a cuing tone. They silently had to find as many words as possible starting with the displayed letter. The performance was controlled by instructing the subjects to report the words after a second auditory signal, following 15 seconds after presentation of the letter. All words had to be reported within a 5-second time period. The next letter was presented in the same way after a relaxation period of 30 seconds. Letters were presented in random order. “Q,” “X,” and “Y” were excluded because few German words have these letters as initials. No letter was displayed more than once.
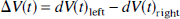
Changes in CBFV in the basal arteries were continuously measured during the examination with a commercially available dual transcranial Doppler ultrasonography device (Multi-Dop T, DWL, Sipplingen, Germany). The MCAs were insonated at a depth of 50 mm with two 2-MHz transducer probes attached to a headband and placed at the temporal skull windows bilaterally (Fig. 1; for details of the technique, particularly the correct identification of the MCAs, see Ringelstein et al., 1990). The spectral envelope curves of the Doppler signal were recorded with a rate of 28 sample points per second and stored for off-line analysis.
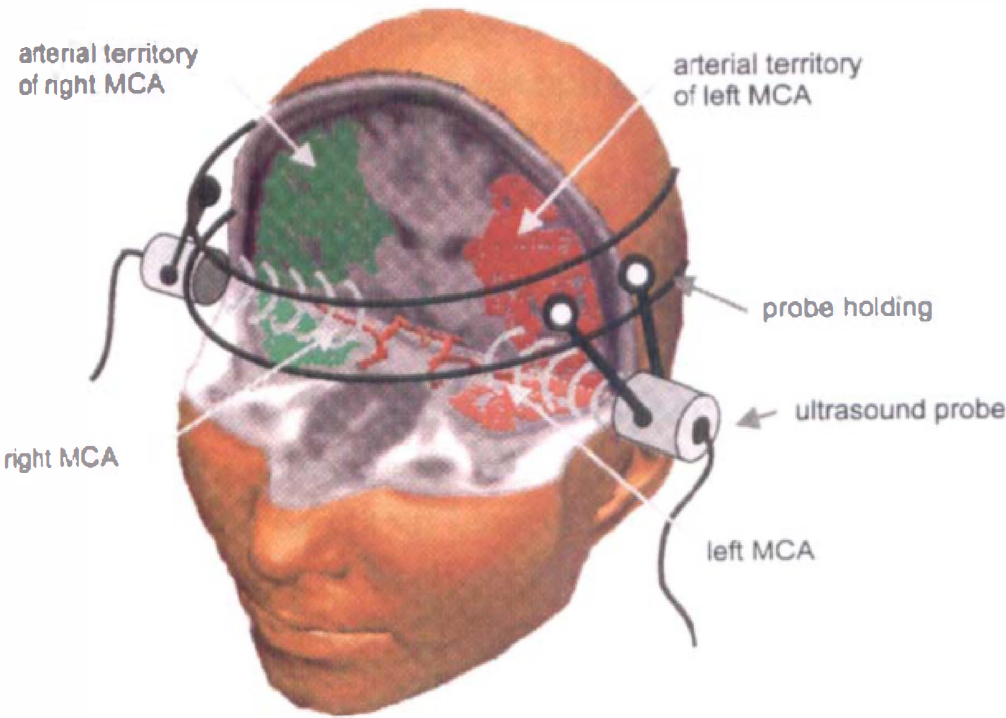
Bitemporal transcranial insonation of the left and right middle cerebral arteries (MCAs) with two ultrasound probes. The left and right arterial territories of the MCAs are colored in red and green. Ultrasound probes are mounted on a headband.
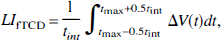
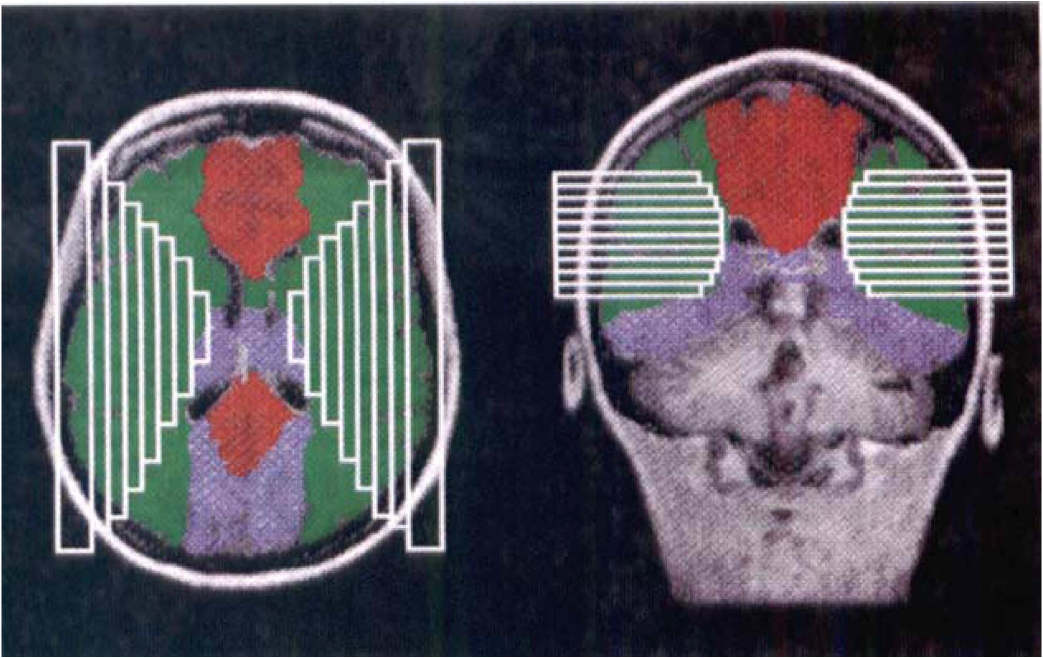
FTCD data analysis. The fTCD analysis was performed using the software AVERAGE Version 1.30 (Deppe et al., 1997). Artifacts, like those elicited by probe displacement, were automatically detected by AVERAGE's implemented artifact detection routines. Data of stimulation trials that were affected by artifacts during the recordings were rejected from further analysis. Additionally, epochs containing CBFV values outside of the range of 30% to 200% of the mean flow velocity were rejected. The remaining data were integrated over the corresponding cardiac cycles, segmented into epochs that related to a cuing tone, and then were averaged (for details see Deppe et al., 1997a). The epochs were set to begin 15 seconds before, and to end 35 seconds after the cuing tone. The mean velocity in the 15 seconds precuing interval (Vpre.mean) was taken as the baseline value. The relative CBFV changes (dV) during cerebral activation were calculated by the formula:
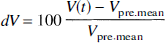
where V(t) is the CBFV over time. Two examples of a language activation related dV change are shown on Fig. 2, one indicating left HLD and one right HLD. The averaged CBFV changes during speaking were excluded from further analysis because they were considered contaminated by movements of the temporal muscles. Differences in the velocity changes in the two MCAs in every subject were statistically evaluated by the Wilcoxon test for each sample point of the epoch interval.
Sample fMRI and fTCD results for two representative subjects. Right: the blue curve represents the percentage CBFV difference dV between the left and the right MCA assessed by functional TCD. The abscissa reflects a time interval beginning 15 seconds before the cueing tone and ending 35 seconds afterwards (epoch interval). The red bar illustrates the fTCD laterality index with the corresponding confidence region (green area). A positive index indicates left hemispheric dominance (subject 1, upper level), a negative one right dominance (subject 2, lower panel). Left: Corresponding axial fMRI slices for the two subjects. Activation is mainly associated with the classical Broca area for subject 1 and lies within the right sided homologue Broca territory for subject 2 (Deppe et al., 1999).
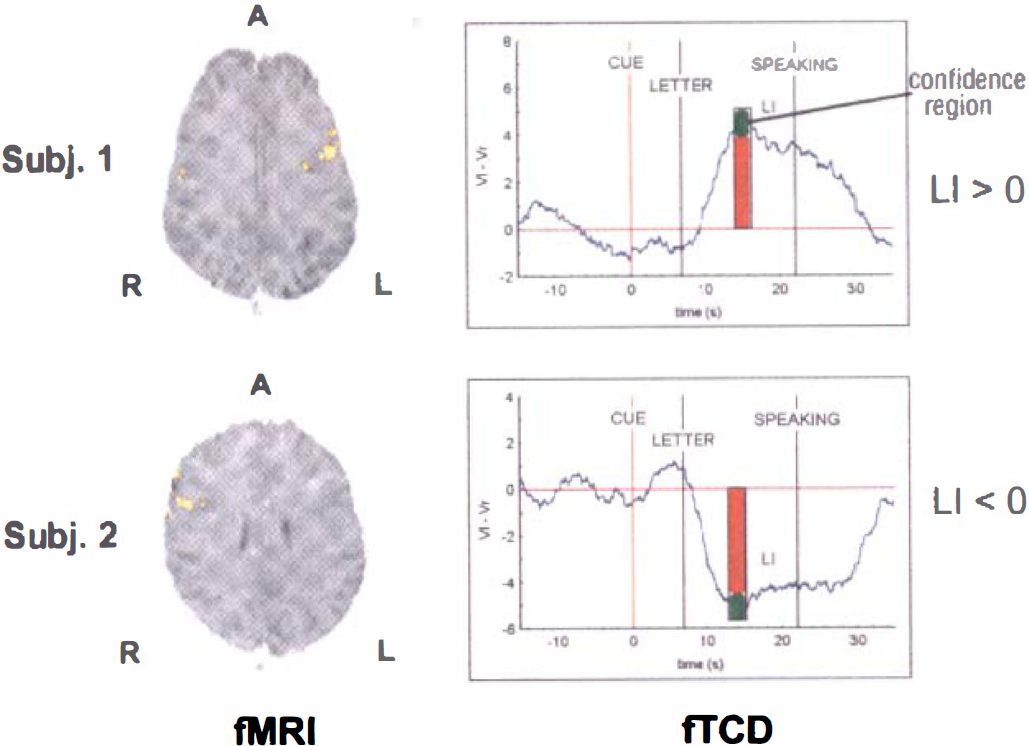
The fTCD laterality index LIfTCD was calculated by the formula:
where
is the difference between the relative velocity changes of the left and right MCAs. The time point tmax represents the latency of the absolute maximum of ΔV(t) within the word-generation interval (5 to 22 seconds). As the integration interval, a time period of tint = 2 seconds was chosen. A positive sign of LI indicates left and a negative right dominant language processing. The magnitude represents the degree of lateralization. The accuracy of the LI of each individual has been determined by its stochastically estimated confidence interval. Longitudinally studies have shown the high reproducibility of the laterality index (Deppe et al., 1997b; Knecht et al., 1998b). A graphic illustration of the LI and its confidence interval is given in Fig. 2.
Functional magnetic resonance imaging
Image acquisition. Functional images were scanned by a 1.5-T MR System (Magnetom Vision, Siemens, Germany) equipped with a circularly polarized head coil. Ten axial slices of 3 mm thickness and 3.75 mm distance were acquired using a BOLD-sensitive multislice echo planar imaging (EPI) sequence (echo time [TE] = 64 milliseconds; repetition time [TR] = 3 seconds; TA = 1.44 seconds; 90° flip angle) for functional imaging and T1-weighted sequences (TE = 15 milliseconds; TR = 350 milliseconds; 90° flip angle) for better anatomic assignment of the EPI planes. The slices were oriented parallel to the intercommissural anterior commissure-posterior commissure (AC-PC) line. The lowest plane was adjusted to the AC-PC line, which had been identified by anatomic sagittal scouts. Both EPI and T1 slices were acquired from a matrix resolution of 64 × 128 voxels, corresponding to a voxel size of 1.64 × 3.28 × 3.0 mm and a field of view of 210 mm × 210 mm. Additionally, for detailed three-dimensional anatomic information, a sagittal 3D MPRAGE data set (matrix: 256 × 256, 160 slices, field of view 256 mm × 256 mm, slice thickness 1 mm, TE 4.4, TR 11.4 seconds, flip angle 15°) covering the whole head was acquired for each subject. Foam padding was used to limit head motion. No additional head fixations like a bite bar or a face mask were used for maximum convenience of the volunteers. If a center-of-mass analysis showed image contamination by motion artifacts, if pseudoactivation outside of neuronal tissue occurred, or if the signal-to-noise contrast was poor, the acquisitions were repeated. This was the case in three examinations. In all repeated scans, the artifacts were markedly reduced. All fMRI parameters have been kept as constant as possible for each examination.
FMRI activation task. The fMRI word-generation task was designed as similar as possible to the fTCD task in a classic categorical “boxcar” paradigm. For language activation, subjects were asked to generate as many words as possible, beginning with an acoustically presented letter (i.e., A, O, L, B, D, E). Each acquisition series began with five dummy image acquisitions to achieve the magnetic resonance signal into equilibrium, continued with an interval of silent word generation (SWG1), a resting period (R1), a period of word generation including speaking (LWG), a resting period (R2), and one period of silent word generation (SWG2) with subsequent loud speaking of the found words (SP) allowing to control for task compliance. A complete session was composed of three of those series in succession. The resting periods R1 and R2 were covered by 10 image acquisitions. The silent and loud word-generation phases SWG1, SWG2, and LWG also were covered by 10 acquisitions, and the following speaking interval SP by 5. Thus, data that could be used of one whole session consisted of a series of 3 × (10 + 10 + 10 + 10 + 10 + 5) = 165 acquired images.
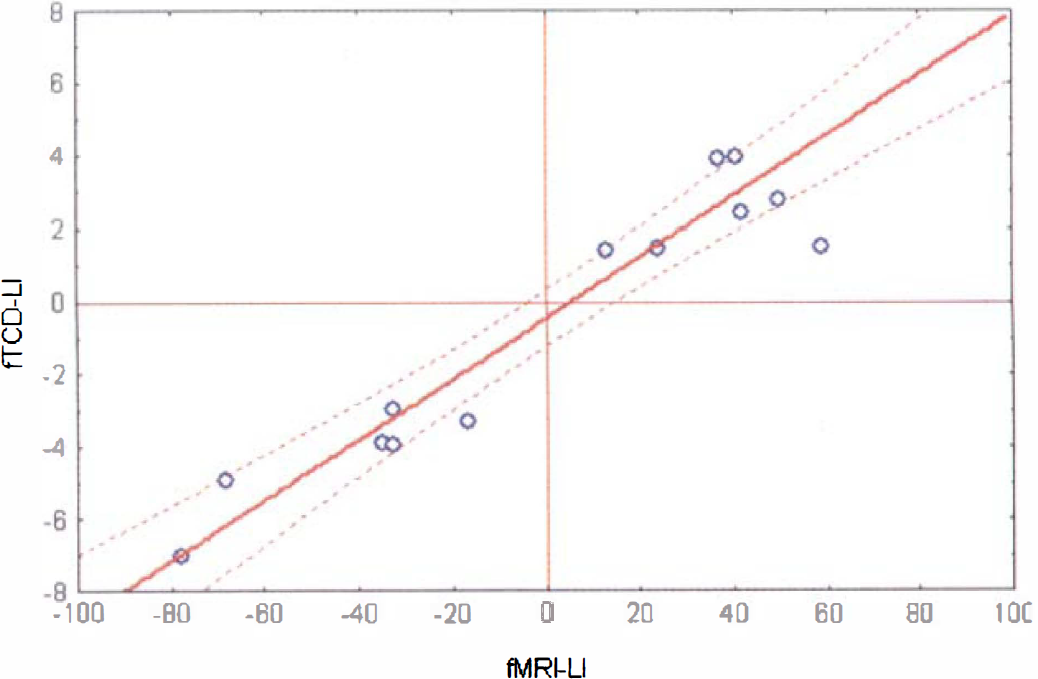
Data analysis. Functional analysis was performed using the program Stimulate Version 5.0 (Strupp, 1996) with assistance of the software package AFNI (Cox, 1996) on a Sun Ultra 1 UNIX workstation, which was equipped with 384 megabytes of memory and 30 gigabytes of disk space for direct data access to all images. A voxel-by-voxel two-factor analysis of variance revealed that for no subject did substantial differences in activation occur between the three different tasks SWG1, LWG, and SWG2. Therefore, all data of LWG, SWG1, and SWG2 were collapsed into one group to increase the function-to-noise contrast. Activation maps then were calculated on the basis of a voxel-by-voxel t-test between images acquired during rest (R1, R2) and activation intervals. Voxels were classified and registered as activated on a significance level of p < pcritical = 0.01. To reduce the noise in the activation maps (i.e., false-positive voxels), the minimum cluster size was set to five activated voxels. For further neuroanatomic identification of activated centers, all images were transformed into the Talairach coordinate system (Talairach and Tournoux, 1988).
where NL and NR refer to the numbers of voxels activated in the left and right hemisphere, respectively. Taking into consideration that the activated volume is proportional to the number of voxels, this definition is identical to the one used in the study by Binder et al. (1996) on the comparison of fMRI with the Wada test for language lateralization. LIfMRI ranges from −100 to +100. Corresponding to LIfTCD, a positive LI reflects left HLD, and a negative LI reflects language processing, mainly within the right hemisphere. Only voxels within a predefined wedge-shaped region corresponding roughly to the MCA vascular territory were considered for NL and RR (Fig. 3). Information about the arterial territory of the MCAs was taken from the digital anatomic atlas VOXEL-MAN (Institute of Mathematics and Computer Science in Medicine, 1996; Höhne et al., 1995).
Supplying areas of the three basal cerebral arteries; anterior cerebral artery (blue) of both hemispheres. Activated voxels withing the white rectangles have been considered for the calculation of the fMRI laterality index (Deppe et al., 1998).
RESULTS
During the word-finding interval, fTCD established in all subjects significant (p < 0.05) evoked velocity differences within the MCAs by Wilcoxon testing. Latencies of the peak differences ranged from 8.8 to 17.3 seconds (mean 13.3 seconds) after letter presentation. The fTCD laterality indices ranged from −7.0 to 4.0. The fMRI revealed that the main foci of activity were in the inferior and middle frontal gyri, corresponding to Brodmann areas 44, 45, and 46 (Broca area) and area 9 or within contralateral homologues of these areas. Two axial slices of the activation maps from two representative subjects for left HLD and for right HLD are shown in Fig. 2.
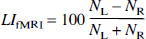
The indices of HLD assessed by fTCD and fMRI were concordant in all 13 subjects. Both fTCD and fMRI indicated a predominant language representation in the left hemisphere, evidenced by positive LI values, in 7 of the 13 volunteers. Six of them were right handed. For the remaining six subjects (three right handed, three left handed), both techniques established right hemispheric dominance by negative LI values. The language lateralization by fTCD (LIfTCD) and fMRI (LIfMRI) were compared by linear regression of the respective laterality indices. Figure 4 depicts the relationship between language-related CBFV changes expressed by the LIfTCD and the corresponding laterality index LIfMRI assessed by fMRI for all 13 subjects. The regression function was calculated as LIfTCD = 0.45 + 0.083 LIfMRI (formula 5). The correlation between both techniques was high (r = 0.95, p < 0.0001), indicating that both techniques correspond not only in the side of language dominance, but also in the degree of lateralization. As expected, the regression line predicts that a zero LIfMRI, describing symmetric language processing, is associated with a zero LIfTCD and vice versa.
Relationship between evoked CBFV changes expressed by the LIfTCD and the corresponding laterality index LIfMRI. The dotted curves represent the 95% confidence region for the regression line.
DISCUSSION
Agreement of the results
The current work is the first study on the interrelationship between the CBFV and the BOLD response to a cognitive activation. The fTCD results relate to brain tissue oxygenation changes measured by fMRI in a highly linear fashion expressed by the regression coefficient of r = 0.95. This close correlation between the results by fTCD and fMRI indicates that the laterality indices are not relevantly influenced by individual characteristics of each technique. The high correlation is in general agreement with previous studies on the relation between changes in the cortical perfusion and the blood flow velocity in the basal arteries. Clark et al. (1996) measured regional cerebral blood flow (rCBF) by 133Xe clearance simultaneously with the velocity blood flow in the left MCA over a wide range of arterial PCO2. This group reports a parabolic relationship between CBFV to MCA blood flow velocity over the imposed range of arterial PCO2. Similarly, before and after the application of intravenous acetazolamide, the measurements of CBFV by TCD and regional blood flow by single photon emission tomography using 133Xe inhalation revealed a significant positive correlation between blood velocity and rCBF (Sorteberg et al., 1989). Aaslid (1987) and Lindegaard et al. (1987) report that changes in rCBF are closely proportional to alterations of the velocity within the basal cerebral arteries in the response to physical stimuli. The time course and magnitude of CBFV changes in the MCA and the rCBF in the MCA territory during stimulation of the left sensorimotor cortex have been examined by Sitzer et al. They demonstrated a correspondence of evoked changes in mean CBFV and rCBF measured by TCD and positron emission tomography (Sitzer et al., 1994).
Although these studies corroborate the close correlation between the hemodynamic alterations in different compartments of the brain, there are substantial methodic differences in fMRI and fTCD that could have resulted in a complex rather than linear relation between the language indices. The LIfTCD reflects relative perfusion differences within two basal arteries and can mathematically adopt infinite large values, that is, an interval ranging from −∞ to +∞ (see formula 2). In contrast to LIfTCD, the possible range of LIfMRI is restricted to a finite interval, ranging from −100 to +100. On the basis of the mathematic characteristic that an infinite interval of real numbers cannot be transformed to a finite one by a linear transformation, the precise relation between LIfTCD and LIfMRI theoretically cannot be linear over the complete range. The results of the current work demonstrate that, practically, the evoked hemodynamic modulations are within a range where the relation between both indices can be approximated for the LI ranges of this study by the linear function given by formula 5. Both techniques provide equivalent information in terms of a laterality index for evaluation of HLD on a subject-by-subject basis. Based on the close agreement of fMRI and fTCD for determination of HLD, other more practical reasons will influence the choice for one of the techniques if both are available.
Properties of fMRI
Numerous factors affect fMRI results. The image raw data depend on physical parameters such as the used pulse sequence, slice thickness, slice gap, number of slices, slice orientation, temporal order of slice acquisition, field of view, bandwidth of the RF pulse, number of echoes, and matrix resolution. The type and strength of the magnet, its condition, and the kind of head coil used can substantially influence the image results (Papke et al., 1999). It is important to account for these properties of fMRI, especially when comparing results from different centers. The quality of the acquired images also can be disturbed by head movement, muscle contractions, and susceptibility artifacts (e.g., by metal implants). Task-correlated disturbances in the images usually increase the false-positive voxels of the functional maps. Additionally, the results of the functional analysis depend on the functional analysis method.
Properties of fTCD
The spatial resolution of fTCD is limited because CBF changes are integrated over the whole vascular territory of the insonated artery. The TCD devices allow for insonation of the anterior, middle, and posterior cerebral arteries. Thus, only three different regions in each hemisphere can be distinguished without knowing their precise extent in the individual subject.
The TCD velocity assessment is based on measurement of the Doppler frequency shift of an ultrasound beam reflected from moving blood particles. In contrast to fMRI, the results of fTCD (i.e., the relative CBFV differences in the MCAs) do not depend on arbitrary or adjustable parameters. Functional TCD directly measures the integrated regional blood flow changes in real-time as velocity modulations in the basal arteries supplying the activated brain regions. One limitation in TCD is that the absolute velocity within the cerebral arteries cannot be measured exactly (typical error 20%). This problem arises because the insonation angle (i.e., the angle between the ultrasound probe and the artery) usually is unknown. Nevertheless, the inaccuracy in the absolute velocity has no effect on the accuracy of the laterality index measured by TCD because LIfTCD is sensitive only to relative CBFV changes (equations 1 to 3). Relative CBFV changes are independent of the insonation angle and can be estimated with an error of less than 1% (Deppe et al., 1997a).
CONCLUSION
This work demonstrates that fTCD and fMRI provide qualitatively and quantitatively concordant information in the assessment of HLD. Functional MRI provides high spatial information on regional cerebral activation changes but is methodically complex and expensive. The spatial information of fTCD is restricted. The cost-effective technique shows excellent time resolution and easily allows for control of cooperation. Because of simplicity of the TCD technique, the fTCD laterality index described here provides a measure of hemispheric dominance, which is independent of arbitrary or adjustable parameters. Based on the close linear relation of the LI values, both techniques can be used interchangeably to evaluate hemispheric dominance for language on an subject-by-subject basis. Thus, fTCD can be used to evaluate large cohorts of subjects for language lateralization, and fMRI then can be used to obtain more spatial detail of activation in particular subjects (e.g., those with atypical language lateralization).