
Abstract
Sixteen patients with acute middle cerebral artery stroke were studied to correlate neuroinflammatory markers with perfusion- and diffusion-weighted magnetic resonance imaging (MRI) lesion volumes (PWI and DWI). At arrival (less than 6 hours), plasmatic matrix metalloproteinase (MMP)-9, MMP-2, interleukin (IL)-6, IL-8, intercellular adhesion molecule (ICAM)-1, and tumor necrosis factor (TNF)-α were serially measured (by ELISA), and MRI was performed. In cerebral ischemia, tissue destruction seems related to matrix metalloproteinases expression because baseline MMP-9 was the only predictor of the infarct volume measured as a DWI lesion (lineal regression: b = 0.50, 0.25–0.74; P < 0.001). Moreover, the extent of hypoperfused brain area (PWI) was associated with a proinflammatory cytokine release in the next hours (TNF-α and IL-6).
Keywords
With the recently developed magnetic resonance techniques of diffusion-weighted imaging (DWI) and perfusion-weighted imaging (PWI), it has become possible to image indexes of cellular injury (DWI) and blood flow (PWI) shortly after stroke onset (Belliveau et al., 1990; Le Bihan et al., 1986; Moseley et al., 1990).
Inflammatory cytokines and metalloproteinases have been shown to be overexpressed in ischemic stroke and may play a crucial role in the development of cerebral ischemia (Fassbender et al., 1994; Montaner et al., 2001). Whether the expression of these molecules may account for the recruitment of brain tissue into infarction remains unknown for humans. We aimed to correlate inflammatory markers expression with diffusion- and perfusion-weighted MRI lesion volumes and to study the relationship of these molecules with the infarct evolution.
METHODS
Patients
We prospectively studied consecutive patients with acute stroke. Our target was those patients evaluated within the first 6 hours of stroke onset involving the middle cerebral artery (MCA) territory. Transcranial Doppler was conducted upon admission by an experienced neurologist using a Multi-Dop X/TCD (DWL Elektroniche Systeme GmbH, Germany) device to confirm the presence of a MCA occlusion.
Because MRI was not available 24 hours in our hospital, those patients who satisfied clinical criteria (n = 8) but did not receive MRI were not included in the present study. We also excluded patients with a known inflammatory or malignant disease (n = 2). Finally, a total of 16 patients in which MRI protocol could be performed within 6 hours of onset of symptoms were included in the definitive analysis. All of those patients were considered to have had a cardioembolic stroke, most of them caused by an atrial fibrillation. Stroke severity was assessed using the National Institutes of Health Stroke Scale (NIHSS).
Because sample recruitment began before local approval of t-PA, only nine patients received intravenous thrombolytic therapy. This study was approved by the Ethics Committee of the hospital, and all patients or relatives gave informed consent.
Magnetic resonance imaging protocol
All MR imaging was performed with a 1.5 T whole body imager system with 24-mT/m gradient strength, 300-millisecond rise time, and an echo-planar-capable receiver equipped with a gradient overdrive (Magnetom Vision Plus, Siemens Medical Systems, Erlangen, Germany). The images obtained included the following: axial T2-weighted susceptibility-based echo-planar gradient-echo sequence [0.8/29/1 (TR/TE/acquisitions); total acquisition time, 2 seconds]; axial diffusion-weighted echo-planar spin-echo sequence [4000/100/2 (TR/TE/acquisitions); total acquisition time, 56 seconds], and axial perfusion-weighted echo-planar gradient-echo sequence [2000/60/40 (TR/TE/acquisitions); total acquisition time, 80 seconds].
DWI was obtained with a single-shot, spin-echo, echo-planar pulse sequence with diffusion gradient b values of 0, 500, and 1,000 sec/mm2 along all three orthogonal axes over 15 axial sections, with 5mm slice thickness (interslice gap of 1,5 mm), a field of view of 230 mm, and 96 × 128 matrix. The acquisition time for the DWI equalled 56 seconds. PWI was acquired by using a bolus of gadolinium-based contrast material (Magnevist, Schering AG, Germany) for selected 13 to 15 section positions measured 40 times sequentially. The perfusion-weighted sequence generated a time-to-peak (TTP) map for each section position that was immediately available for interpretation at the console with all the other images. PWI was obtained using sections 5 mm in thickness, an interslice gap of 1.5 mm, a field of view of 240 mm, and 128 × 128 matrix.
In 15 patients, the MRI study was fully completed. The remaining patient received only the baseline DWI because he was severely impaired and did not tolerate the entire exploration. In all of them, a second DWI was repeated 5 to 7 days after the initial MRI exam using the same protocol.
Volumetric assessment of lesion size
Volume measurements of the extension of tissue abnormality on DWI and on TTP maps were performed by an experienced neuroradiologist using a manual tracing technique and blinded to clinical and laboratory data. The perimeter of the area of abnormal high signal intensity was traced on each DWI and TTP map. All measured areas were multiplied by the slice distance to obtain the total lesion volumes for both the DWI and TTP maps (cubic centimeters, cc).
Immunoassay methods
Peripheral blood samples were drawn from each patient at study entry (before MRI was performed and any treatment administered) and again at 12 and 24 hours from stroke onset. Enzyme-linked immunosorbent assays (ELISA) were performed according to manufacturer's instruction. Plasma was used to measure MMP-2 and MMP-9, and serum was used to measure IL-6, IL-8, ICAM-1, and TNF-α. MMP-2 and MMP-9 levels were determined by commercially available ELISA (Biotrak Amersham Pharmacia, UK) and expressed in ng/mL. IL-6, IL-8, ICAM-1, and TNF-α levels were determined by other ELISA (Bender MedSystems), and their levels were expressed in pg/mL. The mean intraassay coefficients of variation were less than 10% for all measured molecules.
Statistical analysis
Descriptive and frequency statistical analyses were performed, and comparisons were made by use of the SPSS statistical package, version 9.0. To study the correlation between inflammatory markers and MRI volumes, the Spearman test was used. Linear regression analysis was used to find predictive variables of the MRI measured volumes. From each regression equations, we calculated the size of change in MRI volumes when the predictive biological marker increased. A P value of less than 0.05 was considered statistically significant.
RESULTS
Half of the included patients were women, and the mean age of the sample was 70 ± 12.2 years. At arrival, median NIHSS score was 19 (8–22), and by the end of the study, the final NIHSS score was 11 (0–25). Mean MRI scan time was 194 ± 78 minutes after symptom onset. The planimetric measurement disclosed an initial-DWI = 25.8 cc (3.5–329.7) and an initial-PWI = 225.4 cc (51.8–349.0). By the end of the study, the infarct volume increased to a final-DWI = 33.8 cc (5.3–451.7).
An increasing correlation existed between initial DWI volume and stroke severity over time (NIHSS baseline: r = 0.574, P = 0.008; NIHSS 12 hours: r = 0.708, P < 0.001; NIHSS 24 hours: r = 0.744, P < 0.001). That correlation was stronger than for PWI volumes (NIHSS baseline: r = 0.301, P = 0.275; NIHSS 12 hours: r = 0.496, P = 0.060; NIHSS 24 hours: r = 0.475, P = 0.086).
The temporal profile of the studied biomarkers is given in Fig. 1, whereas Table 1 shows the correlation study between MRI parameters and these inflammation markers at different time points. The hypoperfused tissue at arrival (PWI) was related in the next time points to TNF-α and IL-6 level. Significant correlations were specially found for PWI volume and cytokine release at the 24-hour time point (TNF-α: r = 0.838, P < 0.001; IL-6: r = 0.644, P = 0.013).
Correlation between inflammation markers and MRI parameters
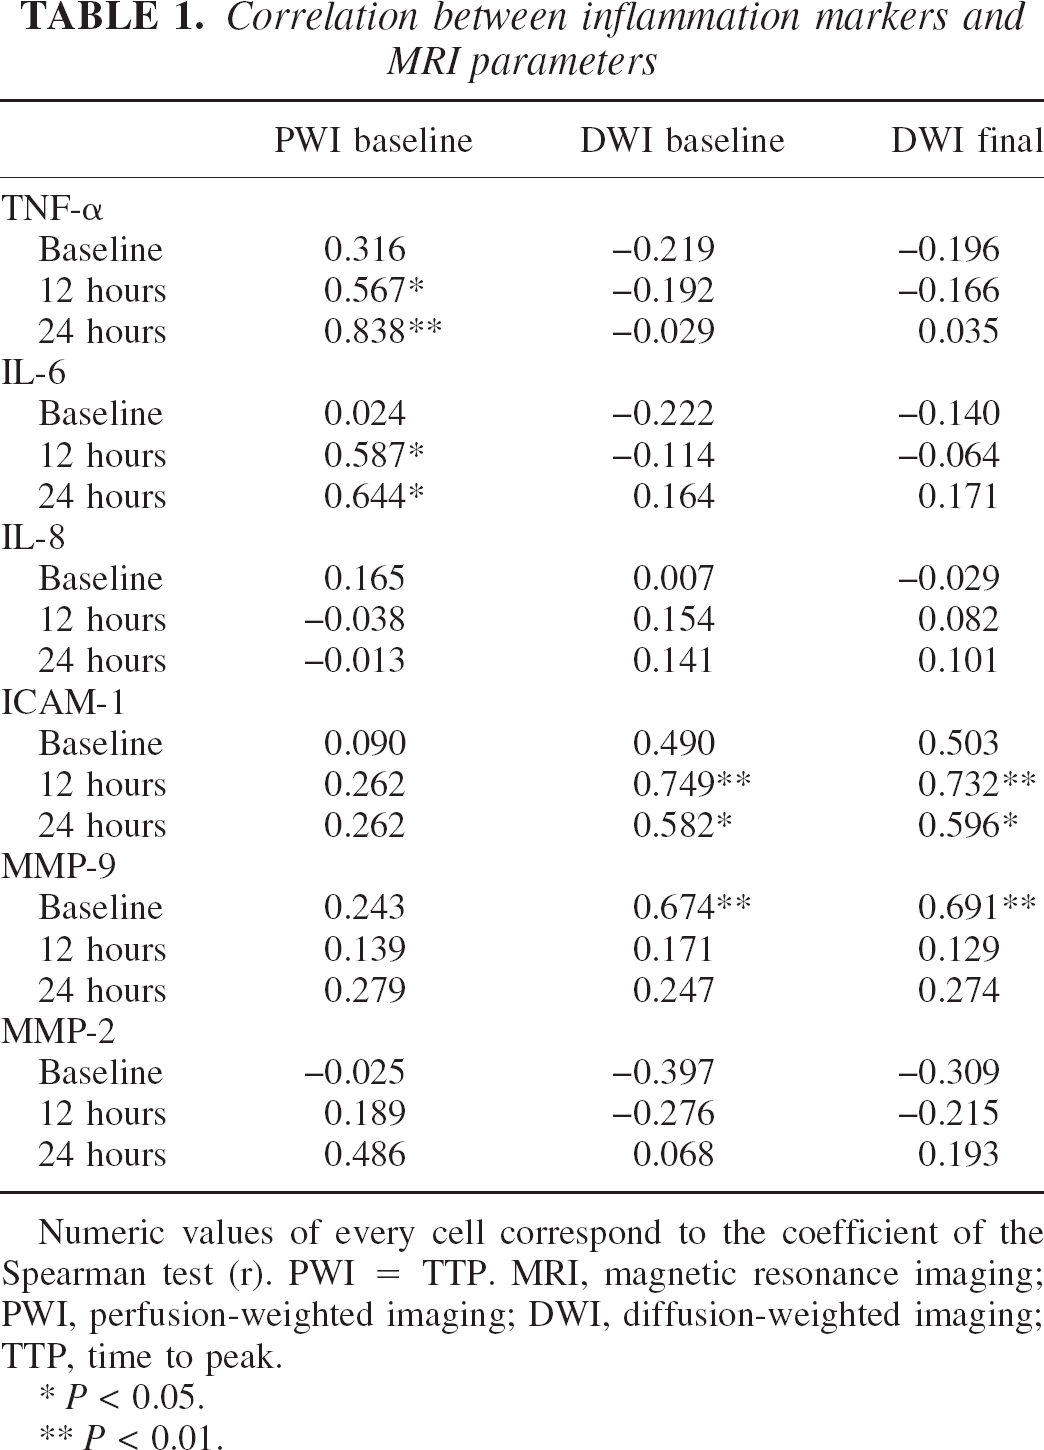
Numeric values of every cell correspond to the coefficient of the Spearman test (r). PWI = TTP. MRI, magnetic resonance imaging; PWI, perfusion-weighted imaging; DWI, diffusion-weighted imaging; TTP, time to peak.
P < 0.05.
P < 0.01.
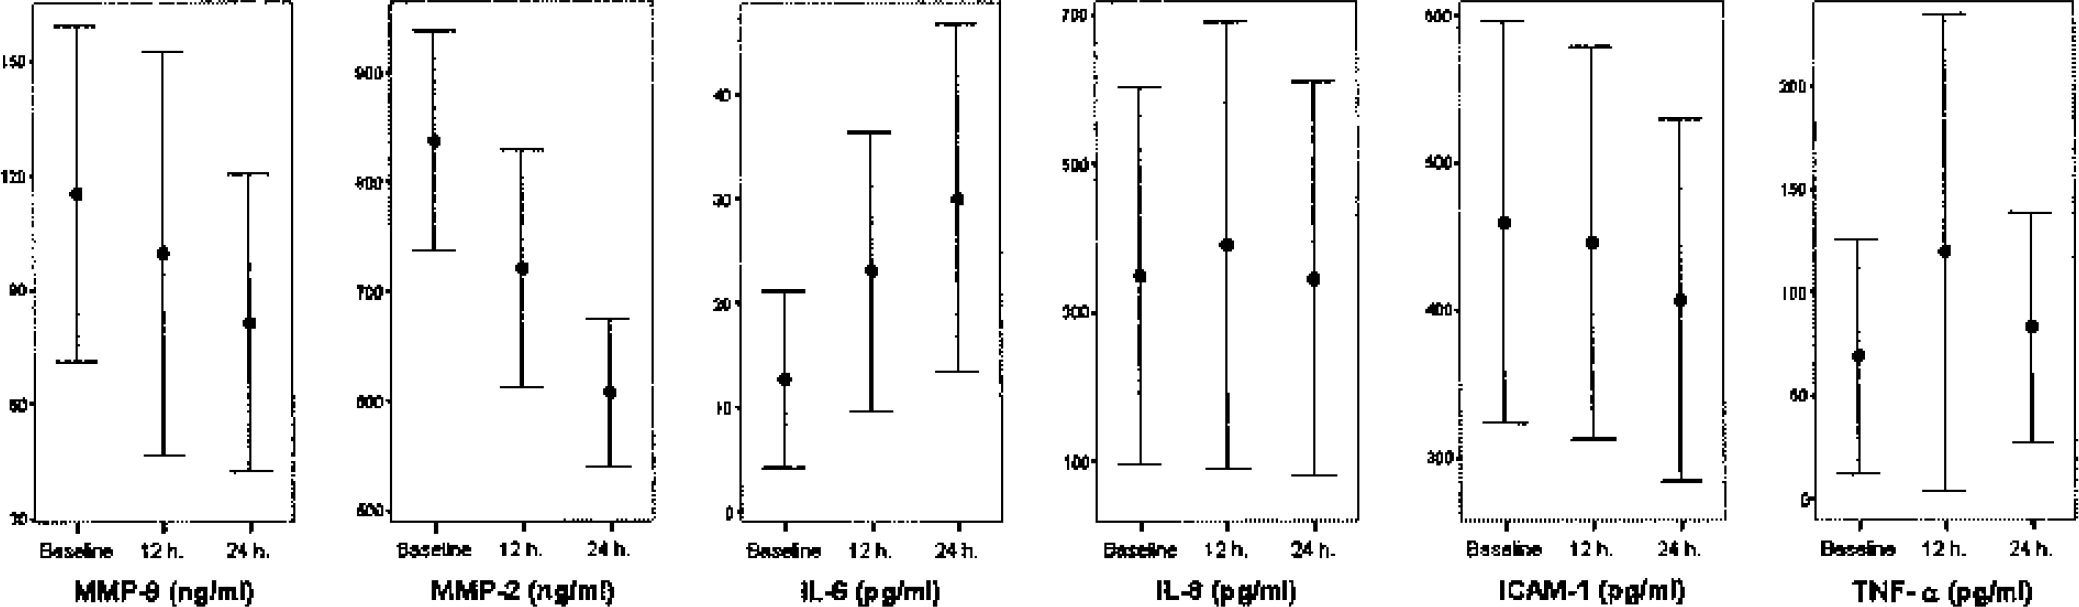
Temporal profile of neuroinflammatory biologic markers after stroke onset.
The main factors related to initial DWI volume were as follows: baseline MMP-9 (r = 0.67, P = 0.004), NIHSS score (r = 0.574, P = 0.008), and glucose (r = 0.51, P = 0.041). A positive correlation between baseline MMP-9 and glucose was found (r = 0.50, P = 0.04). In the linear regression model (NIHSS, glucose, and MMP-9), baseline MMP-9 was the only predictor for the initial DWI (b = 0.50, 0.25–0.74; P < 0.001).
Upon follow-up MRI, the final DWI correlated positively with baseline MMP-9 (r = 0.691, P = 0.003) and also with the neurologic status (baseline NIHSS: r = 0.545, P = 0.029) and glucose (r = 0.503, P = 0.047). The adhesion molecule ICAM-1 measured at 12 and 24 hours was also correlated with the final infarct volume. Again, MMP-9 was the only baseline predictor of the final DWI volume (b = 0.70, 0.30–1.09; P = 0.002). The results of the linear regression model imply that every 10-ng/mL increase of the baseline MMP-9 leads to an increase in the initial DWI volume of 5 cc and to an increase of 7 cc in the final DWI volume. This association between baseline MMP-9 and the final DWI volume is shown in Fig. 2.
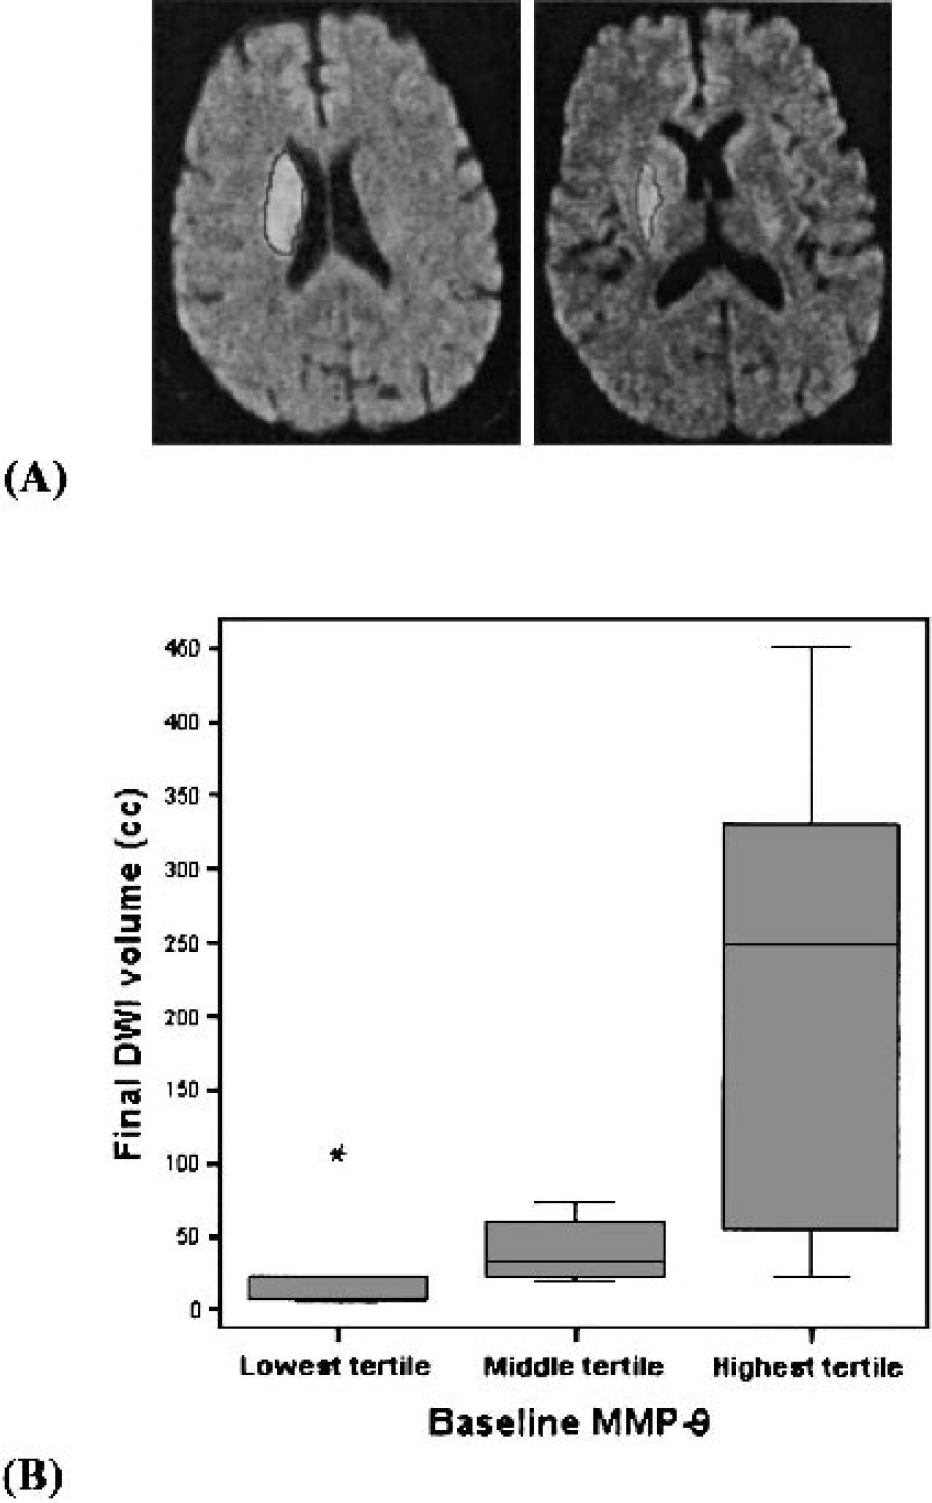
Volume measurement (cc) of the extension of tissue abnormality was performed using a manual tracing technique (A). In this model, every increase of 50 ng/mL in the baseline MMP-9 leads to an increase in the final DWI volume of 35 cc. This is graphically expressed as a graded increase in final DWI volume according to baseline MMP-9 tertiles (B). MMP-9 tertile limits: lowest < 34.9, middle 34.9–156.7, highest >156.7 ng/mL. DWI, diffusion-weighted imaging.
To rule out a possible effect of t-PA treatment upon our results, we performed again the logistic regression model including this parameter, but no change was observed in the above mentioned results. Also, to demonstrate that the influence of baseline MMP-9 upon final DWI volume existed for the whole study population, a separate analysis was performed according to thrombolytic treatment. In both groups of patients, a higher baseline level of MMP-9 was associated with larger final DWI volumes, although this association was more evident among patients who did not receive t-PA (Fig. 3).
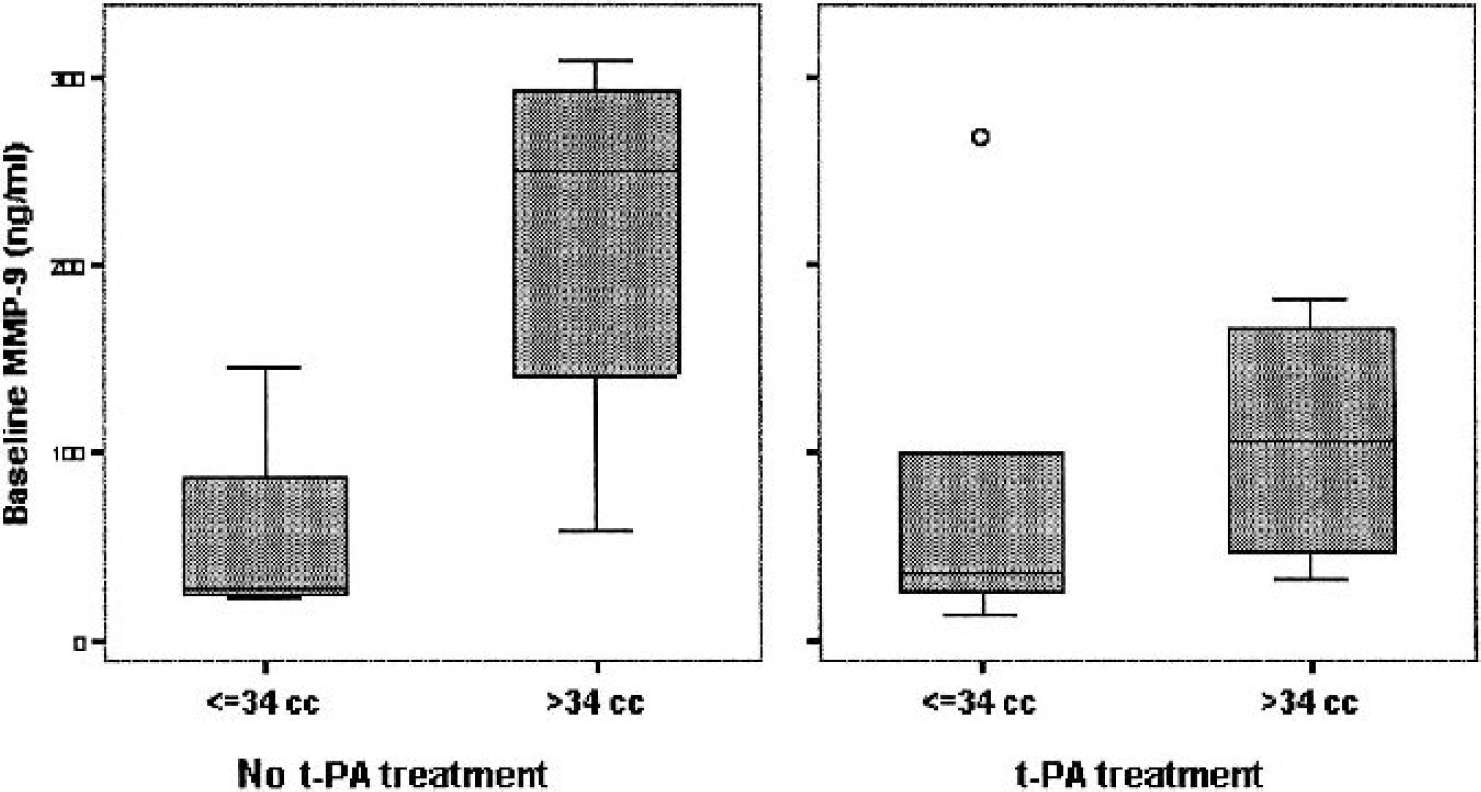
Baseline MMP-9 level influence upon final DWI infarct volume among patients who received intravenous t-PA and those who did not. To select small or large infarctions, the median final DWI volume = 34 cc was used. DWI, diffusion-weighted imaging.
DISCUSSION
One of the consequences of an acute stroke is the release of proinflammatory cytokines, which may enhance the expression of adhesion molecules upon endothelial cells and hence support the initial invasion of polymorphonuclear leukocytes and monocytes to the focus of the lesion. The influx of inflammatory cells might then aggravate brain damage by the production of toxic oxygen radicals and edema formation (Kochanek et al., 1992). Matrix metalloproteinases, a family of zinc-binding proteolytic enzymes, attack substrates as part of the neuroinflammatory response. MMP-2 and MMP-9 specifically attack type IV collagen, laminin, and fibronectin, which are the major components of the basal lamina around cerebral blood vessels (Mun-Bryce et al., 1998). Working in concert, all of these molecules are involved in the acute phase of cerebral infarction.
In this study, we hypothesized that different areas of the cerebral infarction were specifically correlated with representative molecules of several inflammatory families such as proinflammatory cytokines (TNF-α, IL-6), adhesion molecules (ICAM-1), chemokines (IL-8), or matrix metalloproteinases (MMP-2, MMP-9). In our patients, TNF-α and IL-6 were good markers of ischemia (PWI), and MMP-9 was the most powerful predictor of the initial DWI lesion and of the total infarct volume (final DWI).
Whether the release of proinflammatory cytokines after focal cerebral ischemia indicated a pathogenic step leading to tissue necrosis or simply reflected the amount of already infarcted brain tissue was a matter of discrepancy among investigators. Although in a correlative study it is impossible to define a causal link, we have found an absence of correlation between PWI-DWI with any cytokine for the baseline determination, but for the next time points, IL-6 and TNF-α levels were increasingly correlated with PWI volumes. This could indicate that the first phenomenon (PWI defect) generates the second one (cytokine expression), showing decreased cerebral blood flow as the starter of the cytokine cascade.
From the tested inflammatory markers, only baseline MMP-9 and glucose were correlated with the immediately damaged tissue in the initial DWI. It is interesting to note that connections between glucose metabolism and metalloproteinases have been recently reported. Hyperglycemia enhances MMP-9 expression and activity in endothelial cells (Uemura et al., 2001) and increases MMP-9 production in astrocytes (Massengale et al., 2002). Moreover, a great part of the mismatch area is recruited in hyperglycemic stroke patients (Parsons et al., 2002).
Based on morphologic criteria, MMP-9 appeared to stain with endothelial cells and neutrophils within and at the periphery of the infarct within 24 hours of focal ischemia in rats (Romanic et al., 1998). Endothelial MMP-9 may be released immediately after MCA occlusion and influence edema formation because MMP-9 is able to digest the endothelial basal lamina leading to the opening of the blood brain barrier. This might explain the correlation between early but not late MMP-9 with DWI lesion volume. Regional MMP predominance could also explain some of our findings because increased MMP-9 expression in the entire area of the ischemic brain 1 hour after reperfusion has been reported, whereas at later time points such as 3 and 23 hours, more MMP-9 expression was detected in the MCA territory cortex, compared with the ischemic core of the caudate putamen (Fujimura et al., 1999).
In our study, apart from baseline MMP-9 levels, ICAM-1, measured at 12- and 24-hour time points, also correlates with the final DWI lesion measured at days 5 to 7. It has been demonstrated that neutrophils use MMPs for migration (Weiss et al., 1986) and that substantial infiltration of leukocytes occurs 12 to 24 hours to several days after focal cerebral ischemia (Garcia et al., 1994). Thereafter, cytokines such as adhesion molecules that have been implicated in the recruitment and adhesion to the endothelium of infiltrating leukocytes (Del Zoppo et al., 1991) can contribute to MMPs expression.
Our results on both ICAM-1 and MMP-9 taken together with findings in animal models of cerebral ischemia that have demonstrated that blocking any of these two molecules reduces infarct volumes (Romanic et al., 1998; Zhang et al., 1995) permits hypothesize that pharmacological inhibition of these steps of the ischemic cascade might be relevant to reduce final infarct volume also in humans.
Because t-PA has shown to activate MMP-9 and some of our patients received thrombolytics, we specifically analyzed this factor to rule out the possibility of a treatment bias. After including t-PA treatment in the regression model, no change was identified in the results, supporting the important role of MMP-9 in predicting the DWI volumes, in spite of the thrombolytic treatment. It is of interest that in both groups (patients treated with and without t-PA) the role of MMP-9, measured before starting any treatment, on the final volume was decisive.
Although the small sample size of our study is a limitation and we have to be cautious about these preliminary findings, a highly selected population of MCA strokes combining the use of MRI with biologic parameters seems promising to replicate animal models findings in humans.
In conclusion, we have demonstrated a close relation between the extent of the hypoperfused brain area and the proinflammatory cytokine release and between tissue destruction and metalloproteinases. Therefore, we suggest that future research should be directed at determining whether the inhibition of these molecules may save tissue at risk.
Footnotes
Acknowledgment
The authors thank Manolo Quintana for statistical advice and Dorita Quiroga and Pilar Bermudez for technical assistance.