
Abstract
The hemodynamic mechanism of increase in cerebral blood flow (CBF) during neural activation has not been elucidated in humans. In the current study, changes in both regional CBF and cerebral blood volume (CBV) during visual stimulation in humans were investigated. Cerebral blood flow and CBV were measured by positron emission tomography using H215O and 11CO, respectively, at rest and during 2-Hz and 8-Hz photic flicker stimulation in each of 10 subjects. Changes in CBF in the primary visual cortex were 16% ± 16% and 68% ± 20% for the visual stimulation of 2 Hz and 8 Hz, respectively. The changes in CBV were 10% ± 13% and 21% ± 5% for 2-Hz and 8-Hz stimulation, respectively. Significant differences between changes in CBF and CBV were observed for visual stimulation of 8 Hz. The relation between CBF and CBV values during rest and visual stimulation was CBV = 0.88CBF0.30. This indicates that when the increase in CBF during neural activation is great, that increase is caused primarily by the increase in vascular blood velocity rather than by the increase in CBV. This observation is consistent with reported findings obtained during hypercapnia.
Neural activation induces an increase in regional cerebral blood flow (CBF;Fox and Raichle, 1984, 1985). The hemodynamic mechanism of this increase during neural activation—that is, the relation between changes in CBF and blood volume of microvessels—has been investigated in animals using laser–Doppler flowmetry at the microvascular level (Malonek et al., 1997; Matsuura et al., 1999; Ngai et al., 1995). Two hypotheses exist to explain the mechanism of hemodynamic regulation (Kuschinsky and Paulson, 1992). One is that change in capillary blood volume changes CBF, and the other is that change in capillary flow velocity changes CBF. One animal study showed that the increase in CBF was greater than the increase in pial arteriolar diameter during neural activation (Ngai et al., 1995). Early blood volume increase during neural activation, indicating active neurovascular regulation of blood volume in the capillary bed, has also been observed in animals (Malonek et al., 1997). Recently, Mandeville et al. (1999) observed a mismatch between the responses of relative cerebral blood volume (CBV) measured by magnetic resonance imaging (MRI) and relative CBF measured by laser–Doppler flowmetry in rats during somatosensory stimulation.
Hypercapnia also induces an increase in CBF (Kety and Schmidt, 1948; Shimosegawa et al., 1995; Tominaga et al., 1976). Increase in CBF with no change in density in perfused capillaries during hypercapnia has been observed in animals at the microvascular level (Gobel et al., 1989); change in capillary diameter during hypercapnia has also been observed (Duelli and Kuschinsky, 1993). The increase in CBV, including arterial, capillary, and venous blood volume, during hypercapnia was less than that in CBF (Bereczki et al., 1993; Grubb et al., 1974; Keyeux et al., 1995). Increase in CBV during hypercapnia in humans also has been reported (Kanno et al., 1988), and it was less than that in CBF (Shimosegawa et al., 1995; Tominaga et al., 1976).
In humans, increases in CBF and CBV during neural activation have been measured by positron emission tomography (PET) and MRI, respectively. Under 8-Hz photic flicker stimulation, an increase in CBF of 30% to 40% in the primary visual cortex was observed with PET (Fox and Raichle, 1984, 1985; Shimosegawa et al., 1995). This same stimulation induced an increase in CBV of about 30% measured by MRI with a paramagnetic contrast agent (Belliveau et al., 1991). However, changes in CBF and CBV during the same neural activation in the same human subjects measured by the same modality have not been reported.
In the current study, changes in both regional CBF and regional CBV during neural activation were measured in humans by PET with H215O and 11CO, respectively. H215O and 11CO PET studies were performed at rest and during visual stimulation in each of 10 normal subjects, and changes in CBF and CBV in the primary visual cortex were determined.
MATERIALS AND METHODS
Subjects
The study was approved by the Ethics Committee of the Akita Research Institute of Brain and Blood Vessels. Ten healthy men (19 to 27 years of age) were recruited and gave written informed consent to participate. The subjects were judged healthy based on medical history, physical examination, blood screening analysis, and MRI of the brain.
Positron emission tomography procedures
The PET system used was a Headtome V (Shimadzu, Kyoto, Japan) (Iida et al., 1996), which provides 47 sections with a center-to-center distance of 3.125 mm. The intrinsic spatial resolution was 4.0 mm full width at half maximum (FWHM) inplane and 4.3 mm FWHM axially. With a Butterworth filter, the reconstructed in-plane resolution was approximately 8 mm FWHM. Data were acquired in two-dimensional (2D) mode.
Positron emission tomography measurements with H215O and 11CO were performed in each subject under three conditions: at rest with the eyes closed and during visual stimulation of 2-Hz or 8-Hz photic flickers from LED molded goggles, starting 1 minute before scanning and continuing to the end of scanning (Fox and Raichle, 1984, 1985; Shimosegawa et al., 1995).
Regions of interest
Regions of interest (ROIs) were drawn on all PET images. Circular ROIs 10 mm in diameter were defined for the primary visual cortex, after referencing the MRI and subtraction images taken between rest and visual stimulation of 8 Hz. Each ROI was drawn in three adjacent sections, and data were pooled to obtain the average value for the whole volume of interest.
For each whole volume of interest, vascular mean transit time (MTT) was calculated as CBV divided by CBF (Powers et al., 1984).
RESULTS
Paco2, Pao2, pH, blood pressure, and heart rate for each PET scan are given in Table 1. No large differences were observed between PET studies. Hemoglobin concentration and hematocrit values of arterial blood were 14.7 ± 0.8 g/dL and 43.1% ± 2.2%, respectively (mean ± SD).
PaCO2, PaO2, pH, blood pressure, and heart rate during each PET scan
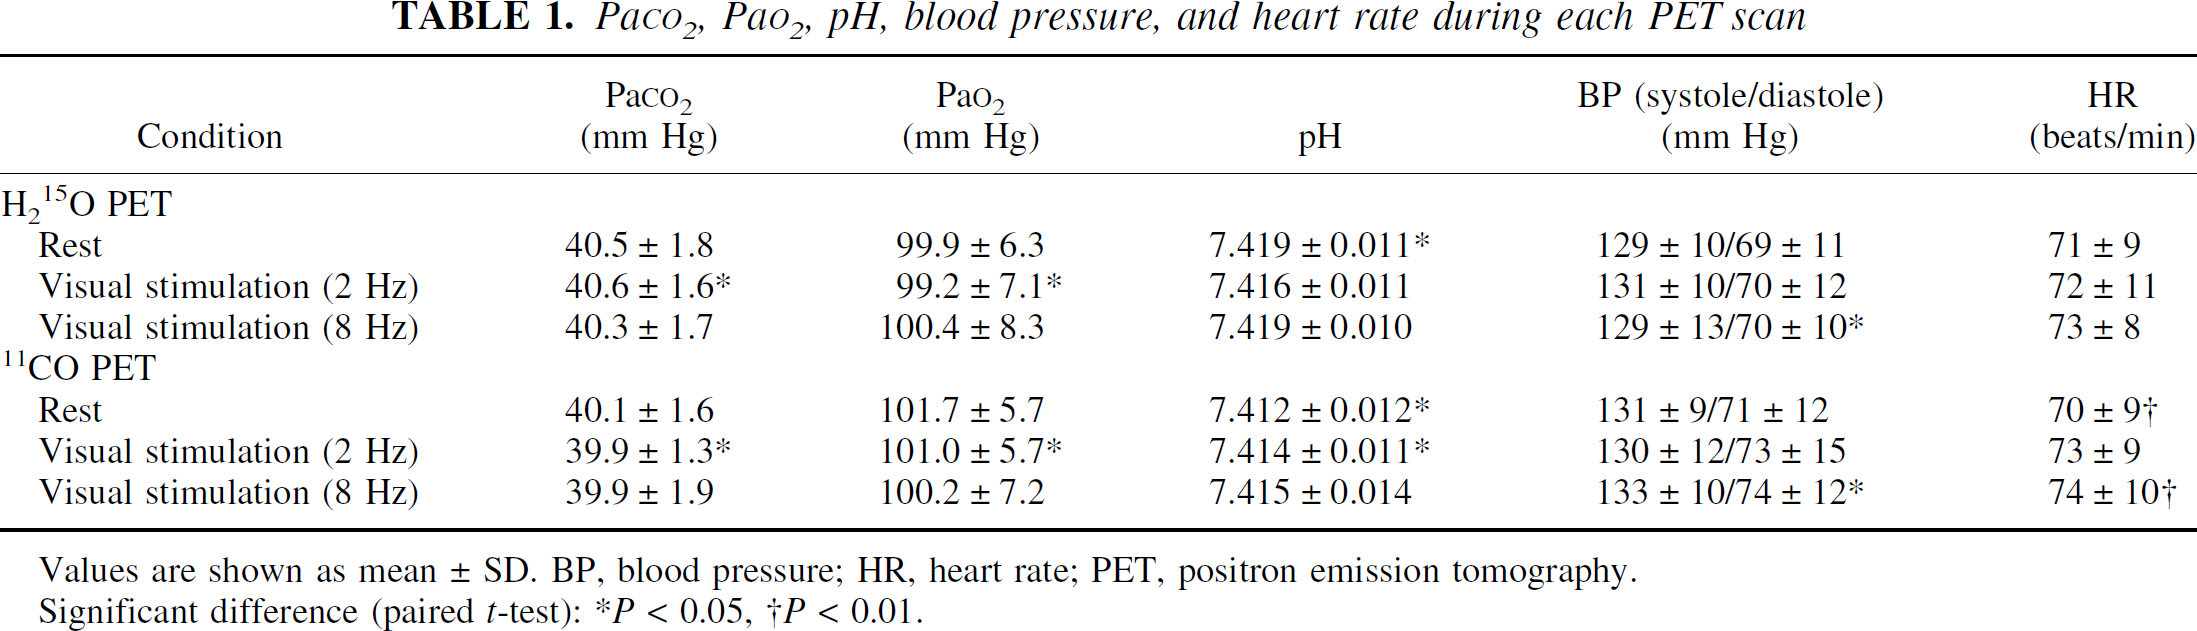
Values are shown as mean ± SD. BP, blood pressure; HR, heart rate; PET, positron emission tomography.
Significant difference (paired t-test):
P < 0.05,
P < 0.01.
Values of CBF, CBV, and MTT at rest and during visual stimulation are given in Table 2. Values for CBF and CBV were significantly increased during visual stimulation compared with those at rest. Values for MTT during visual stimulation of 8 Hz were significantly decreased compared with those at rest.
CBF, CBV, and MTT values at rest and under visual stimulation (2 Hz and 8 Hz)
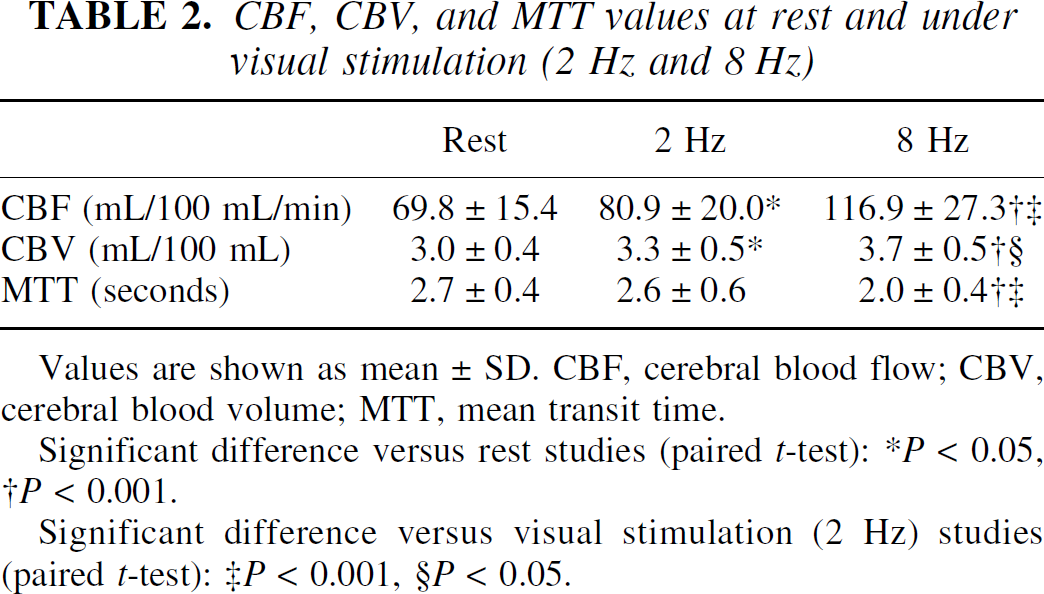
Values are shown as mean ± SD. CBF, cerebral blood flow; CBV, cerebral blood volume; MTT, mean transit time.
Significant difference versus rest studies (paired t-test):
P < 0.05,
P < 0.001.
Significant difference versus visual stimulation (2 Hz) studies (paired t-test):
P< 0.001
P< 0.05.
Percentage changes in CBF and CBV in response to visual stimulation are shown in Fig. 1. The changes in CBF were 16% ± 16% and 68% ± 20% for visual stimulations of 2 Hz and 8 Hz, respectively. The changes in CBV were 10% ± 13% and 21% ± 5% for visual stimulations of 2 Hz and 8 Hz, respectively. A significant difference between changes in CBF and CBV was observed for visual stimulation of 8 Hz.
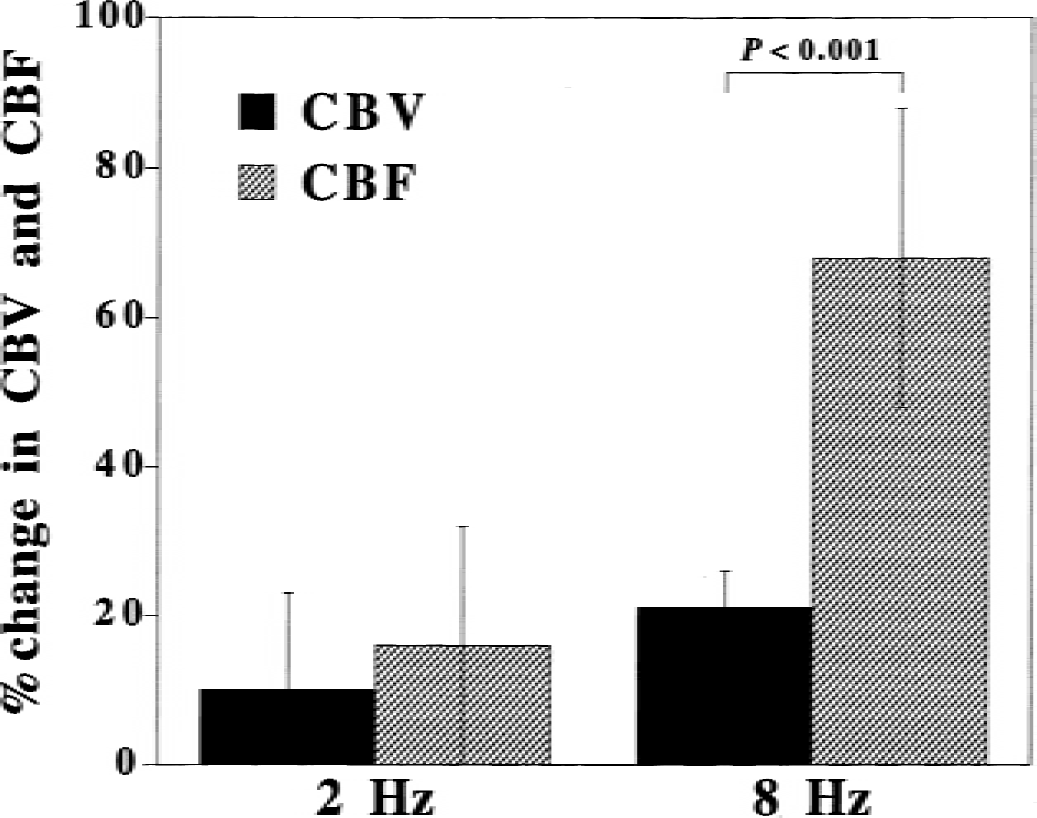
Percentage changes in cerebral blood flow (CBF) and cerebral blood volume (CBV) in response to visual stimulation (2 Hz and 8 Hz). Mean ± SD.
The relations between CBF and CBV values at rest and during visual stimulation for all subjects are shown in Fig. 2. The relation between CBF and CBV was determined by least-squares analysis according to the previous study (Grubb et al., 1974): CBV = 0.88CBF0.30.
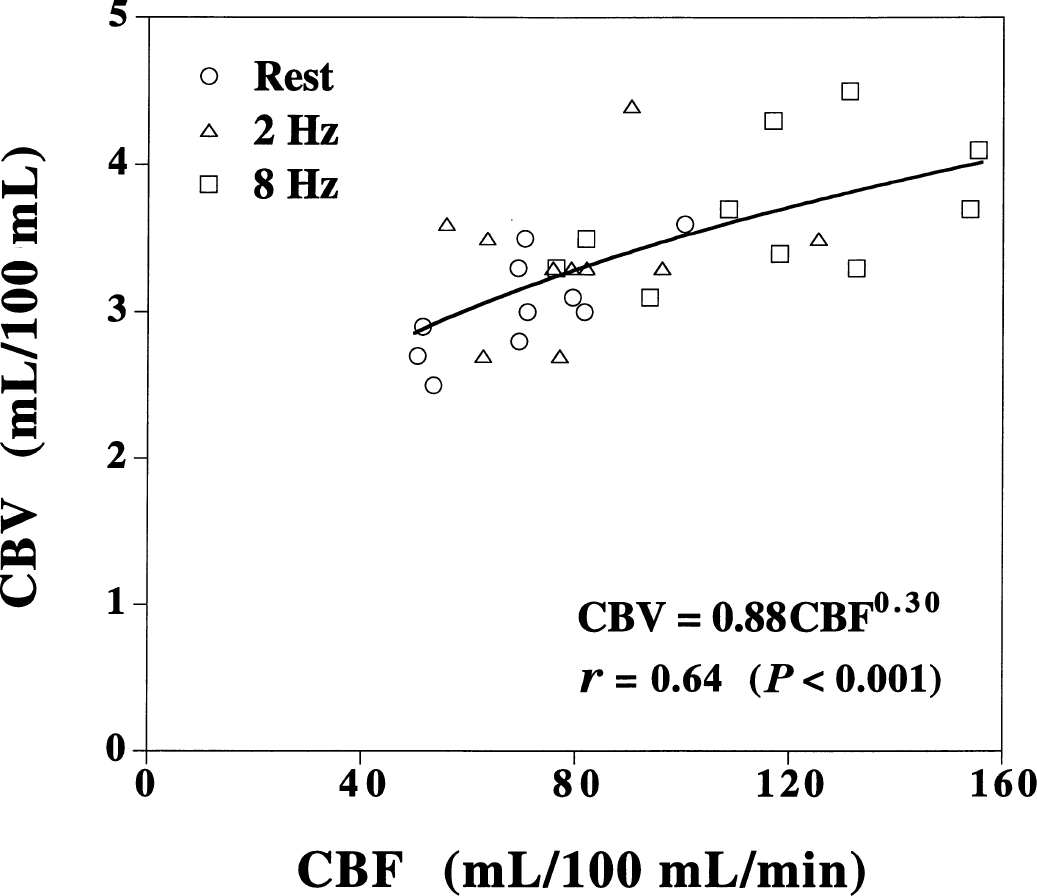
Relation between cerebral blood flow (CBF) and cerebral blood volume (CBV) values at rest and during visual stimulation (2 Hz and 8 Hz) in all subjects.
DISCUSSION
This is the first study to investigate changes in CBF and CBV during the same neural activations in the same human subjects by the same modality. Increases in CBF and CBV were almost identical during visual stimulation of 2 Hz, resulting in no change in MTT between conditions of rest and visual stimulation of 2 Hz. However, during visual stimulation of 8 Hz, the increase in CBF was greater than that in CBV, resulting in the decrease in MTT. This indicates that when the increase in CBF is great, that increase is caused primarily by the increase in vascular blood velocity, which corresponds to the decrease in MTT, rather than by the increase in CBV. Vasodilatation influences both the vascular resistance and the blood volume in the vessel. According to Poiseuille's law, the vascular resistance decreases with the power of four of the vessel diameter. The blood volume increases proportionally to the square of the diameter. This indicates that the reduction in vascular resistance and thus the increase in blood flow would be much more marked than the increase in blood volume, supporting the current results.
The current results are closely aligned with reported findings in animals studied during hypercapnia, in which the increase in CBV was less than that in CBF (Bereczki et al., 1993; Grubb et al., 1974; Keyeux et al., 1995). The relation between CBF and CBV values during change in Paco2 in monkeys has been estimated as CBV = 0.80CBF0.38 (Grubb et al., 1974). The relation between changes in CBF and CBV during somatosensory stimulation in rats has been estimated as CBV/CBV0 = (CBF/CBF0)0.18–0.36, where CBV/CBV0 and CBF/CBF0 are changes in CBF and CBV, respectively (Mandeville et al., 1999). The relation between CBF and CBV determined in the current study closely corresponded with that reported previously, suggesting that augmentation for CBF and CBV might be governed by a common microcirculatory mechanism during both neural activation and hypercapnia. In the current study, the degree of increase in CBF during visual stimulation was greater than that previously reported by the authors' group (Shimosegawa et al., 1995). This is the result of the higher spatial resolution of the PET scanner currently used.
Because the limited spatial resolution of PET does not allow measurement of CBV at the microvascular level, CBV measured by PET consists of three components: artery, capillary, and vein (Lammertsma and Jones, 1983; Mintun et al., 1984). Nevertheless, the current results are similar to those previously observed at the microvascular level in which the increase in CBF was greater than that in the blood volume of microvessels during neural activation (Matsuura et al., 1999; Ngai et al., 1995). Although the capillary fraction is only a small percent of CBV (Mintun et al., 1984), the magnitude of increase in CBV during neural activation in humans measured by PET was almost the same as that in the blood volume of microvessels in animals (Ngai et al., 1995). Because changes in blood volume of microvessels cannot account for changes in total blood volume (that is, CBV), the increase in vascular blood volume during neural activation might occur in all components of CBV (that is, artery, capillary, and vein).
In the CBV measurement, the radioactivity concentration of 11CO-labeled hemoglobin was measured. Therefore, CBV was calculated assuming the small-to large-vessel hematocrit ratio to be 0.85 (Phelps et al., 1979). However, a decrease in hematocrit in cerebral vessels during hypercapnia has been reported (Bereczki et al., 1993; Keyeux et al., 1995). If neural activation introduces a decrease in cerebral hematocrit, this will cause an underestimation of CBV during neural activation. Using a paramagnetic contrast agent with MRI, an increase in CBV of approximately 30% during visual stimulation by 8-Hz photic flicker was observed (Belliveau et al., 1991). Because the MRI technique measures plasma blood volume, a decrease in cerebral hematocrit will cause overestimation of CBV. Because the increase in CBV during the 8-Hz photic flicker stimulation was approximately 20% determined by PET with 11CO, the true change in CBV during 8-Hz photic flicker stimulation is probably between 20% and 30%.
In the functional MRI community, it has been assumed that the relations between changes in CBF and CBV obtained during hypercapnia and neural stimulation are similar (Davis et al., 1998; Hoge et al., 1999; Kim et al., 1999; Kim and Ugurbil, 1997). The most commonly used functional MRI technique, blood oxygenation level dependent (BOLD) contrast (Ogawa et al., 1990), is dependent on multiple physiologic parameters, including CBF, CBV, and cerebral metabolic rate of oxygen. To determine the physiologic sources of BOLD signals including the cerebral metabolic rate of oxygen during neural stimulation, a hypercapnia model in which CBF increases without changing brain metabolism has been used (Grubb et al., 1974). The current data suggest that assumption of a similar CBF–CBV relation induced by neural stimulation and hypercapnia is valid, and thus the hypercapnia model can be used for modeling BOLD signals during neural stimulation.
In conclusion, the increase in CBF was greater than that in CBV during visual stimulation of 8 Hz, resulting in a decrease in MTT, although the increases in CBF and CBV were almost identical during visual stimulation of 2 Hz. This indicates that when the increase in CBF is great, the increase in CBF is caused primarily by an increase in vascular blood velocity rather than by an increase in CBV. The relation between CBF and CBV values during rest and visual stimulation closely corresponded to that previously determined by changing Paco2 values.
Footnotes
Acknowledgments:
The authors thank the members of the Akita Research Institute of Brain and Blood Vessels for their assistance in performing the PET experiments.