
Abstract
The coupling of cerebral blood flow (CBF) and metabolic rate of oxygen (CMRO2) during physiologic and pathophysiologic conditions remains the subject of debate. In the present study, we have developed a theoretical model for oxygen delivery and metabolism, which describes the diffusion of oxygen at the capillary-tissue interface and the nonlinear nature of hemoglobin (Hb) affinity to oxygen, allowing a variation in simple-capillary oxygen diffusibility, termed “effective oxygen diffusibility (EOD).” The model was used to simulate the relationship between CBF and CMRO2, as well as oxygen extraction fraction (OEF), when various pathophysiologic conditions were assumed involving functional activation, ischemia, hypoxia, anemia, or hypo- and hyper-capnic CBF variations. The simulations revealed that, to maintain CMRO2 constant, a variation in CBF and Hb required active change in EOD. In contrast, unless the EOD change took place, the brain allowed small but significant nonlinear change in CMRO2 directly dependent upon oxygen delivery. Application of the present model to quantitative neuroimaging of CBF and CMRO2 enables us to evaluate the biologic response at capillary level other than Hb- and flow-dependent properties of oxygen transport and may give us another insight regarding the physiologic control of oxygen delivery in the human brain.
The brain suffers critical damage when subjected to reduced oxygen delivery caused by ischemia or hypoxia (Siesjo, 1978). Studies using positron emission tomography (PET) in acute or chronic patients or animals with ischemia have shown that a portion of brain tissue survives during ischemia. This tissue is characterized by reduced cerebral blood flow (CBF), preserved cerebral metabolic rate of oxygen (CMRO2), and increased oxygen extraction fraction (OEF), a condition called “misery perfusion” (Baron et al., 1981; Powers et al., 1987). Identification of such tissues is clinically important for the therapeutic strategy in patients with ischemia (Baron, 2001; Heiss, 2000). These observations suggest that the brain upregulates oxygen transport during reduced oxygen delivery to satisfy its metabolic demand. As transport of oxygen from blood to tissue occurs not in a facilitated but rather in a passive fashion, that is, diffusion, capillary dilatation or recruitment had been assumed to enable efficient oxygen transfer to tissue. However, a number of animal experiments found no or only minimal capillary changes in the brain during ischemia or hypoxia (Bereczki et al., 1993a; Pinard et al., 2000; Seylaz et al., 1999). Thus the mechanism by which oxygen metabolism is preserved during ischemia is not well understood nor have capillary changes ever been evaluated in humans.
The coupling of CBF and CMRO2 remains the subject of debates during functional activation, as well. Fox et al. (1986) observed, in a human PET study, that stimulus-induced large increases in CBF (29%) are accompanied by small increases in CMRO2 (5%). Others also confirmed the observation using PET and functional magnetic resonance imaging (MRI) (Davis et al., 1998; Kuwabara et al., 1992; Seitz et al., 1992). This phenomenon was later explained by a theoretical oxygen delivery model, in which CBF and CMRO2 are coupled in a nonlinear fashion over a wide range of blood flow and metabolic state because of the limited nature of oxygen transport (Buxton et al., 1997; Zheng et al., 2002). These models, however, were based upon fixed capillary functional diffusibility and thus necessitated precise regulation of local CBF to meet metabolic demand. Others allowed potential changes in capillary diffusibility in their oxygen delivery models (Hyder et al., 1998; Vafaee et al., 2000); however, predictability is not estimated in detail for realistic quantitative data.
In the present study, we have developed a simple oxygen delivery and metabolic model, which involves oxygen diffusion and nonlinear binding of Hb to oxygen, to interpret the relationship between quantitative CBF, OEF, and CMRO2 values obtained by neuroimaging techniques. Using this model, the relationship between CBF and CMRO2, as well as OEF, was simulated under several pathophysiologic conditions: (1) CBF was varied, to emulate hyper- and hypo-capnia, as well as ischemia and revascularization hyperemia, (2) arterial Hb content was varied to estimate the effect of physiologic Hb variation in normal subjects (12 to 17 g/dL), and also to emulate anemic or polycythemic states, (3) oxygen arterial partial pressure (PaO2) was varied, simulating hyperoxic or hypoxic conditions, (4) oxygen-Hb binding affinity (P50) was varied, and (5) various extents of dynamic changes in oxygen diffusibility and CBF were assumed during functional activation. Furthermore, the feasibility of this model with respect to realistic PET data was also evaluated in clinical patients.
METHODS
Theoretical background
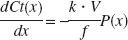
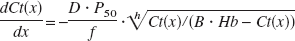
Oxygen in blood exists in two forms: bound to Hb and freely dissolved in plasma. When oxygen extraction by tissue, from an infinitesimally thin element of blood, occurs in a radial direction during capillary transit from the arterial to venous side, the rate of loss of blood oxren ygen, dC(t)/dt, at a relative position in a simple capillary, x (0 ≤x ≤1), is proportional to the intracapillary oxygen partial pressure, P(x), when tissue oxygen content is negligible (Fig. 1). Thus,

where k is a constant, but has a unit of mL/mmHg because of the involvement of oxygen solubility in water. As cerebral blood flow is constant during capillary transit, the left term of Equation 1 can be converted to dCt(x,t)ldx = dCt(t)ldx · dx/dt (Zheng et al., 2002). As CBF (f) can be represented as follows f =A · L · dx/dt =V · dx/dt, where A, L, and V are a sectional area, a length, and a volume for a simple capillary, respectively (Fig. 1), thus,
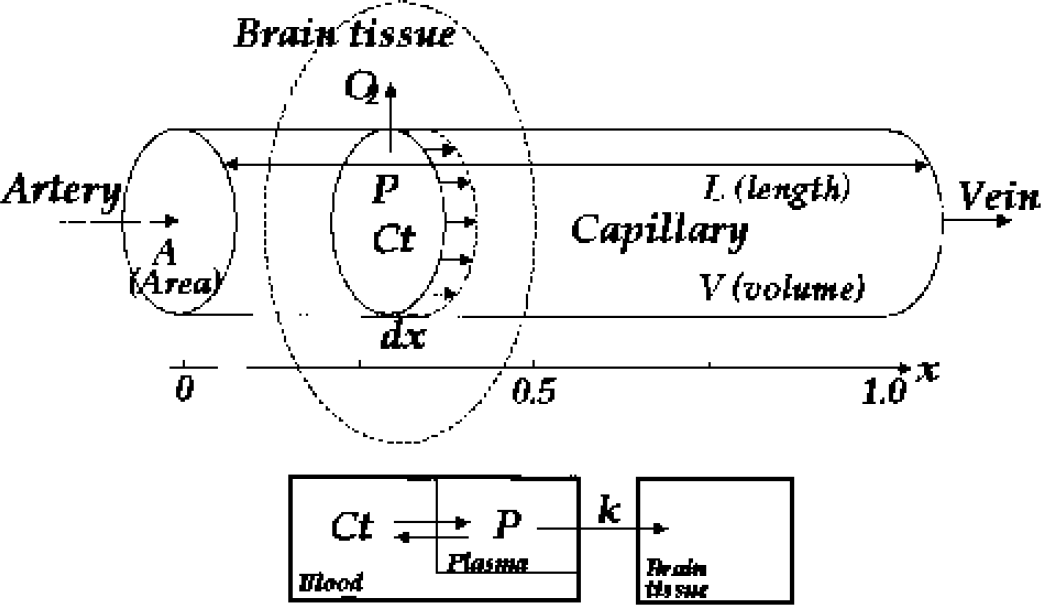
Scheme of a simple capillary oxygen diffusion model.
Then, OEF (E) and CMRO2 (J) can be descibed by the modified Fick's first law,
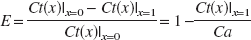

where Ct (x)|x=0 and Ct (x)|x=1 correspond to arterial oxygen content, Ca, and blood oxygen content at the venous end of the capillary, respectively. When assuming that P and Ct have a linear relationship and P/Ct is constant in Equation 2, Ct(x) can be solved as a simple exponential function, and Equation 3 yields the equation similar to that in the Renkin-Crone model (Buxton, 1997; Crone, 1963; Hyder, 1998). However, P and Ct are quickly equilibrated (less than a few milliseconds), depending upon the nonlinear nature of Hb binding to oxygen, as described mathematically by the Hill equation P =P50 · h√Ct/(B · Hb − Ct).Equation 2 can be converted to
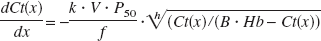
where Hb is hemoglobin concentration (in g/mL), P50 is oxygen partial pressure when half of Hb is saturated with oxygen (≂ 26.0 mmHg), h is the Hill constant (≂ 2.8), and B is the oxygen binding capacity for Hb (1.34 mL/g). The term can be lumped into a single variable D, or effective oxygen diffusibility (EOD) at the capillary-tissue interface because it represents the practical capillary physiologic function for oxygen diffusion and involves the total capillary surface for oxygen diffusion per unit tissue volume and oxygen permeability per unit capillary surface. Then, Equation 5 can be simplified as
Simulations
Variation in oxygen delivery with CBF change between 0 and 0.8 mL/g/min, which simulates ischemia or hyper or hypocapnic variation in CBF (Grubb, et al., 1974).
Abbreviations for variables and values used in the model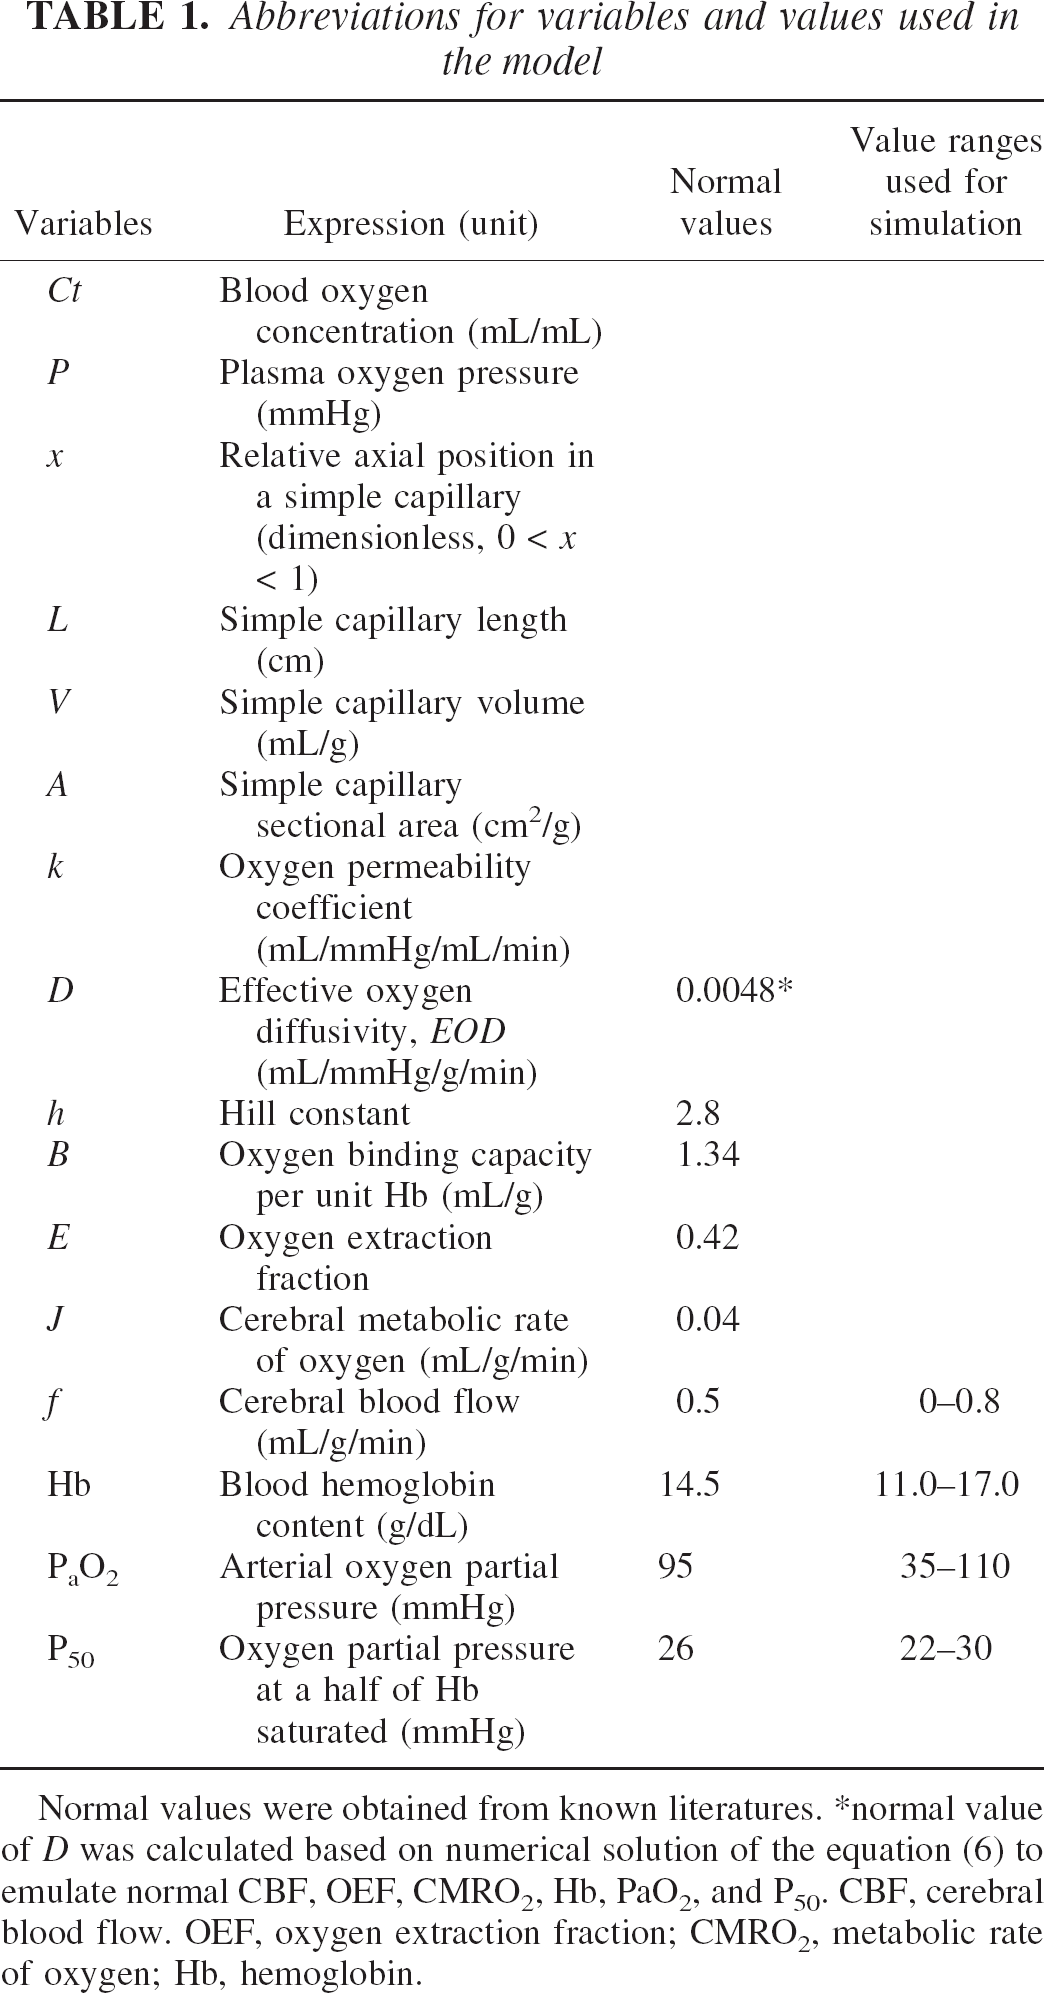
Normal values were obtained from known literatures.
normal value of D was calculated based on numerical solution of the equation (6) to emulate normal CBF, OEF, CMRO2, Hb, PaO2, and P50. CBF, cerebral blood flow. OEF, oxygen extraction fraction; CMRO2, metabolic rate of oxygen; Hb, hemoglobin.
Variation in oxygen delivery with Hb content of 11.0 to 17.0 g/dL, which simulates physiologic variation in Hb in normal adult subjects (14.0 to 17.0 g/dL in male and 12.0 to 16.0 g/dL in female), as well as pathologic abnormalities in systemic Hb content, such as anemic or polycythemic state. In addition, it also simulates local changes in hematocrit (causing Hb change) because of observed ischemia in carotid occlusive disease (Okazawa et al., 1996; Yamauchi et al., 1998) and functional deactivation (Yamauchi et al., 1999).
Variation in arterial oxygenation, expressed as oxygen saturation (SaO2) from 70% to 98%, which corresponds to PaO2 of 35 to 110 mmHg. As hypoxia is accompanied by physiologic augmentation of CBF, especially when PaO2 is smaller than 40 mmHg (corresponds to SaO2 = 76%) (Borgstrom et al., 1975; Johannsson et al., 1975; Hamer et al., 1976), CBF variation is also assumed.
Variation in oxygen-Hb affinity with P50, which affects the left-right shift of the oxygen-hemoglobin dissociation curve. The curve is shifted to the right mainly by an increase in hydrogen ions, carbon dioxide (Bohr effect), blood temperature, and 2,3-diphosphoglycerate (DPG) (Guyton et al., 2000). The former three facilitate oxygen unloading from Hb at the capillary (where CO2 and temperature are high). DPG is important during hypoxic conditions that last longer than a few hours, as well as during anemia. The simulation was performed when P50 was varied from 22 to 30 mmHg. For simplicity, P50 changes during capillary transit were not considered in the present study.
Functional activation (Roy et al., 1890), with various extents of EOD and CBF increase. A CMRO2 increase was assumed to increase from 2.5% to 10%, from known values obtained by activation PET and MRI (Davis et al., 1998; Fox et al., 1986). The various extent of increases in CBF and oxygen diffusibility necessary for an increase in oxygen consumption were simulated.
The former two conditions were simulated under two extreme capillary functional states: one assumes that EOD is not changed for any physiologic condition (this situation simulates no capillary recruitment or no change in oxygen permeability, as is suggested in many animal studies) and the other assumes that EOD changes dynamically to keep CMRO2 constant under any physiologic condition. Physiologically normal values used for simulation are listed in Table 1. For greater simplicity, two approximate solutions to Equation 6 were also evaluated (see Appendix I and II), and the accuracy of the approximate solution of EOD was also tested by simulations when oxygen delivery was changed by variation in CBF and Hb and compared with the numerical solution.
The feasibility of the model with clinical PET data
To test the feasibility of the present model, model-based EOD was calculated from realistic PET data. Two sets of PET data were examined from chronically ischemic patients with unilateral carotid artery occlusive disease of atherosclerotic origin. PET was performed by conventional 15O-steady state method with a HEADTOME-IV PET scanner (Shimadzu, Kyoto, Japan) and quantitative CBF, OEF, and CMRO2 images were generated as written previously (Hirano et al., 1994). The CBF image was spatially coregistered and normalized to a standard Talairach space, and its realignment parameters were applied to OEF and CMRO2 images. A parametric image of EOD was calculated based upon the model Equations 3, 4, and 6 using CBF and OEF images and arterial data of Hb content and oxygen saturation. Image processing was performed using a Sun Workstation (ULTRA SPARC Station 60, Sun Microsystems, U.S.A.) with Matlab 5.2, statistical parametric mapping software (SPM99), PyBLD environment, and the image analyzer Gpetview.
RESULTS
Simulation of CBF and Hb changes
Simulations of CBF, OEF, and CMRO2 were performed with variations in CBF (Fig. 2A) and in Hb (Fig. 2B). When EOD was assumed to be constant (0.0048 mL/mmHg/g/min, which was determined by the numerical solution of the model emulating the normal basal conditions as shown in Table 1), both OEF and CMRO2 varied depending upon CBF (Fig. 2A) and Hb content (Fig. 2B). Increases in CBF caused a nonlinear smaller increase in CMRO2 accompanied by a small decrease in OEF. In turn, decreases in CBF resulted in a nonlinear decrease in CMRO2 (Fig. 2A). Variation in Hb content was accompanied by nonlinear small changes in OEF and CMRO2, when CBF was assumed to be constant (Fig. 2B). Changes in both CBF and Hb resulted in passive changes in OEF and CMRO2, as shown in Fig. 2E.
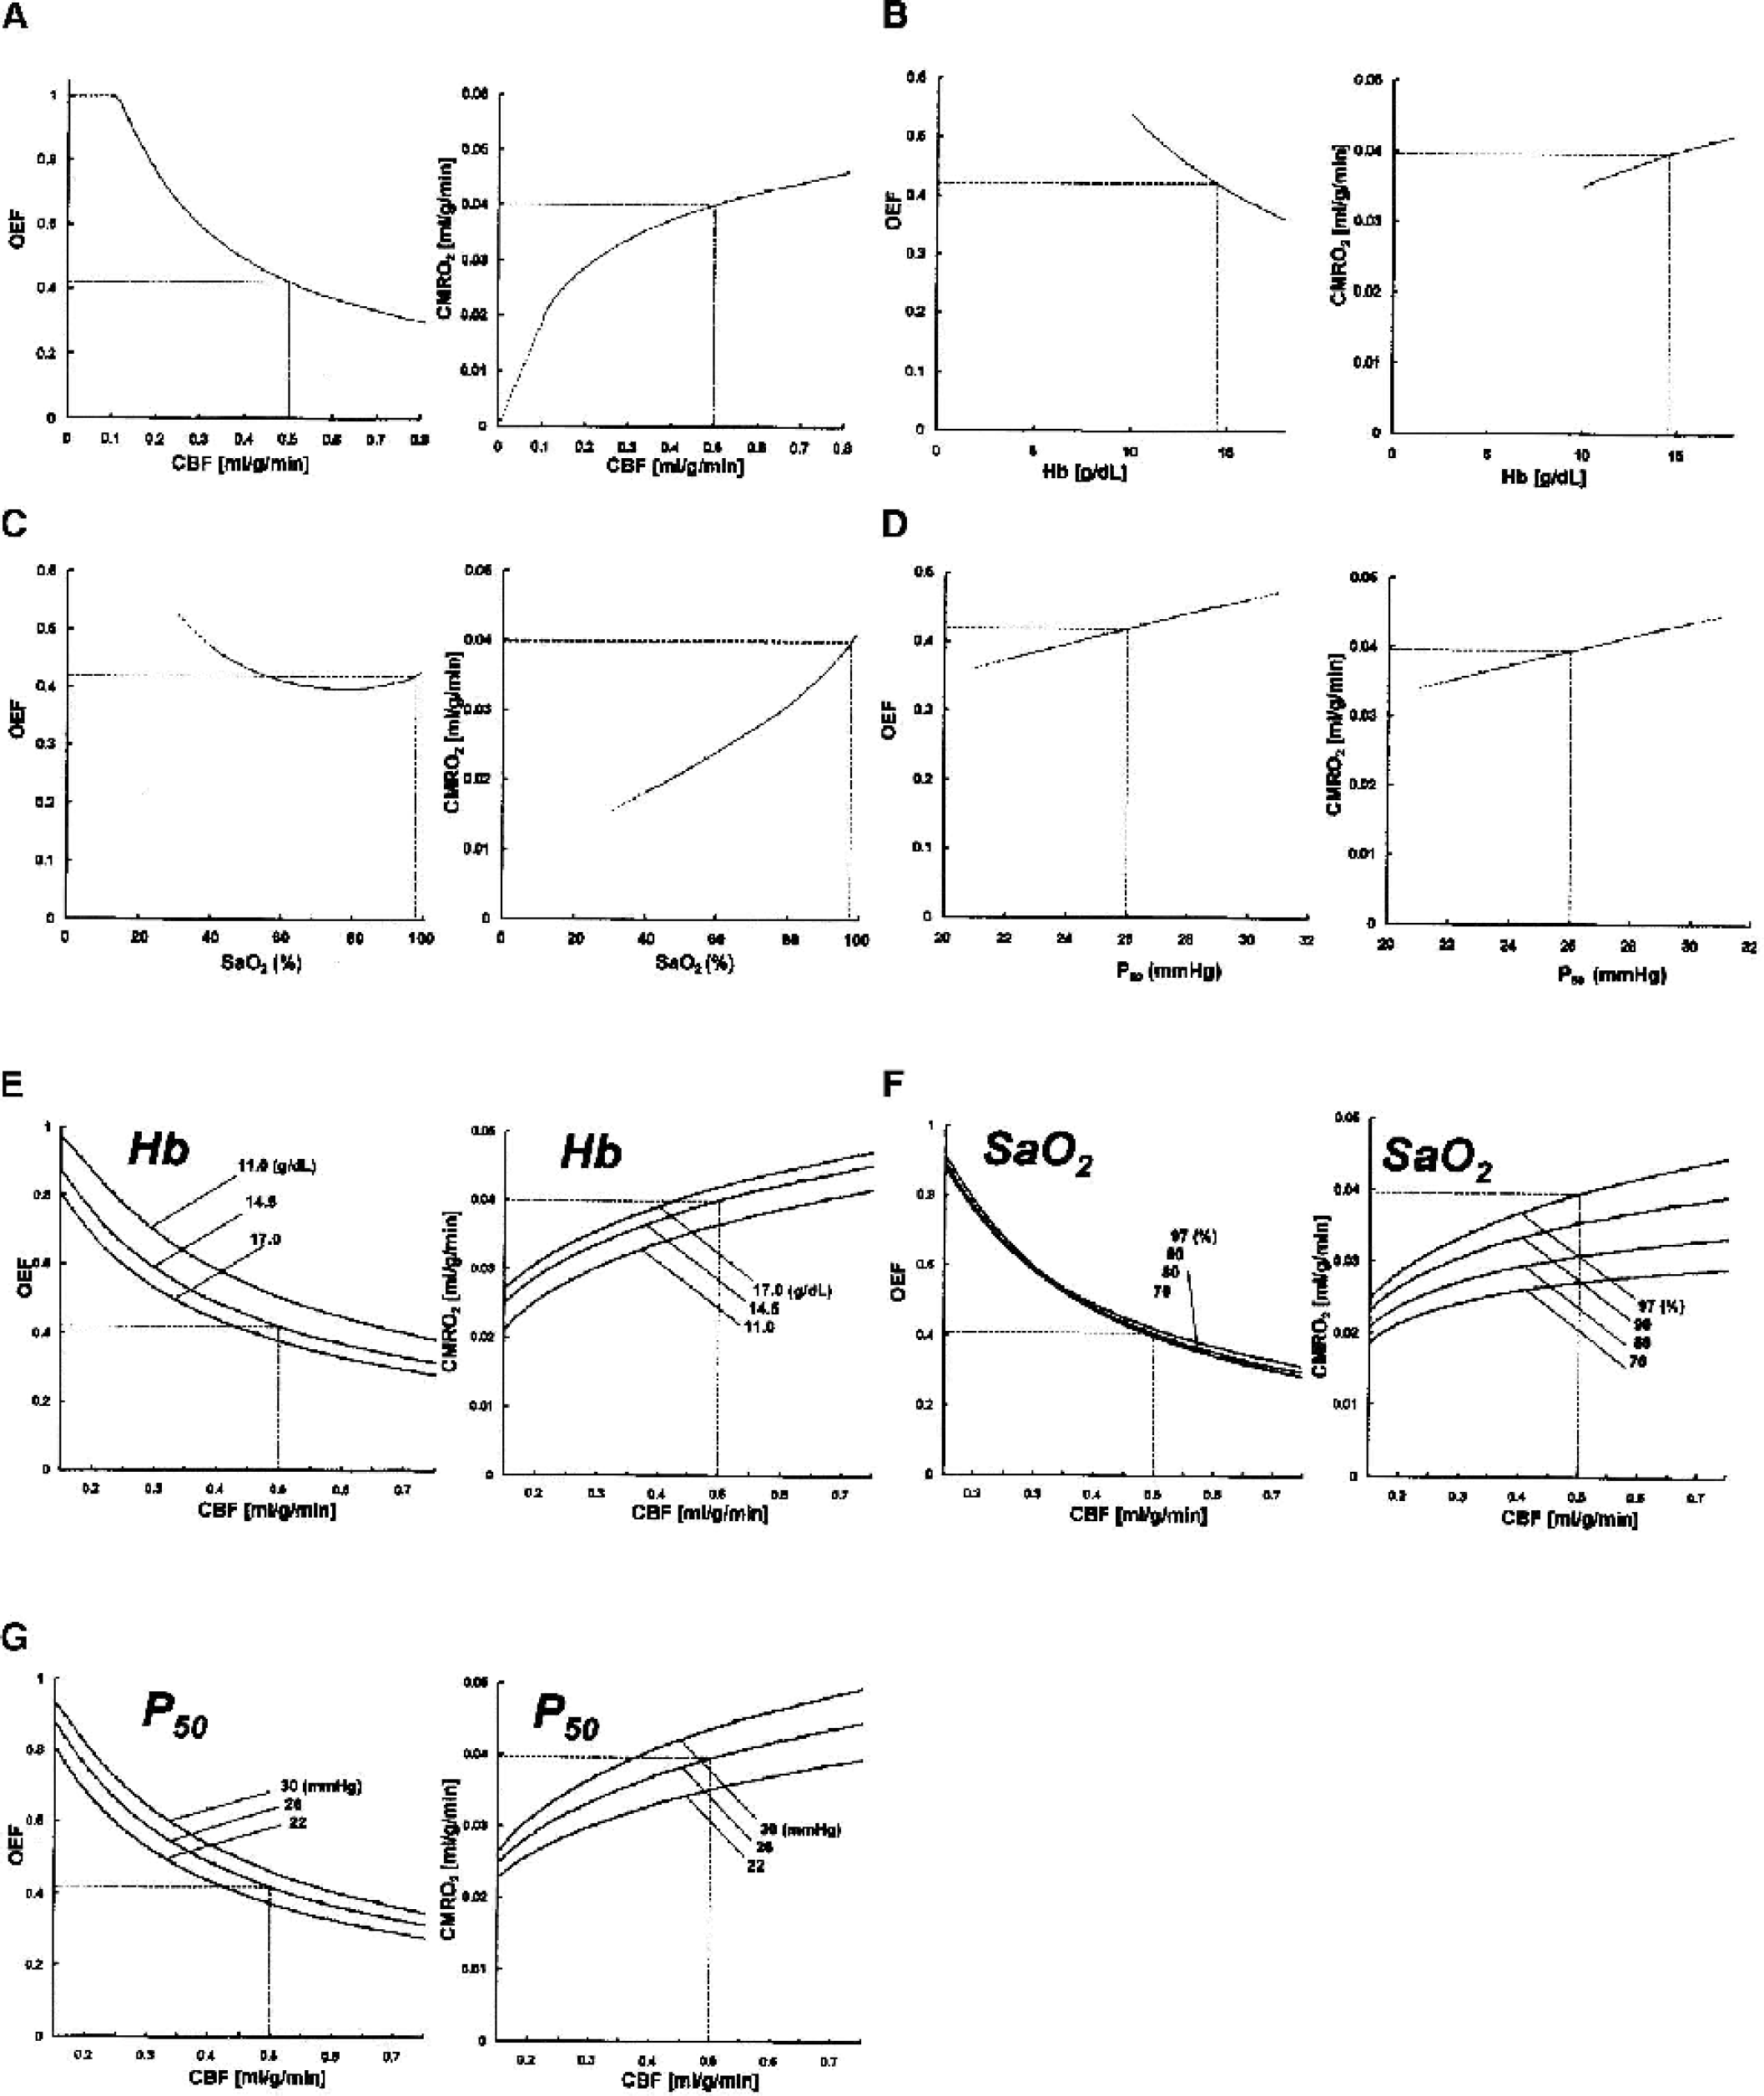
Simulations for CBF, OEF, and CMRO2 based upon the model without dynamic change in EOD. EOD was fixed to the value 0.0048 mL/mmHg/g/min, which emulates the normal basal state (Table 1). OEF and CMRO2 showed passive variation dependent upon factors regulating oxygen delivery such as CBF (A), Hb (B), blood oxygen level, SaO2 (C), and Hb-affinity to oxygen, P50 (D). Relationships between CBF and OEF were also simulated under various Hb concentrations (E), SaO2 (F), and P50 (G). The dotted horizontal and vertical lines indicate the values for the normal basal condition. CBF, cerebral blood flow; OEF, oxygen extraction fraction; CMRO2, metabolic rate of oxygen; EOD, effective oxygen diffusibility; Hb, hemoglobin.
On the other hand, when CMRO2 was assumed to be constant (CMRO2 = 0.04 mL/g/min) (Fig. 3A, right), OEF showed a reciprocal change with CBF and Hb values (Fig. 3A, left) and necessitated a dynamic increase in EOD when CBF or Hb content was decreased (Fig. 3B). Thus variations in oxygen delivery resulting from CBF and Hb changes should be accompanied by dynamic compensatory changes in EOD to keep CMRO2 constant.
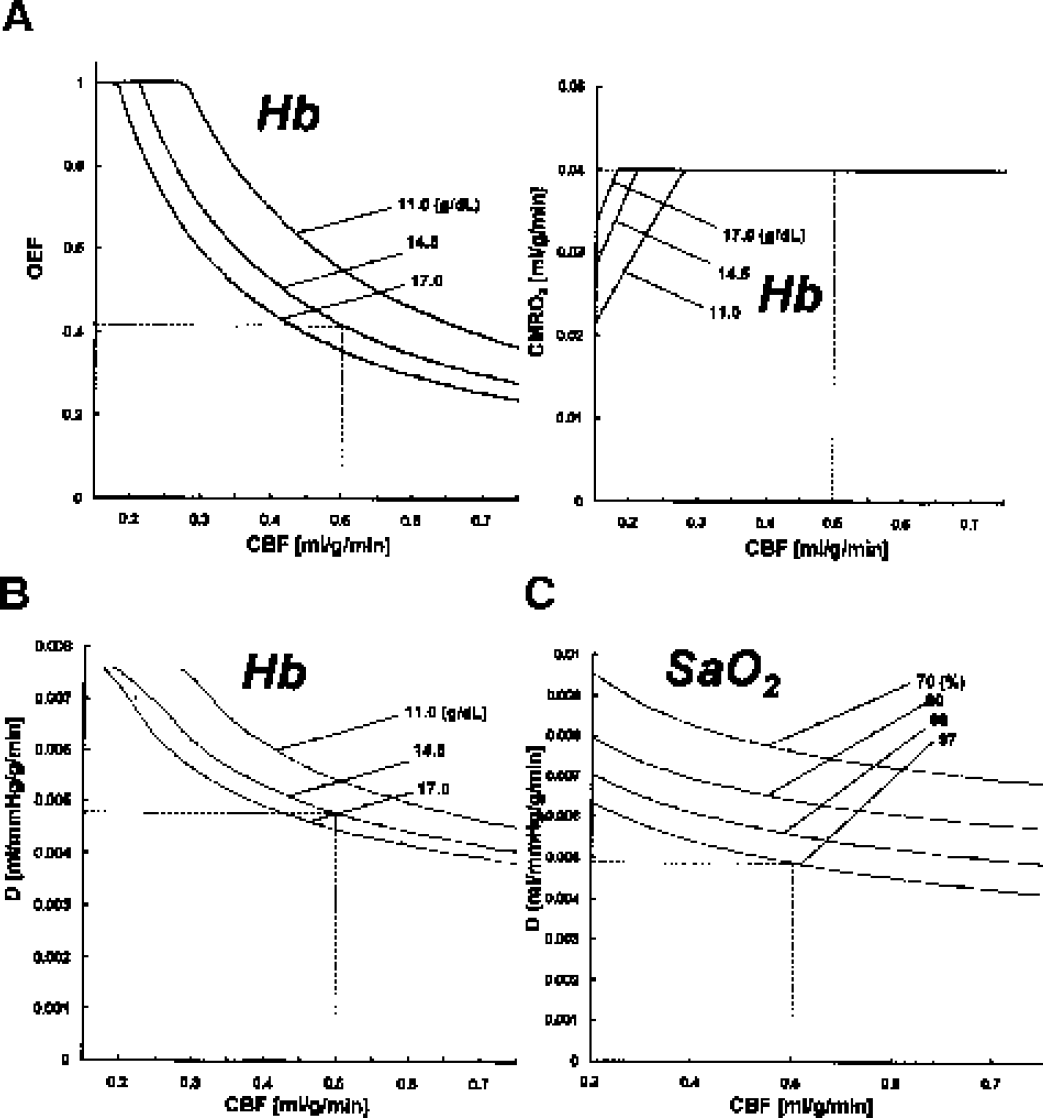
Simulations for CBF, OEF, and CMRO2 based upon the model allowing dynamic changes in EOD to keep oxygen metabolism constant at the normal resting condition (CMRO2 = 0.04 m/g/min). (A) Plots of CBF-OEF (left) and CBF-CMRO2 (right). OEF should vary depending upon Hb content to keep oxygen metabolism constant. In this situation, EOD should compensate for changes in CBF and Hb to keep oxygen metabolism constant as shown in (B). Similarly, the simulation assuming variation in SaO2 revealed that a large compensatory change in EOD was needed to keep CMRO2 at normal value against any CBF or SaO2 variation (C). CBF, cerebral blood flow; CMRO2, metabolic rate of oxygen; Hb, hemoglobin; EOD, effective oxygen diffusibility; OEF, oxygen extraction fraction.
Simulation of blood oxygenation changes
Fig. 2C shows that variation in oxygen saturation (SaO2) caused almost linear changes in CMRO2, whereas OEF showed small biphasic change when assumed fixed EOD. CBF and OEF plots showed minimal changes dependent upon SaO2, whereas CBF and CMRO2 plots showed SaO2-dependent changes in CMRO2 (Fig. 2F). Thus decreases in oxygen delivery caused by hypoxia necessitate increases in CBF, oxygen diffusibility, or both to maintain CMRO2. In fact, when assuming a dynamic change in EOD and constant CMRO2, decrease of SaO2 required large increases in EOD to compensate for decreased oxygen delivery (Fig. 3C).
Simulation of P50 changes
When assumed fixed EOD, OEF and CMRO2 varied depending upon P50 value (Fig. 2D). When P50 was increased (oxygen saturation shifted to the right), both OEF and CMRO2 slightly increased compared with the normal value (P50 = 26 mmHg). OEF showed CBF- and P50-dependent changes (Fig. 2G, left), as well as CMRO2 (Fig. 2G, right). This indicates that a physiologic change in P50 also affects the values of OEF and CMRO2 unless capillary diffusibility took place. This effect might be important in pathologic conditions, such as anemia or long-lasting hypoxia, in which P50 is known to decrease.
Functional activation
Activation-induced increases in CMRO2 necessitate nonlinear larger increases in CBF unless EOD changes (5% increase in CMRO2 versus 17% increase in CBF) (Fig. 4, open dot). However, the assumption that EOD dynamically changes allows a much smaller increase in CBF. For example, a 5% increase in CMRO2 can be fulfilled by a 5% increase in both EOD and CBF, yielding a linear relationship between increases in CBF and CMRO2 (Fig. 4, filled dot).
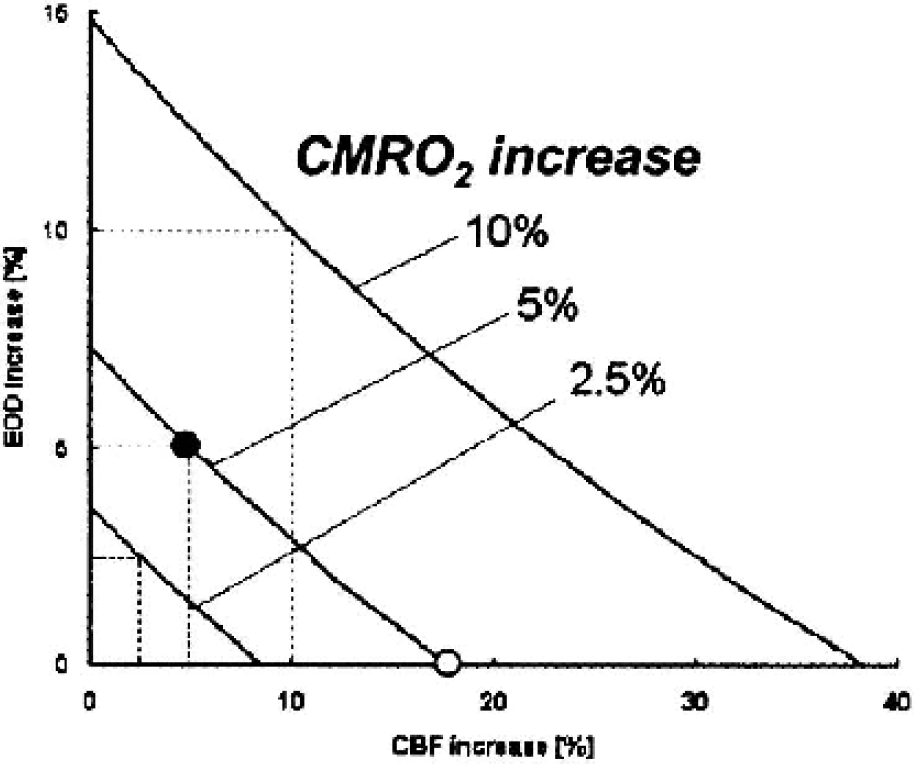
Simulations for the relationship between CBF and CMRO2 under functional activation. When CMRO2 is assumed to increase 5%, without any change in EOD, nonlinear large increases (17%) in CBF are needed (open dot). If EOD is assumed to dynamically change, oxygen metabolism is well maintained without the need for large increases in CBF, permitting linear increases in CBF and CMRO2, as well as EOD (dashed line). For example, a 5% increase of CMRO2 can be relieved by increasing CBF only 5% when accompanied by a 5% increase in EOD (filled dot). CBF, cerebral blood flow; CMRO2, metabolic rate of oxygen; EOD, effective oxygen diffusibility.
Evaluation using an approximated solution
CBF, OEF, and CMRO2 values in the linear and exponential solution revealed overall similarities as in the numerical method (Fig. 5A). With respect to the estimation of EOD values, quantitative values of EOD in both approximations showed in a ratio of D:DE:DL = 1:0.41:0.20 at the normal basal condition. Then, when approximated EOD values during various CBF and Hb, SaO2, P50 were scaled by the value of each solution at normal basal condition, a larger overestimation was observed in exponential approximation-derived EOD (DE), especially when oxygen delivery was decreased (decrease in CBF, Hb, or SaO2), as shown in Fig. 5B. Estimated EOD in the linear approximation (DL) showed an overall similarity to true EOD with an error of less than 10%.
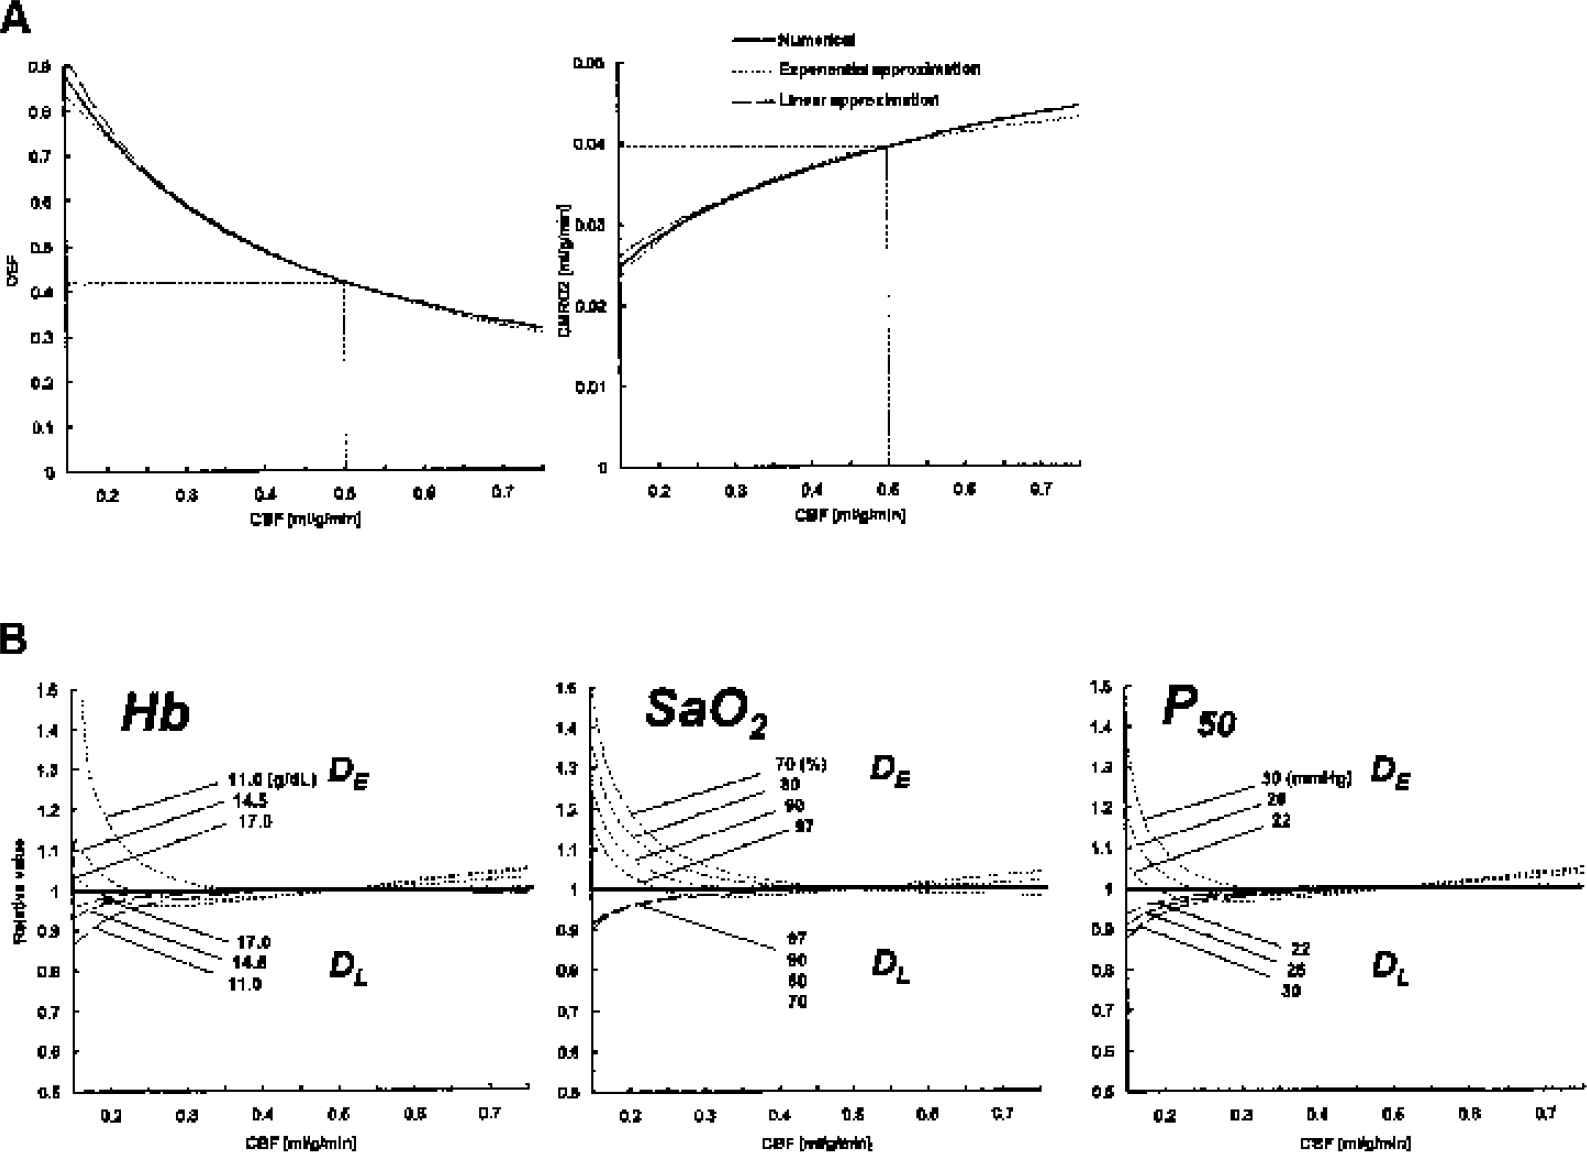
(A) Comparisons of the relationship between CBF, OEF, and CMRO2 for the numerical and two approximate solutions (see Appendix I and II) of the model with fixed diffusivility. Note that both of the approximate solutions fit well with OEF (left) and with CMRO2 (right) of the numerical solutions over a wide range of CBF. (B) Estimation of accuracy of the approximated EOD values. EOD values were determined by two approximation under various conditions, such as variable CBF and Hb (left), CBF and SaO2 (middle), and CBF and P50 (right), assuming true EOD was fixed to the value of noral basal condition (0.0048 mL/mmHg/g/min). The value was proportionally scaled by the value of normal basal condition of each solution. DE, exponential-approxiated EOD; DL, linear-approximated EOD; CBF, cerebral blood flow; CMRO2, metabolic rate of oxygen; Hb, hemoglobin; EOD, effective oxygen diffusibility; OEF, oxygen extraction fraction.
Application to PET data
In Fig. 6A, patient A with a left unilateral carotid occlusion showed left frontal hypoperfusion, elevated OEF, and preserved CMRO2. Calculated EOD images showed elevation in EOD in the corresponding ischemic area compared with the contralateral side, suggesting a compensatory elevation in oxygen diffusibility at the capillary level. Patient B (Fig. 6B) with a right unilateral carotid occlusion showed ipsilateral hypoperfusion, elevated OEF, and slightly decreased CMRO2. In this case, EOD showed decrease in the same area, suggesting the absence of compensation at the capillary level. These findings suggest that a compensatory response at the capillary level may be physiologically different among subjects or ischemic subtypes.
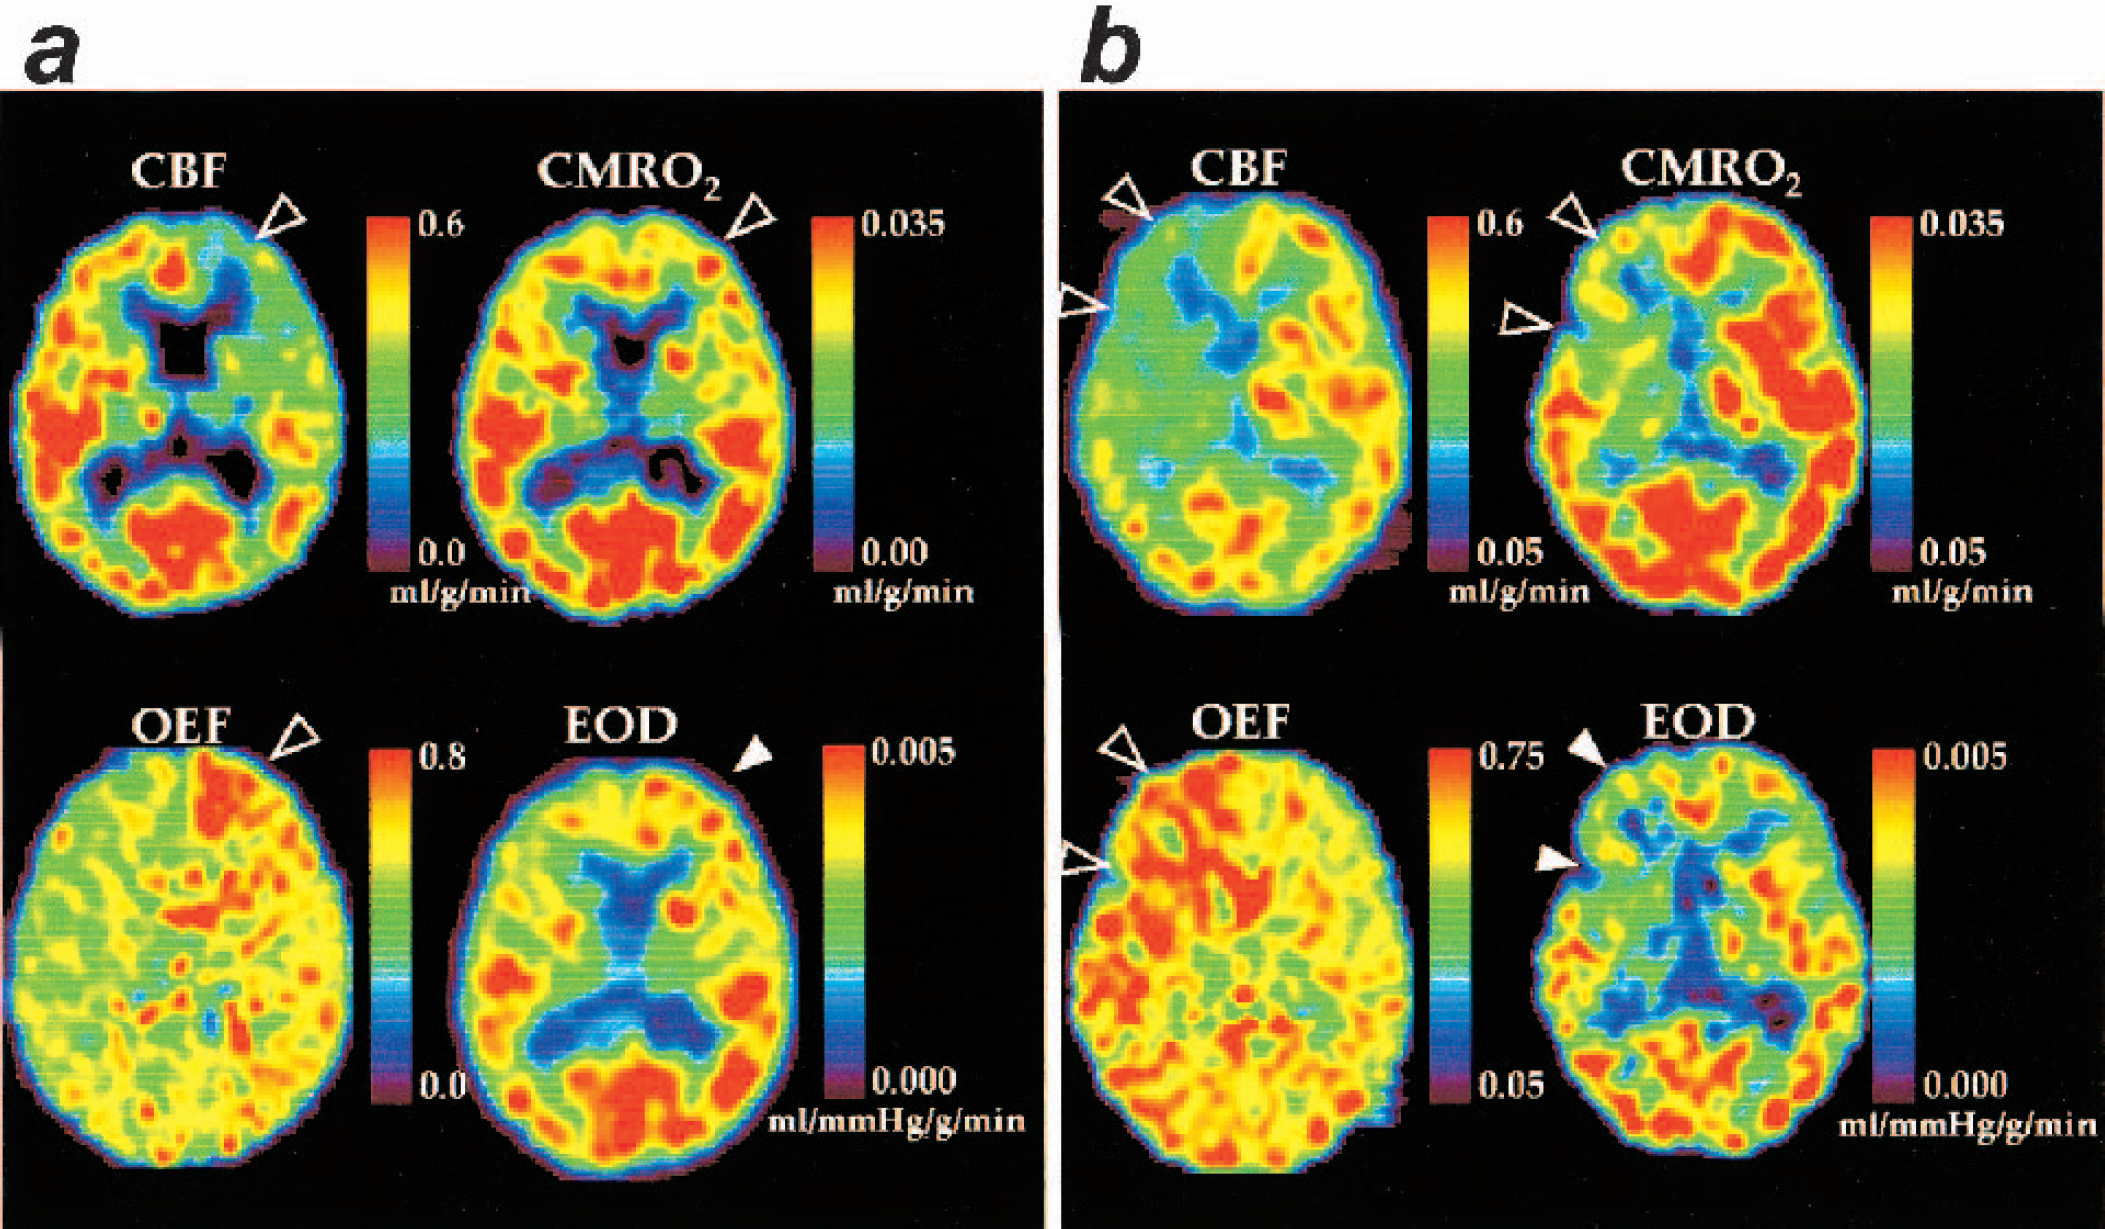
Application of the model-based EOD to PET data in two cases of chronic ischemia. (A) Patient A with left unilateral carotid occlusion, who showed left frontal hypoperfusion, elevated OEF, and preserved CMRO2 (shown in open arrowhead). Calculated EOD images showed elevation in EOD in the corresponding ischemic area compared with the contralateral side, suggesting elevation of oxygen diffusibility at the capillary level (filled arrowhead). (B) Patient B with right unilateral carotid occlusion, who showed ipsilateral hypoperfusion, elevated OEF, and slightly decreased CMRO2 (open arrowhead). EOD was also decreased in the corresponding ischemic region (filled arrowhead) compared with the contralateral side, suggesting absence of a compensatory response of capillary. EOD, effective oxygen diffusibility; PET, positron emission tomography; CMRO2, metabolic rate of oxygen; OEF, oxygen extraction fraction.
DISCUSSION
We have developed in the present study a simple model for oxygen delivery and metabolism, which describes oxygen diffusion from an idealized simple capillary to tissue, with nonlinear binding affinity of Hb to oxygen. It allowed dynamic changes in capillary function for oxygen transport, that is, effective oxygen diffusibility. Simulations were performed using this model to evaluate the effects of physiologic variation in oxygen delivery (CBF, Hb, and P50), assuming two extreme conditions in EOD, and revealed that variations in oxygen delivery affect its metabolism unless dynamic changes in EOD take place. In contrast, if we expect constant oxygen metabolism when its delivery is altered, oxygen diffusibility should compensate it dynamically at the capillary-tissue level.
To date, several simple oxygen delivery models have been described to interpret CBF and CMRO2 relationships during various physiologic conditions, all of which are based upon diffusion of oxygen transport from capillary to tissue (Buxton et al., 1997; Hudetz, 1999; Hyder et al., 1998; Mintun et al., 2001; Vafaee et al., 2000; Zheng et al., 2002). The theoretical rationale by Buxton et al. (1997) well clarified the nonlinear relationship between CBF and CMRO2 during functional activation. Assuming no capillary recruitment, the diffusion-limited nature of oxygen transport required a larger CBF increase to maintain a small increase in CMRO2 (Buxton et al., 1997). This model, however, predicted that when oxygen delivery was decreased, for example during hypoxia, maintenance of oxygen metabolism should be relieved solely by augmentation of blood flow. The present simulation, without dynamic changes in EOD, also showed that hypoxic decreases in oxygen delivery did not keep CMRO2 constant without substantial increases in CBF. Nevertheless, Mintun et al. (2001) revealed in a human CBF-PET study that visual activation during reduced oxygen delivery by mild hypoxia did not induce larger CBF increases than during normoxia. The observation was supported by their simulation of oxygen delivery, in which small but significant levels of intratissue oxygen content should maintain oxygen metabolism without a need for CBF increase (Mintun et al., 2001). These findings suggest that blood flow is not strictly regulated to fulfill tissue oxygen demand, and thus other factors that affect oxygen delivery need to be considered.
A number of studies in rodents suggested absent capillary change during hypercapnia (Bereczki et al., 1993b; Chen et al., 1994; Keyeux et al., 1995), nicotine-induced hyperemia (Chen et al., 1995), functional deactivation by pentobarbital-anesthesia (Wei et al., 1993), or ischemic or hypoxic insult (Bereczki et al., 1993a; Pinard et al., 2000; Seylaz et al., 1999). However, this has not been well estimated in the human brain. In the present simulation, if change in capillary function (EOD) was absent during any pathophysiologic condition, a variation in Hb content, even within a normal physiologic range, was accompanied by a small but significant variation in CMRO2. Similarly, variation in CBF, which is extrinsically induced by conditions such as ischemia or hyperemia, was accompanied by a small but significant variation in CMRO2. Thus, these states result in Hb-dependent and flow-dependent oxygen metabolism, respectively. On the other hand, to keep oxygen metabolism constant in any condition inevitably required dynamic compensatory changes in EOD.
Turning to the physiologic situations in the brain, it is well known that physiologic increases in CBF (e.g., mild hypercapnea) do not change cerebral metabolism of oxygen. Thus the changes must be primarily in the EOD. In contrast, during CBF decrease (e.g., hypocapnea), primary change may in the beginning also be in EOD, but at more marked CBF reduction, like ischemia, the compensatory change in EOD may not act enough to maintain cerebral metabolic rate of oxygen, and the tissue would be severely impaired. Although CBF in itself is physiologically controlled against a number of condition variables, such as perfusion pressure, pH, PaCO2 (Grubb et al., 1974), P50 (Paulson et al., 1973), Hb content or hematocrit (Henriksen et al., 1981), and neuronal activity (Roy et al., 1890), EOD in the present model may be an additional physiologic parameter to interpret oxygen transport. Future studies are needed to clarify the dynamics of EOD in various physiologic and pathophysiologic situations.
The model assumed unidirectional influx of oxygen out of the capillary and negligible oxygen present in tissue. This assumption appears justified by the findings that there is minimal oxygen in brain tissue, as revealed by the 18O-indicator-dilution technique (Kassissia et al., 1995). Negligible oxygen content in tissue is more likely in the case of PET, because the measurement requires a much longer duration for a single scan (more than 5 minutes). In fact, CMRO2 measured by PET is based upon compartment models with the assumption of no intratissue oxygen content (Frackowiak et al., 1980; Hatazawa et al., 1995; Mintun et al., 1984; Ohta et al., 1992). The addition of the parameter of oxygen tissue content into the model may decrease its predictive power.
Of note, it is not the average oxygen tension in the cerebral tissue that is of importance in this regard but rather the oxygen tension immediately around the capillaries in the brain. In fact, there will be a gradient of oxygen tensions from values close to the capillary oxygen tension around the capillary and down to very low values in the cerebral tissue most distant from the capillary (lethal corner of Krogh cylinder) (Hudetz, 1999; Mintun et al., 2001; Reneau et al., 1970). Obviously, the oxygen gradient in the tissue may change in some situations, for example, high blood flow values with unchanged metabolism in tissue would lead to a higher oxygen tension in the tissue, thereby influencing the effective oxygen diffusibility. Taken these into account, EOD might not only represent a total of capillary surface and permeability but also reflect the condition of oxygen immediately around the capillary in some conditions.
In addition, the present model assumed an idealized single columnar capillary. This is likely too simplified considering the complicated capillary network and counter current flow at the microcirculatory level. However, a single columnar model had been widely used as a Krogh cylinder model. Reneau et al. (1970) discussed that results based upon countercurrent geometry are not significantly different from those based upon concurrent flow. As long as tissue volume is not changed, the results remain the same.
Finally, for application of the present model to quantitative data, the approximate EOD showed overall similar changes in proportion with that of the numerical solution, if CBF and Hb values were not largely decreased. Factors that affect the accuracy of EOD in this model depend upon measurement of Hb and P50 values because these are measured systemically but not in situ. Hb content is known to change locally in several conditions, such as ischemia (Okazawa et al., 1996; Yamauchi et al., 1998) or functional deactivation (Yamauchi et al., 1999), and P50 also varies depending upon local metabolic conditions, by way of CO2 or pH (Guyton et al., 2000). Although local changes in Hb, P50, CO2, or pH cannot be measured directly, EOD still reflects biologic variables at the local capillary-tissue interface. Another error in EOD may come from possible variation in physiologic states during PET measurement because it takes a long time (approximately 1½ hours with the conventional steady-state method), and CBF and oxygen parameters can be obtained separately, so that there is no assurance of the identical physiologic state in both measurements. This may be improved in the future when implemented by a more rapid method to measure CBF and CMRO2 using PET (Kudomi et al., 2003).
In conclusion, the present simple model for oxygen delivery and metabolism allows estimation of active biologic responses to oxygen transport at the capillary-tissue interface other than the flow- and Hb-dependent nature of oxygen transport. The simulations and application to quantitative PET data showed the feasibility of the model to estimate oxygen diffusibility and suggested potent capillary changes between or within subjects under various pathophysiologic conditions. In the future, application of the model to neuroimaging data may give us further insight to understand the physiologic regulation for oxygen delivery in the human brain.
Footnotes
APPENDIX I
APPENDIX II
Acknowledgment
We thank Drs. A. Gjedde and O.B. Paulson for their valuable advice.