
Abstract
Cell death from cerebral ischemia is a dynamic process. In the minutes to days after an ischemic insult, progressive changes in cellular morphology occur. Associated with these events is the regulation of competing programs of gene expression; some are protective against ischemic insult, and others contribute to delayed cell death. Many genes involved in these processes have been identified, but individually, these findings have provided only limited insight into the systems biology of cerebral ischemia. Attempts to characterize the coordinated expression of large numbers of genes in cerebral ischemia has only recently become possible. Today, DNA microarray technology provides a powerful tool for investigating parallel expression changes for thousands of genes at one time. In this study, adult mice were subjected to 30 minutes of hypoxia-ischemia (HI), and the hippocampus was examined 12 hours later for differential gene expression using a 15K high-density mouse EST array. The genomic response to HI is complex, affecting approximately 7% of the total number of ESTs examined. Assigning differentially expressed ESTs to molecular functional groups revealed that HI affects many pathways including the molecular chaperones, transcription factors, kinases, and calcium ion binding genes. A comprehensive list of regulated genes should prove valuable in advancing our understanding of the pathogenesis of cerebral ischemia.
Cell death from cerebral ischemia is a dynamic process. In the minutes to days after an ischemia insult, progressive changes in cellular morphology occur in ischemic tissues. Associated with these events is the regulation of competing programs of gene expression; some are protective against ischemic insult and facilitate cell survival, and others contribute to delayed cell death. Many genes involved in these processes have been identified, but individually, these studies provide only limited insight into the molecular pathways involved in the response to cerebral ischemia (Read et al., 2001). An appreciation of the sequence of events underlying stroke pathogenesis will come only after the coordinated patterns of gene expressions have been described. Such investigations have until recently been hampered by a lack of accessible methods for gene screening.
Today, developments in DNA microarray technology provide a powerful tool for investigating large-scale changes in gene expression. DNA microarray technology has made it possible to simultaneously analyze gene expression for tens of thousands of genes. This approach has been used to investigate disease-related changes in gene expression for myocardial ischemia (Stanton et al., 2000), aging (Lee et al., 2000; Loring et al., 2001), brain injury (Matzilevich et al., 2002), and neurodegenerative diseases including Parkinson's Disease (Grunblatt et al., 2001), Huntington's disease (Chan et al., 2002; Sipione et al., 2002), and Alzheimer's disease (Colangelo et al., 2002; Loring et al., 2001; Pasinetti, 2001; Pasinetti and Ho, 2001). Cerebral ischemia is likewise suitable for DNA microarray analysis because it is a complex process dependent, in part, on differential RNA expression. Soriano et al. (2000) pioneered the use of array technology in the investigation of cerebral ischemia. Using an oligonucleotide probe array they provided the first description of large-scale mRNA differential expression associated with permanent focal ischemia in the rat. Their study monitored 750 genes and showed impressive changes in gene expression, with immediate early genes accounting for the majority of differentially expressed transcripts. Subsequent investigations have characterized differential gene expression in rat models of global brain ischemia (Jin et al., 2001), photothromboyic ischemia (Kim et al., 2002), focal ischemia reperfusion (Schmidt-Kastner et al., 2002), and a model of hypoxic preconditioning (Bernaudin et al., 2002). An important feature of these studies is that they have all confirmed the expression of many known ischemia-hypoxia responsive genes as well as connecting many new genes to brain ischemia. Significantly, despite using a variety of array formats (Affymetrix, cDNA, and oligonucleotide arrays), these studies have produced data with a high degree of consistency between studies. Consistent observations in these studies included genes involved in molecular chaperoning, gene expression, metabolism, signaling, and cell structure. Such initial findings illustrate the usefulness of DNA microarray technology as an approach for developing hypotheses regarding molecular pathways in cerebral ischemia.
In this study, we have used a mouse model of cerebral ischemia. We investigated a mouse model because of its suitability for transgenic research (Perkins, 2002). Moreover, compared to rats, the mouse genome is more completely described. Recently, a mouse model of hypoxia-ischemia (HI) has been used to better understand morphologic changes and molecular processes associated with cerebral ischemic (O'Donnell et al., 2002; Vannucci et al., 2001). Animals that survive develop morphologic and behavioral deficits. Here we have examined changes in gene expression 12 hours after HI, a time when the cerebral infarct is dynamically evolving. It is clear that substantial alterations in gene expression are needed to afford such profound changes. Alterations in the expression of a limited number of genes have been described in the mouse model of HI (O'Donnell et al., 2002).
We have used a 15,247-EST mouse cDNA microarray to describe the first large-scale analysis of transcriptional changes in the hippocampus, an area susceptible to insult, after HI in the adult mouse. Our results show that approximately 7% of the total number of ESTs examined were regulated in response to HI. This analysis has revealed the differential expression of a number of genes previously shown to be altered in response to cerebral ischemia as well as a variety of genes not previously implicated in its pathogenesis. The implications of some of these changes with respect to cerebral ischemia pathogenesis are discussed. A better understanding of the complex response patterns following cerebral ischemia will facilitate the development of neuroprotective drugs and strategies.
MATERIALS AND METHODS
Animals and general reagents
Adult male C57Bl/6 mice were purchased from Charles River (Quebec) at 8 weeks of age (21 to 24 g). Mice were acclimated to the animal quarters at least 7 days before the study. All procedures were in compliance with the Canadian Council on Animal Care guidelines. Animals were housed in groups of four, maintained on a 12-hour light/dark cycle, and allowed free access to food and water. All experimental procedures took place in the light phase of the cycle. Mice were divided randomly into three groups: naive control (Nv), hypoxia-ischemia, and sham.
Unilateral cerebral hypoxia-ischemia
One week after arrival, animals were subjected to hypoxia-ischemia (HI) using a modification of the procedure developed in the immature rat (Rice et al., 1981; Vannucci et al., 1996) and described recently in adult mice (O'Donnell et al., 2002; Vannucci et al., 2001). Animals were anesthetized with isoflurane (4% in oxygen), and the left carotid artery was isolated and double ligated with sterile 4.0 nonabsorbable surgical silk. During the isolation of the common carotid artery, care was taken to preserve the vagus nerve. The incision was sutured, and the animals were allowed to recover for 2 hours before exposure to hypoxia. Animals typically recovered within minutes of being returned to their cages. Rectal temperature was regulated at 37°C by thermostatic controlled heating pads. Two hours after common carotid artery ligation, for induction of systemic hypoxia, animals (in groups of four) were placed in a hypoxia chamber (500 mL air tight glass jar) that was submerged in a heated water bath and exposed first to 15 minutes of normoxic air, then immediately followed by 30 minutes of exposure to a gas mixture of 8% O2–92% N2. The flow rate through the hypoxia chamber was approximately 1,000 mL per minute. The water bath temperature was maintained at 35.5°C and corresponded with the interior temperature of the hypoxia chamber. Afterwards, the animals were allowed to recover in the hypoxia chamber under normoxic conditions for 15 minutes; they were then returned to their cages and allowed free access to food and water. This procedure has been associated with brain injury in the hemisphere ipsilateral to the carotid artery occlusion, consisting of cerebral infarction in the cortex, striatum, and hippocampus (O'Donnell et al., 2002; Vannucci et al., 2001).
Sham-ischemia
Sham (Sh) animals were treated similarly to those animals that received the HI. Mice were anesthetized, and neck and muscle incisions were made. The common carotid was isolated but not ligated. The wounds were then sutured, and animals were returned to their cages. Two hours after Sh surgery, animals were placed in the hypoxia chamber and exposed to normoxic air for 60 minutes.
Assessment of brain histopathology following hypoxia-ischemia
Animals were deeply anesthetized by intraperitoneal injection of sodium pentobarbital (65 mg/kg) and were perfused intracardially with cold phosphate-buffered saline (PBS) then 4% paraformaldehyde in 0.1 M phosphate buffer (pH 7.4) at 1, 3, 6, 12, and 24 hours and 7 days after HI or Sh (n = 6 at each time point). Brains were removed and immersion-fixed at 4°C in the same fixative for 24 hours. Brain tissues were cryoprotected in 30% sucrose. Tissues were frozen and sectioned at 30 μm on a microtome in the coronal plane. Sections were mounted onto gelatin coated glass slides and dried overnight. Sections were then dehydrated in a series of ethanols, defatted with xylene, rehydrated, and stained with 1% cresyl violet acetate for visualization of Nissl substance. Slides were next washed in water, dehydrated in ethanol, placed in xylene, and cover-slipped with Entellan (E. Merck, Darmstadt, Germany).
DNA microarrays and analysis
Isolation of total RNA
In this study, we measured hippocampal gene expression in two experimental sets: HI versus Sh and Sh verses naive. Naive mice were housed with HI and Sh but were not handled. A total of 56 mice were used (16 HI, 32 Sh, and 8 naive). Mice were reanesthetized under RNase free conditions and decapitated 12 hours after Sh or HI treatment. The brains were quickly removed and the hippocampus dissected ipsilateral to the Sh or HI treatment. Bilateral hippocampus was removed from the naive mice. Care was taken to exclude the corpus collasum from the hippocampal samples. The tissue samples were immediately frozen in liquid nitrogen and stored at −80°C until RNA isolation. Total RNA was isolated from the entire hippocampal formation (CA1-4 of Ammon's horn and the dentate gyrus) using a GenEluteTotal RNA Miniprep Kit (Sigma). Samples from eight animals in each group were pooled so that sufficient RNA was available for hybridization. Thus, n = 2 master samples were prepared per experimental set. Total cellular RNA was quantified by UV spectrophotometry, and the quality was assessed according to the A260/A280 ratio. Typically, ratio values obtained were greater than 1.8. Total RNA was treated with DNAase I prior to use in all experiments. RNA integrity was assessed by electrophoresis in 1% agarose gel.
cDNA synthesis and in vitro transcription
An anchored oligo-dT (AncT) primer was synthesized by Sigma Genosys and consisted of 100 μM each of oligo-dT(20)A, oligo-dT(20)C, and oligo-dT(20)G. Mouse 15K EST microarrays (spotted cDNA) and the pARAB (containing arabidopsis control DNA) plasmid were obtained from the Ontario Cancer Institute (OCI, http://www.microarrays.ca/). Additional reagents used in microarray experiments were as follows: Superscript II reverse transcriptase (Gibco), Microcon PCR purification spin column (Millipore), DIG Easy Hyb (Roche), yeast tRNA (Gibco), calf thymus DNA (Sigma), Cy3-dCTP (Dupont NEN), and Cy5-dCTP (Dupont NEN). The control pARAB RNA was produced by in vitro transcription of pARAB. Terminal deoxynucleotidyl transferase (TdT) was obtained from Promega. GeneElute total RNA isolation kits were obtained from Sigma.
The direct labeling method was used to label RNA. Briefly, 20 μg of total RNA and 15 ng pARAB RNA were labeled, with either Cy3 or Cy5, by incubating (42°C for 2 hours) in a solution containing 1 X1st strand buffer, 500 μM nucleotide mix (dATP, dTTP, dGTP), 50 μM dCTP, 2.5 μM DTT, 3.75 μM AncT primer, 25 μM Cy3-dCTP or Cy5-dCTP, and 400 U Superscript II reverse transcriptase. The RNA was then hydrolyzed by adding 5 mM EDTA (pH 8.0) and 0.5 N NaOH followed by a 20-min incubation period at 65°C. The hydrolysis reaction was terminated by the addition of 0.5 M acetic acid. The labeled cDNA was then purified using a Microcon PCR column according to the manufacturers specifications. The purified labeled cDNA was then eluted in 5 μl dH2O and added to 60 μl hybridization buffer (prepared by combining 80 μl Dig Easy Hyb, 4 μl yeast t-RNA, and 4 μl calf thymus DNA; this mixture was heated to 65°C for 2 minutes, then cooled to room temperature before use).
Microarray analysis
A balanced design was used in conducting the hybridizations (Yang and Speed, 2002). For each of the groups analyzed, two biologic replicates were performed using two microarrays per biologic replicate. The biologically replicated hybridizations were performed using the dye-swap method (to control for systemic bias caused by differences in Cy3 and Cy5 dye incorporation). Thus, two biologic samples consisting of material from eight mice for each condition sample (HI, naive, and Sh) were interrogated using four microarrays in a dye-swap design. The microarrays are spotted in duplicate (adjacent spots), so a maximum of eight spots per element were measured (2 spots/microarray ∗ 2 microarrays/replicate ∗ 2 replicates/group).
The microarrays were scanned using an Axon GenePix 4000B microarray scanner. Microarray image acquisition and analysis was performed using Axon GenePix Pro 4.0 software. The microarray data (GenePix results files, Cy3 and Cy5 image files) were then transferred to the GeneTraffic Duo 2.5 (http://Iobion.com) microarray analysis/database package. Full MIAME annotation for this project was entered into GenTraffic and can be viewed at http://cbrmain.cbr.nrc.ca/costaiw/HI_MIAME_annotation. Data normalization (lowess subgrid), flagging, filtering, and annotation (Unigene cluster and Gene Ontology (GO) assignment) were performed using GeneTraffic. Valid spot measurements were exported and transformed into a format suitable for analysis with the SAM (Statistical Analysis of Microarrays, http://www-stat.stanford.edu/tibs/SAM/index.html) package (Tusher et al., 2001). Only elements that possessed greater than or equal to six valid spots (out of a total of eight) were included in the dataset used in SAM analysis. In essence, SAM performs multiple t-tests on the data to identify elements that are significantly different from the mean expression values. To account for susceptibility to type I errors when making multiple comparisons, SAM calculates a false discovery rate (FDR) and allows for an estimate of the degree of confidence in the statistical calls reported. Our practice is to use a FDR < 1 (i.e., < 1 in X can be expected to be false positives) so that we have a very high degree of confidence in the ESTs called significant.
An additional dataset (HI versus naive) was computed according to the following equation (Yang and Speed, 2002):
The above calculation was performed on those elements that possessed greater than or equal to six valid spots. Where greater than or equal to six valid spots were obtained for the HI/Sh group, but not the Sh/Nv group, Sham was assumed to have no effect, and therefore HI/Nv = HI/Sh was considered valid. Data from each group (HI/Sh, HI/Nv and Sh/Nv) were analyzed individually with SAM (one-sample method), and lists of significantly altered genes were obtained with a delta setting that produced a FDR < 1. SAM was also used to generate P values (t-test) for each element in the experiments. The expression, P values, and significance calls were transferred to the GenMAPP (http://www.GenMAPP.org) program for visual representation of the expression data. The bioinformatics tools required for this analysis were developed at the Brain Repair Center, Dalhousie University (by Dr. Costain) and are available to the public through the Canadian Bionformatics Resource at http://cbrmain.cbr.nrc.ca/costaiw/.
Analysis of gene and protein expression
In situ hybridization analysis for Hsp105 and Hsp86 mRNA
Animals were anesthetized at 12 hours after HI (n = 3) and Sh (n = 3). Brains were removed quickly and frozen in liquid nitrogen. Brain slices were frozen-sectioned in the coronal plane at 14-μm thickness and mounted on glass slides (Fisherbrand Superfrost/Plus, Fisher Scientific). Synthetic oligonucleotide probes were obtained from Sigma Genosys. The Hsp105 antisense oligonucleotide (5′-CACTTAGGGT CAGAGACTACA CAGATTCAA-3′) was complementary to nucleotides 2865 to 2894 of the mouse HSP105 mRNA (Genbank accession No. XM_124705.1). The Hsp86 antisense oligonucleotide (5′-ATTATCAGAAGGAATGAAGGTAAG CAAACA-3′) was complementary to nucleotides 850 to 879 of the mouse Hsp86 mRNA (Genbank accession No. XM_125251.1). In situ hybridization to detect the regional distribution of mRNA signals has been described previously (Denovan-Wright et al., 1998). Briefly, each probe was 3′-end-labeled using terminal deoxynucleotidyl transferase (Promega) and [33P]dATP (Perkin Elmer). After overnight hybridization, slides were then washed four times at 55°C for 30 minutes in 1X standard saline citrate (SSC), four times for 30 minutes in 0.5X SSC, and three times for 30 minutes in 0.25X SSC, then they were dipped in water and air-dried overnight. The following day, sections were exposed to Kodak BioMax-MR-1 film together with [33P] standards. Slides were exposed for 1 to 2 weeks in a light-tight cassette, then they were photographically processed.
Immunohistochemistry
Animals were deeply anesthetized by intraperitoneal injection with sodium pentabarbital (65 mg/kg) and were perfused intracardially with PBS and then 4% paraformaldehyde (as above) at 24 hours after HI or Sh (n = 4 at each time point). The brains were rapidly removed, immersion-fixed at 4°C for 24 hours, and then cryoprotected in 30% sucrose. Tissues were frozen and sectioned at 30 μm on a microtome in the coronal plane. Consecutive sections were collected in 12-well plates, and immunohistochemistry was performed on free floating sections. Sections were treated with 1% H2O2 for 5 minutes and then placed in blocking buffer (3% rabbit serum), and Triton X-100 in PBS for 1 hour at room temperature. The following primary antibodies, dilutions, and incubation times were used: goat polyclonal antibody against mouse Hsp105 (1:500, overnight at 4°C, Santa Cruz Biotechnology, California), rabbit polyclonal antibody against synthetic Hsp86 (1:200, overnight at 4°C, Affinity Bioreagents Inc), and mouse monoclonal antibody against human Hsp70 (1:1000 dilution overnight at 4°C, StressGen, Victoria, British Columbia, Canada). After washing three times for 10 minutes with PBS, the sections were incubated sequentially, in biotinylated goat anti-rabbit IgG (goat anti-mouse in the case of Hsp70) (Vector, USA), followed by ABC complex (Vector, USA) diluted 1:200 in the same solution as the primary antiserum. Between incubations, the tissues were washed three times for 10 minutes with PBS. Sections were visualized with 3,3′-diaminobenzidine (DAB) in 0.1 M Tris buffer and mounted on gelatin-coated slides. Antibody immunoreactions were observed under the Axioplot microscope (Carl Zeiss, Germany). To establish the specificity of the immunostaining, a negative control test was carried out with preimmune serum instead of primary or secondary antibodies. All tissue samples were reacted for immunohistochemistry in parallel.
RESULTS
Assessment of brain damage due to hypoxia-ischemia
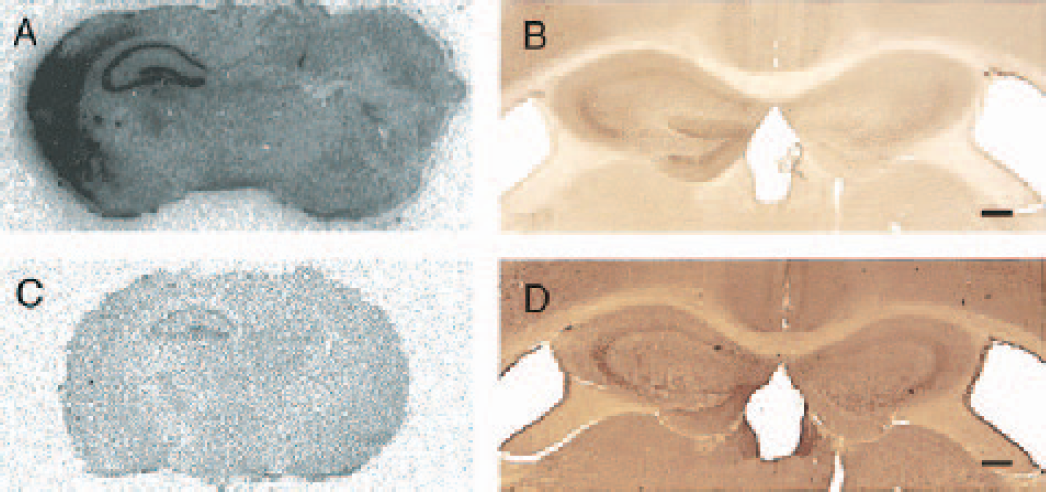
The extent and distribution of brain injury in HI treated mice has been recently reported (O'Donnell et al., 2002; Vannucci et al., 2001). Using Nissl stain, we assessed morphologic changes on brain sections taken from animals 1, 3, 6, 12, and 24 hours and 7 days after HI or Sh. No change in neuronal morphology was detected with Nissl staining at 1 or 3 hours after HI; however, by the 6-hour time, point brains began to show evidence of morphologic change, indicated by presence of pyknotic (darker stained condensed) cells in the pyramidal layer of the medial CA1 hippocampus (observed in three of six animals). Such images are consistent with neuronal damage and were virtually absent from other hippocampal areas. By the 12-hour time-point, areas of morphologic change expanded to include the cerebral cortex (observed in four of six animals) (Fig. 1A–D). Brains examined 24 hours after HI frequently exhibited morphologic change over the entire hippocampal formation with evidence of pyknotic cells in the CA1, CA2, and dentate gyrus (Fig. 1E). A final set of animals subjected to HI and analyzed after 7 days of recovery exhibited ablation of the hippocampus as well as significant lesioning of frontal cortex and striatum ipsilateral to the CCA occlusion (Fig. 1F). The mortality rate associated with exposure to 30 minutes of HI was approximately 7% (the majority of deaths occurring during the HI episode). Naive- and Sh-treated mice displayed normal brain morphology at all time points examined.
Assessment of damage in hippocampal regions of adult mouse brains evaluated 12 hours
Hypoxia-ischemia causes large-scale regulation of hippocampal gene expression
High-density cDNA microarrays were used to examine genes whose expressions are regulated following HI. RNA samples prepared from the hippocampus of mice 12 hours after HI were compared with RNA from animals receiving Sh treatments. Hippocampi from each experimental condition were pooled (eight unilateral hippocampi/condition) to yield sufficient amounts of total RNA and to minimize potential variation among animals. The microarrays used in these studies were spotted with 15,247 unique ESTs. A number of criteria were set to increase the level of confidence in the analysis of the microarray data. These criteria are as follows: (1) a minimum of six valid spot measurements per EST (out of a total of eight spots on four microarrays per hybridization group); (2) a significantly different (P < 0.001) expression ratio value (SAM analysis); (3) only include those ESTs identified by SAM with an FDR < 1; and (4) the EST must be present on all microarrays examined. For the HI/Sh comparison, we found a total of 11,576 ESTs met the first criteria and were included in the SAM analysis. Of these 11,576 valid EST measurements, 845 (approximately 7.3%) met all of the confidence criteria. Remarkably, only 14 of these ESTs were downregulated. For the Sh/Nv comparison, a total of 8,038 ESTs met the first criteria and were included in the SAM analysis. Of these, a total of 214 ESTs were significantly downregulated (approximately 2.7%), with no ESTs significantly upregulated. The same selection criteria were applied to the Sh/Nv dataset.
Additionally, analysis of the HI/Nv dataset, as described in the Methods, was performed using the same selection criteria. This data set also included 11,576 ESTs and resulted in the identification of 711 ESTs (approximately 6.1%) that met the selection criteria (646 upregulated and 65 downregulated). Fig. 2 is a Venn diagram indicating the degree of overlap between the ESTs identified as upregulated by HI (HI/Sh and HI/Nv) and the ESTs downregulated by Sham (Sh/Nv). A total of 609 ESTs were found to be upregulated in both the HI groups. Of these, only 31 were significantly downregulated by the Sham treatment. Analysis of the HI/Nv dataset was performed to help delineate those genes that were upregulated by HI and may have also been influenced by the Sham treatment. Because we know that the Sham treatment had an overall effect of decreasing RNA expression, we needed to account for any increases caused by HI that may have been partly caused by the reduced levels of expression in the Sham tissue. By focusing on those genes that were upregulated in both the HI/Sh and HI/Nv groups, we were able to identify those ESTs whose expression was altered solely because of HI, as well as those that are also influenced by the Sham treatment.
A Venn diagram showing the degree of overlap between the upregulated ESTs within the HI/Sh and HI/Nv groups as well as the number of those ESTs that are downregulated in the Sh/Nv group. A total of 578 ESTs were significantly upregulated by HI, and these genes were not affected by the sham procedure. Of the ESTs, 51 were affected by HI and sham, 20 of which were not identified as upregulated in the HI/Nv group.
Table 1 is a list of the ESTs that were identified as regulated by HI. For the upregulated ESTs, only those ESTs that were identified in both HI groups (HI/Sh and HI/Nv) are reported. The table is divided into three categories: ESTs that corresponded to UniGene clusters with GO annotation (annotated UniGene Clusters), UniGene clusters that do not have GO annotation (unannotated UniGene clusters) and ESTs that do not belong to a UniGene cluster (unclustered ESTs). The 609 upregulated ESTs were made up of 70 annotated UniGene clusters (12 redundancies), 444 unannotated UniGene clusters, and 95 unclustered ESTs. All of the ESTs that have annotated UniGene clusters are presented in Table 1. Table 1 also includes a listing of the unannotated UniGene clusters and the unclustered ESTs. For the purposes of brevity, only those unannotated/unclustered ESTs that possessed an expression ratio greater than 3 are included in Table 1. The complete list is available in the supplemental data. Table 1 also includes information describing the ESTs that were downregulated in the HI/Sh group. The downregulated ESTs included six annotated UniGene clusters (two redundancies), four unannotated UniGene clusters, and two unclustered ESTs. A comprehensive list of the datasets of differentially expressed ESTs is available in our supplemental data (http://cbrmain.cbr.nrc.ca/costaiw/HI_Stroke.html).
EST's regulated by HI
The table lists ESTs that are either up- or down-regulated 12 hrs following a HI insult. Data are further sub-classified as Annotated (Gene Ontology annotation) and Un-Annotated Unigene clusters as well as Un-Clustered ESTs (ESTs that do not belong to a Unigene cluster). All of the ESTs that possessed GO annotation and were called significant were reported; while reporting of the significantly different ESTs that were either un-annotated or un-clustered was cut off at a 3 fold change. The molecular function GO annotation was used primarily, and biological process or cellular component annotations were used for those ESTs that did not possess a molecular function annotation. Certain un-annotated ESTs were present in multiple Unigene clusters, and their clone identifiers were provided instead of the Unigene cluster IDs. IRG, ischemic responsive genes; GO, gene ontology; FC, fold change; n = number of ESTs on the array that correspond to a Unigene cluster.
An interesting aspect of the data is that the alterations in gene expression of the unannotated UniGene clusters appear to be more robust than the annotated UniGene clusters. In part, this is due to the fact that only approximately 30% of UniGene clusters represented on the mouse 15k EST microarrays have been annotated by the GO consortium. Further characterization of the unannotated UniGene clusters identified here is justified, as they are likely to be playing a significant role in the HI induced pathophysiology.
Functional classification of genes whose expressions are altered following hypoxia-ischemia
To classify genes according to function we used gene ontology, an informed method of grouping genes to categorize differentially expressed ESTs based on their reported or suggested molecular functions. Gene identification was made using GenBank and the accession numbers provided for each ESTs. ESTs that were not easily identified (having no Unigene cluster ID) were designated “unknown,” and those lacking clear mRNA association were designated to the category “nonannotated.” Of the n = 609 upregulated ESTs, a mere 56 genes were annotated. Only six downregulated ESTs were annotated. Table 1 lists HI-responsive genes designated into 30 functional groups. Of the genes, 14 of the 56 upregulated and n = 2 of the 6 downregulated have previously been identified as known ischemic responsive genes (IRG). Importantly, n = 42 of these annotated ESTs have not been previously implicated in cerebral ischemia, thereby identifying potential new candidates in the pathogenesis of cerebral ischemia. Comprehensive lists of the entire dataset of differentially expressed ESTs classified according to cellular location and biologic process are available in our supplemental data (http://cbmmain.cbr.nrc.ca/costaiw/HI_Stroke.html).
One functional group stands out in terms of regulation 12 hours after HI. This was the molecular chaperone (heat shock protein) family. Forty-one chaperone family genes were represented on the array and, as expected for cerebral ischemia, a number of differentially expressed candidates were identified. Fig. 4 presents expression data for these genes. Of the 41 chaperone family genes, seven were identified as differentially expressed (increased) following HI. Multiple ESTs confirmed the expression data for many of these genes. As indicated in Table 1, two independent findings for the up regulation of Hsp105 and seven for Hsp86 were made; these findings are in line with our concurrent in situ hybridization studies (described below). Other differentially expressed ESTs coding for chaperone proteins included three independent findings for Hspa8 and one each for Dnaja1, Hsp60, Hsp25, and Hspa9a. Not all of the known chaperone genes were detected in our samples. Some representatives were eliminated from analysis because they did not meet our threshold criteria for detection. Several genes (i.e., Hspa1l and the inducible forms of Hsp70) were not present on the mouse 15K array. However, immunohistochemistry for the inducible form of Hsp70 showed as expected, an intense signal in the entire hippocampus following HI (data not shown).
Effects of sham-ischemia on the regulation of hippocampal gene expression
In animal models for stroke, a wide variety of procedural events unrelated to cerebral ischemia impact on gene expression. In the present model, surgery, anesthesia, thermal regulation. and confinement to a hypoxia chambers with high airflow each have the potential to create bias in the evaluation of HI regulated genes. A comprehensive list of Sh-regulated ESTs allows the researcher to better assess the influences of sham on these results. RNA samples prepared from the hippocampus of mice 12 hours following Sh were compared with RNA from naive controls. Hippocampi from each experimental condition were pooled (eight unilateral hippocampi/condition) to improve RNA yields and to minimize potential variation among animals. The microarray used in these studies were spotted with 15,247 unique ESTs. For the Sh/Nv comparison, a total of 8,038 ESTs met the first criteria and were included in the SAM analysis. Of these, a total of 214 ESTs were significantly downregulated (approximately 2.7%), with no ESTs significantly upregulated. The same selection criteria were applied to the Sh/Nv dataset. Fig. 3 shows the amount of overlap between the three groups analyzed. It can be seen that none of the ESTs identified in the Sh/Nv group were present in the HI/Sh group, indicating that the Sham and HI treatments affect largely unrelated groups of genes. Table 2 provides a list of ESTs that were found to be downregulated by Sham treatment. A total of 214 ESTs were significantly downregulated, with 37 annotated UniGene clusters (1 redundancy), 142 unannotated UniGene clusters, and 35 unclustered ESTs. Again, to limit the size of the table, data for the unannotated UniGene clusters and unclustered ESTs were limited to those with ESTs with an expression ratio greater than 1.5. A comprehensive list of the datasets of differentially expressed ESTs is available in our supplemental data (http://cbrmain.cbr.nrc.ca/costaiw/HI_Stroke.html). Of these, three genes have previously been associated with cerebral ischemia.
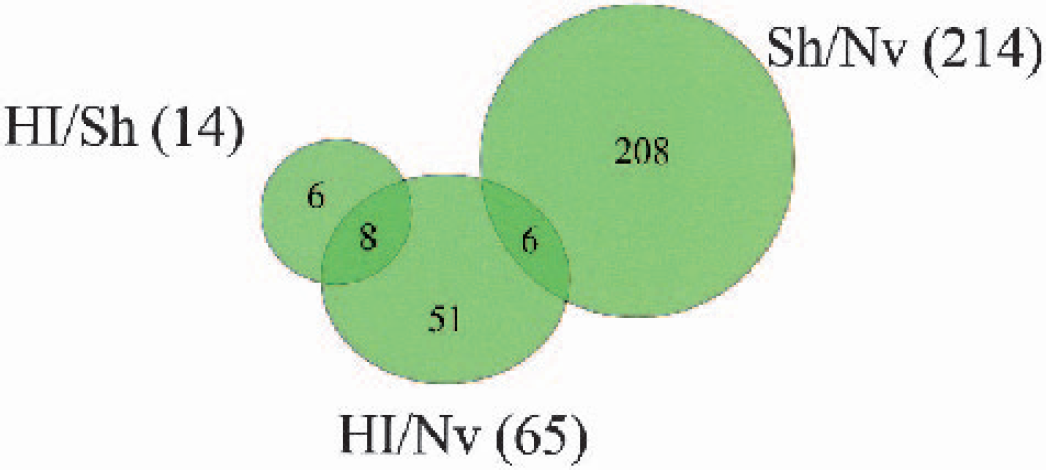
A Venn diagram showing the degree of overlap between the downregulated ESTs within the HI/Sh, HI/Nv and Sh/Nv groups. A total of 214 EST were significantly decreased in the Sh/Nv group, none of which were present in the HI/Sh group of 14 ESTs. Only 6 ESTs were present in both the Sh/Nv and HI/Nv groups.
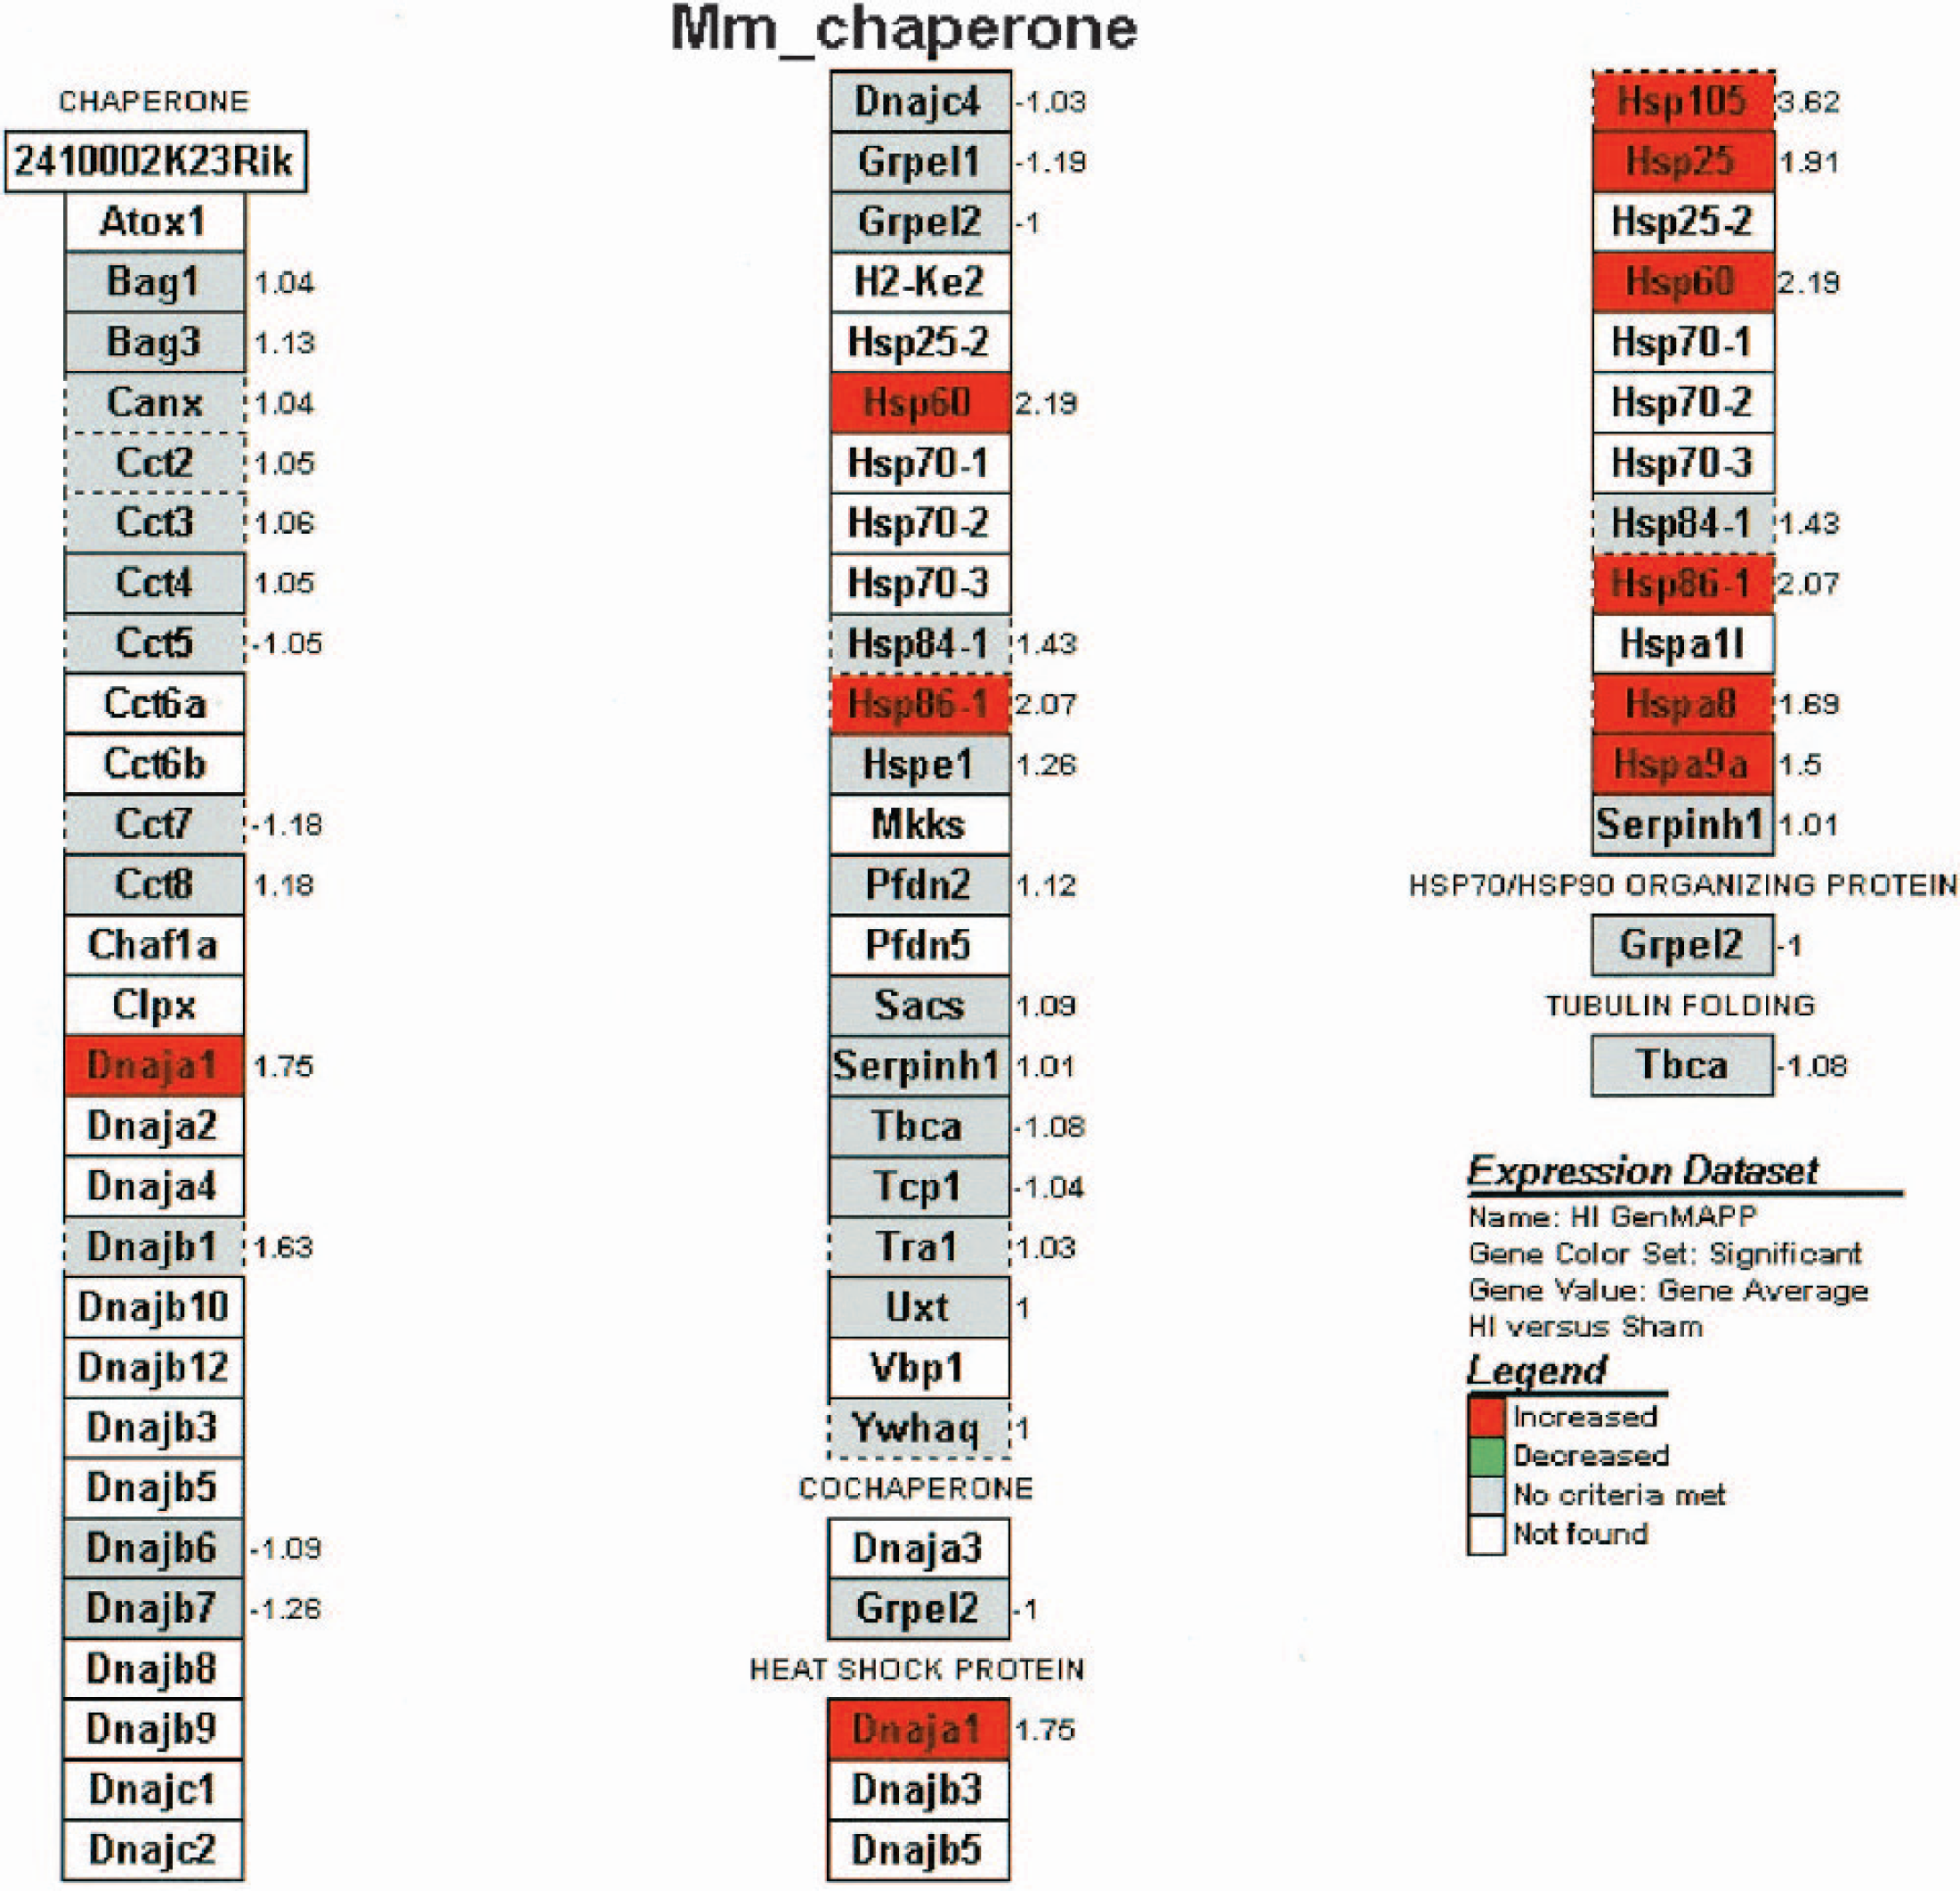
Expression dataset for genes of the molecular chaperone family present on the microarray. Gene abbreviations are described in Table 1. A gray box indicates the gene is represented on the array, but the expression change was not significant. Red boxes indicate significant differential expression for the indicated gene. Clear boxes represent chaperone genes not represented on the 15K mouse array. Fold changes associated with boxes encircled by a dashed line are the means of multiple ESTs expressions. Adapted from Gene Ontology, e-mail:
EST's downregulated by Sham treatmen
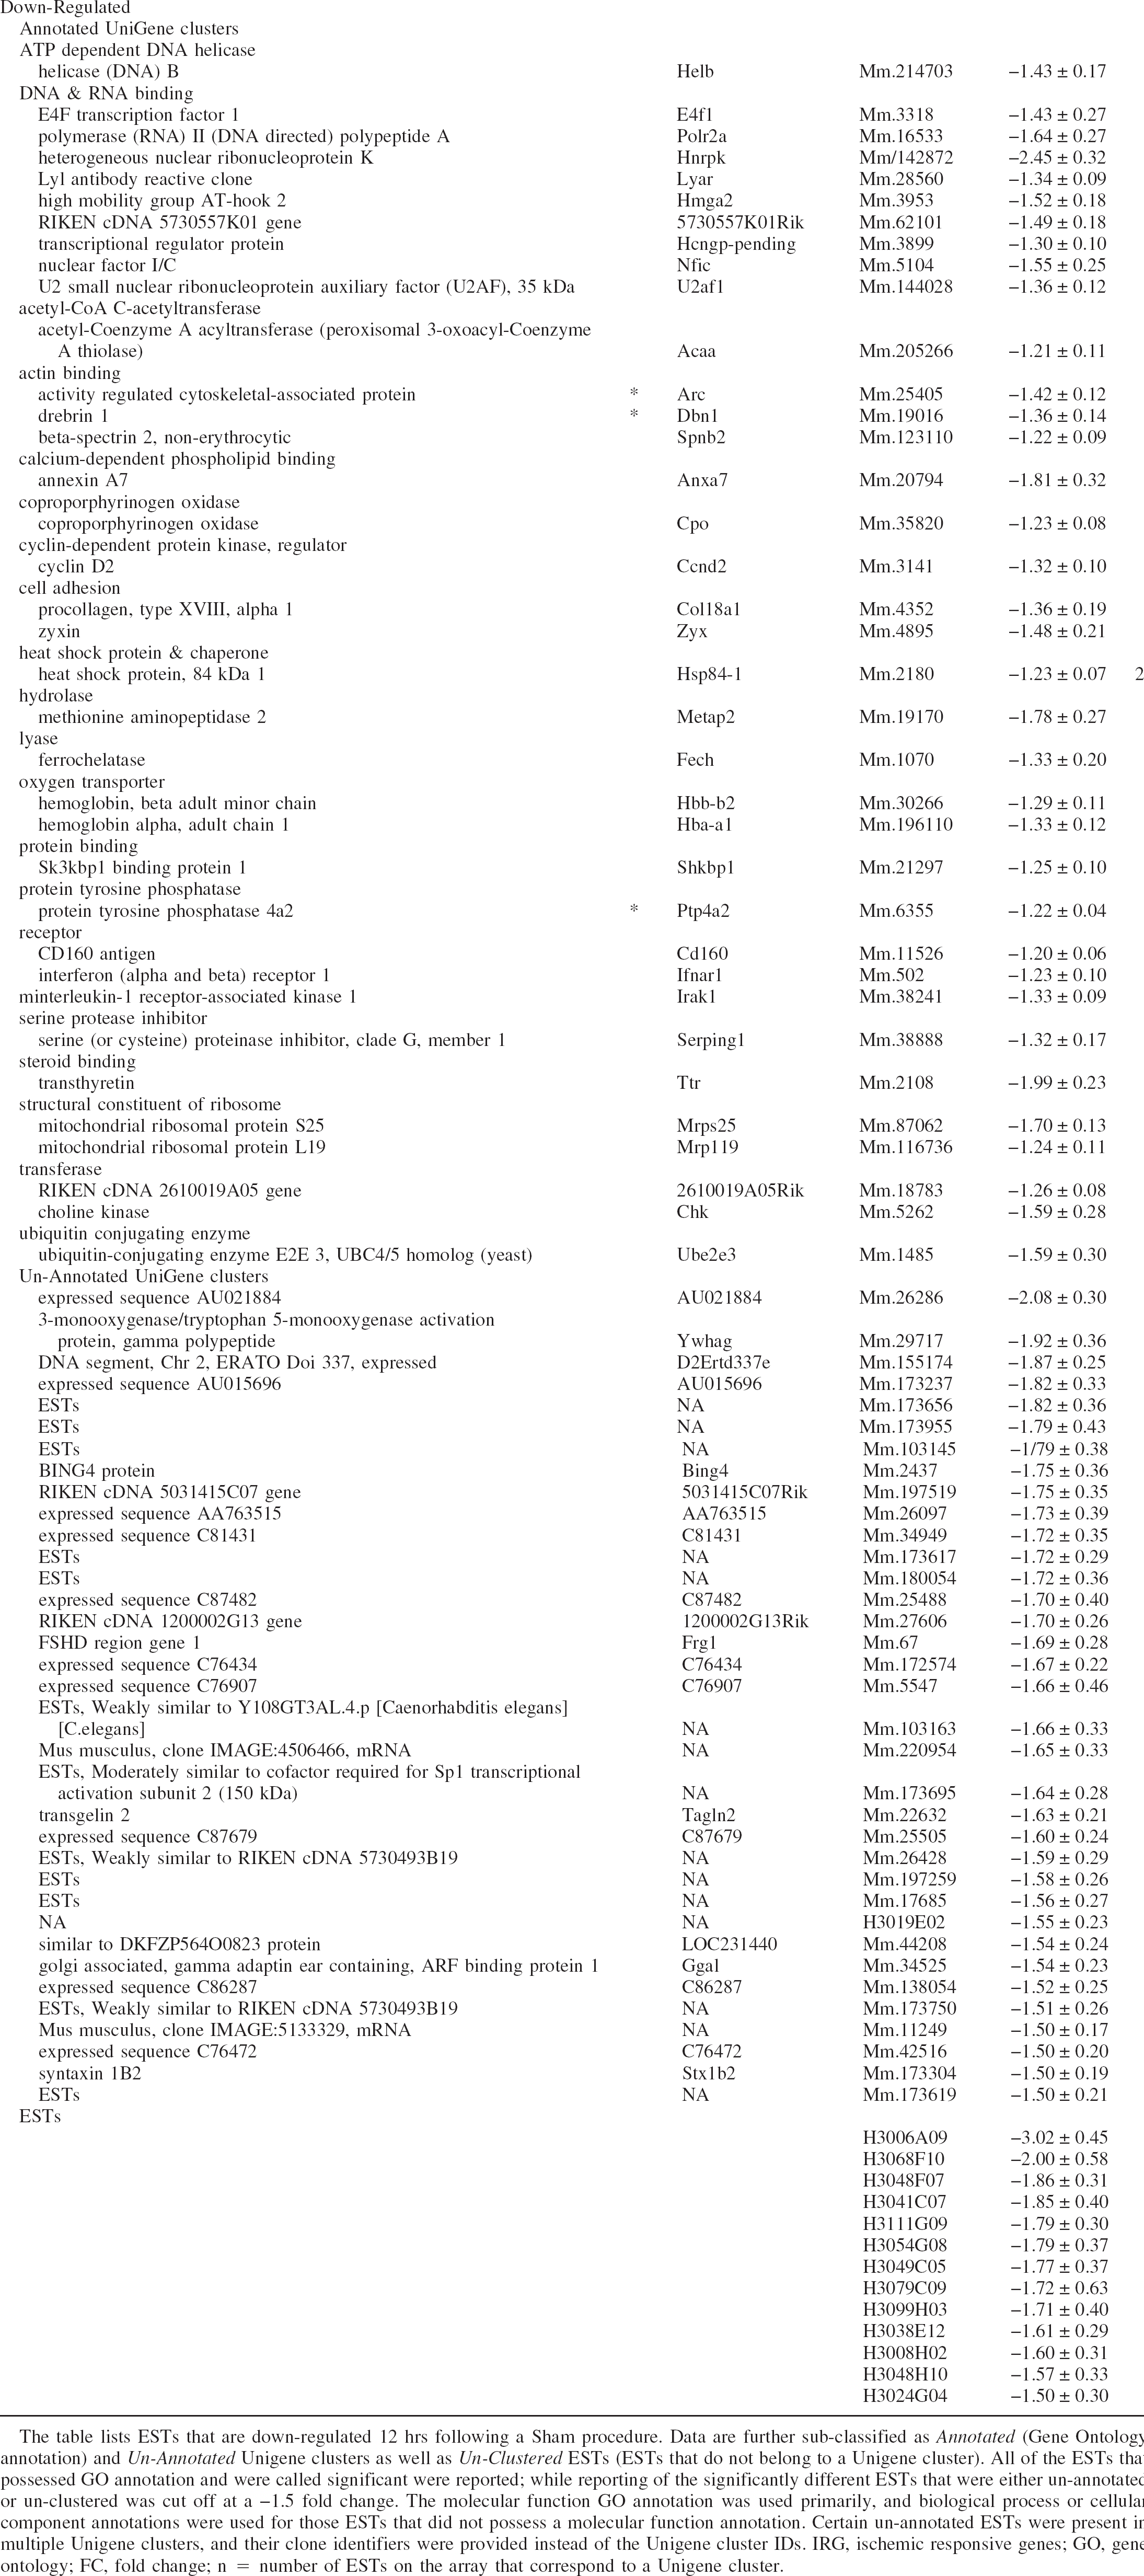
The table lists ESTs that are down-regulated 12 hrs following a Sham procedure. Data are further sub-classified as Annotated (Gene Ontology annotation) and Un-Annotated Unigene clusters as well as Un-Clustered ESTs (ESTs that do not belong to a Unigene cluster). All of the ESTs that possessed GO annotation and were called significant were reported; while reporting of the significantly different ESTs that were either un-annotated or un-clustered was cut off at a −1.5 fold change. The molecular function GO annotation was used primarily, and biological process or cellular component annotations were used for those ESTs that did not possess a molecular function annotation. Certain un-annotated ESTs were present in multiple Unigene clusters, and their clone identifiers were provided instead of the Unigene cluster IDs. IRG, ischemic responsive genes; GO, gene ontology; FC, fold change; n = number of ESTs on the array that correspond to a Unigene cluster.
Functional classification of genes whose expressions are altered following sham treatment
We used gene ontology to classify those genes whose expressions were altered following sham treatment, as described above for the HI. Of the n = 214 downregulated ESTs, a mere 36 genes were annotated. Table 2 lists Sham responsive genes designated into functional groups. Of interest is the fact that n = 4 of these annotated ESTs have been previously implicated in cerebral ischemia. Comprehensive lists of the entire dataset of differentially expressed ESTs classified according to cellular location and biologic process are available in our supplemental data (http://cbmmain.cbr.nrc.ca/costaiw/HI_Stroke.html).
Confirmation of array results by in situ hybridization and immunohistochemistry
In situ hybridization
To confirm alterations in mRNA level observed on the microarrays, genes of Hsp105 and Hsp86 were selected for verification by in situ hybridization. These genes were selected because of their functional importance and dynamic change in HI. The expression pattern of the mRNA from HI treated animals was examined 12 hours after HI. In situ hybridization showed that Hsp105 mRNA was prominently induced in the ipsilateral hippocampus and cortex of HI treated animals and the expression of Hsp86 was increased in the ipsilateral hippocampus. The patterns of induction of these mRNAs in the hippocampus were similar; however, the magnitude of the induction was less prominent for Hsp86 as compared with that of Hsp105 mRNA (Fig. 5). In addition to corroborating the microarray data, the in situ hybridization analysis revealed the distinct spatial distribution patterns of the HSP transcripts. Hsp hybridization signals were evident in the entire pyramidal cell layer (CA1-4 of Ammon's horn and the dentate gyrus).
Verification of the expression of representative genes in hippocampal tissue after HI by in situ hybridization and immunohistochemistry. Autoradiographs showing the pattern of in situ hybridization using probes against Hsp105
Immunohistochemistry
To determine whether the altered levels of mRNA after HI are reflected in protein levels, immunohistochemistry was performed with antibodies directed against HSP105 and HSP86 (Fig. 5). Brain sections were prepared from mice 24 hours after HI, Sh, or naive treatment. The microarray, as well as in situ hybridization, showed that the mRNA for Hsp105 and Hsp86 had increased at the 12-hour time point. Increase in immunoreactivity for both proteins was found in the ipsilateral hippocampus of HI brain and was only weakly expressed on the contralateral side and in brain sections from Sh and naive animals (data not shown). The patterns of immunoreactivities were similar; however, the magnitude of expression was less prominent for HSP86 as compared with that of HSP105. Not all of the known chaperone genes were detected in our samples. Some representatives were eliminated from analysis because they did not meet our threshold criteria for detection. Others like the inducible forms of Hsp70-1 were not represented on the DNA microarray. However, immunohistochemistry for the protein product of the inducible HSP70 did show an intense signal in the entire hippocampus 12 hours after HI (data not shown).
DISCUSSION
DNA microarray technology is being used to study global changes in gene expression in a variety of neurodegenerative disease models and in the evaluation of drug treatments (Chan et al., 2002; Colangelo et al., 2002; Grunblatt et al., 2001; Loring et al., 2001; Pasinetti, 2001; Pasinetti and Ho, 2001; Sipione et al., 2002). These studies provide a better understanding of the pathogenesis of neurodegenerative disease. In the present work, we have used this technique to examine differential gene expression in a model of stroke, the Rice-Vannucci model of Hypoxia-Ischemia. Our objective was to gain insight into the molecular processes that contribute to the pathogenesis following stroke. Understanding the pathways leading to cell death or promoting cell survival will facilitate the development of neuroprotective drugs and strategies.
We chose an adult mouse model for screening ischemia responsive genes because of the suitability for subsequent transgenic manipulation of gene expression. Moreover, compared with rats, the mouse genome is more completely described. A hypoxic ischemic insult of 30 minutes was chosen because this duration is compatible with the successful induction of delayed neuronal death in adult mice (Vannucci et al., 2001). The selection of time points and tissues is crucial (Babity et al., 1997). A time point of 12 hours after HI was chosen for gene expression analysis for the following reasons:
At this time point, significant neuroprotection may still be conferred by intervention. Recent studies have shown that mild protracted hypothermia induced in gerbils 12 hours after severe ischemia provided long-term histologic protection (Colbourne et al., 1999). In this model of cerebral ischemia, hippocampal neuronal death was limited to the medial CA1 with the remainder of the hippocampal formation morphologically normal yet evolving towards infarction.
This study has identified 609 ESTs that were significantly upregulated by HI and 14 ESTs that were significantly downregulated. Of these ESTs, 70 possessed gene ontology annotation and were classified primarily by their molecular function (Tables 1 and 2). Our data demonstrate the complexity of the genomic response that stroke pathology elicits, leading to alterations in the expression of genes associated with a variety of functions. We have followed the example of other investigations and have presented our sets of genes annotated and classified according to molecular function. There already exists a limited literature with lists of identified stroke-associated genes (Read et al., 2001; Schmidt-Kastner et al., 2002). Of interest is the fact that of the 70 annotated genes identified in our study, 18 of these (Hsp105, Hsp86, Sfrs4, cyclin G, Hspa8, Hsp60, Hsp25, Hsp74, Dnaja1, Selp1, Ppia, helicase, Ubc Psma3, Ppef2, Gtpbp4, and Siat1) have been previously identified as hypoxia ischemic responsive (see Table 1), and many of these genes are associated with neuroprotection. These results demonstrate the usefulness of microarray analysis for the identification of differential gene expression in experimental stroke. More interesting, however, is the identification of a group of genes not previously associated with cerebral ischemia, which we refer to as newly connected genes. These genes may represent novel avenues for investigation.
In the following section, we review the findings made for known ischemia hypoxia responsive genes and discuss potential roles for some of the newly connected genes. The most prominent group of genes that were upregulated by HI were the heat shock proteins (Hsps), including Hsp105, Hsp86, Hspa8 (Hsc70), Dnaja1(Hsp40), Hsp60, Hsp25, and Hspa9a (Hsp74). The heat shock proteins are a set of highly conserved proteins that have been classified into several families according to their apparent molecular mass (Hsp105/110, Hsp90, Hsp60, Hsp40, Hsp27, and Hsp10) (Currie and Plumier, 1998). The general increase in expression of Hsp genes shown in this study correlates well with previous findings in cerebral ischemia. The expression of Hsps is regulated developmentally and by environmental and pathophysiologic stressors. Hsps function as molecular chaperones to facilitate the translation and correct folding of nascent proteins. In addition, various Hsps have now been associated with protection against apoptotic cell death (Beere and Green, 2001; Beere et al., 2000; Bruey et al., 2000; Buzzard et al., 1998; Hatayama et al., 2001; Kumagai et al., 2000; Mehlen et al., 1996; Mosser et al., 1997; Samali and Cotter, 1996; Sato et al., 2000; Stuart et al., 1998).
The Hsp70 family comprises seven members in the mouse with both constitutive forms, such as the 70kDa HS cognate (Hsc70 or Hspa8), and inducible forms (Hsp70). Of the HSPs induced by cerebral ischemia, Hsp70 is by far the most prominent. The 15K mouse microarray used in this study did not include ESTs representative of the inducible Hsp70. However, immunohistochemistry demonstrated the expression of Hsp70 in the ipsilateral HI brain 24 hours after HI (data not shown).
Hsc70 is constitutively expressed and is the most abundant Hsp expressed in unstressed cells (Welch, 1992). Several studies have shown the induction of hsc70 mRNA after cerebral ischemia (Aoki et al., 1993; Majda et al., 2001; Tanaka et al., 2002), and it has been suggested that increased expression of Hsc70 may contribute to the neuroprotection afforded by ischemic preconditioning (Chen and Simon, 1997). It is interesting to note that Hsc70 may interact with BAG-1 (a Bcl-2 binding protein that promotes cell survival) (Stuart et al., 1998) to regulate apoptosis.
Murine Hsp105 is highly expressed in central neurons (Hylander et al., 2000; Matsumori et al., 2002), and the mRNA is induced in both the rat transient forebrain (Schmidt-Kastner et al., 2002; Xue et al., 1998; Yagita et al., 2001) and global models of ischemia (Majda et al., 2001; Yokota et al., 2001). Whereas the precise role of Hsp105 in cerebral ischemia is unknown, it may be acting in the brain in a manner similar to the testis where it binds and stabilizes p53, preventing the induction of apoptosis by p53 (Kumagai et al., 2000).
In the present study, the induction of Hsp86 was demonstrated by the differential expression of seven distinct ESTs. Hsp86 is a mammalian cytosolic member of the Hsp90 family. Hsp90 is represented by two cytosolic isoforms (Hsp84 and Hsp86) and plays an important role in refolding certain denatured proteins under stress conditions (Moore et al., 1989; Sato et al., 2000). Studies have demonstrated the induction of Hsp90 in global but not focal models of cerebral ischemia (Kawagoe et al., 1993; Majda et al., 2001; Wagstaff et al., 1996). A role for Hsp90 in regulating the antiapoptotic activity of Akt kinase has been proposed (Sato et al., 2000).
Hsp60 is also induced in both global (Jin et al., 2001) and focal models of cerebral ischemia (Izaki et al., 2001; Okubo et al., 2000; Wagstaff et al., 1996). Hsp60 is a mitochondrial matrix protein that is induced by stress. Together with its cochaperone Hsp10, it forms a chaperonin complex that folds mitochondrial proteins and regulates function (Itoh et al., 1995). Whereas a neuroprotective role for HSP60 against cerebral ischemia has not been described, cultured cardiomyocytes infected with an adenoviral construct over-expressing both HSP60 and HSP10 are protected against ischemia/reperfusion insults (Lau et al., 1997). Hsp10 was also not represented on the 15K mouse microarray.
In this study, the expression of Hsp40 is increased. The induction of Hsp40 mRNA has also been demonstrated after focal transient cerebral ischemia (Paschen et al., 1998; Tamura et al., 2003; Tanaka et al., 2002). Hsp40 has been shown to interact with and regulate the ATPase activity of Hsp70 (Naylor et al., 1998) and Hsp70-Hsp40 chaperone pairs have been shown to prevent nitric oxide-mediated apoptosis in macrophages (Gotoh et al., 2001). Interestingly, a rise in Hsp40 mRNA levels may facilitate the onset of neuroprotective processes following cerebral ischemia.
One final differentially expressed Hsp, in response to HI, is Hsp74. This Hsp is poorly characterized and has yet to be linked to molecular biologic functions or with cerebral ischemia.
The preceding discussion demonstrates the usefulness of DNA microarray technology as an approach for generating hypotheses regarding molecular pathways associated with cerebral ischemia. We focused our discussion on molecular chaperones because of their prominence in the dataset; however, this family of genes represents only one of many that we could have chosen (see Table 1). We describe for the first time here the most comprehensive description of molecular chaperone gene regulation for any model of cerebral ischemia (see Fig. 4). We have evaluated, in parallel, the differential gene expression of 32 molecular chaperone genes and shown that 7 of these were significantly upregulated, while 25 remained unchanged at a critical time point in stroke pathology. Descriptions of patterns of gene expression at time points surrounding 12 hours post-HI will provide further information essential to the development of practical treatment strategies for stroke.
Another benefit of DNA microarray analysis lies in the identification of novel ischemia related genes. Many of the genes identified in this analysis have not been previously associated with cerebral ischemia. Based upon a survey of the existing literature some of the genes with potential relevance to brain disease might include Cdkn2c, S100a9, and Irak1. Cdkn2c is a cyclin-dependent kinase inhibitor with putative tumor suppressor actions in multiple myeloma cells. Induction of this gene has been associated with apoptosis (Kulkarni et al., 2002). In our HI model, this gene is downregulated, indicating a potential attempt to counteract apoptosis. While a putative function for S100a9 (calcium binding protein A9) remain to be established, increased expression of S100B, a glial derived protein, is well-documented in the stroke literature (Jonsson et al., 2001). Interestingly, the induction of this gene has also recently been shown with cDNA microarray technology in a rat focal model of brain ischemia (Schmidt-Kastner et al., 2002).
In this study, we also show significant changes in gene expression caused by surgical and anesthetic procedures (Table 2). Several aspects regarding the data presented here deserve further comment. First, the magnitude of the changes observed is considerably smaller in comparison with the changes observed in HI. This indicates that the sham procedure is not associated with large-scale, generalized alterations in gene expression. Second, it is of interest that none of the ESTs measured exhibited increases in expression. This may be related to a decreased metabolic rate during anesthesia or effects of the anesthetic on membrane fluidity. We accounted for any confounding variables that this generalized inhibition of gene expression might have caused by analyzing the HI/Nv dataset. Third, our analysis indicated that very few of the significantly altered ESTs in the HI datasets were significantly affected by Sham as well (Fig. 2 and Fig. 3). Therefore, we are confident that the observed effects of HI were not artifacts associated with the sham procedure and were truly related to HI. Our analysis revealed the differential expression of 37 annotated ESTs, 3 of which have previously been associated with cerebral ischemia. These genes include Arc, Dbn1, and Ptp4a2. Our observation that Arc was decreased because of sham may indicate that the reported increase in Arc expression (Soriano et al., 2000) may at least partly be caused by the effect of the surgical procedure. These findings demonstrate the influence of sham procedures on gene expression, underscoring the importance of complications associated with animal models of human disease.
Validation of microarray data
The reliability of our DNA microarray results is demonstrated through the following observations:
Subsets of differentially expressed genes (i.e., Irak1, Hsp86, Hsp105, Hspa8, and Ppia) were confirmed through the concurrent expressions of multiple ESTs for the same genes. Many of the differentially expressed genes have been previously shown to be ischemia hypoxia responsive in other models of cerebral ischemia. The differentially expressed ESTs that we chose to study further (Hsp105 and Hsp86) were confirmed to be regulated by in situ hybridization and through the expression of the gene-related proteins (immunohistochemistry).
The limitations of this study are as follows:
It is the protein expression in cells that would mediate the pathogenesis following cerebral ischemia, and increased transcription does not always imply increased protein synthesis. The entire mouse genome has not been surveyed here, and estimates suggest this 15K mouse array may in fact represent approximately 7,500 genes (Kargul et al., 2001). The experimental paradigm used has limitations. Tissue collected during the hippocampal extraction contains a mixed population of cells, including neurons, astrocytes, vasculature epithelial cells, blood cells, and immune system cells.
In conclusion, this study demonstrates that many genes are differentially expressed at the 12-hour time point after HI. The fact that many of these genes have previously been identified in models of stroke lends support both to the validity of this study and to previous findings that have used standard techniques (Read et al., 2001). In addition, we have shown changes in the expression levels of numerous genes that have not been previously associated with ischemia-responsive genes. Further studies are necessary to characterize these genes and to identify their functions.
Footnotes
Acknowledgment
We thank Keir Dabourne, Lisa Coolen, Brenda Ross, Kay Murphy and Natalie Earl for their technical assistance.