
Abstract
Stroke produces a region of complete cell death and areas of partial damage, injury, and gliosis. The spatial relationship of these regions of damage to the infarct core and within spared neuronal circuits has not been identified. A model of cortical stroke was developed within functional subsets of the somatosensory cortex. Infarct size, regions of apoptosis, oxidative DNA damage, heat shock protein induction, and subtypes of reactive gliosis were precisely mapped with the somatosensory body map, quantified, and interrelated. Three tissue microenvironments were recognized: zones of partial ischemic damage, heat shock protein induction, and distributed gliosis. These three zones involved progressively more distant cortical regions, each larger than the infarct core. The zone of partial ischemic damage represents an overlap region of apoptotic cell death, oxidative DNA damage, loss of synaptic connections, and local reactive gliosis. The zone of distributed gliosis occupies distinct functional areas of the somatosensory cortex. The tissue reorganization induced by stroke is much larger than the stroke site itself. Adjacent tissue microenvironments are sites of distinct reactive cellular signaling and may serve as a link between the processes of acute cell death and delayed neuronal plasticity after focal stroke.
Focal stroke produces an area of complete cell loss and adjacent regions of partial cell death, injury, and tissue reorganization. These adjacent regions are characterized by apoptosis (Benchoua et al., 2000; Lipton, 1999; Namura et al., 1998), heat shock protein induction (Sharp et al., 2000), reperfusion injury (Chen et al., 1996; Nagayama et al., 2000), and gliosis (Li and Chopp, 1999; Schroeter et al., 1995; Witte et al., 2000). Although these mechanisms of injury have been described in periinfarct tissue (Chen et al., 1996; Namura et al., 1998; Sharp et al., 2000), their precise location and interrelationship have not been determined.
Precise definition of the regions of partial ischemic damage adjacent to stroke is important because this is the area in which poststroke neuronal plasticity and tissue reorganization is induced. Enhanced cellular excitability (Witte et al., 2000), plasticity in sensory and motor maps (Nudo et al., 1997; Xerri et al., 1998), axonal sprouting (Carmichael and Chesselet, 2002; Carmichael et al., 2001; Kawamata et al., 1997; Stroemer et al., 1995), and stem cell or neuronal precursor differentiation (Arvindsson et al., 2002; Parent et al., 2002) occur in tissue adjacent to the infarct, within specific cortical circuits (Carmichael and Chesselet, 2002; Carmichael et al., 2001). An understanding of the precise topography of partial ischemic damage in the regions adjacent to the infarct will begin to define the links between ischemic cell death and the processes of neuronal plasticity and repair.
Most current stroke models generate large infarcts that destroy much of the forebrain or ipsilateral cortex (Chen et al., 1986; Ginsberg and Buston, 1989; Longa et al., 1989; Yanamato et al., 1998). To better define the process of partial tissue damage and incomplete injury in specific circuits after stroke, we have modified a stroke model (Chen et al., 1986) to produce infarction within functionally defined regions of the rat primary somatosensory area. We have precisely mapped regions of partial tissue damage and reactive gliosis in this model in relation to specific regions within the somatosensory cortex. Our data show that oxidative DNA damage, apoptotic cell death, and heat shock protein induction occur within overlapping regions in periinfarct tissue, and that nestin and vimentin expression identify distributed subsets of reactive astrocytes within specific areas of the somatosensory cortex.
MATERIALS AND METHODS
Animal model
All procedures were performed in accordance with National Institutes of Health Animal Protection Guidelines and were approved by the UCLA Animal Research Committee. Adult male Sprague-Dawley rats (250–400 g) were anesthetized with 2% isoflurane in 2:1 N2O:O2. Rectal temperature was kept at 37° ± 0.5°C with a heating blanket and external heating lamps. The middle cerebral artery (MCA) was exposed through a craniotomy midway between the orbit and external auditory meatus (Chen et al., 1986). An anterior branch of the MCA (Cox et al., 1993) was cauterized with a small, 100-μm-diameter heater probe and then transected with a 30-gauge needle. The scalp was closed and both common carotid arteries exposed via a midline neck incision. These were clamped with microvascular clips and the animal was allowed to recover. After 1 hour, the animals were reanesthetized and the clips were removed. Control animals received craniotomy and exposure of the MCA, but the heater probe was placed on the dura caudal to the MCA. Physiologic monitoring was performed in a separate cohort of control and stroke animals (n = 5 for each group). The femoral artery was cannulated with polyethylene tubing and mean arterial blood pressure (MAP) was continuously monitored (Micro-Med, Louisville, KY, U.S.A.). At the end of the procedure, Paco2, Pao2, pH (Model 238 pH/Blood Gas Analyzer, Ciba-Corning, Acton, MA, U.S.A.) and glucose (Infinity Glucose Reagent, Sigma Diagnostics, St. Louis, MO, U.S.A.) levels were analyzed from arterial samples. Temporalis muscle (IT-21 thermocouple, Physitemp Instruments, Clifton, NJ, U.S.A.) and rectal temperature were monitored. Direct monitoring of brain temperature involves focal brain trauma and secondary injury. Temporalis muscle temperature correlates with brain temperature and is frequently used as a surrogate for brain temperature (Kazan et al., 1999; Liu et al., 2001; Minamaisawa et al., 1990; Onesti et al., 1991; Yanamoto et al., 1998). Under the experimental conditions of heating the animal using both an external light source and a heating blanket, temporalis and rectal temperature were kept at 37° ± 0.5°C (Kazan et al., 1999; Yanamoto et al., 1998). Animals were not fasted before surgery.
Measures of cell death and damage
Cohorts of stroke and control animals survived for 30 minutes, 12 hours, and 1, 3, and 5 days (n = 5 in stroke and control groups). These time points span the maximal extent of apoptotic cell death, oxidative DNA damage and HSP70 induction in other stroke models (Cui et al., 1999; Namura et al., 1998; Lipton, 1999; Moore et al., 2002; States et al., 1996). Animals were deeply anesthetized with Equithesin (1.0 mL/300 g) and perfused through the heart with phosphate-buffered saline, followed by 4% paraformaldehyde. The brains were removed, postfixed for 2 hours in 4% paraformaldehyde, cryoprotected for 2 days in 30% sucrose, frozen, and sectioned in a cryostat at 50 μm. Adjacent series were cut and processed for cresyl violet staining and for immunohistochemistry for the apoptosis markers activated caspase-3 and caspase cleaved actin (fractin); the oxidative DNA damage marker 8-hydroxy-deoxyguanosine (8OHdG) and heat shock protein 70 (HSP70). A series in each animal was also processed for terminal deoxynucleotidyl transferase-mediated 2′-deoxyuridine 5′-triphosphate-biotin nick end labeling (TUNEL) and stained with cresyl violet. To determine overall stroke size, stroke was induced in an additional cohort of animals (n = 5), which were allowed to survive for 7 days. The tissue was processed as described above and stained for microtubule-associated protein 2 (MAP2) and cytochrome oxidase (CO).
Activated caspase-3 is both a key mediator and an end product of the caspase cascade in ischemic apoptotic cell death (Dirnagl et al., 1999; Namura et al., 1998). The antibody used is specific for the cleaved form of caspase-3 and recognizes cells undergoing apoptotic death (Bezzi et al., 2001; Heins et al., 2001). Fractin is a monoclonal antibody directed against an epitope of caspase-cleaved actin not present in the endogenous actin molecule (Yang et al., 1999). Fractin staining is specific for cells undergoing apoptotic cell death (Jackson-Lewis et al., 2000; Oo et al., 2002; Yang et al., 1998). In addition to these two markers of protein cleavage in apoptosis, TUNEL has been traditionally utilized to stain for apoptotic DNA damage. Because TUNEL staining may also recognize necrotic DNA damage (Lipton, 1999), it has been incorporated as one of three measures of apoptotic cell death, to be compared to the end products of caspase action. The level of 8OHdG is widely accepted as a marker of oxidative DNA damage (Fraga et al., 1990) as measured in tissue pre-treated with RNAse to destroy 8-hydroxyguanosine in RNA (Cui et al., 1999; Nunomura et al., 1999). HSP70 is the major inducible heat shock protein and specifically recognizes a population of injured but surviving neurons adjacent to the infarct core (Sharp et al., 2000). After focal ischemia, infarct size is complete by 7 days and MAP2 staining provides an accurate view of the infarct core (Lipton, 1999). CO staining, as a mitochondrial stain similar to TTC (2,3,5-triphenyltetrazolium chloride, Bederson et al., 1986), also visualizes the infarct core. A region of diminished CO staining also identifies partial ischemic damage adjacent to the core (Carmichael et al., 2001). CO staining was performed as previously described (Carmichael et al., 2001).
Indicators of astrocytosis
Vimentin and nestin are developmentally regulated cytoskeletal proteins that are reexpressed specifically in reactive astrocytes after focal ischemia (Li and Chopp, 1999; Lin et al., 1995; Schroeter et al., 1995). To map the distribution of reactive astrocytosis in this model, control and stroke animals were allowed to survive 7, 10, and 14 days (n = 5 for each group) and then processed for immunohistochemical staining of vimentin and nestin (see below). These time points span the astrocytic reaction after focal ischemia (Li and Chopp, 1999; Lin et al., 1995; Ridet et al., 1997; Schroeter et al., 1995). Anesthesia, perfusion, and tissue processing were performed as described previously. Vimentin and nestin expression has been identified exclusively in astrocytes after stroke or brain injury (Brook et al., 1999; Calvo et al., 1991; Clarke et al., 1994; Eliasson et al., 1999; Lin et al., 1995; Ridet et al., 1997; Schroeter et al., 1995). Nestin and vimentin staining were identified in astrocytes in this material based on morphologic features: small, highly ramified cells located in cortex or white matter adjacent to the infarct (Berry et al., 2002).
Immunohistochemistry
Immunohistochemical staining was performed with the ABC method (Vectastain Elite kit, Vector Laboratories, Burlingame, CA, U.S.A.) according to the manufacturer's protocol with diamino benzidine (Sigma-Aldrich, St. Louis, MO, U.S.A.) as the chromogen, with the following modifications. Primary antibodies were used at the following dilutions: anti–activated caspase-3 (1:300; Promega, Madison, WI, U.S.A.), fractin (1:250; BD Biosciences, San Diego, CA, U.S.A.), anti-HSP70 (1:4000; Stressgen, Victoria, BC, Canada), anti-nestin (1:5000, BD Biosciences), anti-vimentin (1:500, Chemicon, Temecula, CA, U.S.A.), anti-MAP2 (1:800; Chemicon). Primary antibodies were incubated for 48 to 72 hours at 4°C. Secondary antibodies were biotinylated donkey F(ab)2 fragments (1:200, Jackson Immunoresearch, West Grove, PA, U.S.A.) against mouse (for vimentin, nestin, 8OHdG, MAP2, HSP70) or rabbit (for fractin, activated caspase-3) immunoglobulin G. Primary and secondary antibodies were diluted in 2% normal donkey serum (Chemicon) and 0.1% Triton X-100 (Sigma). After staining, sections were mounted, dehydrated in alcohol, defatted in xylene, and coverslipped.
For 8OHdG immunohistochemistry, free-floating sections were pretreated with 0.5% Triton and placed in 1:1 ethanol:acetic acid at −20°C to allow antibody penetration to the nucleus (modified from TUNEL staining kit for free-floating sections, Intergen). Sections were then processed as above. The 8OHdG antibody (1:250, QED Biosciences, San Diego, CA, U.S.A.) also recognizes 8OHG in RNA (Cui et al., 1999; Nunomura et al., 1999). To eliminate RNA staining, sections were pretreated with RNAse A (5 μg/μL, Sigma). In initial experiments, test sections were processed without RNAse pre treatment and with RNAse and DNAse pretreatment. Leaving out RNAse results in substantial cellular staining throughout the ischemic hemisphere, representing a signal for 8-hydroxylation of guanine residues in both RNA and DNA (Cui et al., 1999; Nunomura et al., 1999). RNAse and DNAse pretreatment eliminated any specific staining. TUNEL staining (Apoptag, Serologicals Corp., Norcross, GA, U.S.A.) was performed according to the manufacturer's guidelines for free-floating sections.
Analysis
The distribution of labeled cells, or diminished CO staining, was plotted in every section through the infarct with a digitizing microscope plotting system (Leica DMLB microscope with a CCD camera and motorized stage interfaced with a PC and StereoInvestigator software, MicroBrightfield). These plots have an in-plane resolution of 12 μm and were used to quantitatively determine the distance of the measures of cell death, damage, and injury in relation to the infarct. From these plots, reconstructions of the extent of cell labeling for each marker in each experimental case were made onto a composite flattened hemisphere to identify the zones of cell death, injury, and gliosis (Figs. 1E and 7). To measure infarct size, the area of absent CO and MAP2 staining was measured in serial coronal sections separated by 340 μm. The area of the stroke in each section containing an infarct was multiplied by the distance between sections and added together to give infarct volume. To control for possible brain edema in the infarct hemisphere, infarct volumes were corrected for total hemisphere size according to the following formula: corrected infarct size = infarct hemisphere volume − (noninfarct hemisphere volume − stroke volume). To determine the cortical location of cellular labeling, the cytoarchitectonic area of cell labeling in each stain was compared against adjacent sections stained for cresyl violet.
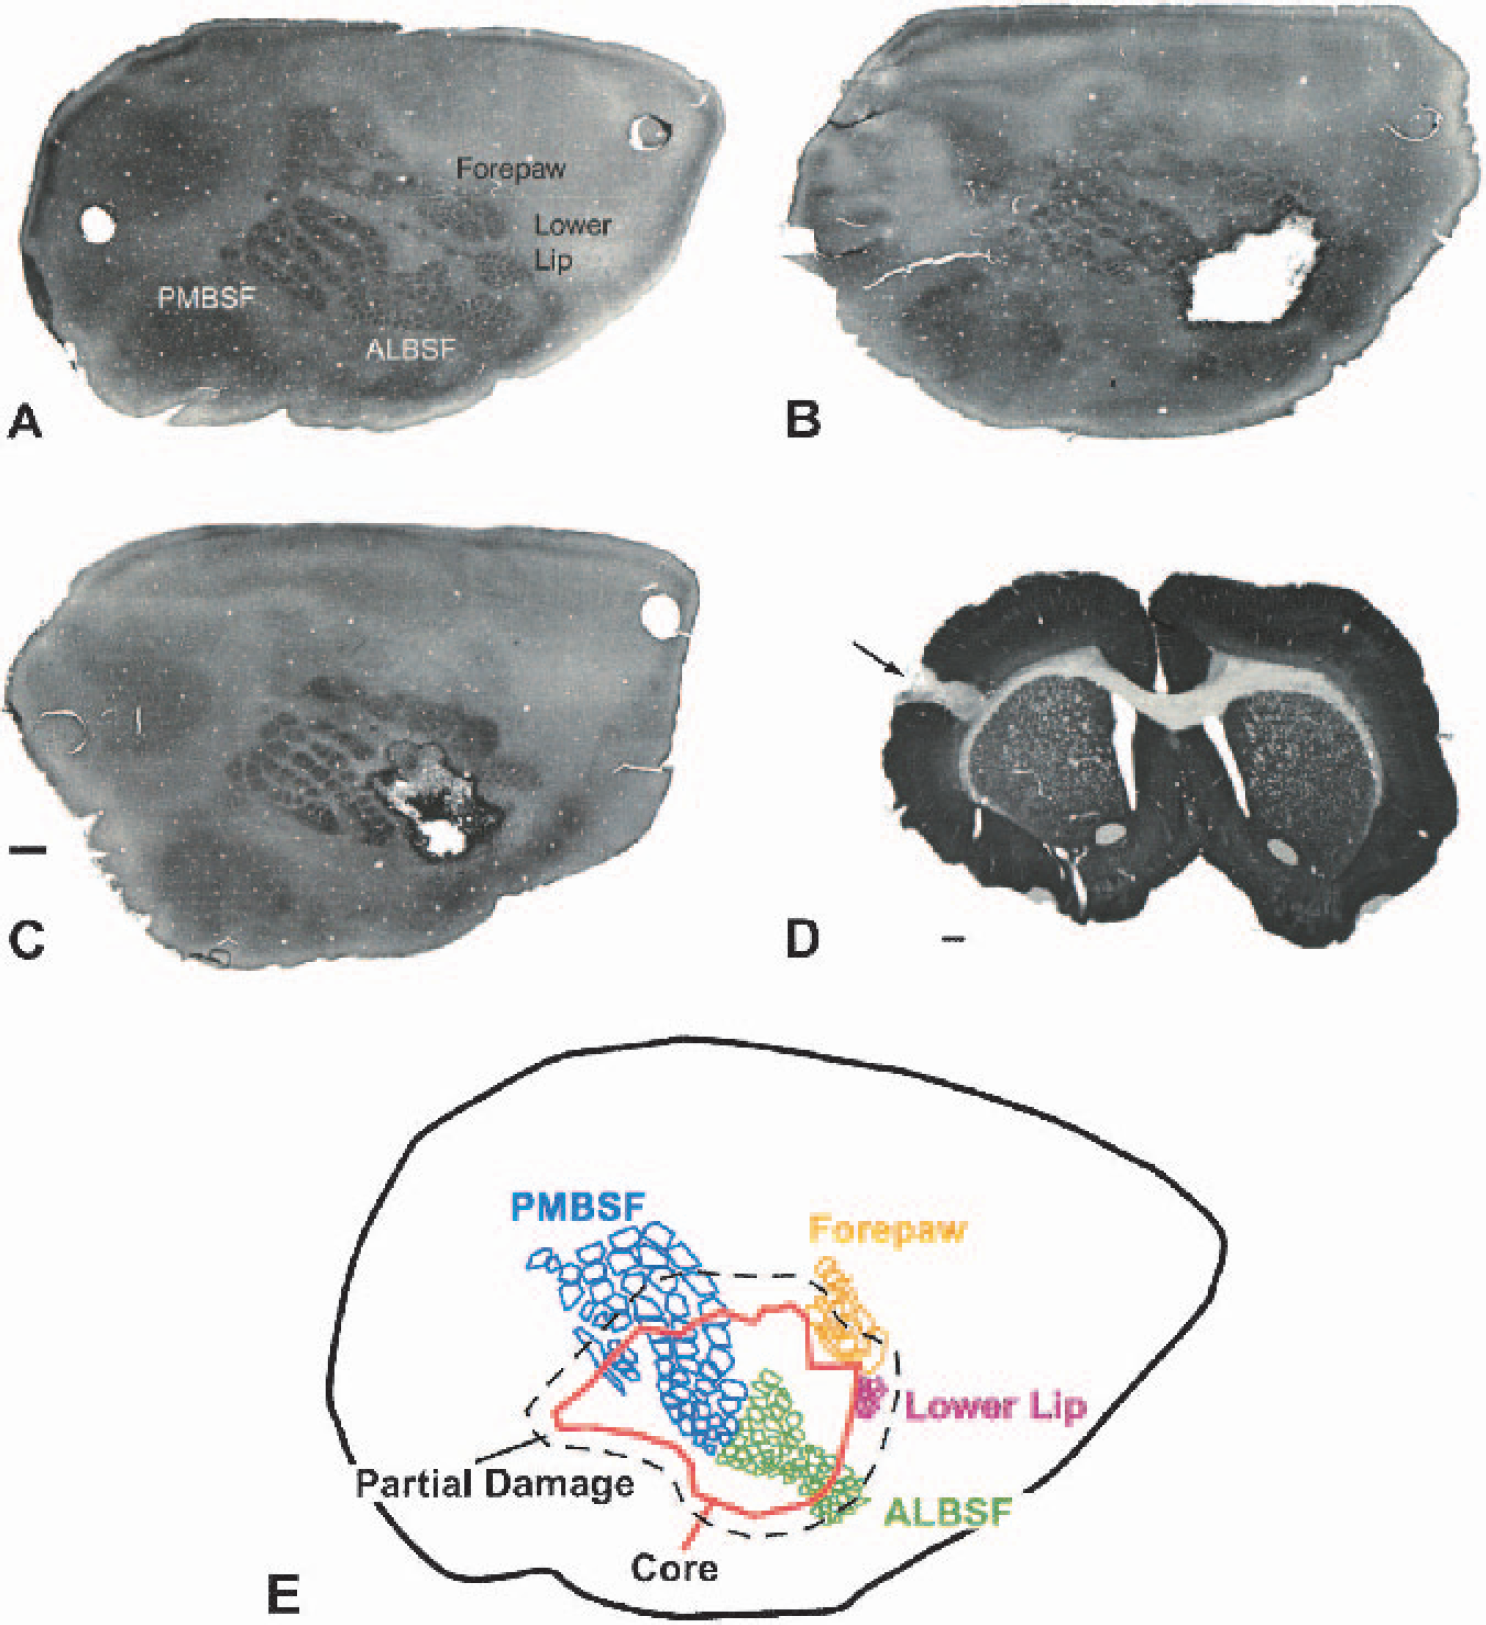
Focal cortical stroke in somatosensory cortex.
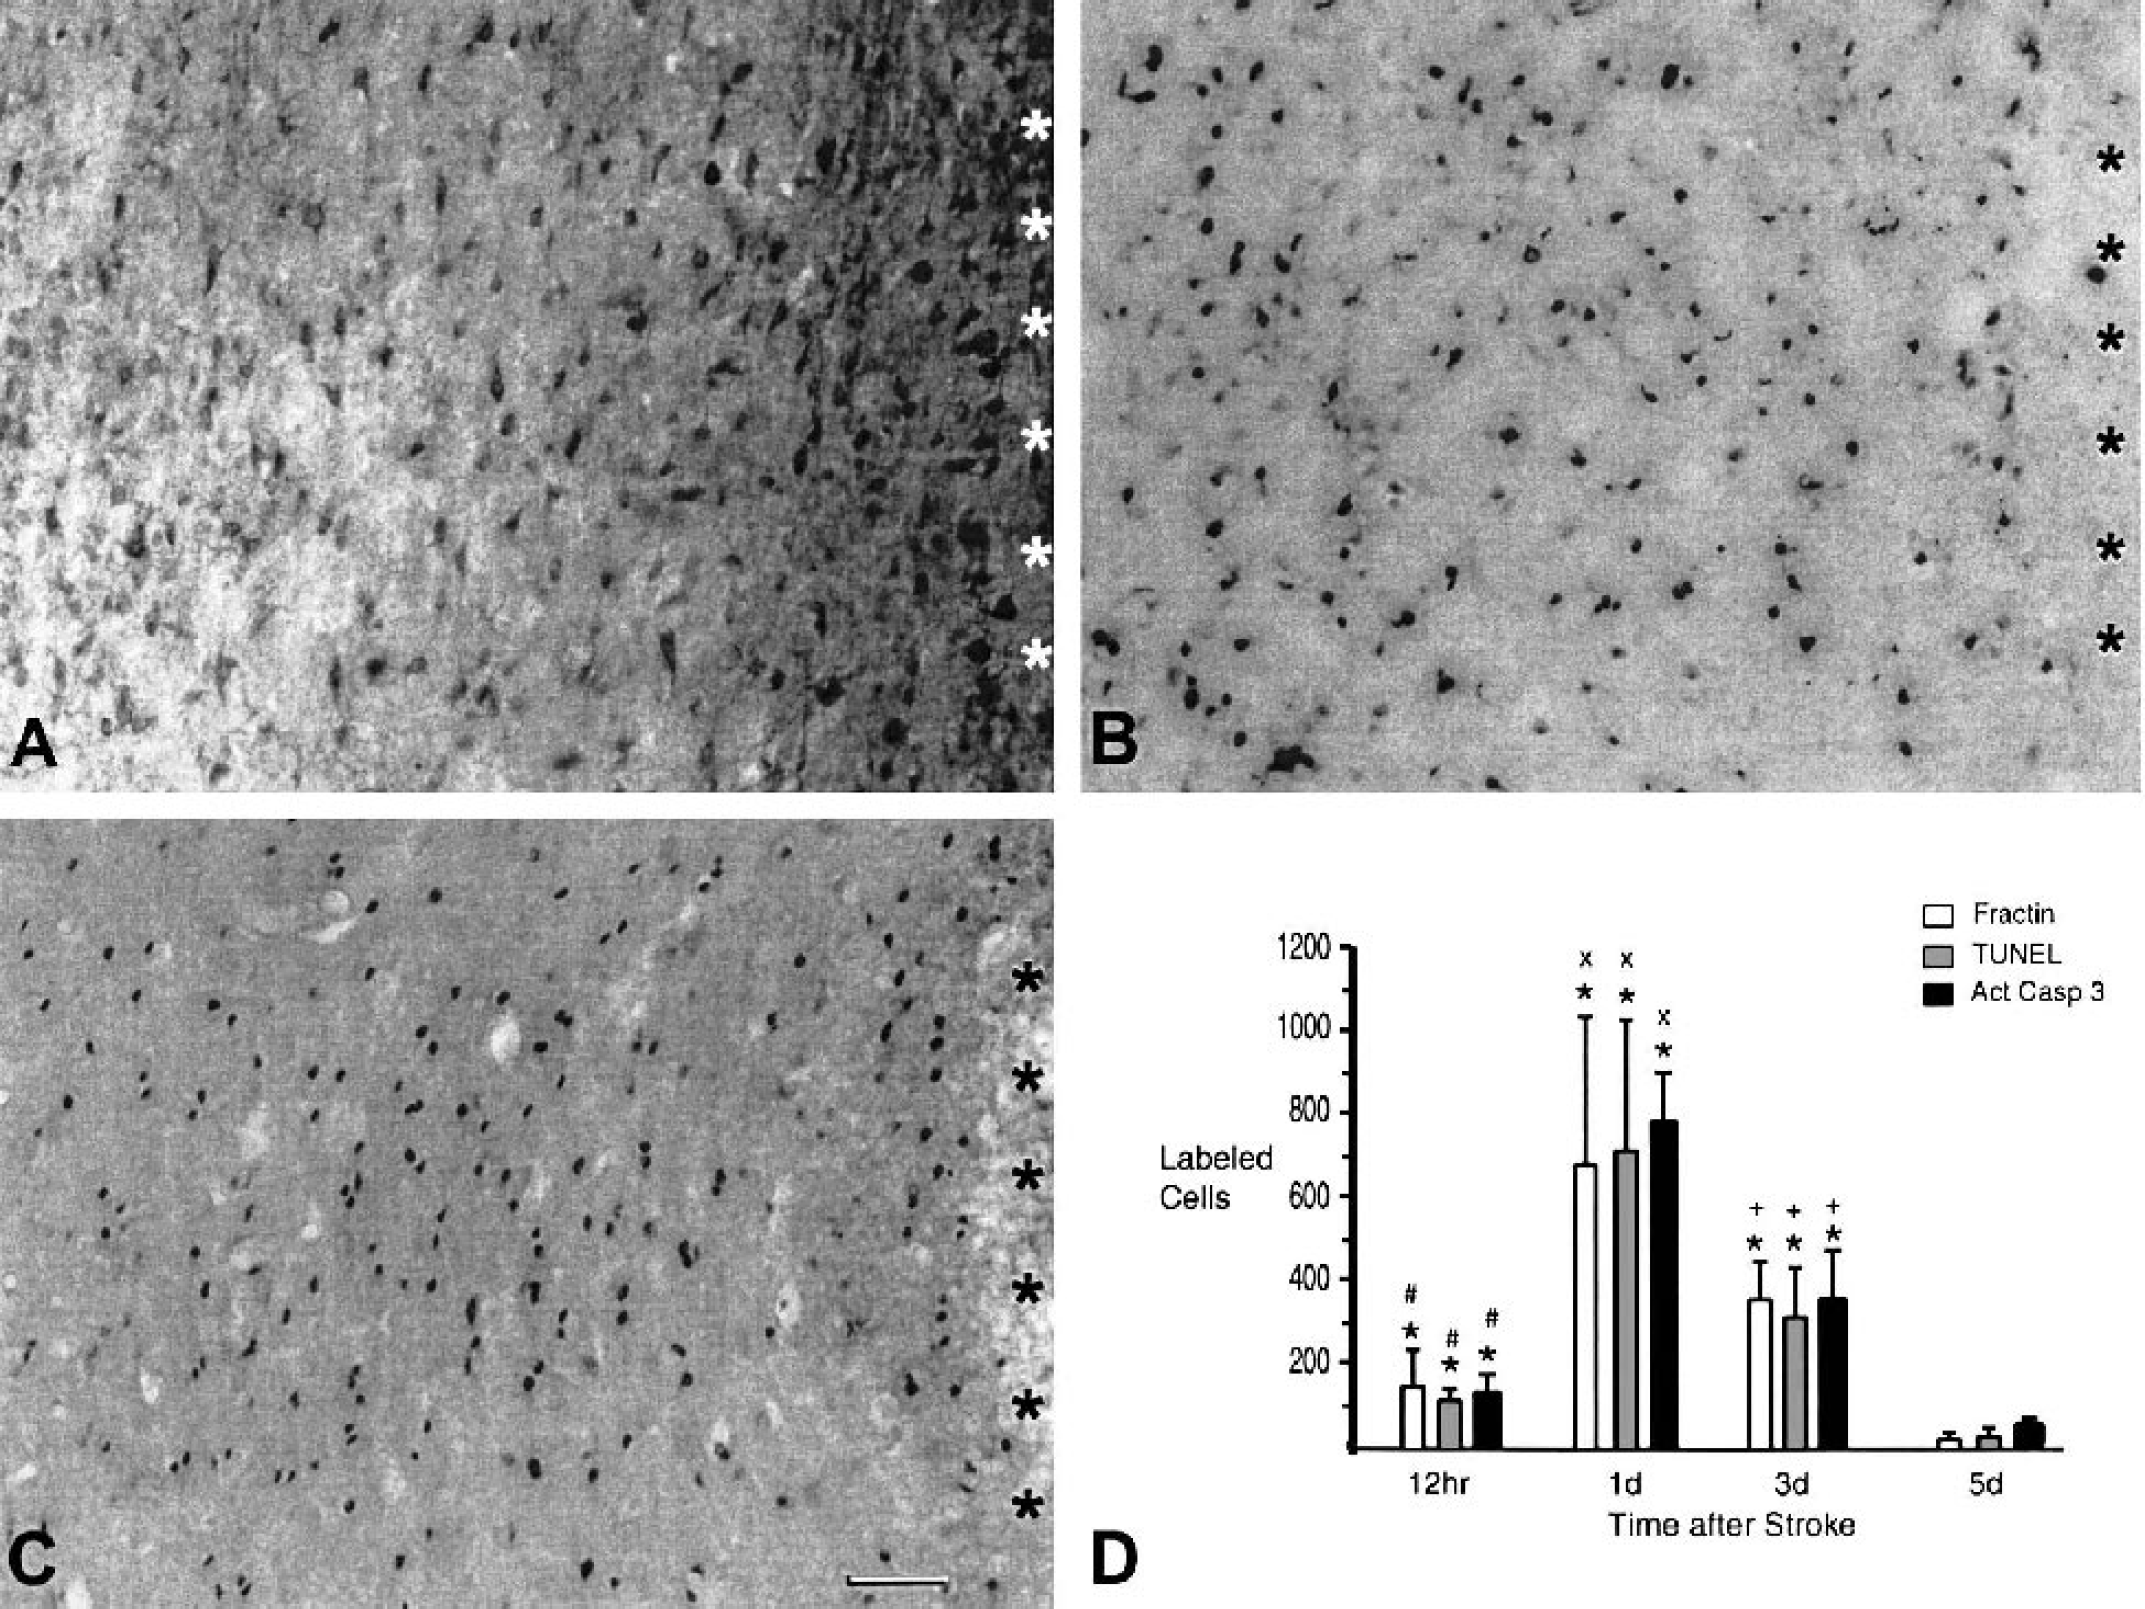
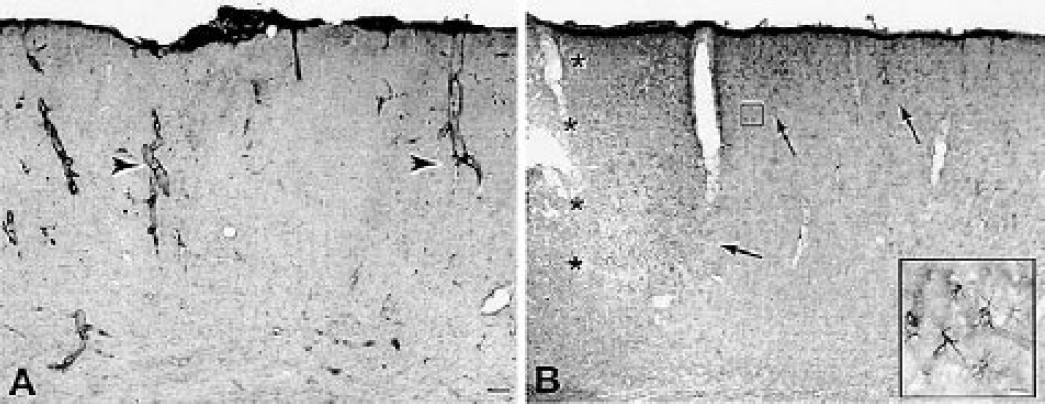
Apoptotic cell death in periinfarct cortex. Coronal sections from 1 day after stroke stained for fractin
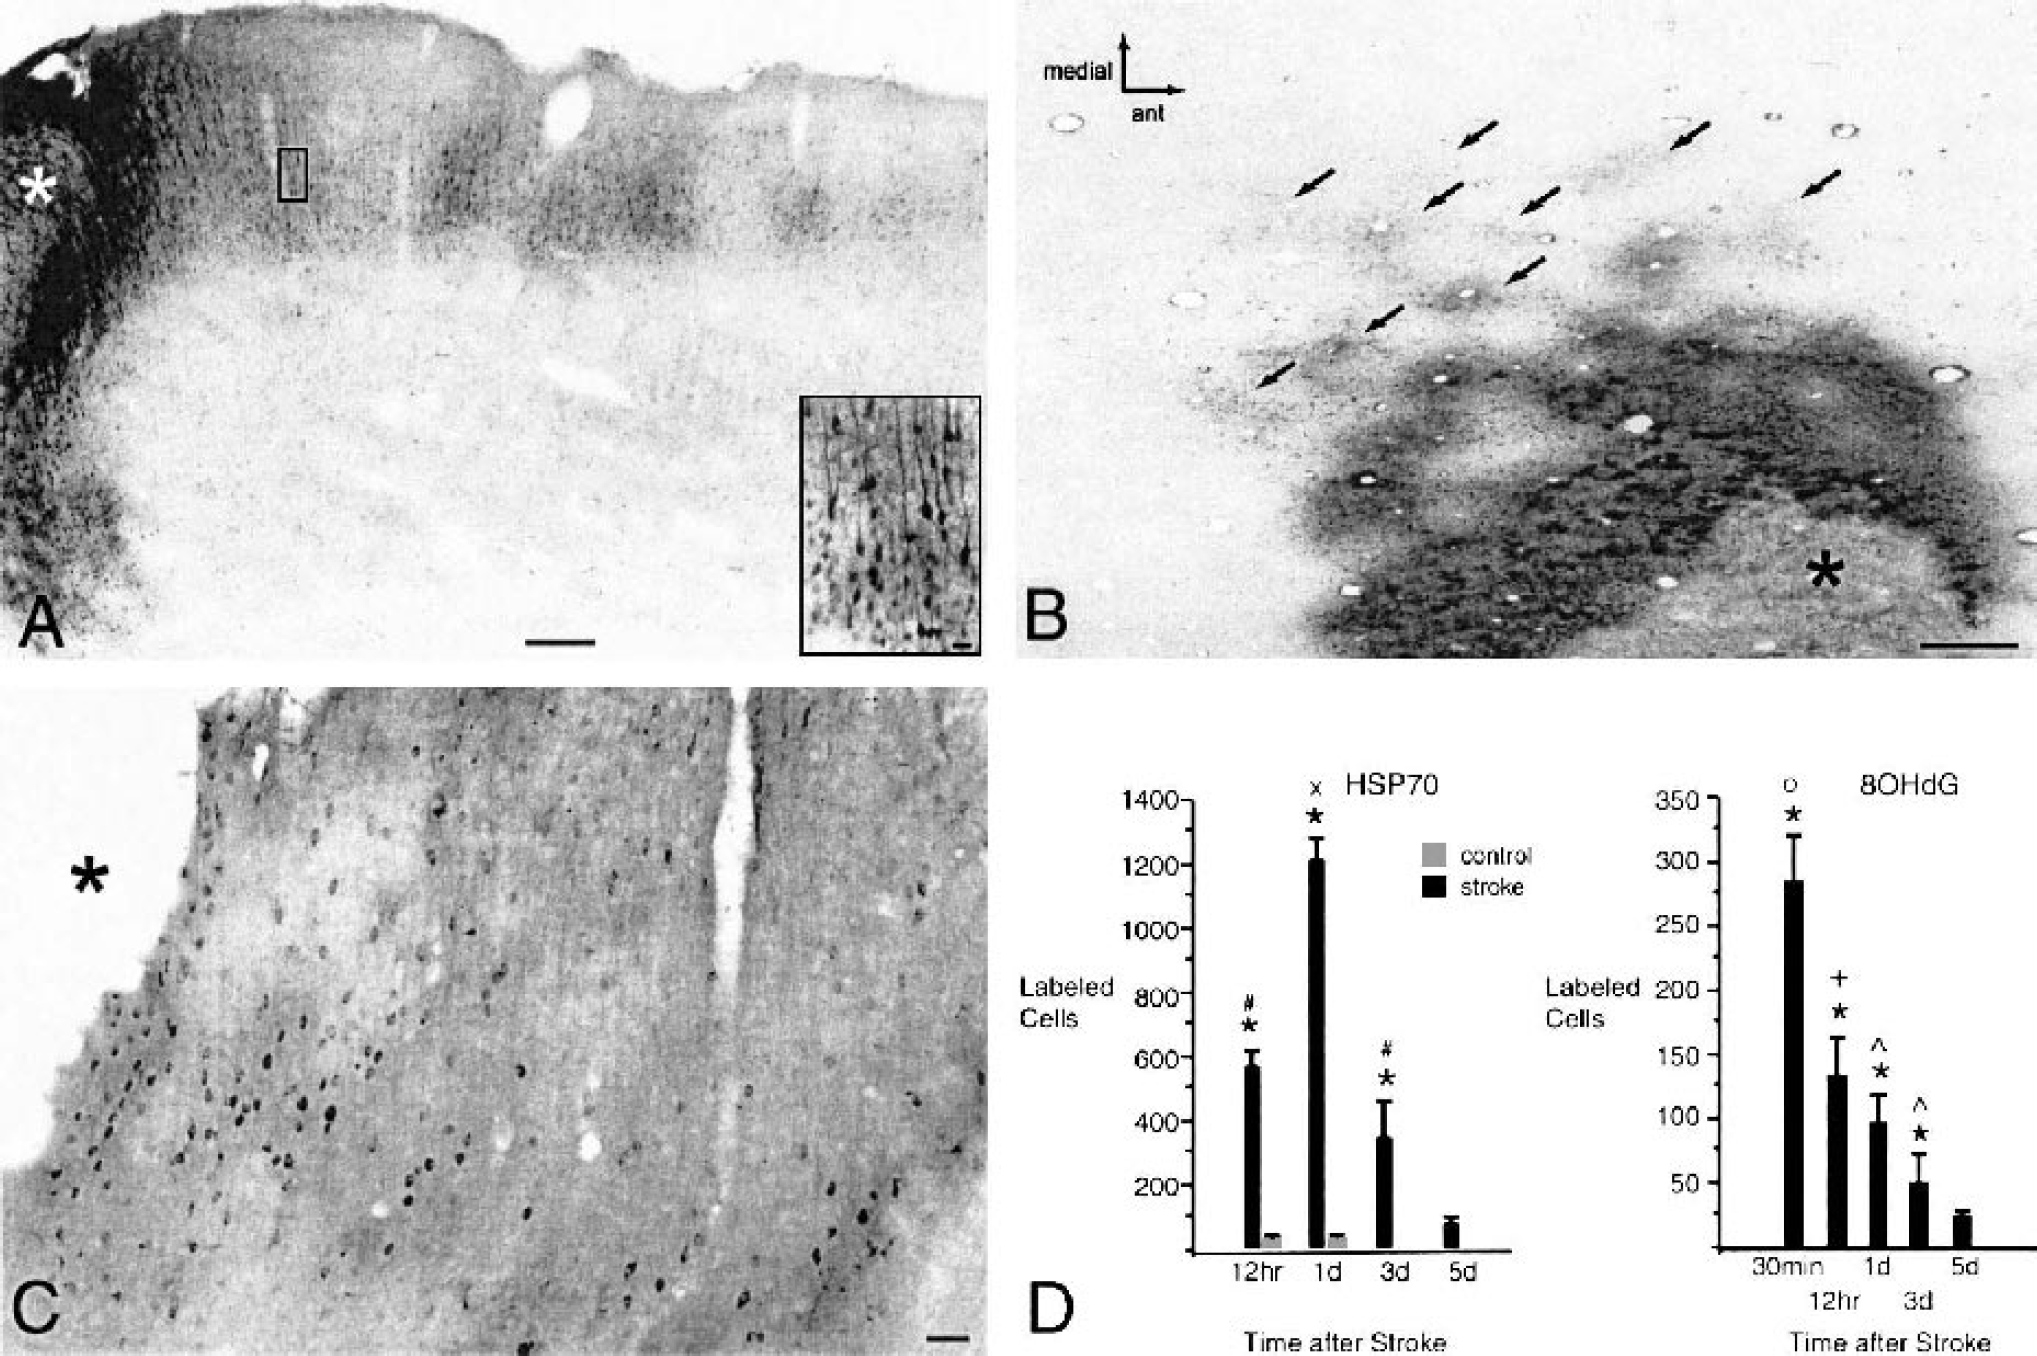
HSP70 and 8OHdG immunoreactivity. Coronal
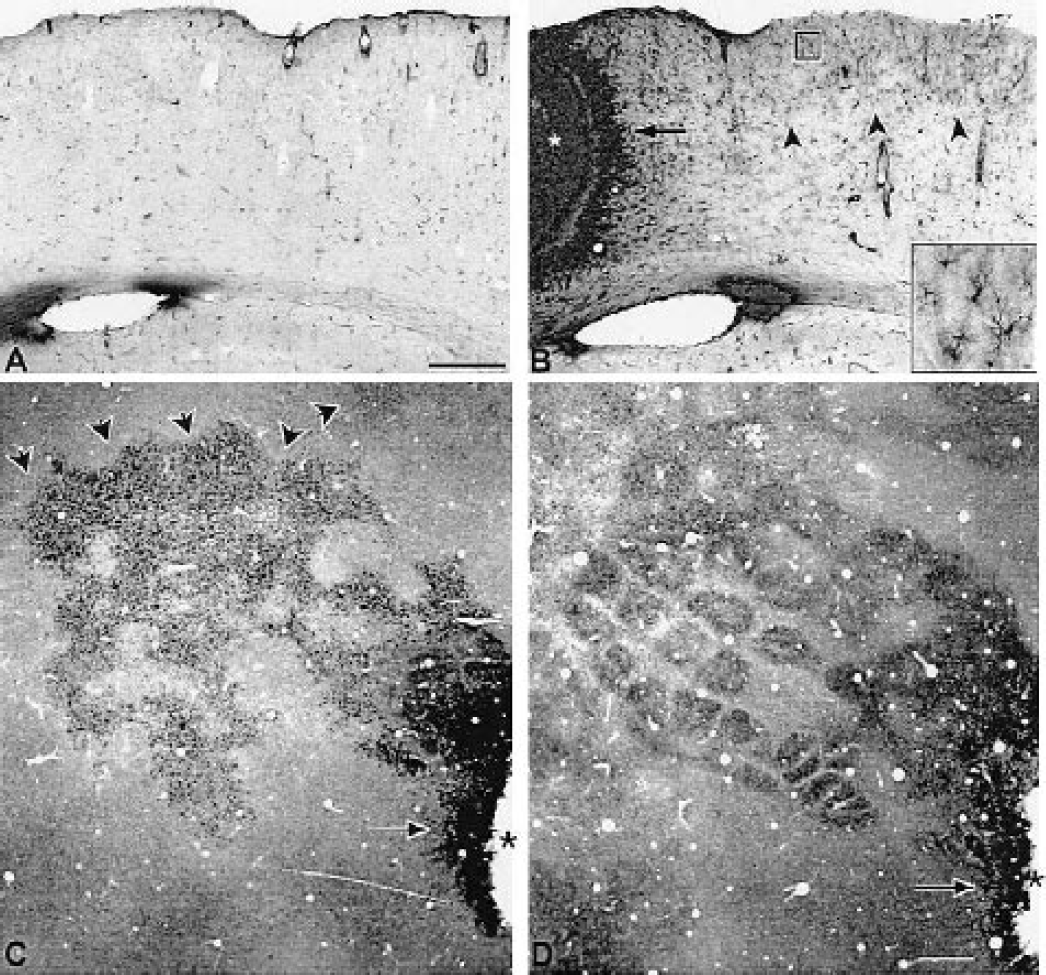
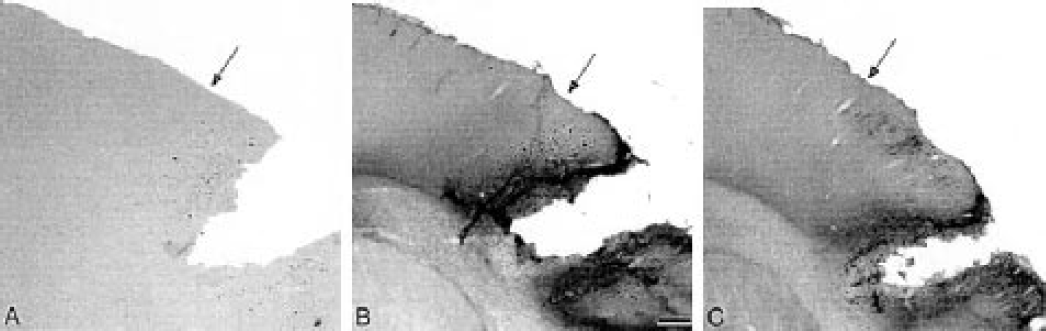
Nestin immunoreactivity after focal cortical stroke. Coronal sections through control
Vimentin immunoreactivity after stroke. Coronal sections through control
Demarcation of regions of cellular damage and death. Panels are adjacent sections from a single animal 1 day after stroke. The panel medial is to the left and inferior is to the bottom.
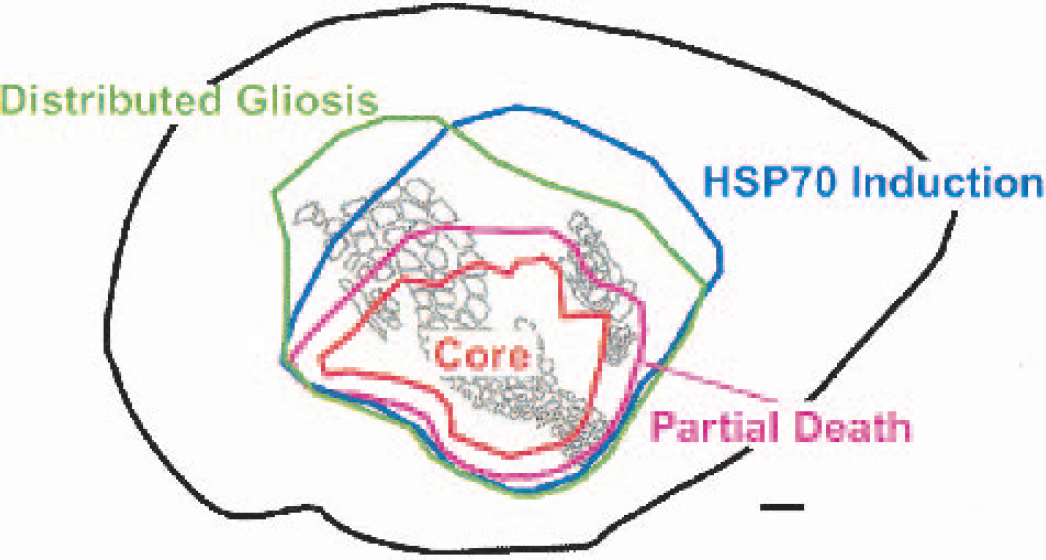
Composite map of tissue microenvironments after stroke. An overlay of the digitized mapping of TUNEL, activated caspase-3, fractin, HSP 70, 8OHdG, vimentin, and nestin staining on a representative flattened cortex map shows overlapping zones of partial tissue damage, injury, and distributed gliosis. Scale bar = 1 mm.
To ensure that the maximal extent of cell labeling was mapped, the number of labeled cells for activated caspase-3, fractin, TUNEL, 8OhdG, and HSP70 staining was quantified at time points that span the maximal occurrence of apoptosis, oxidative DNA damage, and HSP 70 induction: 30 minutes, 1, 3, and 5 days (Cui et al., 1999; Lipton, 1999; Moore et al., 2002; Namura et al., 1998; States et al., 1996). Cells were counted in digitized plots in three sections equally spaced through the infarct, at AP levels 1.60, −0.20 and −1.80 (Paxinos and Watson, 1997). The counts in these three sections were averaged to produce a representative estimate of cell staining for each stroke and control case at each time point. Cell staining patterns in control and stroke cases were then statistically compared using analysis of variance with Tukey-Kramer post hoc tests to compare time points within experimental groups and Dunnet post hoc testing to compare time points between experimental groups (Statview 5.0.1, SAS Institute, Carey, NC, U.S.A.).
Tangential sections
Two cohorts of animals were used to produce tangential sections to localize nestin and HSP70 immunoreactivity within functional subdivisions of the rat somatosensory cortex, visualized with CO staining (Land and Simmons, 1985). Animals were given a stroke as outlined above. At 1 day (n = 5) and 7 days (n = 9), animals were anesthetized, and the brains were removed and processed for tangential sectioning (Carmichael et al., 2001). Tangential sections were first stained for CO (Carmichael et al., 2001), followed by nestin (7-day animals) or HSP70 (1-day animals) immunohistochemistry as outlined above. Triton was left out of the immunohistochemical staining because it diminishes CO staining. The total extent of nestin, HSP70, and CO-visualized somatosensory areas was mapped as outlined above.
RESULTS
Stroke size and location
Physiologic variables did not differ between control and stroke animals (Table 1) and are within the normal range for spontaneously breathing, anesthetized Sprague-Dawley rats (Liu et al., 2001; Tamura et al., 1981; Yanamoto et al., 1998). Permanent occlusion of an anterior branch of the middle cerebral artery, and temporary occlusion of both common carotid arteries, produces an infarct within a portion of the rat somatosensory cortex (Fig. 1). The size of the infarct was determined with CO staining and MAP2 immunohistochemistry (Lipton, 1999) at 7 days after stroke (n = 7), a time at which cerebral infarction is complete (Lipton, 1999). The infarct was confined to cortex (Fig. 1D), and involved 2.41 ± 0.85 mm3 of tissue. There was no swelling or edema associated with this small cortical stroke. Measurements of hemispheric volume through the anterior/posterior levels of the infarct at 7 days showed a stroke hemisphere of 82.629 mm3 and a nonstroke hemisphere of 82.656 mm3. Thus, the infarct volume corrected for any change in overall hemispheric volume from edema is 2.34 ± 0.80 mm3. The distribution of diminished CO staining around the infarct was used to map an area of partial damage in tangential sections through cortex (Carmichael et al., 2001) (n = 9). The region of diminished CO staining extends as a rim around the infarct, with its greatest extent in the cortex medial to the infarct. Digitized mapping of all experimental cases showed that the region of diminished CO staining extended 0.5 mm lateral to the infarct and 1.1 mm medial to the infarct and encompassed a volume of 4.14 ± 3.15 mm3 (Fig. 1E).
Physiological variables
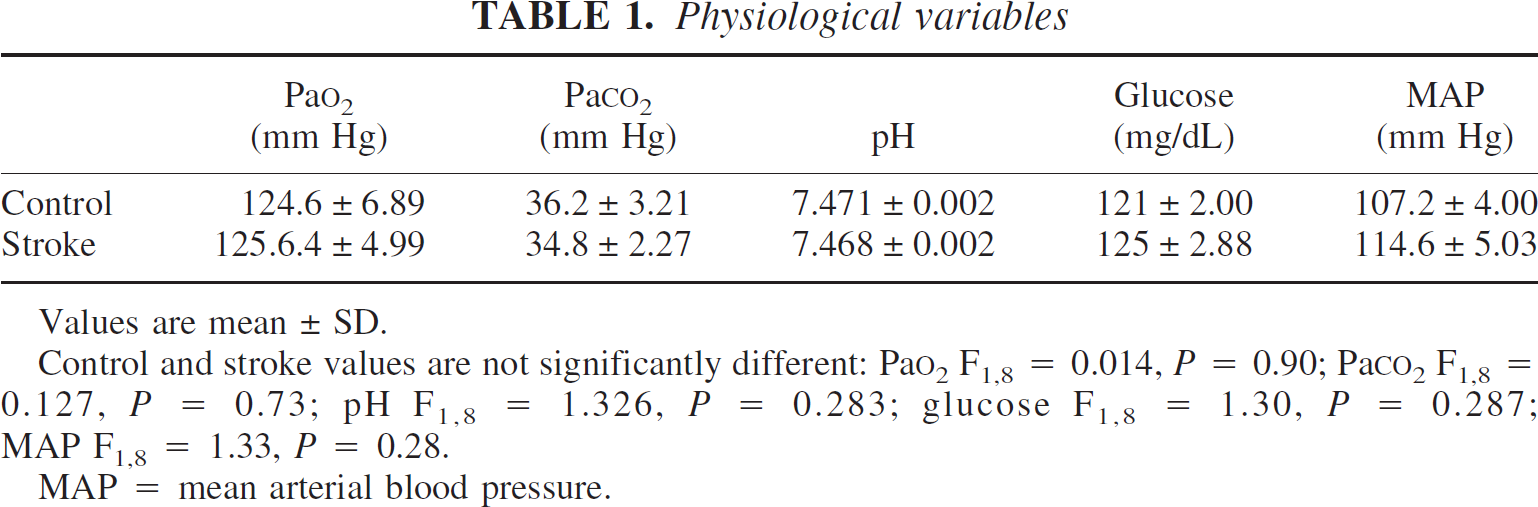
Values are mean ± SD.
Control and stroke values are not significantly different: Pao2 F1,8 = 0.014, P = 0.90; PaCO2 F1,8 = 0.127, P = 0.73; pH F1,8 = 1.326, P = 0.283; glucose F1,8 = 1.30, P = 0.287; MAP F1,8 = 1.33, P = 0.28.
MAP = mean arterial blood pressure.
Cytochrome oxidase staining identifies the functional subdivisions of the rat somatosensory cortex in tangential sections (Land and Simmons, 1985), including the representation of the rat's facial whiskers, the forelimb, and lower lip areas (Fig. 1A). The representation of the facial whiskers is termed the barrel cortex and can be subdivided into posteromedial and anterolateral barrel fields (Woolsey et al., 1975). The size of these functional subdivisions is highly consistent between hemispheres of the same animal (Riddle and Purves, 1995; Tobet et al., 1993). This interhemispheric consistency allows the precise size of the infarct to be quantified by mapping the area of the barrel cortex that is destroyed in this stroke. Digitized maps of the surface area of each region of the somatosensory cortex in the infarcted hemisphere were compared to the surface areas of the same regions in the opposite hemisphere (n = 9 animals). The infarct destroys 41.36% to 90.13% of the anterolateral barrel field and 5.0% to 69.1% of the posteromedial barrel field. The infarct borders but does not involve the forelimb and lower lip areas (Figs. 1B, 1C, and 1E). However, the region of diminished CO staining does involve the forelimb sensory and motor areas and lower lip somatosensory area (Fig. 1E; Chapin and Lin, 1990).
Apoptotic cell death
Defining the exact distribution of apoptotic cell death requires the used of multiple markers. TUNEL staining may be seen in necrotic cells (Lipton, 1999). Apoptotic cell death progresses through distinct caspase-mediated pathways that have been reported to differ by neuronal subtype (Velier et al., 1998). Three different end products in the apoptotic cascade were quantified: caspase-cleaved actin (fractin) (Yang et al., 1998), 3′OH doublestrand DNA damage (TUNEL staining; Lipton, 1999) and activated caspase-3 (Namura et al., 1998). Only occasional fractin-positive cellular profiles were seen in cortex of experimentally naïve animals (data not shown). After stroke, fractin stains cell bodies and proximal processes of large cells that are presumably neurons (Fig. 2A). Fractin immunoreactivity was not present in cells with other morphologies. Fractin staining was present in neurons within the infarct core and 295 to 430 μm of adjacent periinfarct cortex at 12 hours. At 1 day, fractin-positive cells were still present in the core, and extended to their maximal extent in periinfarct tissue: 355 to 500 μm in cortex lateral to the core and 0.8 to 1.3 mm in cortex medial to the core (Fig. 1C). At 3 and 5 days, fractin staining was confined to a narrow region of periinfarct cortex, 285 to 455 μm medial and lateral to the infarct. Quantification of fractin staining showed 149.13 ± 89.08 cells at 12 hours, 682.46 ± 356.50 at 1 day, 359.43 ± 90.96 at 3 days, and 26.67 ± 15.46 at 5 days. This pattern of maximal fractin staining 1 day after the infarct is statistically significant (Fig. 2D; F3,16 = 16.59; P < 0.05, Tukey-Kramer test). In control experiments, a small number of fractin-immunoreactive cells were present in the vicinity of the craniotomy, an average of 3.42 cells at 12 hours, 0.47 cells at 1 day, and 0 cells at days 3 and 5 after stroke. Fractin staining in the stroke cases was significantly different from control values at 12 hours and at 1 and 3 days after stroke (Fig. 2D; F7,32 = 26.12; P < 0.05, Dunnett test).
The pattern of TUNEL staining closely parallels the fractin staining pattern. TUNEL staining was present at 12 hours in the infarct core and closely adjacent periinfarct tissue, extending 250 to 430 μm away from the core. At 1 day, TUNEL staining was still present in the core and extended 355 to 500 μm lateral and 0.91 to 1.1 mm medial to the core. At 3 and 5 days after the stroke, TUNEL staining was confined to a narrow rim of periinfarct cortex that extended 265 to 400 μm medially and laterally in the cortex bordering the infarct. Quantification of the TUNEL staining pattern showed 129.13 ± 17.5 cells at 12 hours, 715.47 ± 316.06, at 1 day, 316.33 ± 118.51 at 3 days, and 21.72 ± 21.50 cells at 5 days. This pattern was statistically significant for maximal TUNEL staining at 1 day after stroke (Fig. 2D; F3,16= 18.08; P < 0.05, Tukey-Kramer test). Control animals had 2.42 ± 2.63 cells at 12 hours, 1.66 ± 2.46 cells at 1 day, 0.66 ± 1.33 cells at 3 days, and 0 ± 0 cells at 5 days after stroke. TUNEL staining was significantly different between stroke and control animals at 12 hours and 1 and 3 days after stroke (F7,32 = 24.40; P < 0.05, Dunnett test).
Immunoreactivity for activated caspase-3 was present in occasional cell profiles in cortex from experimentally naive animals (data not shown). Unlike TUNEL and fractin staining, activated caspase-3 immunoreactivity was not present in cells within the infarct core at any time point. Activated caspase-3 staining was present in nuclei within the periinfarct tissue in the same region as TUNEL and fractin staining: 310 to 455 μm away from the infarct at 12 hours, 0.39 to 0.5mm laterally and 0.8 to 1.3 mm medial to the infarct at 1 day, and 330 to 410 μm away from the infarct at 3 and 5 days after stroke. One day after stroke is thus the time point of maximal tissue distribution of activated caspase-3 staining. At this time point, the stained cells were also present in the dorsolateral striatum, immediately deep to the infarct core. In periinfarct cortex, activated caspase-3–immunoreactive cells were clustered in the superficial cortical layers as they extended away from the infarct. Quantification of the activated caspase-3 staining in cortex showed 134.20 ± 42.80 cells at 12 hours, 779.75 ± 117.93 at 1 day, 357.57 ± 114.92 at 3 days, and 48.34 ± 17.41 at 5 days after stroke. Like fractin and TUNEL staining, this pattern of maximal activated caspase-3 staining at 1 day after stroke was statistically significant (Fig. 2D; F3,16 = 113.57; P < 0.05, Tukey-Kramer test). Control animals had 2.48 cells at 12 hours, 0.73 cells at 1 day, and 0 cells at days 3 and 5 after stroke. Activated caspase-3 immunoreactivity was significantly different between stroke and control animals at 12 hours and 1 and 3 days after stroke (F7,32 = 164.66; P < 0.05, Dunnett test). To determine the cortical location of fractin, TUNEL, and activated caspase-3 staining, the staining pattern was compared with adjacent cresyl violet sections at day 1. These apoptotic markers were confined to granular and dysgranular cortex of the primary somatosensory area, and the granular cortex immediately lateral to the primary somatosensory area, SII (Chapin and Lin, 1990).
HSP70
HSP70 expression identifies an ischemic penumbra around the infarct (Hatta et al., 2000; Sharp et al., 2000; States et al., 1996). HSP70 expression has not been established relative to oxidative damage and subtypes of gliosis. At 12 hours and 1 day HSP70 staining occurs within the vasculature of the infarct core and within neurons in the periinfarct cortex (Figs. 3A and 3B). At the later time points of 3 and 5 days, HSP70 immunoreactivity is present in neurons and in a small number of astrocytes immediately adjacent to the infarct core (data not shown). HSP70-immunoreactive neurons are grouped into patches within the superficial cortical layers (Figs. 3A and 3B). At 12 hours, HSP70 immunoreactive neurons extend 500 to 910 μm in cortex lateral to the infarct and 1.6 to 2.3 mm in cortex medial to the infarct. At 1 day, the extent of HSP70 immunoreactive neurons is maximal: 700 to 950 μm in cortex lateral to the infarct and 3.0 to 3.7 mm in cortex medial to the infarct (Figs. 3A and 3B). HSP70 staining declines on days 3 and 5 and is present only in the immediate periinfarct area, 290 to 455 μm medial and lateral to the infarct. The number of HSP70 immunoreactive cells was 567.73 ± 51.74 at 12 hours, 1206.69 ± 69.05 at 1 day, 249.67 ± 115.36 at 3 days, and 74.33 ± 24.02 at 5 days. This pattern of maximal staining at 1 day after stroke is statistically significant (Fig. 3D; F3,16 = 24.26; P < 0.05, Tukey-Kramer test). The production of the infarct in this model involves craniotomy and thermal coagulation of an MCA branch. The heater probes is approximately the size of the MCA branch, but heat damage may contribute to this model. To study this, all control animals received craniotomy and heater probe placement caudal to the MCA. In terms of HSP70 induction, control animals had 31.53 ± 13.65 stained cells at 12 hours and 13.58 ± 14.4 at 1 day, and no stained cells were present on days 3 and 5. HSP70 staining was statistically different between stroke and control at 12 hours and 1 and 3 days after stroke (Fig. 3D; F7,32 = 41.41; P < 0.05, Dunnett test) and does not contribute to the massive upregulation of this protein in the stroke area.
The maximal extent of HSP70 staining on day 1 extends very far medial to the infarct within the somatosensory area in a patchy distribution (Fig. 3A). Comparison of HSP70 cellular staining to adjacent cresyl violet sections indicated that HSP70 staining extends through the granular and dysgranular regions of the primary somatosensory cortex into the lateral agranular area of the motor cortex, but does not involve the medial agranular motor cortex. This finding indicates that stroke induces HSP70 immunoreactive cells in primary somatosensory cortex and forelimb motor cortex, but not hindlimb motor cortex (Chapin and Lin, 1990; Gu et al., 1999; Hall and Lindholm, 1974; Neafsey et al., 1986). To determine if the patchy staining within primary somatosensory cortex corresponds to the location of intrinsic structural elements of the somatosensory cortex, such as cortical barrels or the forepaw representation, tangential sections taken at 1 day after stroke were double stained for CO histochemistry and HSP70 immunohistochemistry (Fig. 3B). Although HSP70 staining was present in neurons within much of the cortex containing the barrels in the posteromedial and anterolateral barrel fields, forepaw, and lower lip areas, the patches of HSP70 staining did not conform to the boundaries of these areas (data not shown).
Oxidative DNA damage
8OHdG immunoreactivity is present within nuclei in cells bordering the infarct. Because oxidative DNA damage has been reported to be maximal at 30 minutes after stroke in models with reperfusion (Cui et al., 1999; Moore et al., 2002), a 30-minute time point was added to the overall study group (n = 5). At 30 minutes, stained cells were present 290 to 480 μm lateral to the infarct and 0.6 to 1.0 mm medial to the infarct (Fig. 3C). At 12 hours and days 1, 3, and 5, stained cells were present in a narrow region of cortex 200 to 450 μm both lateral and medial to the infarct. Quantification of 8OhdG-immunoreactive cells showed 284.80 ± 35.16 cells at 30 minutes, 134.00 ± 28.89 cells at 12 hours, 97.00 ± 21.11 cells at 1 day, 51.05 ± 24.74 cells at 3 days, and 3.05 ± 1.97 cells at 5 days. This pattern is statistically significant for maximal staining at 30 minutes (Fig. 3D; F4,20 = 109.96; P < 0.05, Tukey-Kramer test). 8OhdG staining was minimal in control animals (14.40 ± 4.53 cells at 30 minutes, 0.8 ± 0.83 cells at 12 hours, 0.86 ± 0.38 cells at 1 day, 0.66 ± 0.24 cells at 3 days, and 0.33 ± 0.36 cells at 5 days). 8OHdG staining was significantly different between stroke and control animals at 30 minutes, 12 hours, and 3 days (F9,40 = 174.96; P < 0.05, Dunnett test). A comparison was made of the 8OHdG staining at the maximum spatial extend of this label at 30 minutes after ischemia and adjacent cresyl violet sections. 8OHdG staining was confined to the primary somatosensory cortex and to granular cortex immediately lateral to the primary somatosensory cortex, area SII.
Gliosis
The reexpression of the intermediate filaments nestin and vimentin defines specific populations of reactive astrocytes (Berry et al., 2002; Brook et al., 1999; Calvo et al., 1991; Clarke et al., 1994; Eliasson et al., 1999; Li and Chopp, 1999; Lin et al., 1995; Ridet et al., 1997; Schroeter et al., 1995). In experimentally naive animals, nestin and vimentin immunoreactivity is present in blood vessels but not cortical glia (Figs. 4A and 5A; Li and Chopp, 1999; Schroeter et al., 1995). Also, vimentin immunoreactivity is present within astrocytes in the corpus callosum (data not shown). Seven days after stroke, two patterns of nestin and vimentin immunoreactivity were present. A dense band of nestin and vimentin positive astrocytes was present within 300 to 560 μm of the infarct (Figs. 4B and 5B). This linear band of immunoreactive astrocytes formed palisades or serpentine lines in the cortex adjacent to the stroke (Fig. 5B). Although this finding suggests that the foci of necrosis or damage is in this region, there was not a similar pattern of labeling in activated caspase-3, fractin, TUNEL, or 8OHdG stains. This dense linear vimentin and nestin immunoreactivity was present within cortex more closely adjacent to the infarct (300–560 μm) than the extended HSP70 immunoreactive clusters of neurons. A second population of more lightly stained astrocytes was present in patches in the superficial cortical layers medial to the infarct (Figs. 4B and 4C). These patches extended a maximal distance of 5.88 mm from the infarct (Figs. 4B and 4C). At days 10 and 14 after stroke, nestin- and vimentin-immunoreactive astrocytes were confined to the immediate margin of the lesion, 290 to 550 μm in cortex medial and lateral to the infarct. The distant, patchy population of immunoreactive cells was not present at these time points. The intensity of vimentin staining within white matter astrocytes increased from days 7 to 14 after stroke (data not shown). A comparison of the distribution of immunoreactive cortical astrocytes to adjacent sections stained for cresyl violet indicated that nestin- and vimentin-positive cells were present in granular and dysgranular areas of the primary somatosensory cortex, SII, and a small portion of the lateral agranular cortex that is immediately rostral to primary somatosensory cortex, the forelimb motor cortex (Chapin and Lin, 1990; Gu et al., 1999; Hall and Lindholm, 1974; Neafsey et al., 1986).
To determine if the patches of nestin-positive astrocytes in periinfarct cortex at 7 days correspond to functional subdivisions of the somatosensory cortex, tangential sections were stained for both CO histochemistry and nestin immunohistochemistry (n = 9 animals). Nestin-positive astrocytes were present as patches and interconnecting chains that largely overlapped specific areas of the somatosensory cortex: the posteromedial barrel field (Figs. 4C and 4D), anterolateral barrel field, trunk and forelimb areas, and the second somatosensory area (SII, Fig. 4D). Interestingly, regions of cortex located at the same distance from the infarct as these somatosensory areas did not contain nestin-positive astrocytes (Fig. 4C). Thus, at 7 days after stroke, nestin-positive astrocytes were located not just radially away from the infarct core, but within specific portions of the rat somatosensory cortex.
DISCUSSION
This study used a clinically relevant model of small stroke within identified cortical circuits to map microenvironments of partial death, injury, and gliosis in adjacent tissue. Three progressively larger regions can be recognized around the infarct core (Fig. 7). Apoptotic cell death, diminished mitochondrial staining, oxidative DNA damage, and reactive gliosis occur within a narrow region of tissue adjacent to the infarct. HSP70 induction was present in a broad region of tissue medial to the infarct. A distributed pattern of gliosis was present within an extended region distal to the infarct, including specific subsets of the somatosensory cortex. Because the anatomy and physiology of the rat somatosensory cortex has been extensively characterized (Chapin and Lin, 1990), these data can be used to stereotaxically map ischemic cell death, apoptosis, oxidative DNA damage, subtypes of gliosis, and cell stress within the rat brain and relate these processes to those of axonal sprouting, neurogenesis, and other forms of poststroke neuroplasticity.
Small cortical stroke
This experimental model produces a small stroke that is clinically relevant in size and mechanism. Many experimental stroke models are optimized to generate highly reproducible, but relatively large, stroke sizes. This reproducibility has been important for studies of neuroprotection. By standard measures of rat forebrain and cortex size and weight (Cobb, 1965; Fox and Wilczynski, 1985; Riddle et al., 1992), MCA occlusion through variations on the intraarterial suture technique (Longa et al., 1989), or distal MCA occlusion (Chen et al., 1986; Yanamoto et al. 1998) typically destroy 10% to 70% of the rat forebrain or ipsilateral cortex (Chen et al., 1986; Ginsberg and Buston, 1989; Longa et al., 1989; Yanamoto 1998). However, by using human intracranial volumes taken from computed tomographs (Lyden et al., 1994), hospital-based studies have reported infarct sizes of 2% (NINDS Stroke Study Group, 2000; Saver et al., 1999) and 3.6% (Brott et al., 1989) of total intracranial volume. Outpatient studies have suggested even smaller stroke volumes in humans of 0.88% (Kissela et al., 2001) and 1.2% (Kissela et al., 2001; Lindgren et al., 1994). The infarcts in the current study range from 0.07% to 0.22% of the rat forebrain.
The current stroke model produces an infarct pattern that is similar to other stroke models in barrel cortex (Wei et al., 1995), but is less technically demanding and involves reperfusion injury. The pattern of oxidative DNA damage confirms the reperfusion injury in this model (see below). Reperfusion injury is associated with a qualitatively different type of cellular injury (Liu et al., 2001), particularly apoptotic cell death (Lipton, 1999). Reperfusion is also a common spontaneous occurrence in human stroke (Kassem-Moussa and Graffagnino, 2002) and is the goal of the currently approved (NINDS Trial, 1995) and promising (Furlan et al., 1999) stroke therapies. Stroke models that incorporate reperfusion may more accurately model the human condition by incorporating the unique pattern of injury produced by reactive oxygen species. In this model, coagulating a branch of the MCA and then transecting it produced stroke. However, heat damage is not a significant component of the injury in this model. In control animals, craniotomy and heater-probe placement just caudal to the MCA do not produce an infarct. HSP70 immunoreactivity, a direct measure of thermal stress (Sharp et al., 2000), is increased to a small degree only in the center of the craniotomy in control animals. Further, there are no significant increases in apoptotic cell death, oxidative DNA damage, or gliosis in control animals.
Tissue microenvironments in focal stroke
Three main tissue microenvironments were identified after focal cortical stroke: a zone of partial damage, a zone of heat shock protein induction or cell stress, and a zone of distant or distributed gliosis (Fig. 7). Within the zone of partial damage, apoptotic cell death, oxidative DNA damage, and diminished CO staining indicate that distinct cellular elements are damaged. Oxidative DNA damage appears to be a reversible cellular insult, because it is repaired quickly after stroke (Cui et al., 1999; Moore et al., 2002). In the current study, oxidative DNA damage is maximal at 30 minutes, and then has a second, more prolonged phase, which persists to 3 days. This time course is consistent with the early phase of oxidative DNA damage seen in transient ischemia (Cui et al., 1999; Moore et al., 2002) and the more prolonged period of oxidative DNA damage seen in permanent ischemia (Hayashi et al., 1999; Nagayama et al., 2000). In this model, permanent ischemia derives from occlusion of a small branch of the MCA and transient ischemia from temporary interruption of anterior cerebral artery collaterals (Coyle and Jokelainen, 1982).
We have shown that several markers of apoptotic cell death are present within this zone of partial damage adjacent to the infarct. The use of several apoptotic markers is important, because single measures of apoptosis identify only subsets of apoptotic cells, such as with activated caspase-3 (Benchoua et al., 2001; Lipton, 1999; Velier et al., 1999) or, as with the TUNEL stain, may identify a population of cells undergoing necrotic cell death (Lipton, 1999). All three apoptotic markers give a comparable distribution adjacent to the infarct. Because apoptotic cell death has been localized largely to neurons in periinfarct tissue (Benchoua et al., 2001; Namura et al., 1998), these data indicate that the zone adjacent to the infarct is one of limited neuronal death.
Cytochrome oxidase staining is localized predominantly in dendrites and axon terminals (Wong-Riley and Welt, 1980). Thus, a diminished CO staining pattern indicates a loss of presynaptic and postsynaptic structures adjacent to the infarct core. This loss of synaptic structures comes from two sources. The partial apoptotic death in this region, noted above, will cause dropout of dendrites. Secondly, the infarct kills neurons in the core that project to adjacent cortex. In the somatosensory cortex, local connections are organized such that neurons in the region of the infarct core would normally project heavily to adjacent somatosensory areas (Carmichael et al., 2001; Fabri and Burton, 1991). Thus, diminished CO staining in the region adjacent to the infarct is attributable to a loss of efferent projections entering the region, and a loss of local circuit connections. The data in this study indicate that this region of partially damaged synaptic structures extends approximately 1 mm away from the core, experimentally defining a zone of ischemic deafferentation in periinfarct cortex.
In contrast to this loss of synaptic connections, the region of diminished CO staining is also a site of regenerating synaptic connections: poststroke axonal sprouting (Carmichael et al., 2001). In fact, tract-tracing studies indicate that the cortex adjacent to the infarct is an active site of both local and long-distance axonal sprouting (Carmichael and Chesselet, 2002; Carmichael et al., 2001). In poststroke axonal sprouting, fully differentiated cortical neurons are induced to enter a growth program, sprout axons and establish new connections, a process that may involve reactivation of developmental cellular programs (Aubert et al., 1995; Carmichael, 2003; Smith and Skene, 1997). Interestingly, the region of partial damage is also the site of the most substantial reexpression of the developmentally regulated proteins nestin and vimentin. Thus, in total, the zone of partial damage adjacent to the infarct is a region of intense reactive cellular signaling, characterized by limited neuronal death, synaptic loss, axonal sprouting, and reexpression of developmentally regulated proteins.
The zones of HSP70 induction and distributed gliosis extend over a substantial distance, primarily medial to the infarct. These two zones are clearly segregated from direct cellular damage. There is no evidence of apoptotic cell death, oxidative DNA damage, or diminished mitochondrial staining in these regions. Spreading depression, reperfusion injury, and axotomy are all processes that occur as a direct result of focal ischemia and have been proposed as mediators of distant cellular reactions to stroke (Sharp et al., 2000; Witte et al., 2000). Spreading depressions do not induce HSP70 (Mancuso et al., 1999). Instead, it has been proposed that reperfusion injury induces HSP70 expression after stroke (Hatta et al., 2000). There was no evidence of one marker of reperfusion injury, 8OHdG, in the zone of HSP70 immunoreactivity in this model. It remains possible that HSP70 expression is induced by cellular dysfunction other than that detected by the makers in this study.
A large zone of cellular dysfunction after stroke has been reported in other studies. Small photothrombotic infarcts produce decreases in γ-aminobutyric acid receptor, a subtype mRNA, protein, and receptor sites and increases in N-methyl-D-aspartate receptor binding in a large region of cortex ipsilateral and contralateral to the stroke (Carmichael, 2003; Neumann-Haefelin et al., 1998, 1999; Qu et al., 1998; Que et al., 1999; Keyvani et al., 2001). This region extends well beyond, and contralateral to, the area of cell stress defined in this study by HSP70 induction. This extended region of transmitter alterations may be induced by transient physiologic signals after stroke, rather than frank cellular damage or stress. This is because even brief application of N-methyl-D-aspartate antagonists block γ-aminobutyric acid receptor changes (Redecker et al., 2002) and cellular damage in these studies has been found in a smaller region adjacent to the infarct (Neumann-Haefelin, 1998; Qu et al., 1998). Focal ischemic lesions induce synchronized neuronal activity in the awake animal that may be responsible for these neurotransmitter changes (Carmichael and Chesselet, 2002). In contrast to these very distributed neurotransmitter changes, the more localized region of cellular stress likely corresponds to regions of direct blood flow changes or metabolic stress. Preliminary studies using small animal positron emission tomography (microPET) in this stroke model have identified a region of persistent hypometabolism that includes the region of HSP70 induction and may identify a metabolic correlate to the region of partial damage (Carmichael et al., 2002).
Nestin and vimentin are reexpressed in cells with the morphologic appearance of astrocytes in specific, distant areas of the somatosensory and motor cortex. These two proteins are not localized to specific cytoarchitectonic areas, but instead extend in patches within the barrel field, trunk and forelimb sensorimotor cortices. These proteins are not seen in adjacent areas that are at the same radial distance from the infarct core. Thus, this patchy nestin upregulation is not simply the result of transient hypoperfusion, or of a radially diffusing molecular signal. One possible trigger for nestin expression is the spreading depression (Holmin et al., 2001). However, genes induced by spreading depressions, such as c-fos, c-jun, and BDNF, are induced in the entire cortical hemisphere (Hossmann, 1996), even after small photothrombotic infarcts (Comelli et al., 1993). A second possible trigger for this distant nestin expression is axotomy (Brook et al., 1999). However, in the present data, nestin is expressed only in a subset of the regions that project to the infarct core, and are thus axotomized (Akers and Killackey, 1978; Fabri and Burton, 1991). Thus, nestin expression after stroke may be induced by a combination of axotomy in adjacent neurons and other ischemic events, such as spreading depressions or cortical hypometabolism (Carmichael et al., 2002).
CONCLUSIONS
Stroke produces an infarct core and surrounding regions of partial damage, stress, and distributed gliosis, each of which is larger than the infarct core. In the region of partial damage, cell death is juxtaposed with a reactivation of developmental molecular and cellular programs. Distant areas of gliosis occur within anatomically specific sites, which may reflect stroke-induced axotomy. These data indicate that the functional impact of stroke must be studied not only in terms of ischemic cell death and infarct size, but also in the much more substantial regions of tissue reorganization and regeneration that occur in large zones around the infarct.
Footnotes
Acknowledgments:
The authors thank Drs. David Hovda, Stefan Lee, and Naoki Aoyama for generously providing their time and training regarding their blood pressure monitoring and blood chemistry hardware.