
Abstract
Kainic acid (KA) neurotoxicity was examined in transgenic (Tg) mice overexpressing human CuZn-superoxide dismutase (SOD-1). The doses of KA required to produce seizures, the severity of the seizures, and the regions damaged were similar in SOD-1 Tg and non-transgenic wild-type mice. Intraperitoneal KA injection induced seizure-related neuronal damage in the CA3 and CA1 regions of the hippocampus and in other regions of the brain in both SOD-1 Tg and wild-type mice. These damaged neurons were labeled with the terminal deoxynudeotidyl transferase-mediated uridine 5′—triphosphate-biotin nick end labeling (TUNEL) technique up to 72 h, although no significant difference in the number of TUNEL-positive neurons was observed between SOD-1 Tg and wild-type mice. In situ hybridization showed that c-fos, c-jun, and hsp70 genes were expressed in the hippocampus, cortex, and other regions of the brain after KA treatment. The expression of these genes was maximal 1 to 4 h following KA treatment but persisted longer in the hippocampus and other regions in SOD-1 Tg compared with wild-type mice; however, cell death in the hippocampus, assessed using cresyl violet staining, was similar in SOD-1 Tg and wild-type mice. The data show that superoxide radicals modulate both immediate early gene and heat shock gene expression after KA-induced seizures. The prolonged expression of c-fos, c-jun, and hsp70 in SOD-1 Tg compared with wild-type mice may indicate that hippocampal neurons survive longer in SOD-1 Tg than in wild-type animals; however, cell death as well as the seizure threshold, seizure severity and the pattern of regional vulnerability were not affected substantially by increased levels of SOD in the brain.
Keywords
L-Glutamate and other excitatory amino acids (EAAs) serve as excitatory neurotransmitters in the normal central nervous system. During prolonged seizures and other pathological situations, these EAAs produce an excess of neuronal activity that can lead to neuronal death, especially in the hippocampus (Choi, 1988; Monaghan et al., 1989; Calne, 1994). Several mechanisms for this excitotoxic-induced damage have been proposed, including a role for free radicals. The EAAs elevate cytosolic free calcium (Ca2+) (Choi, 1988; Berg et al., 1995), and in pathological conditions, a Ca2+ overload may occur, which can set off a cascade of events, such as phospholipase activation, potentially leading to free-radical production (Chan et al., 1984; Pazdernik et al., 1992).
The EAAs act on several receptors, including the sodium channel coupled kainic acid (KA) receptor (Monaghan et al., 1983; Cull and Usowicz, 1987; Ascher and Nowak, 1988; Barnard and Henley, 1990). Systemic administration of KA, a nonmetabolized ligand for the KA receptor, produces characteristic limbic seizures and selective neuronal cell death in hippocampal CA1 and CA3 pyramidal neurons (Monaghan et al., 1983; Young and Fagg, 1990) as well as in other regions. Superoxide anion (O2−), which is generated within the brain during seizure activity (Armstead et al., 1989), and other free radicals may play a role in seizure-related brain damage (Nelson and Olson, 1987). Oxygen radicals and lipid peroxidation have also been suggested to be mediators of KA neurotoxicity (Dykens et al., 1987; Miyamoto and Coyle, 1990; Sun et al., 1992; Coyle and Puttfarcken, 1993), as has arachidonic acid metabolism, because an inhibitor of cyclo-oxygenase and lipoxygenase (BW755C) protects animals against KA-induced seizures and neurotoxicity (Baran et al., 1994). On the other hand, it has been reported that N-methyl-
The purpose of the present study was to investigate the role of O2− in KA-induced neurotoxicity. KA was administered systemically to wild-type and transgenic (Tg) mice overexpressing human CuZn-superoxide dismutase (SOD-1). It was postulated that the increased scavenging of O2− in the SOD-1 Tg mice might protect them from KA toxicity because the levels of endogenous SOD-1 activity in the brain are increased threefold in these mice (Epstein et al., 1987; Chan et al., 1991), and the SOD-1 Tg mice are relatively protected against several other types of injury, including cold injury or ischemia (Chan et al., 1991; Kinouchi et al., 1991; Yang et al., 1994).
To characterize the degree and extent of injury, cellular DNA fragmentation was assessed in situ by the end labeling of DNA containing free 3′-OH ends (terminal deoxynucleotidyl transferase-mediated uridine 5′–triphosphate-biotin nick end labeling [TUNEL]) at various times after KA treatment. Several reports have shown that, using TUNEL staining, KA-induced neuronal cell damage produces DNA fragmentation in individual neurons and KA produces DNA laddering, a biochemical hallmark of apoptosis (Filipkowski et al., 1994; Pollard et al., 1994a,b). SOD may also prevent or delay DNA fragmentation, suggesting a role for oxidative stress in apoptotic cell death (Greenlund et al., 1995; Rabizadeh et al., 1995).
To provide complementary indices of the effects of oxidative stress on KA-induced injury, immediate early gene (IEG) and heat shock gene expression were also assessed in wild-type and SOD-1 Tg mice. The c-fos and c-jun IEGs are induced by increases in intracellular Ca2+, and it has been suggested that apoptotic cell death is correlated with the prolonged expression of fos- and jun-related genes (Dragunow et al., 1993; Ham et al., 1995; Kasof et al., 1995; McCabe et al., 1995). The 70-kDa heat shock protein (HSP70) that is induced in injured areas of the brain following ischemia and KA-induced seizures (Gonzalez et al., 1989; Vass et al., 1989; Chopp et al., 1991; Nowak, 1991) provides a biochemical marker of the neural injury (Gonzalez et al., 1989) and may influence apoptotic cell death (Wei et al., 1995). In addition, both c-fos and hsp70 mRNA gene expression was prolonged in SOD-1 Tg mice after mild focal cerebral ischemia compared with wild-type mice (Kamii et al., 1994a,b), suggesting that the prolonged expression of these genes might be correlated with neuronal protection after focal cerebral ischemia in SOD-1 Tg mice. Therefore, c-fos, c-jun, and hsp70 mRNA expression was examined using in situ hybridization following KA treatment in wild-type and SOD-1 Tg mice.
MATERIALS AND METHODS
SOD-1 Tg mice
Heterozygous SOD-1 Tg mice of the SOD-1 TgHS/SF-218–3 strain carrying human SOD-1 genes were derived from the founder stock previously described (Epstein et al., 1987). They were bred on a CD-1 mouse background. The SOD-1 Tg mice were identified by qualitative demonstration of SOD-1 using nondenaturing gel electrophoresis followed by nitroblue tetrazolium staining (Epstein et al., 1987). There were no observable phenotypic differences between SOD-1 Tg and wild-type normal littermates.
KA administration
All animals were treated in accordance with the University of California, San Francisco, guidelines, The Treatment of Laboratory Animals, and an approved animal protocol from the Animal Care Committee of the University of California. Kainic acid (Sigma Chemical Co., St. Louis, MO, U.S.A.) was diluted in 0.9% saline at a concentration of 5 mg/ml. Male SOD-1 Tg and wild-type mice (34–40 g) were injected intraperitoneally with KA (30 or 50 mg/kg of body weight). Sham-control mice were injected with the same volume of saline. Animals were observed for 1 h after the injection. Behavioral changes were assessed using the method described by Lothman and Collins (1981) with some modification for mice. There were two behavioral groups: (1) mild seizures, in which the mice showed staring posture, wet-dog shakes, or automatism without any myoclonic twitches; (2) severe seizures, in which the mice showed myoclonic twitches of the forelimbs with standing postures or generalized tonic-clonic seizures with falling or “wild seizure jumps” (Lothman and Collins, 1981). At various times after KA administration, the mice were deeply anesthetized with methoxyflurane, decapitated, and the brains were removed and rapidly frozen. Coronal sections of the brain (20 μm) were cut on a cryostat, and every third section was mounted on Fisherbrand Superfrost/Plus slides (Fisher Scientific, Pittsburgh, PA, U.S.A.) for TUNEL staining or in situ hybridization. Every third section was stained with either cresyl violet or hematoxylin and eosin (H & E) to assess neuronal injury using standard histological criteria.
In situ detection of DNA fragmentation
DNA fragmentation was assessed using the TUNEL technique. Terminal deoxynucleotidyl transferase (TdT) was used to label the 3′-OH ends of fragmented DNA as previously described (Gavrieli et al., 1992). Frozen brain sections were fixed for 30 min in 4% paraformaldehyde in 0.1 M pH 7.4 phosphate-buffered saline (PBS). After treatment with 20 μg/ml of proteinase K (Sigma) for 15 min, the slides were placed in 1 X TdT buffer (Gibco BRL, Gaithersburg, MD, U.S.A.) for 15 min, followed by 20 μl/ml of TdT enzyme (Gibco BRL) with 40 μl/ml of biotinylated 16-dUTP (Boehringer Mannheim, Indianapolis, IN, U.S.A.) at 37°C for 60 min. The slides were then washed in X2 standard saline citrate (SSC) for 15 min (SSC, 150 mM sodium chloride, 15 mM sodium citrate, pH 7.4) followed by PBS 2X for 15 min. Avidin-biotin-horseradish peroxidase solution (ABC kit, Vector Laboratories Inc., Burlingame, CA, U.S.A.) was applied to the sections for 30 min followed by sodium acetate solution (0.175 M) X2 for 15 min. For observation with low magnification, staining was visualized using 0.025% diaminobenzidine (DAB), 0.075% hydrogen peroxide (H2O2), and 1% nickel sulfate in 0.175 M sodium acetate solution. After staining, the slides were rinsed with water, and positively stained cells had dark blue to black round nuclei. For observation with high magnification and for counting the number of TUNEL-positive cells, staining was visualized using 0.025% DAB, 0.075% H2O2 in PBS, and then the slides were rinsed with water and counterstained with methyl green.
To assess the degree of DNA fragmentation between wild-type and SOD-1 Tg mice after KA treatment, TUNEL-positive cells were counted in the CA1 and CA3 pyramidal cell layer. TUNEL-positive cells and TUNEL-negative, methyl green-stained cells were counted in X400 magnification. The TUNEL-positive cell number was expressed as percentage of total cell number.
Lectin staining
Macrophages or microglia or both were stained by lectin as previously described by Streit (1990) with some modification. Frozen brain sections were fixed for 30 min with 3.7% formalin in PBS. After quenching endogenous peroxidase activity for 10 min with 2% H2O2 and 100 mM NaN3 in PBS, the slides were incubated for 120 min with 40 μg/ml of isolectin B4 labled with peroxidase (Sigma). Then staining was visualized using 0.05% DAB, 0.01% H2O2, in 50 mM Tris buffer (pH 7.2). Negative controls were performed using working-strength isolectin B4 solution, which had been incubated for 30 min with 200 mM
In situ hybridization for mRNA
In situ hybridization for c-fos, c-jun, and hsp70 mRNAs was performed using the previously described method of Schalling et al. (1988) with some modifications. The slides were hybridized in hybridization buffer at 37°C for 18 h with X1 106 cpm of a 35S-labeled synthetic oligonucleotide probe as previously described (Kinouchi et al., 1993). The oligonucleotide probes of c-fos (45 mer), c-jun (48 mer), and hsp70 (24 mer) correspond to highly conserved amino acids 1–15 of the fos protein (Sharp et al., 1993), 186–201 of the jun protein (Ryseck et al., 1988), and 122–129 of the HSP70 (Hunt and Morimoto, 1985) coding sequence. After hybridization, the sections were rinsed in SSC at 52°C for 120 min, with several changes of the SSC, dehydrated, and exposed to Kodak SB-5 film for a week.
RESULTS
Neurological findings
Seizures following intraperitoneal injections of KA (30 or 50 mg/kg) generally began within 30 min of the injection. With the lower dose of KA (30 mg/kg), most (68% and 72%, respectively) of the wild-type and SOD-1 Tg animals had mild seizures (Table 1), whereas after the higher does of KA (50 mg/kg) most of the mice (86% and 85%, respectively) had more prolonged and more severe seizures (Table 1). There were no significant differences in the seizure grade between wild-type and SOD-1 Tg at either the low or high dose of KA (KA 30 mg/kg, p = 0.31; KA 50 mg/kg, p = 0.83, Mann-Whitney U-test). About 20% of the mice that received the 30 mg/kg dose of KA and nearly half of the animals that received the 50 mg/kg dose died (Table 1), although there were no differences in mortality between wild-type and SOD-1 Tg mice at either the low or high dose of KA (KA 30 mg/kg, p = 0.63; KA 50 mg/kg, p = 0.84, chi-square measurement).
Neurological findings of wild-type and SOD-1 Tg mice after KA administration a
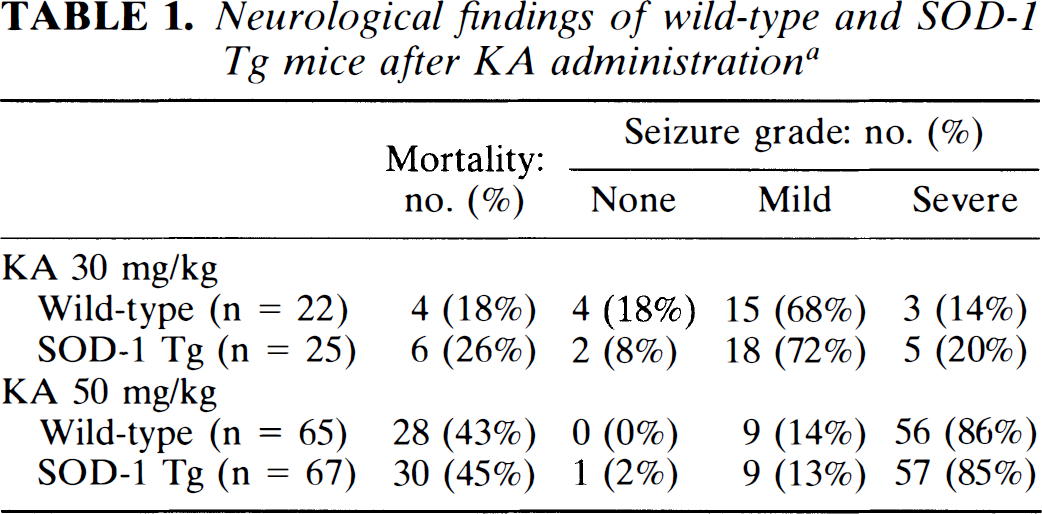
KA, kainic acid; SOD-1, CuZn-superoxide dismutase; Tg, transgenic.
Mortality and neurological findings were investigated in 30 or 50 mg/kg of KA treatment. Each column shows actual number of animals and the percentage in total number of animals. Seizure grades were divided into three groups: None, no observable change; mild, mild seizure; severe, severe seizure (see Materials and Methods for details). No significant differences were observed between wild-type and SOD-1 Tg mice, in both mortality and seizure grade.
Neuropathology
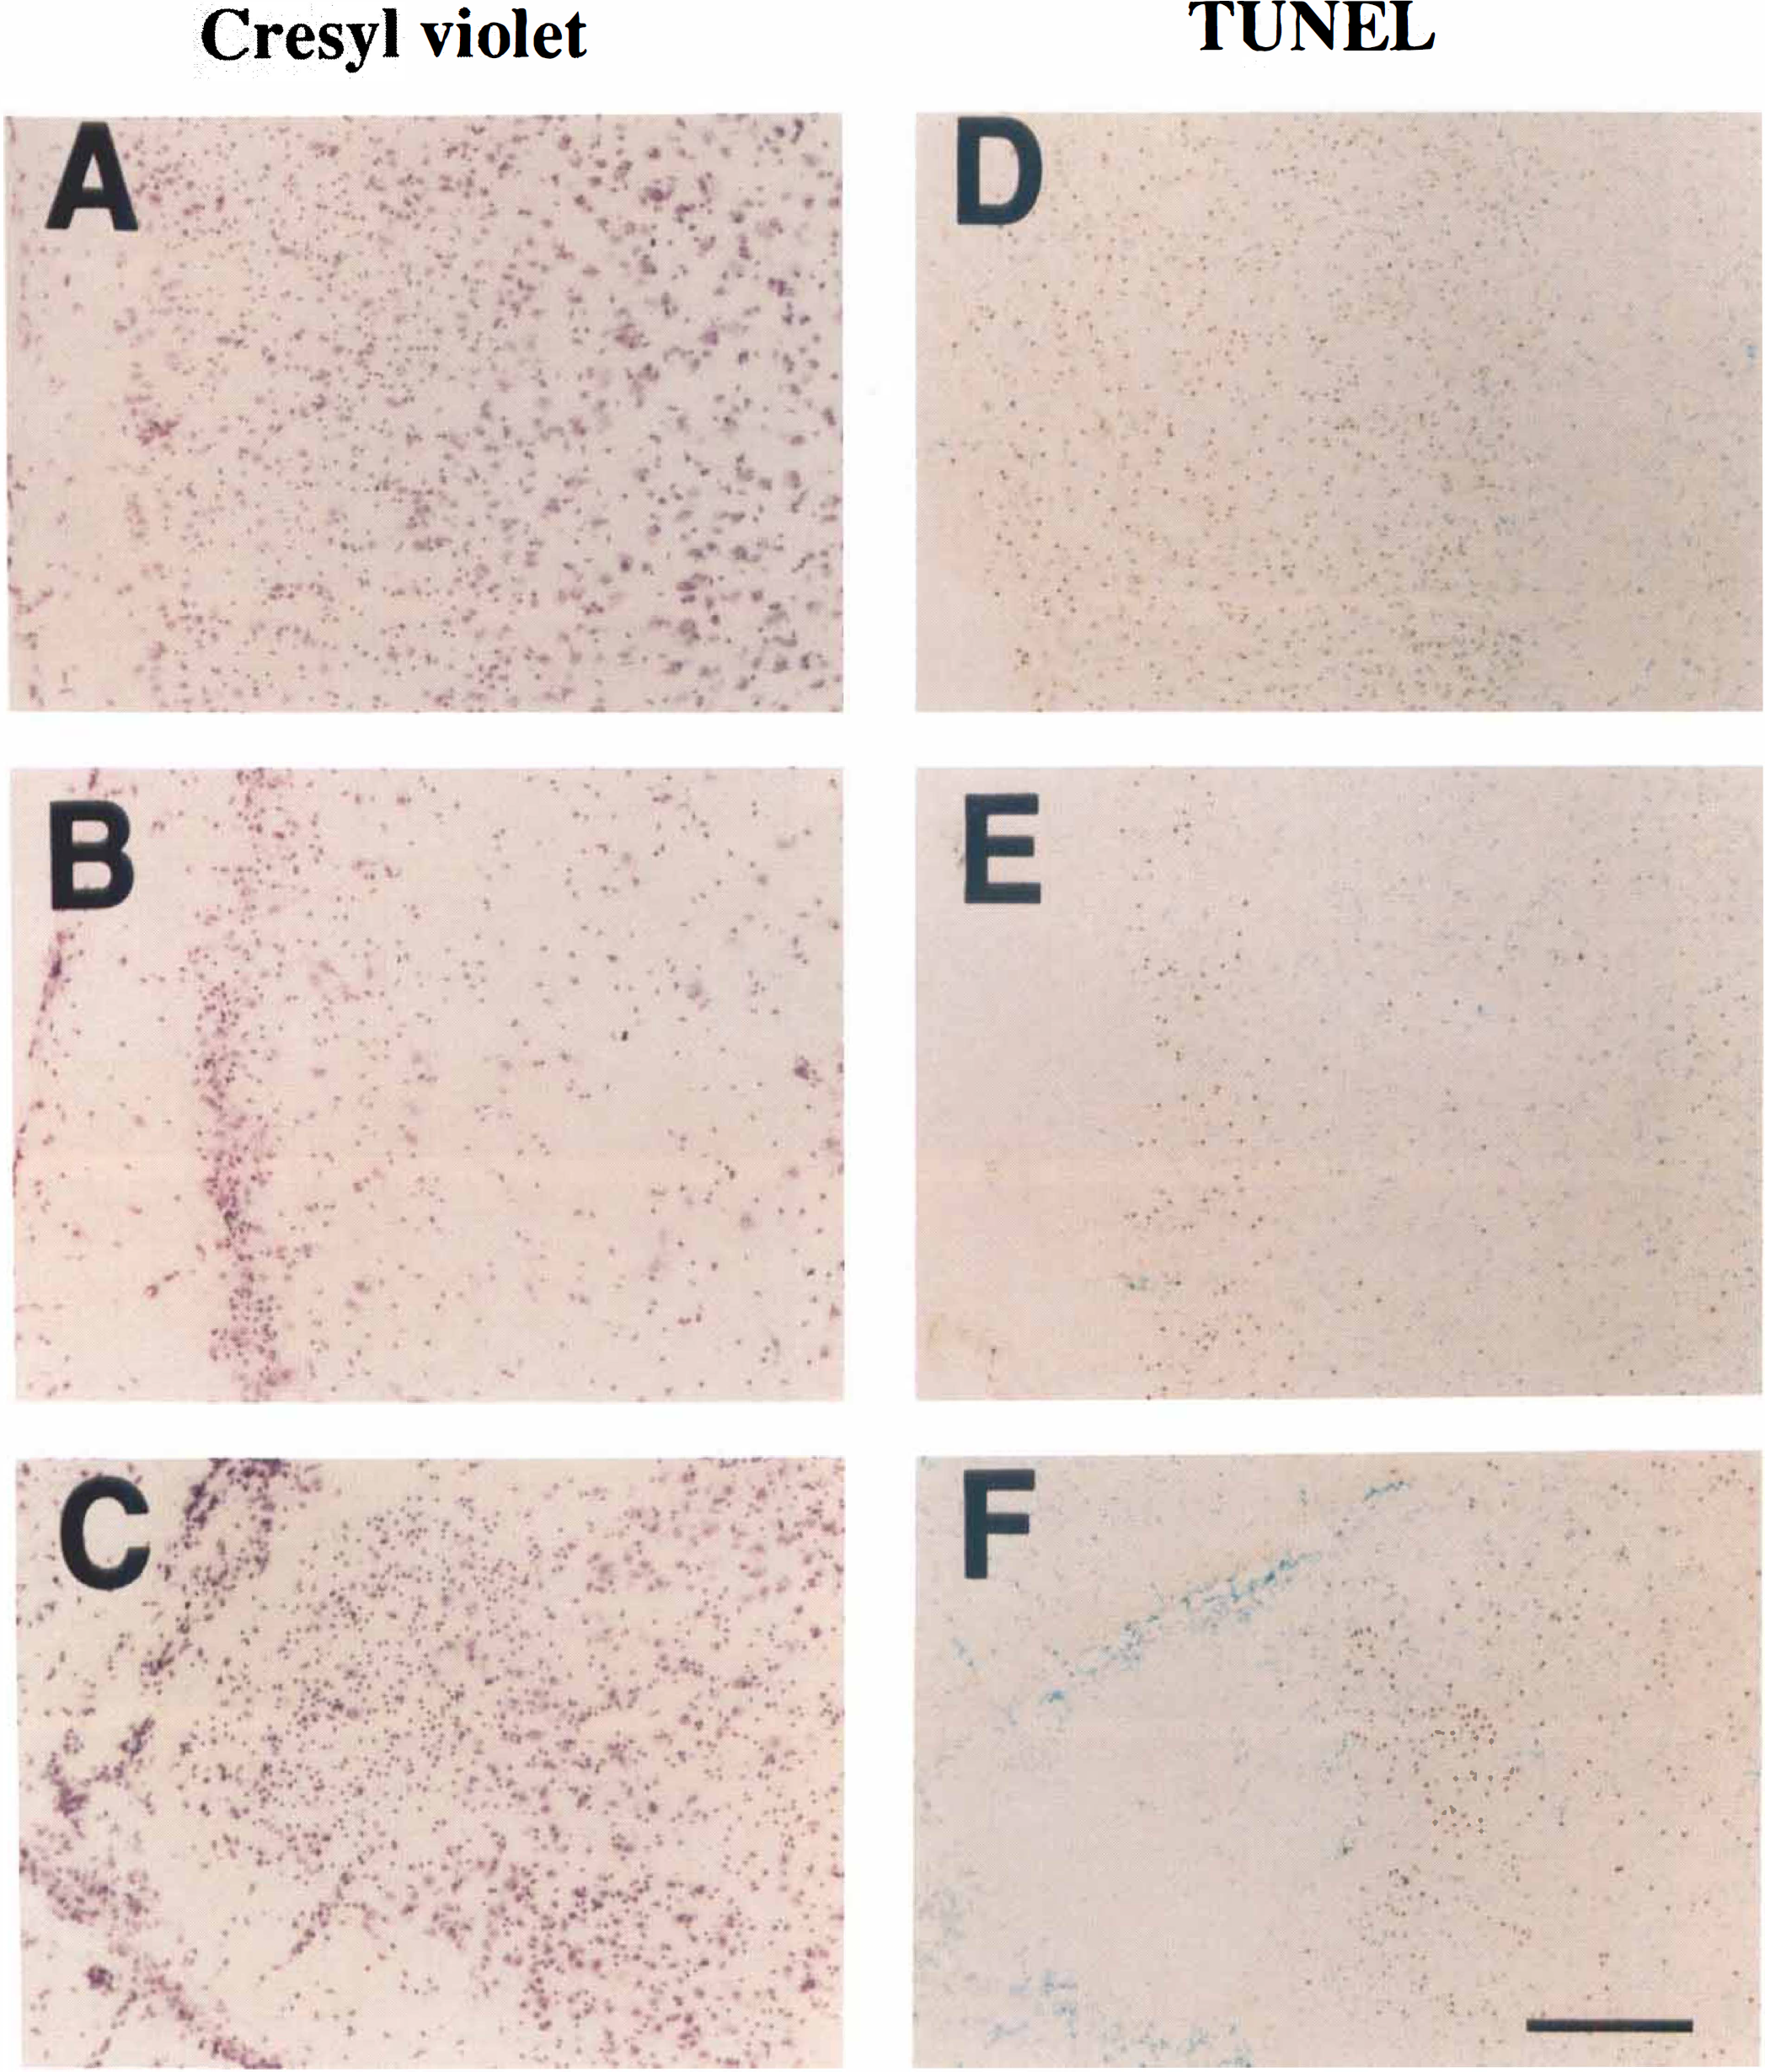
As illustrated in Fig. 1, the distribution of the KA-induced hippocampal neuronal cell damage in wild-type mice depended on the seizure grades. Hippocampal neuronal cell death was localized in the CA3a sector in the mild seizure group (Fig. 1A–C). Cell death extended to the CA1 and CA3b regions of the hippocampus in the severe seizure group (Fig. 1D–F). The neurons of both CA2 and the granular layer of the dentate gyrus were insensitive to KA-induced damage (Fig. 1).
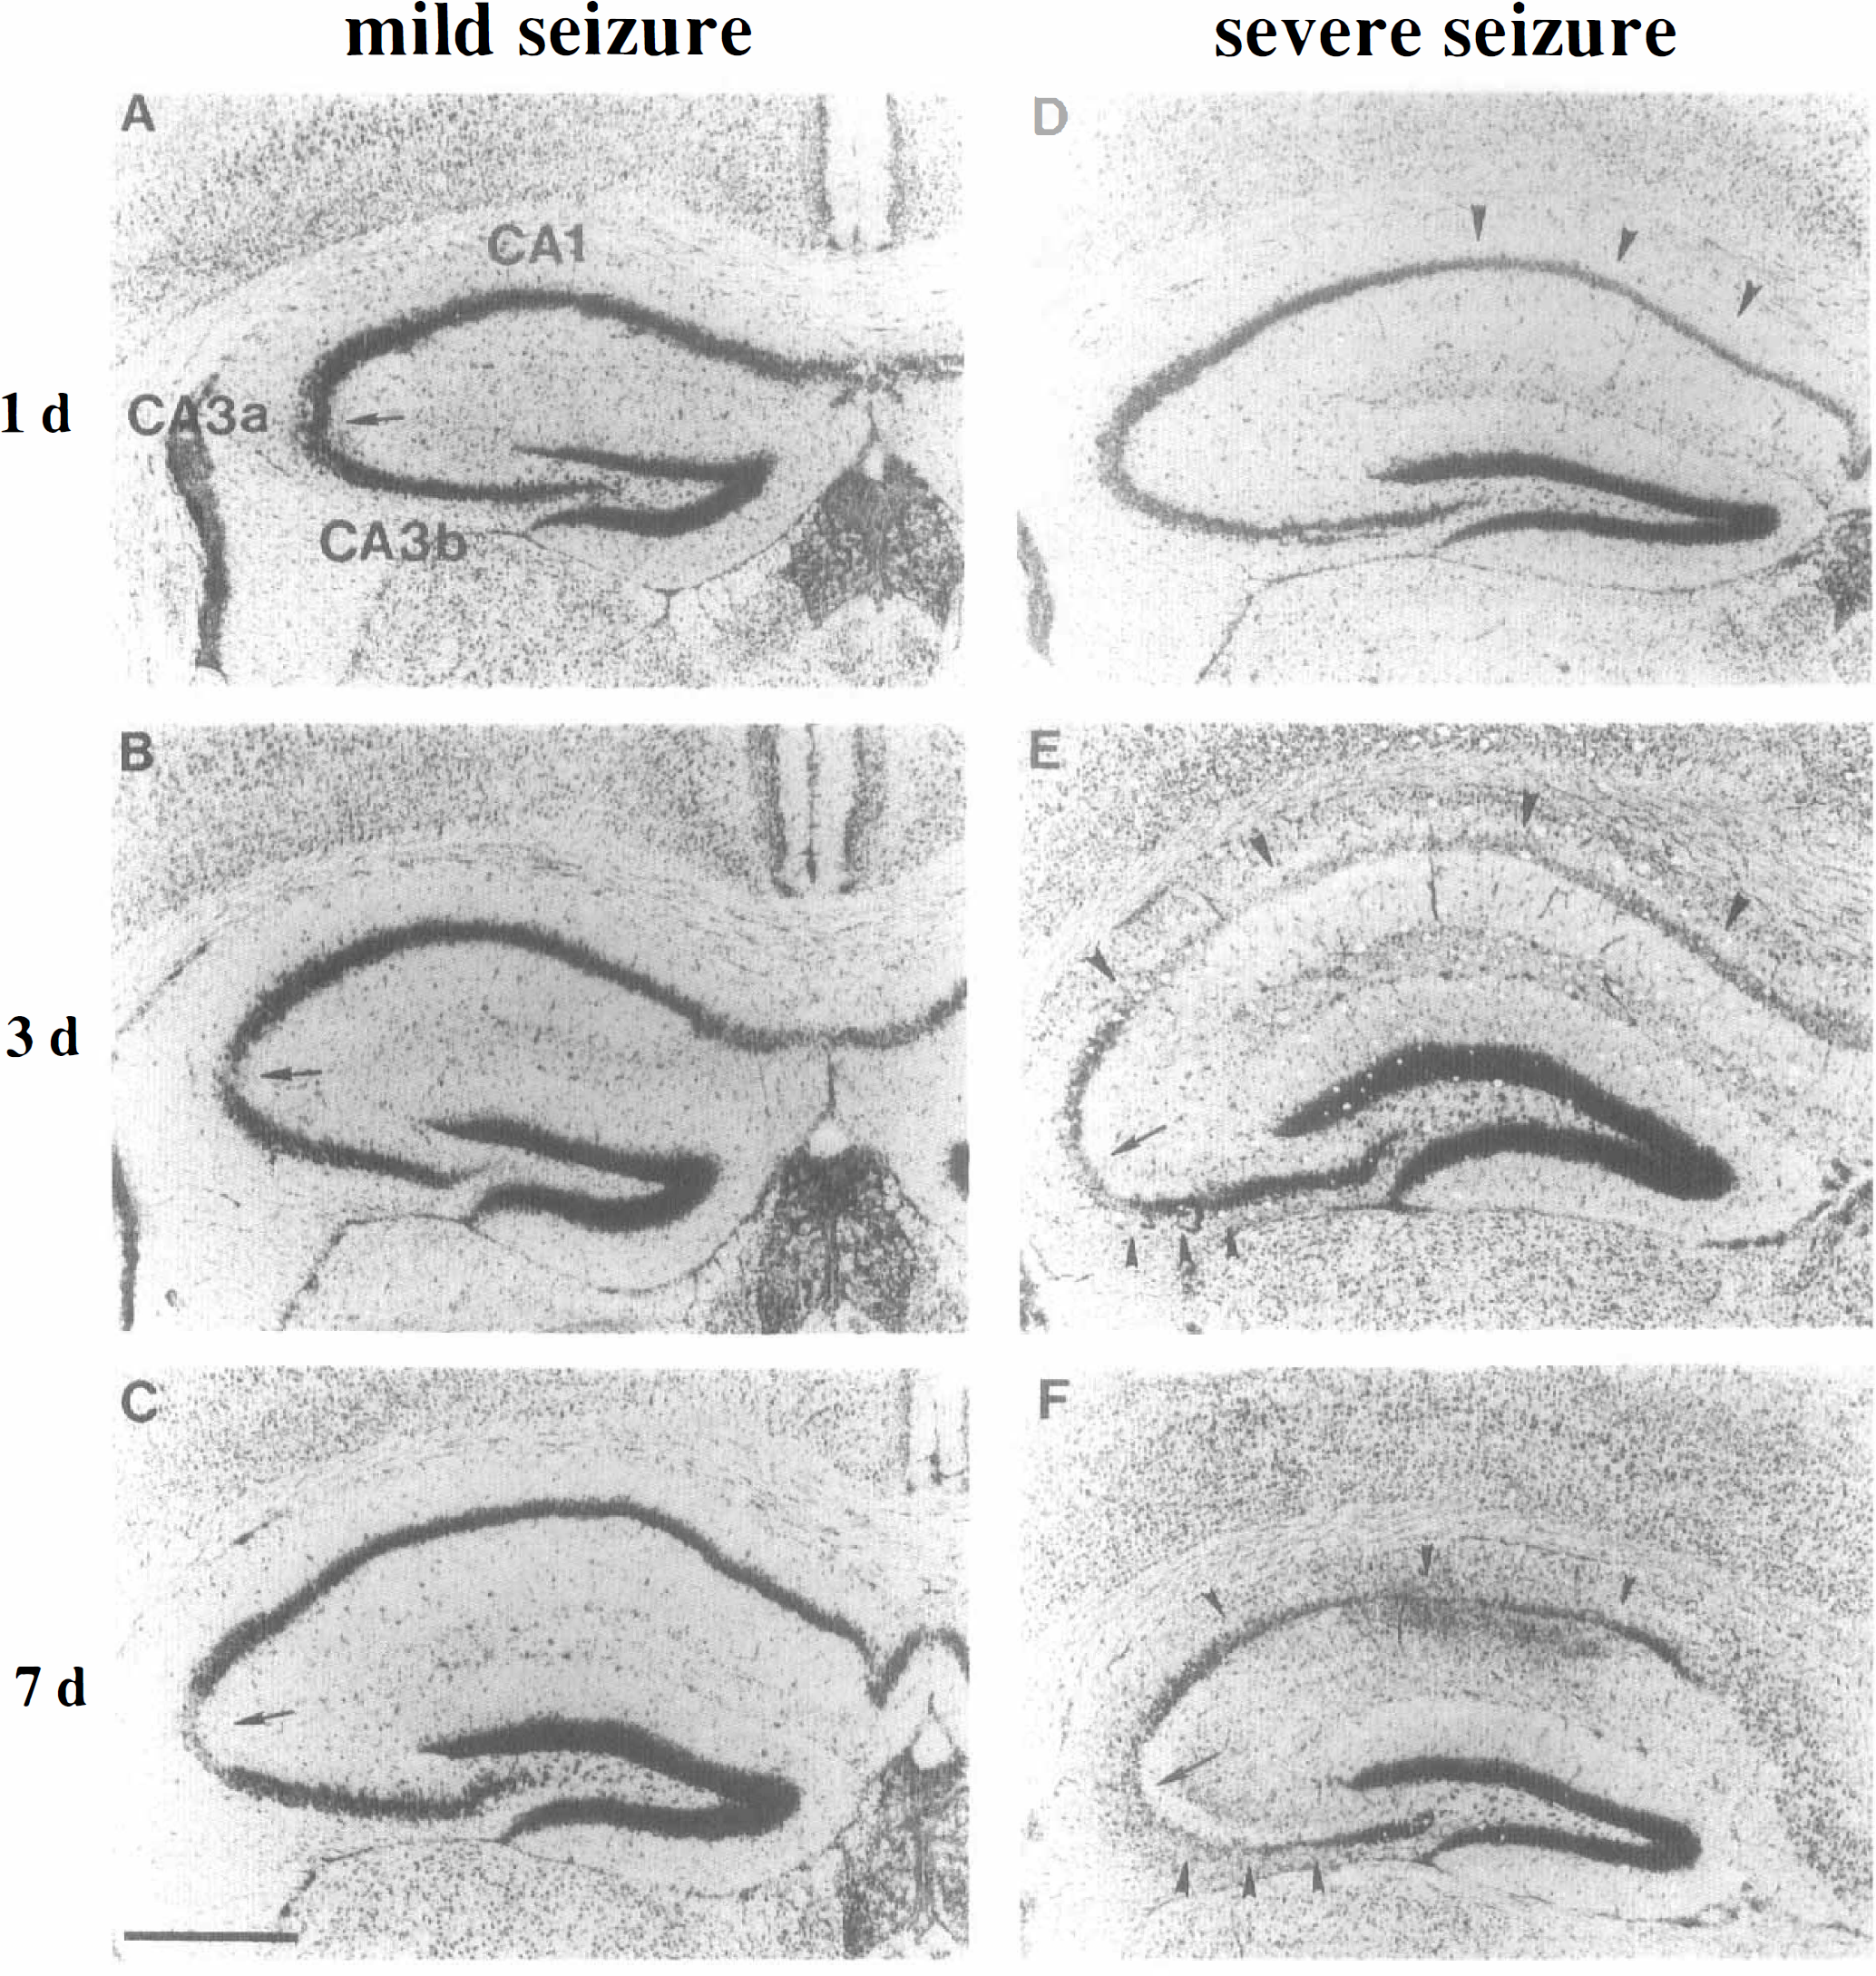
Histopathological findings in the hippocampus of wild-type mice after 50 mg/kg kainic acid (KA) treatment. Coronal frozen sections (20 μm) stained with cresyl violet at 1 day (
Histological analysis in the hippocampus between wild-type and SOD-1 Tg mice is shown in Fig. 2 and summarized in Table 2. Temporal resolution of the CA1 neuronal cells showed no observable damages 14 h after KA treatment both in wild-type and SOD-1 Tg mice (Fig. 2A and E). Some neuronal subpopulations showed cellular shrinkage 1 day after KA treatment both in wild-type and SOD-1 Tg mice (Fig. 2B and F). The number of damaged cells showing a shrunken shape increased 3 days after KA treatment (Fig. 2C and G), and CA1 showed loss of cellular morhpology 7 days after KA treatment both in wild-type and SOD-1 Tg mice (Fig. 2D and H). There were no significant differences in the cellular damage between wild-type and SOD-1 Tg animals in the whole hippocampal regions (Table 2).
Hippocampal histological findings of wild-type and SOD-1 Tg mice after 50 mg/kg KA treatment a
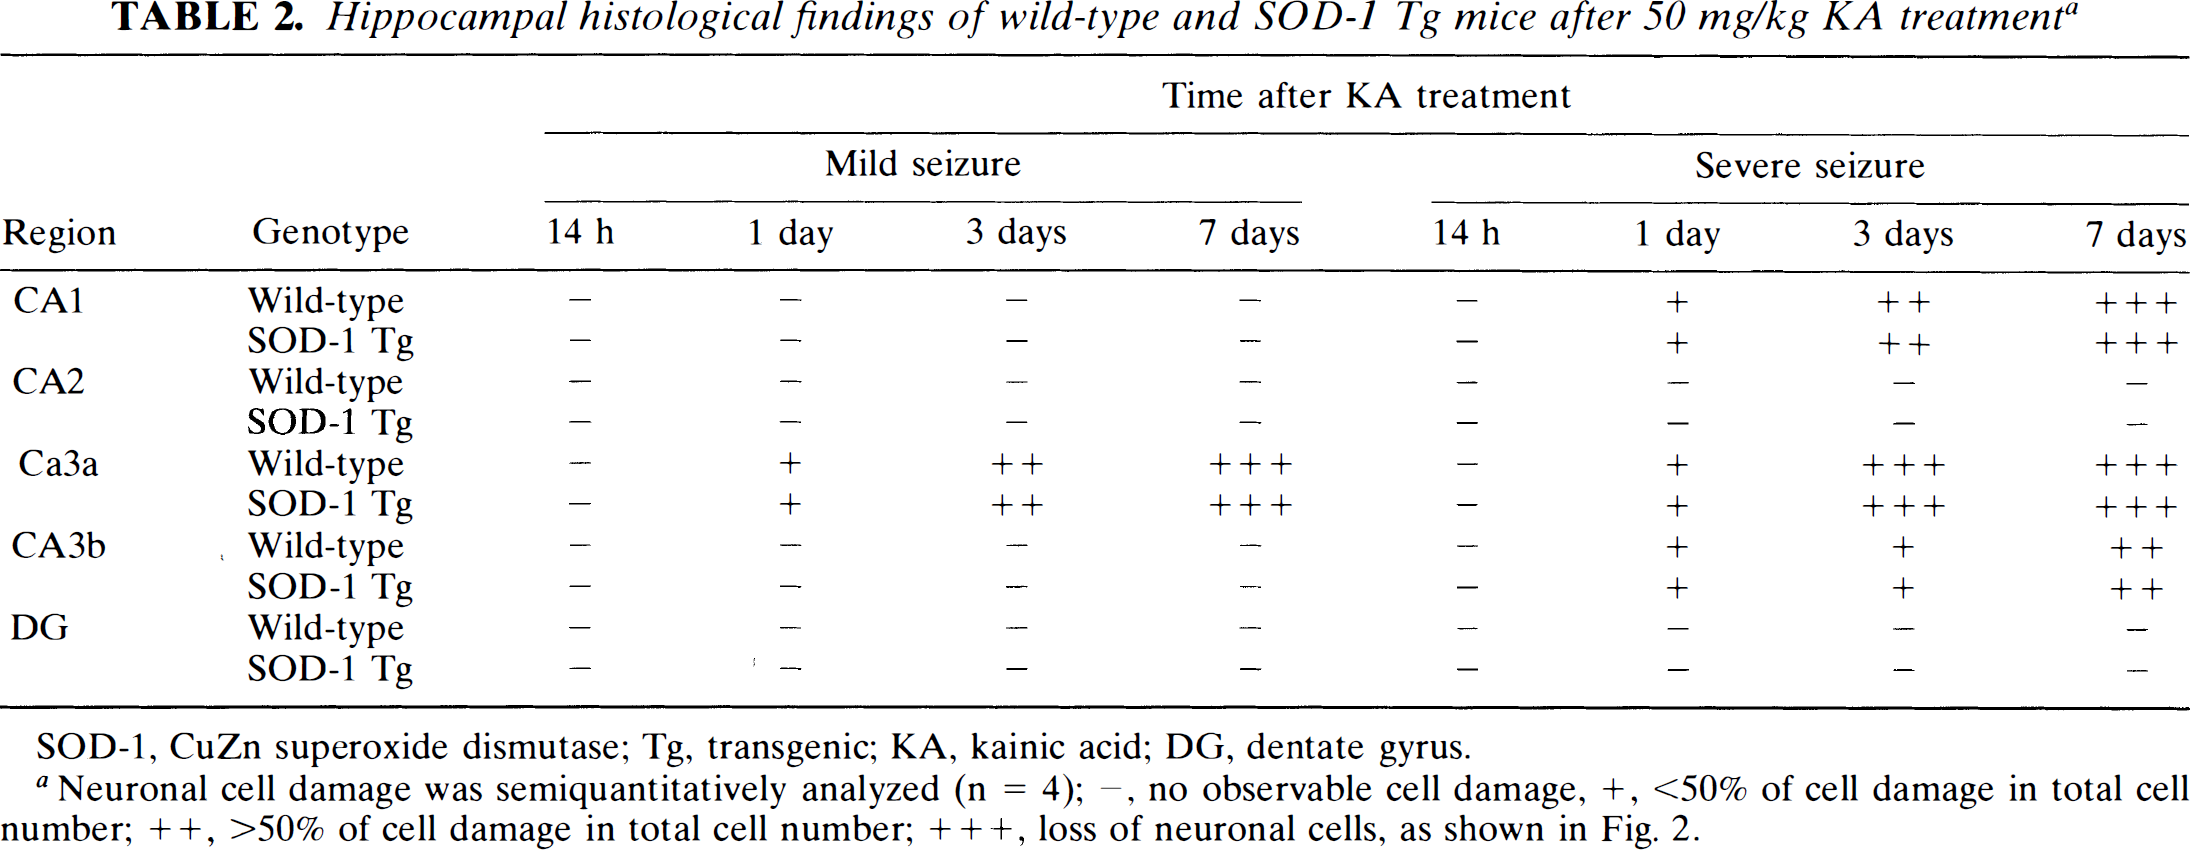
SOD-1, CuZn supcroxide dismutase; Tg, transgenic; KA, kainic acid; DG, dentate gyrus.
Neuronal cell damage was semiquantitatively analyzed (n = 4); –, no observable cell damage, +, <50% of cell damage in total cell number; + +, >50% of cell damage in total cell number; + + +, loss of neuronal cells, as shown in Fig. 2.
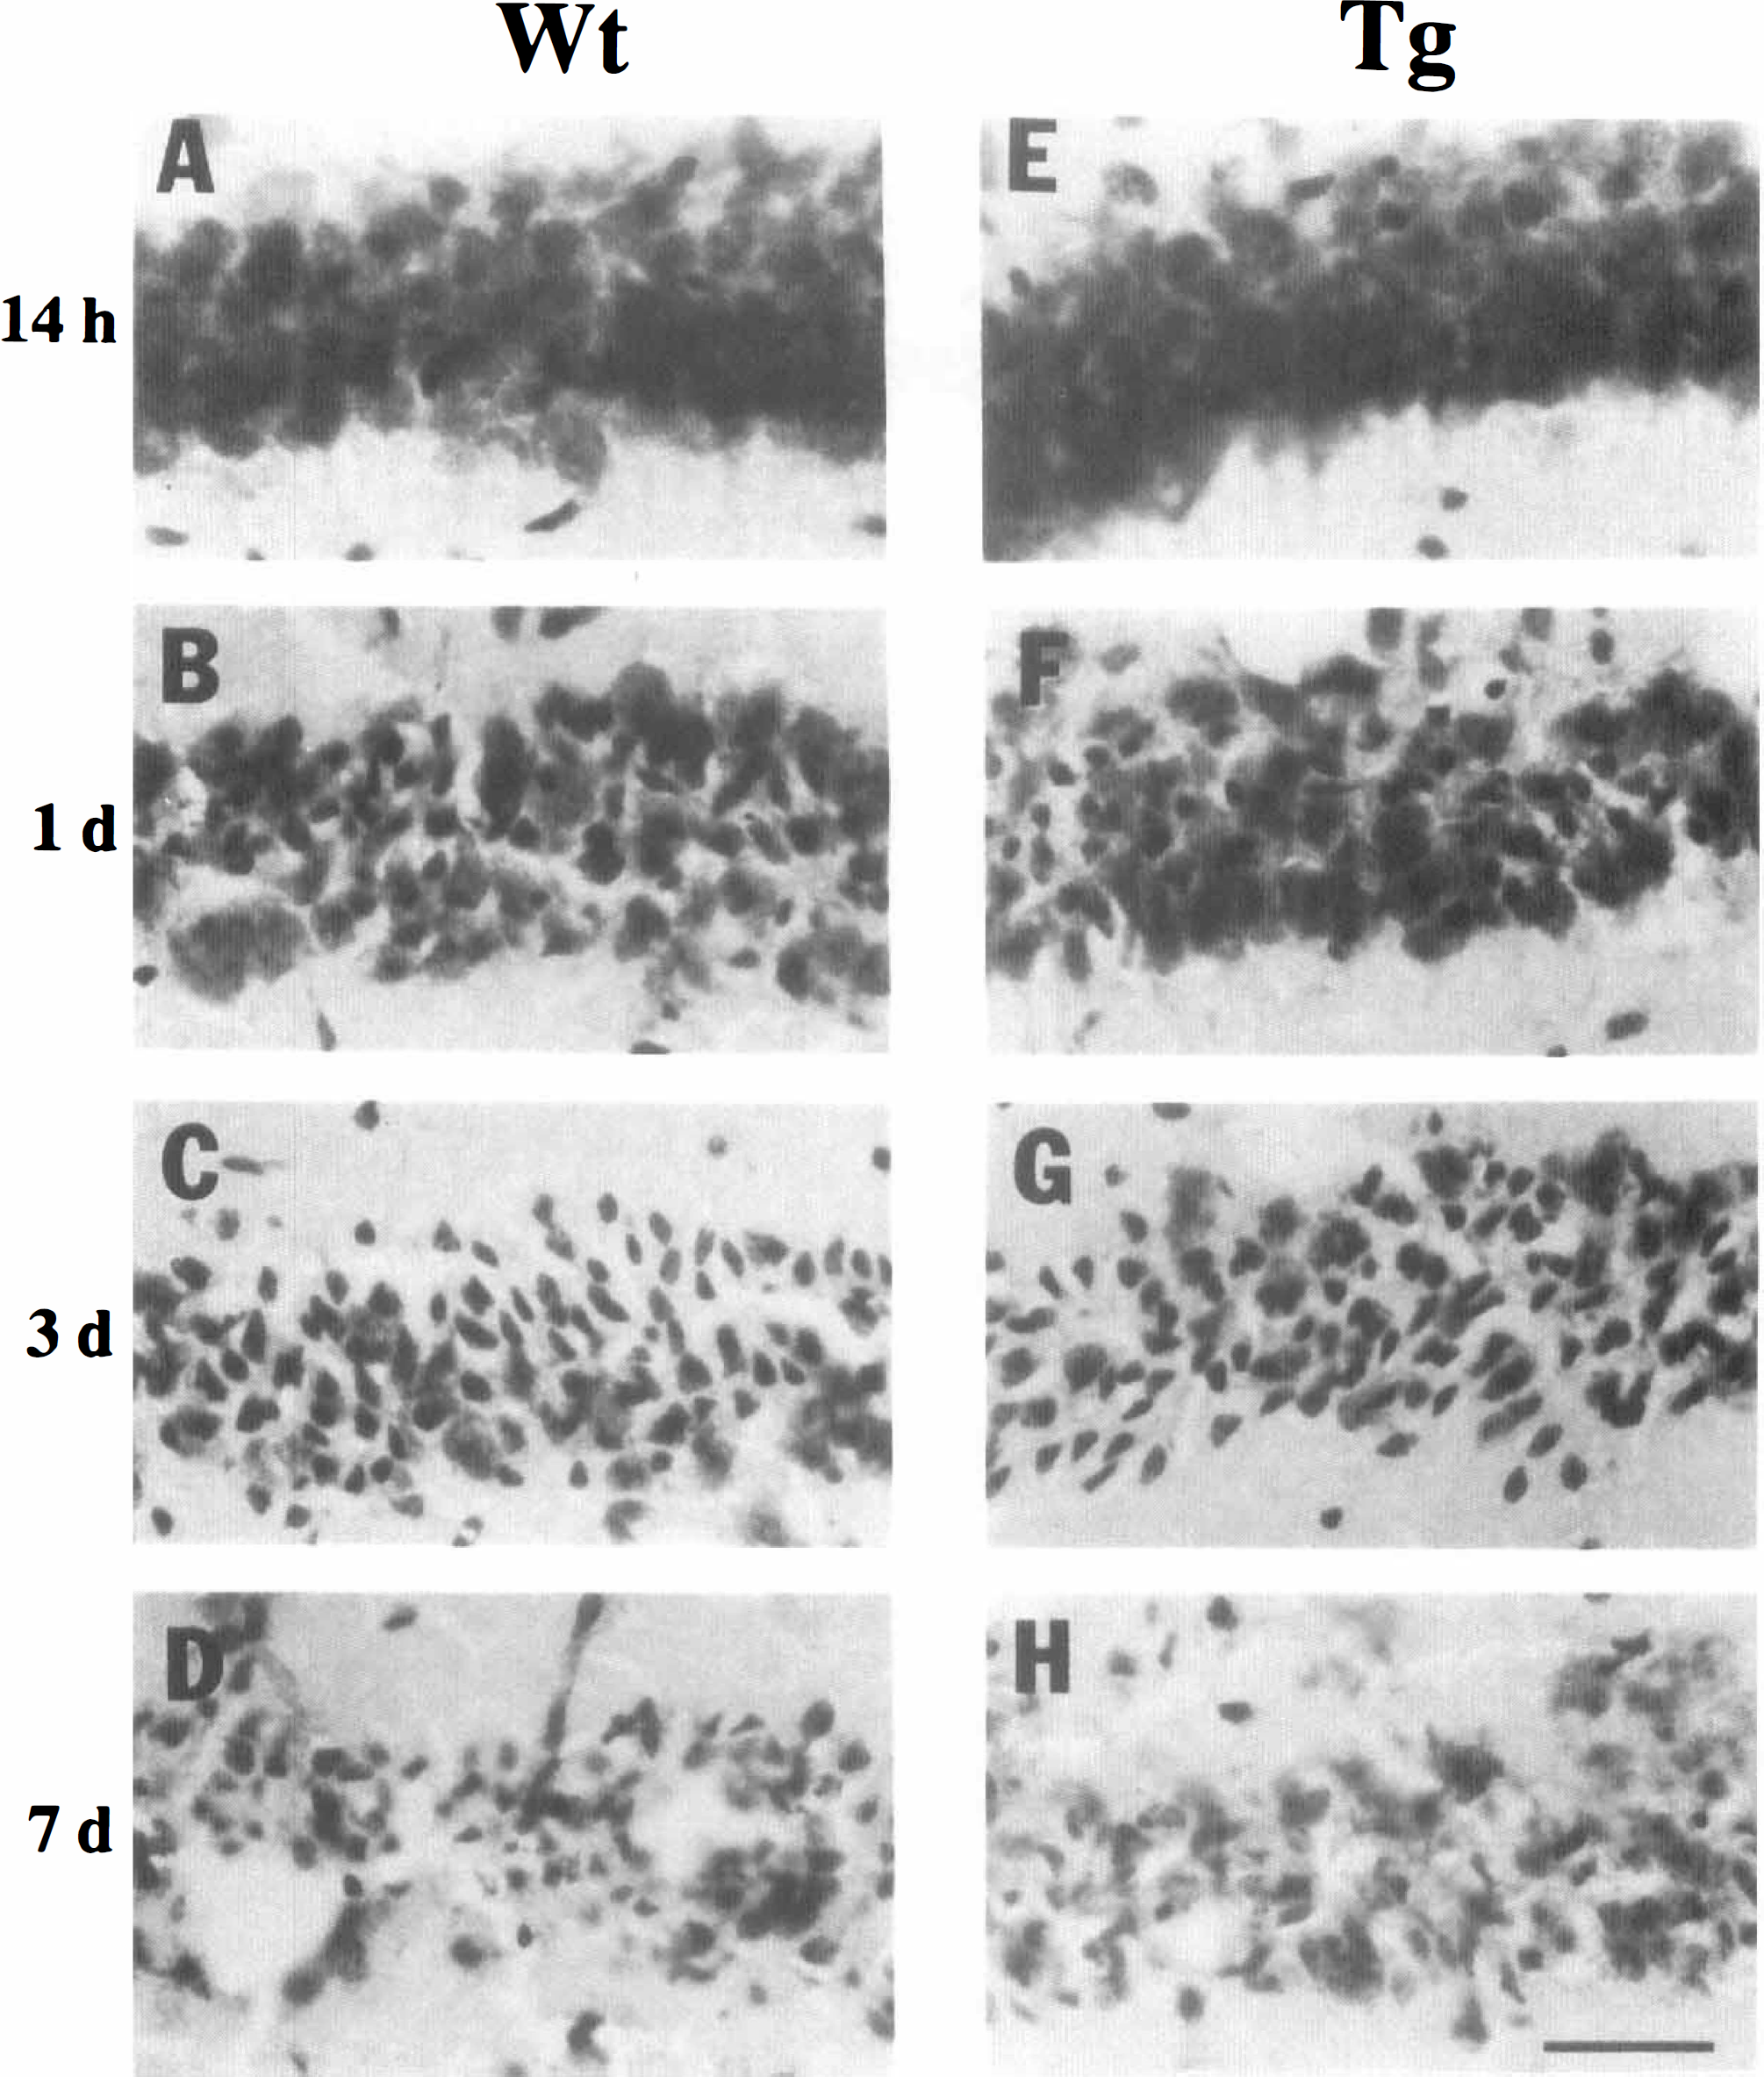
Temporal resolution of histopathological changes in CA1 of wild-type (Wt) and CuZn-superoxide dismutase (SOD-1) transgenic (Tg) in severe seizure group following 50 mg/kg kainic acid (KA) treatment. Coronal frozen sections (20 μm) stained with cresyl violet at 14 h (
Neuronal cell damage was also detected at 3 and 7 days in the parietal cortex (Fig. 3A), the piriform cortex (Fig. 3B), the amygdala (Fig. 3C), the hypothalamus (not shown), and the thalamus (not shown) in subjects with severe seizures, but not in those with mild seizures. There were also no observable differences in neuronal cell damage between the wild-type and SOD-1 Tg mice in regions other than the hippocampus.
Histopathological changes of wild-type mice in the parietal cortex, the piriform cortex, and the amygdala in the severe seizure group following 50 mg/kg kainic acid (KA) treatment. KA-induced neuronal cell damage was observed in the parietal cortex (
TUNEL staining and lectin staining
The characteristics of the TUNEL-positive cells in wild-type mice after KA treatment are represented in Figs. 3, 4, and 5. TUNEL-positive neurons were not generally detected in the hippocampus or other regions in the normal brain (Fig. 4A) or in the subjects that had mild seizures. In the severe seizure group, TUNEL-positive cells were first observed in the pyramidal neurons of CA1 at 1 day after KA treatment (Fig. 4B). By 3 days after severe seizures, TUNEL-positive neurons were maximal and detectable in pyramidal neurons in CA1 and CA3b sectors of the hippocampus (Fig. 4C). The TUNEL-positive neurons in CA1 and CA3b were densely labeled in their nuclei, accompanied by small particles that resembled apoptotic bodies, which were also markedly labeled by the staining around the nuclei (Fig. 5A and F). Some neuronal cells in CA1 showed different types of chromatin condensation around the margin of the nucleus, forming either crescentic caps or rings (Fig. 5B). Using H & E staining, these neuronal cells showed cellular shrinkage and chromatin condensation in the nuclei (Fig. 5C and G). Although marked cellular damage occurred in the CA3a sector of the hippocampus in the mild seizure and severe seizure groups (Table 2, Fig. 1), typical TUNEL-stained cells were not present in the CA3a sector in either group at any time after the seizures; however, there were some light, diffusely TUNEL-stained cells in the CA3a sector (Fig. 5D), and these cells showed cellular swelling and nuclear lysis by H & E staining (Fig. 5E), which were consistent with the necrotic cell death process. Most of the TUNEL-positive neurons in CA1 and CA3b disappeared by 7 days after KA treatment (Fig. 4D). Other brain regions outside the hippocampus displayed TUNEL-positive cells in the parietal cortex (Fig. 3D), piriform cortex (Fig. 3E), and the amygdala (Fig. 3F). These TUNEL-positive neurons occurred in subjects with severe seizures, were maximal at 3 days, and decreased at 7 days following KA treatment.
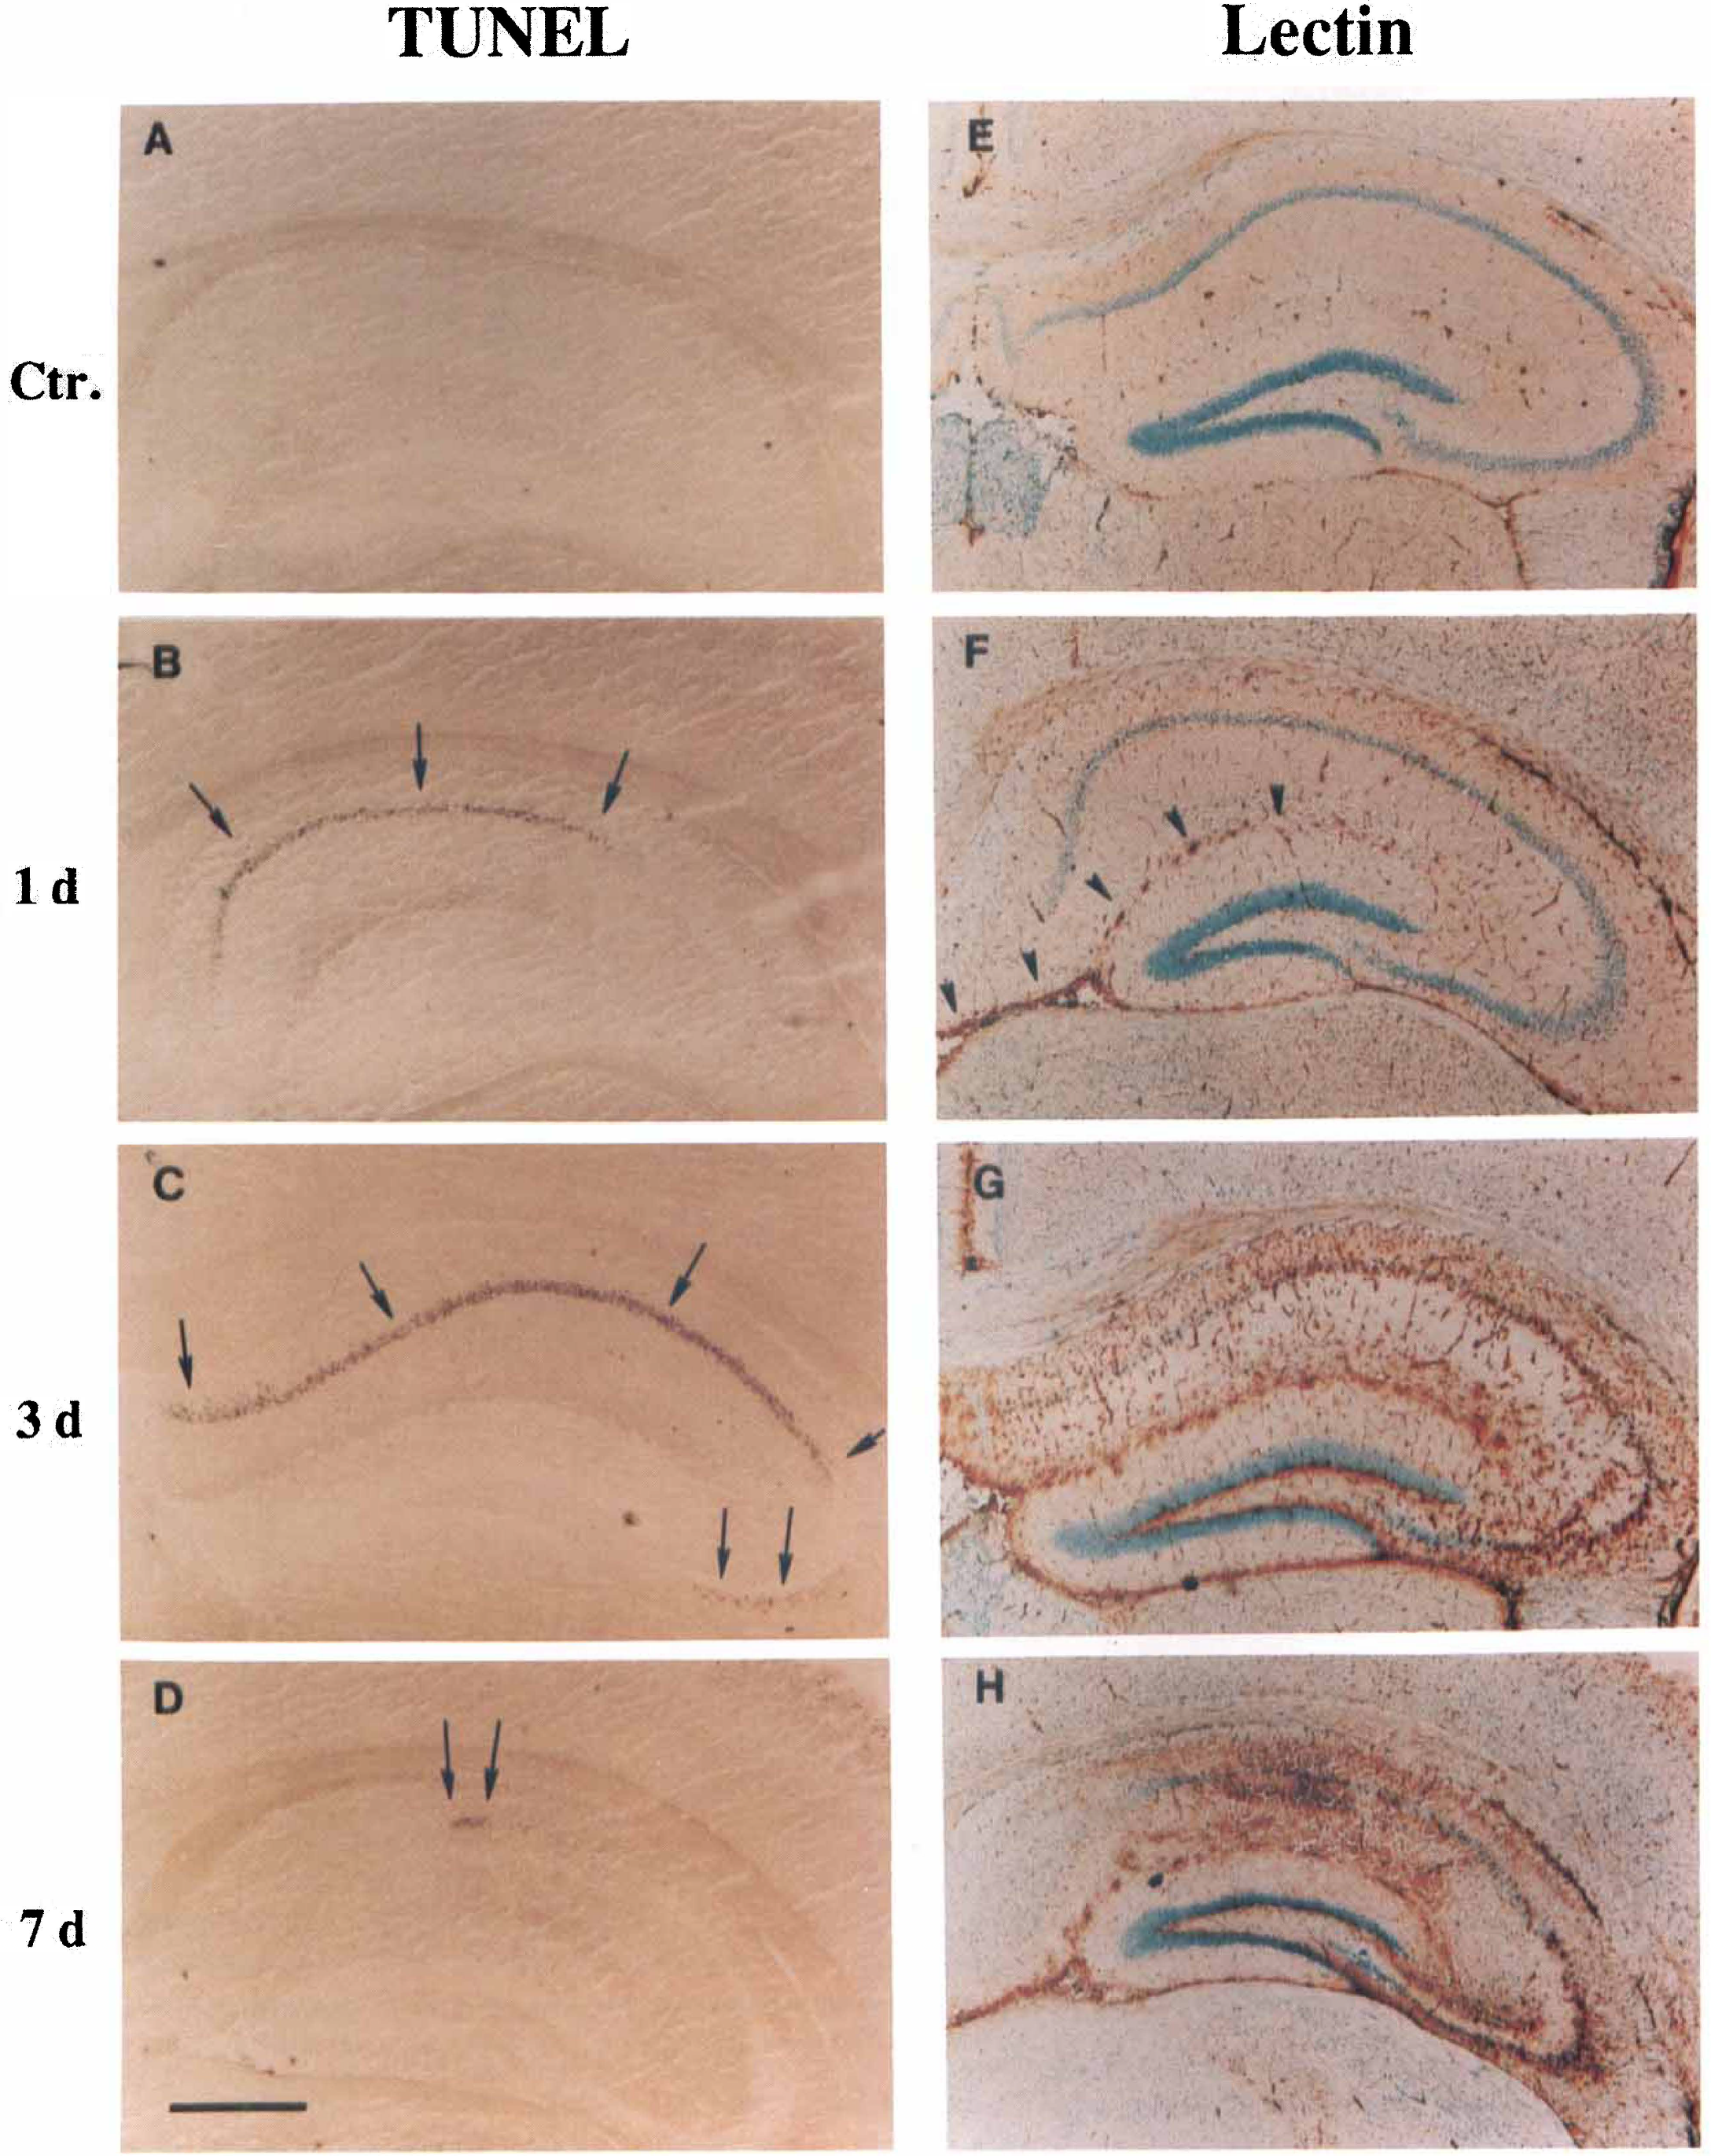
TUNEL staining and lectin staining of the hippocampus in the severe seizure group following 50 mg/kg KA treatment in wild-type mice. Coronal hippocampal sections (20 μm) stained by TUNEL technique (
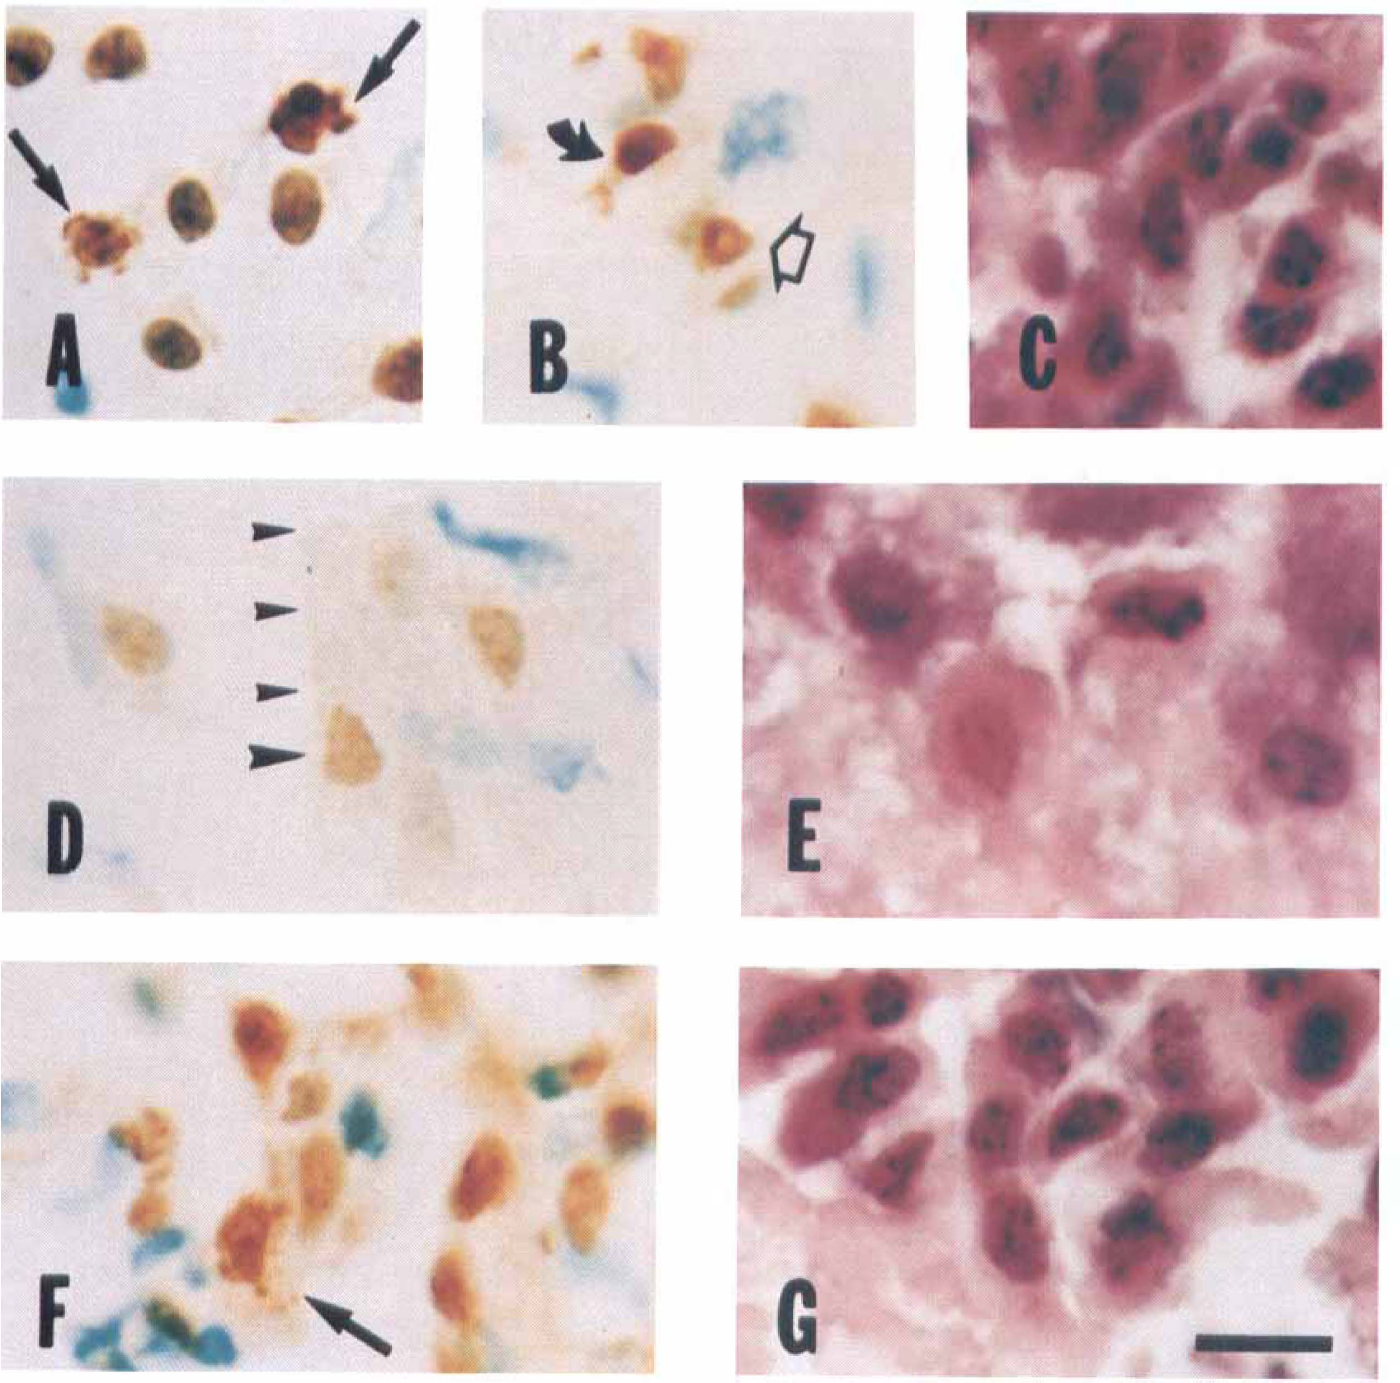
Differential response in TUNEL staining of the hippocampal neurons in the severe seizure group following 50 mg/kg kainic acid (KA) treatment in wild-type mice. TUNEL staining shows characteristic features of chromatin condensation in the nuclei, accompanied by apoptotic body (arrows) in CA1 (
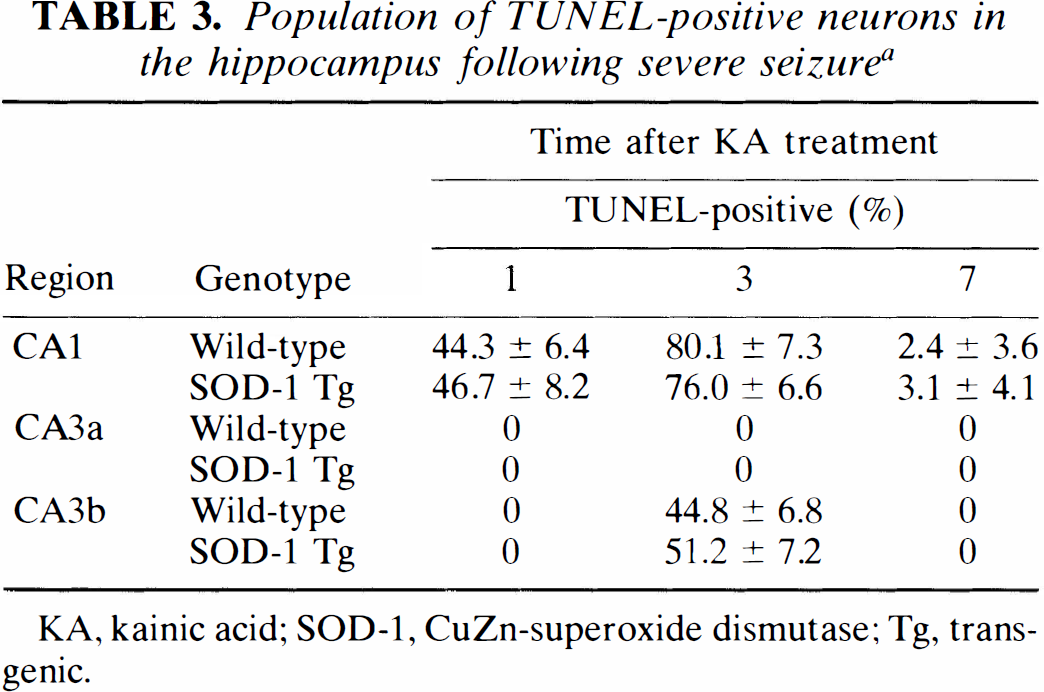
The distribution and the temporal resolution of TUNEL-positive cells were compared between wild-type and SOD-1 Tg mice after KA treatment. There were no observable differences in TUNEL-positive cells of the hippocampus or other brain regions between wild-type and SOD-1 Tg mice. There were also no significant differences in the number of TUNEL-positive neurons in the CA1 and CA3b regions of the hippocampus 1 to 7 days after severe seizures in the SOD-1 Tg compared with wild-type animals (Table 3).
Population of TUNEL-positive neurons in the hippocampus following severe seizure a
KA, kainic acid; SOD-1, CuZn-superoxide dismutase; Tg, transgenic.
Data show mean ± SD of percentage of TUNEL-positive cells in the total number of cells (n = 4). No significant differences were observed between wild-type and SOD-1 Tg mice.
Lectin staining, which should detect mainly microglia or macrophages, showed some lectin stained endothelial cells in the hippocampus of control animals (Fig. 4E). One day after KA treatment, there was some increase in lectin staining localized mainly to the hippocampal fissure (Fig. 4F). Lectin staining increased markedly by 3 days after KA treatment (Fig. 4G) and included stained cells in the pyramidal layers of CA1 and CA3 as well as stained cells throughout the hippocampal lamina adjacent to the pyramidal cells. Very dense stained cells were localized to CA1 and CA3 by 7 days after KA treatment (Fig. 4H) and probably represent activated microglia or macrophages surrounding dead or dying cells. No significant differences were detected between wild-type and SOD-1 Tg animals in the distribution of the lectin-positive cells.
In situ hybridization
The distribution of c-fos and c-jun mRNA (Fig. 6, Table 4) and hsp70 mRNA (Fig. 7, Table 5) was assessed at 0, 1, 4, 14, and 24 h in the severe seizure group after 50 mg/kg KA treatment. There was little detectable c-fos and hsp70 mRNA, and c-jun mRNA was detectable in the dentate gyrus and the piriform cortex at 0 h after KA injection.
c-fos and c-jun mRNA expression following severe seizure a
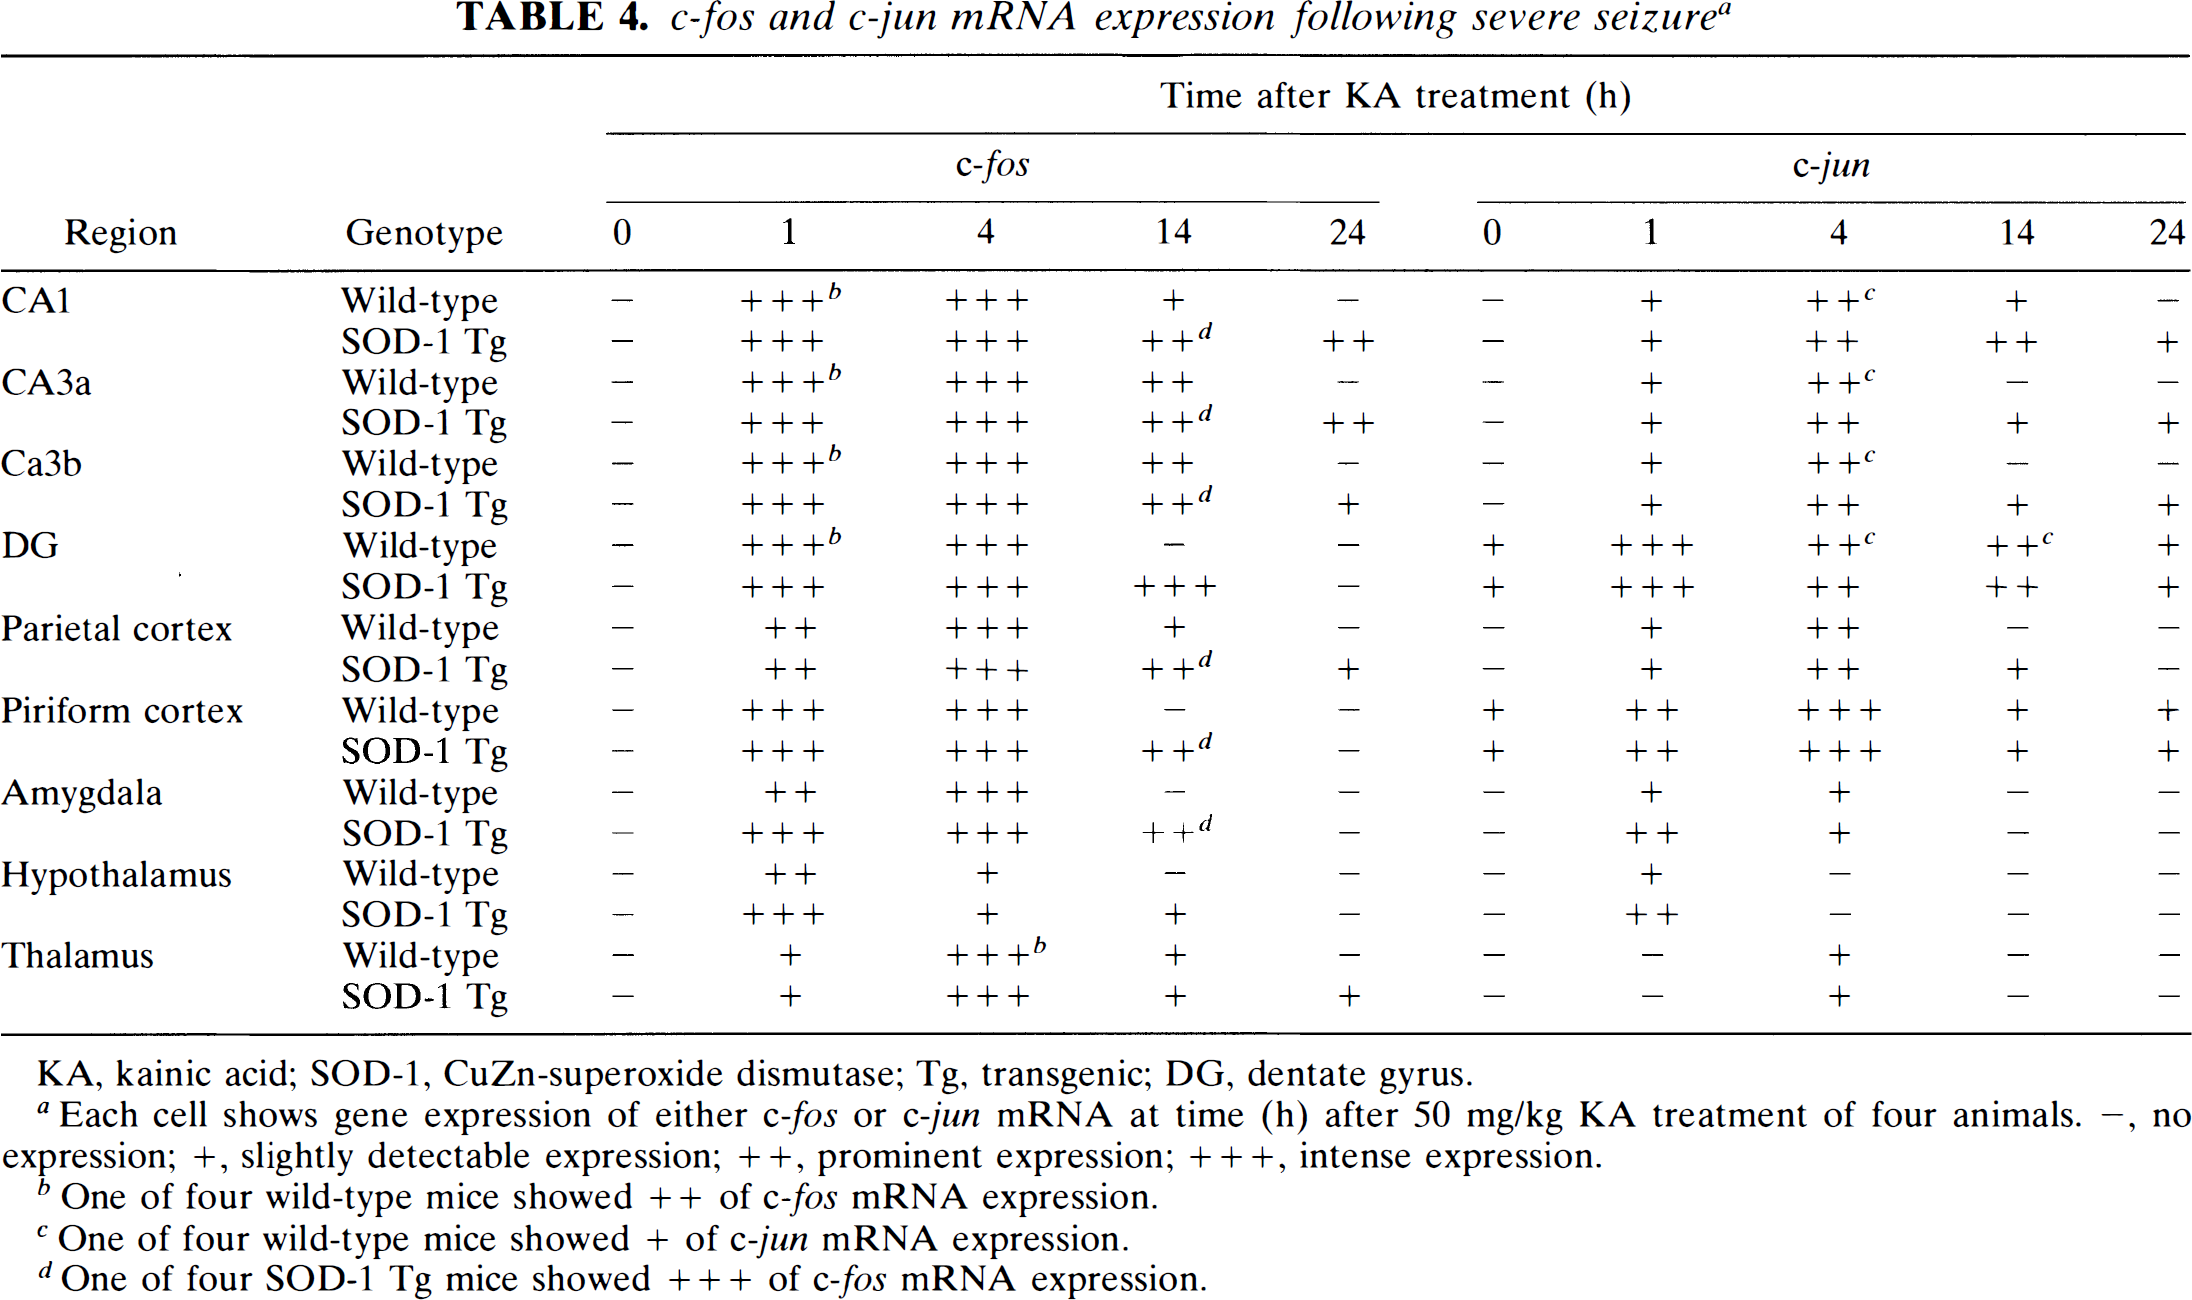
KA, kainic acid; SOD-1, CuZn-superoxide dismutase; Tg, transgenic; DG, dentate gyrus.
Each cell shows gene expression of either c-fos or c-jun mRNA at time (h) after 50 mg/kg KA treatment of four animals. –, no expression; +, slightly detectable expression; ++, prominent expression; + + +, intense expression.
One of four wild-type mice showed ++ of c-fos mRNA expression.
One of four wild-type mice showed + of c-jun mRNA expression.
One of four SOD-1 Tg mice showed + + + of c-fos mRNA expression.
hsp70 mRNA expression following severe seizure a
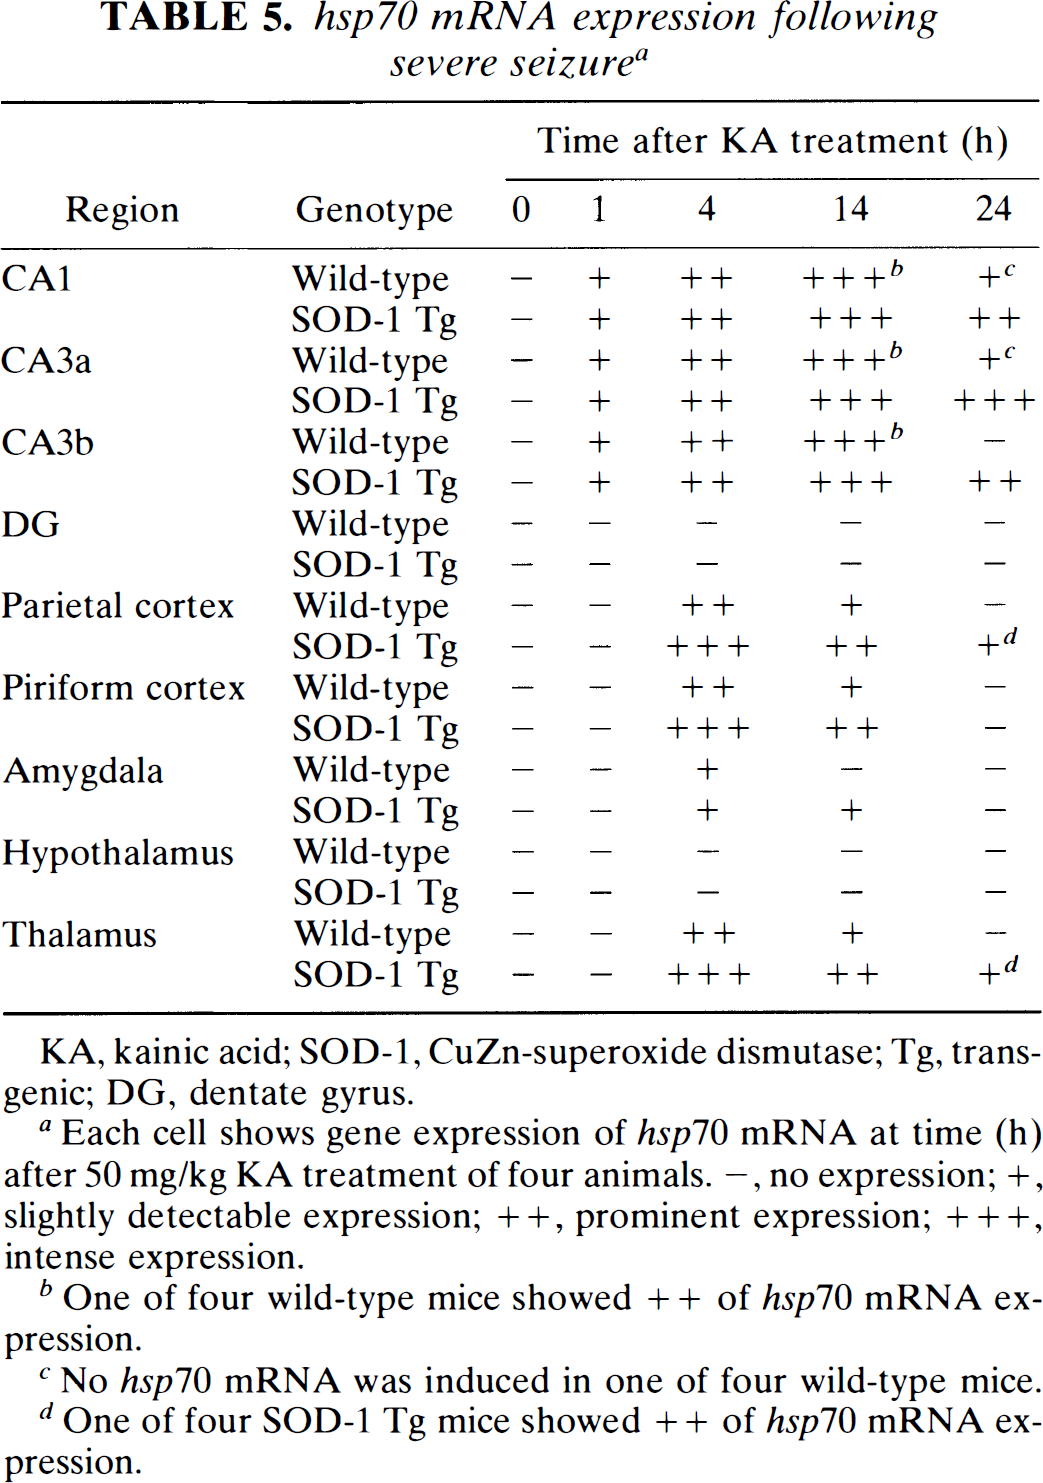
KA, kainic acid; SOD-1, CuZn-superoxide dismutase; Tg, transgenic; DG, dentate gyrus.
Each cell shows gene expression of hsp70 mRNA at time (h) after 50 mg/kg KA treatment of four animals. –, no expression; +, slightly detectable expression; + +, prominent expression; + + +, intense expression.
One of four wild-type mice showed ++ of hsp70 mRNA expression.
No hsp70 mRNA was induced in one of four wild-type mice.
One of four SOD-1 Tg mice showed ++ of hsp70 mRNA expression.
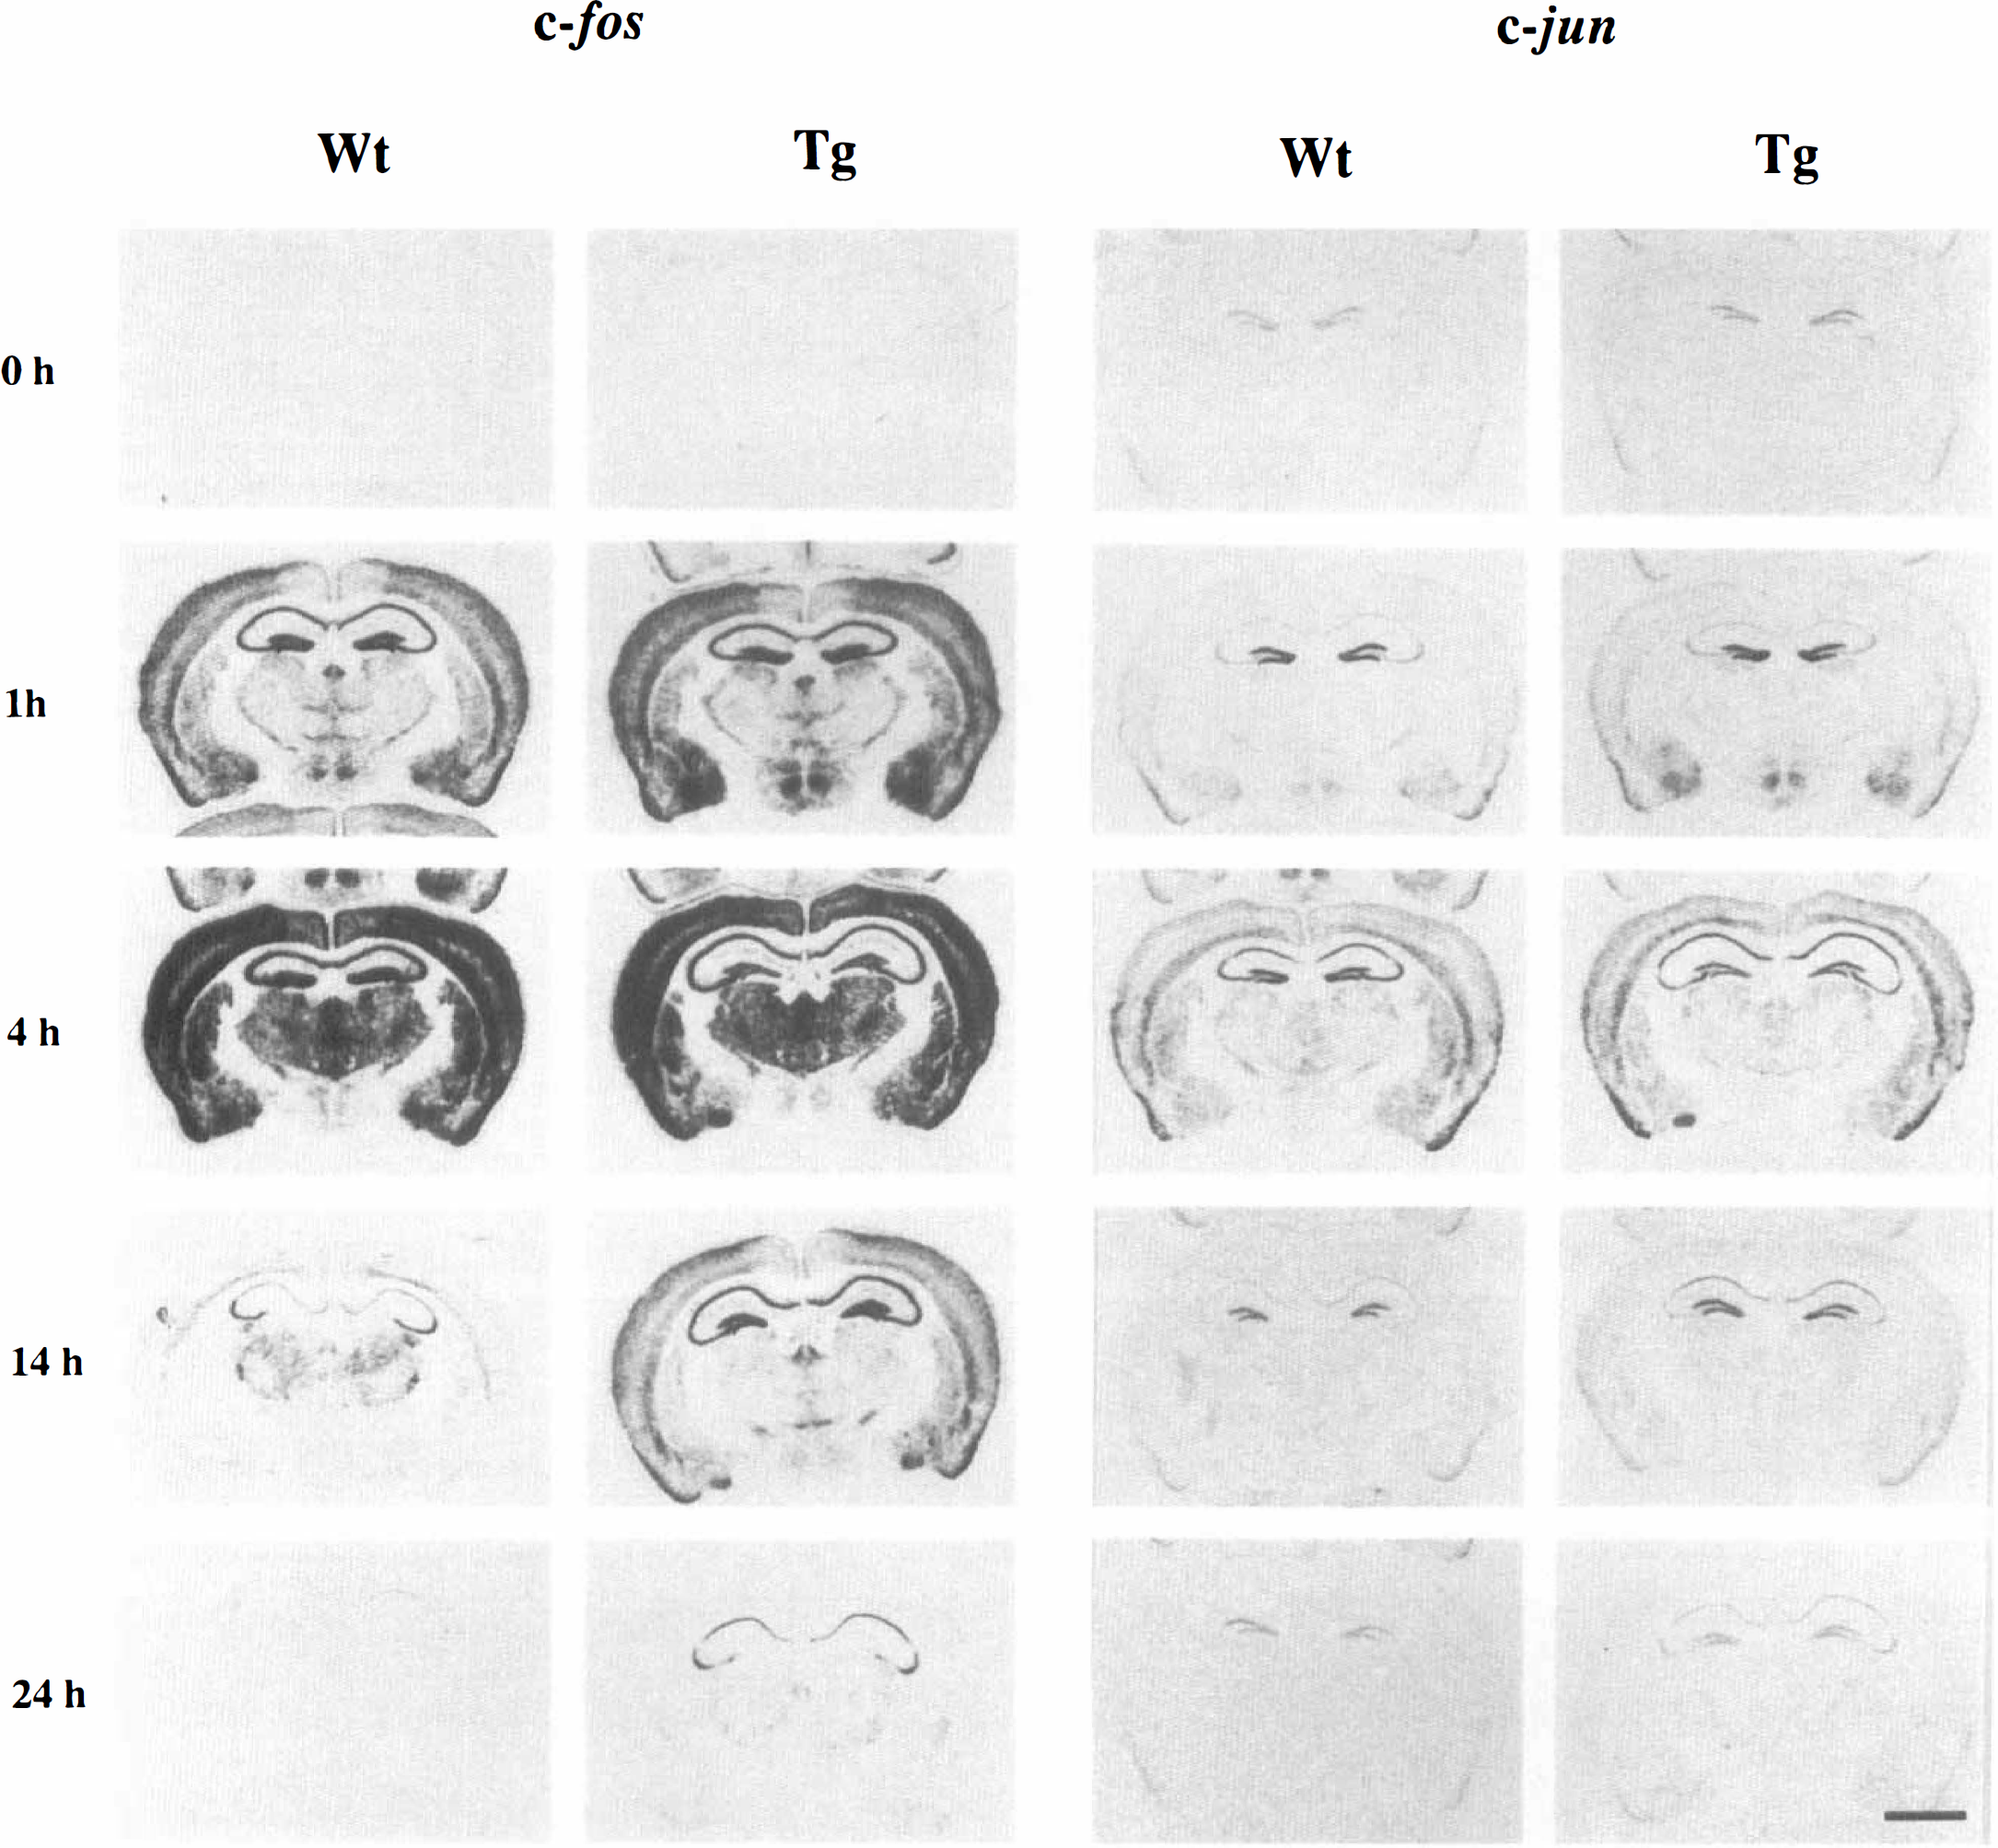
Expression of c-fos and c-jun mRNA in the severe seizure group after 50 mg/kg of kainic acid (KA) treatment. Distribution of c-fos (left columns) and c-jun (right columns) mRNA in wild-type (Wt) and CuZn-superoxide dismutase (SOD-1) transgenic (Tg) mice at dorsal hippocampal levels following KA treatment. Note that prolonged expression of c-fos and c-jun mRNA was more sustained in SOD-1 Tg mice than in Wt mice. Scale bar = 2 mm.
One hour after KA administration, c-fos and c-jun mRNA were induced in many brain regions; c-fos appeared to be induced in most every brain region, whereas c-jun was induced mainly in the hippocampus, piriform cortex, superficial layers of the cortex, and hypothalamus (Fig. 6, Table 4). There was a slight induction of hsp70 mRNA 1 h after KA injection, mainly in the hippocampus and superficial layers of the cortex (Fig. 7, Table 5).
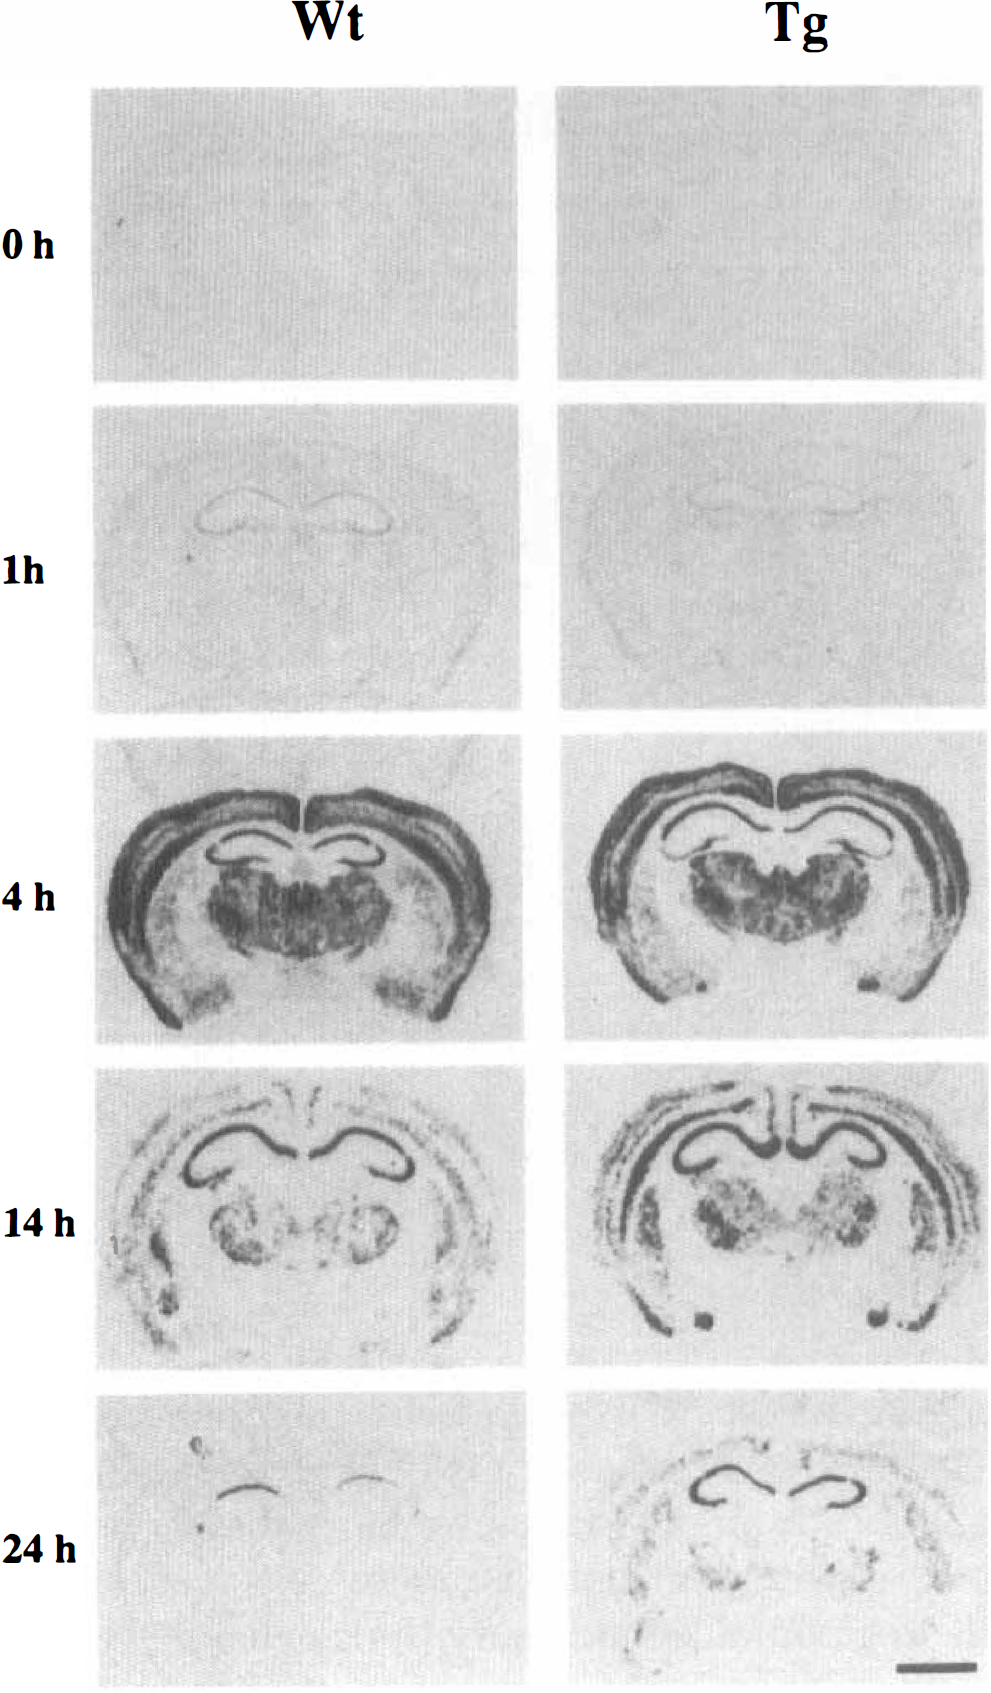
Expression of hsp70 mRNA in the severe seizure group following 50 mg/kg kainic acid (KA) treatment. Distribution of hsp70 mRNA in wild-type (Wt) and CuZn-superoxide dismutase (SOD-1) transgenic mice (Tg) at dorsal hippocampal levels following kainic aicd (KA) treatment. Note that prolonged expression of hsp70 mRNA was more sustained in SOD-1 Tg mice than in Wt mice. Scale bar = 2 mm.
Induction of c-fos, c-jun, and hsp70 mRNAs was maximal in most regions 4 h after KA administration in both wild type and SOD-1 Tg mice (Figs. 6 and 7; Tables 4 and 5); c-fos and hsp70 were induced throughout the hippocampus, cortex, piriform cortex, amygdala, thalamus, and other brain regions, and c-jun was induced in similar regions, but the magnitude of the induction seemed somewhat less. It also appeared that there were often fewer cells in the regions being induced (e.g., in the cortex, caudate putamen and thalamus) (Fig. 6).
The gene induction decreased by 14 h in most brain regions, and 24 h after KA injection, the expression of c-fos and c-jun mRNAs had returned to control levels in the wild-type mice (Fig. 6, Table 4); however, hsp70 mRNA continued to be expressed in the CA1 and CA3 regions of the hippocampus 24 h after KA administration in the wild-type mice (Fig. 7, Table 5). The greatest difference in gene expression in the SOD-1 Tg mice compared with the wild-type mice was observed 24 h after KA administration. At this time, c-fos and c-jun mRNAs continued to be expressed in the CA1 and CA3 regions of the hippocampus, superficial layers of the cortex, and piriform cortex of the SOD-1 Tg mice. In the CA1 and CA3 sectors of the hippocampus, hsp70 mRNA was highly expressed, with less expression in the cortex, piriform cortex, cingulate cortex, and thalamus (Fig. 7, Table 5). It is notable that although c-fos and c-jun mRNAs were induced in the dentate gyrus of the hippocampus, hsp70 mRNA was not induced in the dentate gyrus at any time after the KA seizures. Moreover, at 24 h there was no prolonged expression of any of the genes above control levels in the dentate gyrus.
DISCUSSION
Neurotoxicity of KA in wild-type and SOD-1 Tg mice
The CA3a region of the hippocampus appeared to be most vulnerable to KA-induced damage in both wild-type and SOD-1 Tg mice because cellular damage was restricted to this region even following mild seizures. These results in mice are consistent with previous reports in rats (Ben-Ari, 1985) that demonstrate that the stratum lucidum of the CA3a sector of the hippocampus is the region most vulnerable to KA-induced neurotoxicity. The vulnerability of the CA3a sector may relate to the high level of expression of both high- and low-affinity KA receptors in this region (Monaghan et al., 1983; Young and Fagg, 1990).
The present study confirms in mice what previous studies showed in rats: that KA doses that produce severe limbic seizures cause death of CA1 and CA3b as well as CA3a neurons in the hippocampus. Ben-Ari (1985) originally suggested two mechanisms for this KA-induced neurotoxicity, the first due to KA actions that produced “selective seizure-related damage” caused by receptor opening of the sodium channel in the KA receptor or by neuronal connection-mediated Ca2+ overload (Cull and Usowicz, 1987; Ascher and Nowak, 1988). The second mechanism of KA neurotoxicity was suggested to be “non-selective seizure-related damage,” which was caused by hypoxic-ischemic changes resulting from the seizure. Ben-Ari (1985) suggested that the CA3a damage was due to seizure-related damage and that the CA1 cell death produced by KA was due to hypoxia-ischemia produced by the KA seizures. From a variety of experimental models in different animal species, we know that CA1 hippocampal pyramidal neurons are the cells most vulnerable to global ischemic injury (Pulsinelli and Brierley, 1979; Kirino, 1982). Moreover, studies show that MK801 prevents CA1 (but not CA3) damage and HSP70 induction produced by KA in rats (Clifford et al., 1990; Planas et al., 1995), supporting the idea that KA injury in CA3 is mediated by KA receptors and that KA injury in CA1 is mediated by hypoxia and ischemia activation of NMDA receptors. Cell death in CA3 and CA1 regions of the hippocampus was not significantly different in the wild-type and SOD-1 Tg mice, suggesting that the increased ability to scavenge and metabolize O2− in Tg mice does not appear to influence the cell death of neurons in the hippocampus produced by KA and mediated either by the KA receptor or by the NMDA receptor.
The doses of KA required to produce seizures and neuronal injury in the mice in this study were much higher than equivalent doses required in rats (Ben-Ari, 1985; Gonzalez et al., 1989; Vass et al., 1989; Stafstrom et al., 1992; Planas et al., 1995). A 10–12 mg/kg intraperitoneal KA injection caused behavior changes in 93% of the adult rats (Stafstrom et al., 1992), caused consistent neuronal injury in the hippocampus, temporal cortex and other regions (Ben-Ari, 1985), and produced consistent patterns of HSP72 immunostaining (Gonzalez et al., 1989; Vass et al., 1989; Planas et al., 1995). Several recent studies have shown that the doses of KA required to produce seizures and neuronal damage were higher in mice (Strain and Tasker, 1991). The present study shows that although the dose of KA required to produce seizures and damage is higher in mice, the vulnerability of the mice to KA-induced seizures was not altered by SOD levels. Low doses of KA (10 mg/kg) that normally produce seizures in rats did not cause any behavioral and neuropathological changes, whereas the 30-mg/kg dose of KA produced mild seizures in both wild-type and SOD-1 Tg mice. The highest does of KA (50 mg/kg) produced similar limbic seizures in the wild-type and SOD-1 Tg mice. Therefore, SOD levels appear to have little effect on the threshold for seizures, the severity of seizures, or the severity of damage produced by KA in adult mice. This finding is also supported by the finding that the mortality rate after high doses of KA was not significantly different in SOD-1 Tg compared with wild-type mice.
Relationship between oxidative stress and KA-mediated neuronal cell death
The above conclusions were surprising, as we initially hypothesized that overexpression of SOD in the SOD-1 Tg mice might decrease the severity of seizures and injury produced by KA. In studies of focal cerebral ischemia in SOD-1 Tg mice, infarct volumes are decreased after transient middle cerebral artery (MCA) occlusion followed by reperfusion (Yang et al., 1994) but not following permanent MCA occlusion without reperfusion (Chan et al., 1993). Because oxygen free radicals are believed to be produced mainly during reperfusion following ischemia (Turrens et al., 1991; Haraldsson et al., 1992), these findings suggest that SOD mainly prevents the tissue damage produced by surplus oxygen free-radical formation. KA leads to cytosolic Ca2+ overload (Choi, 1988; Pizzi et al., 1990; Ozawa et al., 1991; Keller et al., 1992; Berg et al., 1995), which could activate phospholipases and enhance free radical production (Chan et al., 1984; Pazdernik et al., 1992). Several reports support the possibility that oxygen free radicals, especially O2−, mediate seizure-related neuronal cell damage (Nelson and Olson, 1987; Armstead et al., 1989). Recent studies, however, suggest that oxygen free radicals are produced after treatment with NMDA, but not KA, in cultured cerebellar granular cells (Lafon et al., 1993) and in cultured cortical neurons (Dugan et al., 1995). The present study also suggests that O2− is not a major factor in producing neuronal cell death in the intact brain following KA-induced seizures.
Apoptotic neuronal cell death induced by KA
Recent studies suggest that apoptotic as well as necrotic cell death may occur after KA-induced seizures. Biochemical evidence of apoptosis following KA administration has been demonstrated using DNA laddering, where apoptosis is associated with nuclear DNA fragmentation into nucleosome-sized pieces of approximately 200 bp and multiples thereof (Appleby and Modak, 1977; Filipkowski et al., 1994; Pollard et al., 1994a,b; Sakhi et al., 1994). DNA nick end-labeling using the TUNEL reaction has been used to suggest evidence of apoptosis following KA-induced seizures as well (Filipkowski et al., 1994; Pollard et al., 1994a,b; Sakhi et al., 1994). Although the TUNEL reaction specifically labels 3′-OH groups at double-stranded DNA breaks produced by endonucleases during apoptosis (Gavrieli et al., 1992), several studies have shown that DNA is degraded by the release of lysosomal DNAses even in necrotic cells and that the degraded DNA can be labeled with the TUNEL reaction (Gold et al., 1993; MacManus et al., 1995). It has been suggested, however, that the apoptotic and necrotic TUNEL-labeled cells can be distinguished morphologically after transient focal cerebral ischemia (Charriaut-Marlangue and Ben-Ari, 1995; Li et al., 1995) because apoptotic cells have densely staining small particles in cytoplasm called apoptotic bodies, whereas necrotic cells demonstrate light, diffuse nuclear staining without apoptotic bodies.
In the present study, TUNEL-stained cells, some with apoptotic bodies and others without apoptotic bodies, were detected in the CA1 and CA3b regions of the hippocampus. TUNEL-stained cells were also detected in the CA3a region of the hippocampus, although none of these cells appeared to have apoptotic bodies, and the nuclear staining was lighter and more diffuse than that in CA1 and CA3b. These data, combined with the existing literature, could suggest that KA produces a spectrum of injury in the hippocampus. The cells most vulnerable to KA in CA3a appear to die the most rapidly and to undergo a necrotic cell death, perhaps by the direct KA-receptor mediated influx of sodium and Ca2+ overload. This finding contrasts to CA1 and CA3b, where DNA nick end-labeling associated with apoptotic bodies occurred in some of these cells, suggesting that at least some and perhaps many of these neurons may die from an apoptotic-like process.
The present study also revealed that lectin-positive cells migrated to regions where the neurons were dying. Lectin (BS-I-B4)' from Bandeiraea simplicifolia, binds to
Induction and prolonged expression of c-fos and c-jun after KA treatment
Numerous studies have documented that KA induces c-fos and c-jun IEGs in many brain regions of normal rats and mice, including the hippocampus, neocortex, piriform cortex, basal ganglia, amygdala, hypothalamus, and thalamus (Sonnenberg et al., 1989; Dragunow et al., 1993; Gass et al., 1993; Schreiber et al., 1993a,b; Condorelli et al., 1994; Pennypacker et al., 1994a,b; Bading et al., 1995; Kasof et al., 1995). KA induced calcium entry into cells through voltage-gated calcium channels and NMDA receptors (Berg et al., 1995). Activation of other intracellular messengers as well could act on the Ca/CRE and SRE elements in the c-fos promoter to initiate transcription (Ghosh et al., 1994; Bading et al., 1995; Robertson et al., 1995). Because the present study did not examine Fos and Jun proteins, the mechanisms after transcription and the role of these proteins are uncertain. It is suggested, however, that SOD levels and O2− probably do not play a major role in the acute induction of these IEGs after KA-induced seizures, as the acute patterns of c-fos and c-jun mRNA induction were similar in the wild-type and SOD-1 Tg mice.
In the present study, the only major difference between SOD-1 Tg and wild-type mice with regard to KA neurotoxicity was that expression of the IEGs and stress genes was more prolonged in the SOD-1 Tg compared with wild-type mice. It is interesting to note that the expression of c-fos and hsp70 mRNAs is also prolonged in SOD-1 Tg mice after focal cerebral ischemia (Kamii et al., 1994a,b). The mechanisms of prolonged gene expression in focal stroke and KA in SOD-1 Tg mice may be similar, as it is known that gene expression after focal stroke can be due to the activation of α-amino-3-hydroxy-5-methyl-4-isoxazole propionic acid (AMPA) or KA receptors. Caution must be taken, however, when interpreting these results because mechanisms of gene expression in Tg animals after focal stroke and KA treatment are likely to be different. For example, the NMDA receptor is known to play a role in gene expression. It is not clear whether the activation of the NMDA receptor will prolong gene expression in SOD-1 Tg mice. In the present study, there could be one or several mechanisms for the prolonged gene expressions. First, it is possible that the threshold for IEG and stress gene induction is lower in the SOD-1 Tg compared with wild-type mice (Kamii et al., 1994a,b) but seems unlikely because the threshold of KA dose for the production of seizures and damage was similar for SOD-1 Tg and wild-type mice. Second, it is possible that increased endogenous SOD activity in the SOD-1 Tg mice produced more H2O2 than in the wild-type mice, which could induce prolonged expression of c-fos, c-jun, and hsp70 mRNAs. This finding is supported by findings that higher levels of H2O2 are produced in SOD-1 Tg compared with wild-type mice under normal physiological conditions (Przedborski et al., 1992) and that H2O2 stimulates the expression of c-fos mRNA in rat astrocyte cultures (Pechan et al., 1992). Third, it is possible that the prolonged gene expression in SOD-1 Tg mice is a consequence of prolonged cellular functional survival resulting from the increased levels of SOD. Apoptosis is known to be a process of active cell death that requires mRNA and protein synthesis, although cells gradually lose their synthetic abilities. In the present study, almost all neuronal cells in the CA1 pyramidal layer were dead after 7 days in the severe seizure group in both wild-type and SOD-1 Tg mice. Because this CA1 neuronal cell death is believed to be the result of anoxic/ischemic damage resulting from the prolonged seizures, it is possible that the CA1 neuronal cells might tolerate the hypoxic-ischemic injury for longer periods in the SOD-1 Tg mice; thus, the CA1 neurons might express all mRNAs for longer periods after KA treatment than in wild-type mice. This idea is supported by studies in culture where SOD-1 can delay but not prevent neuronal apoptosis (Greenlund et al., 1995).
Induction and prolonged expression of hsp70 mRNA after KA seizures
Following initial studies demonstrating that KA seizures induced HSP70 protein in the brain (Gonzalez et al., 1989; Vass et al., 1989), subsequent studies showed that HSP70 was induced by prolonged seizures of many types (Longo et al., 1993; Wang et al., 1993; Gass et al., 1994; Lowenstein et al., 1994; Planas et al., 1994, 1995) as well as by other types of injury (Vass et al., 1989; Brown et al., 1989; Gonzalez et al., 1989; Chopp et al., 1991; Nowak, 1991; Kawagoe et al., 1992; Kinouchi et al., 1993; Kamii et al., 1994b; Mikawa et al., 1995). It is believed that denatured proteins activate heat shock factor proteins that initiate hsp70 transcription by binding to heat shock elements in the hsp70 promoter (Ananthan et al., 1986). The HSP70 protein then binds to the denatured proteins within cells to prevent them from becoming irreversibly denatured (Pelham, 1986) and protects neuronal cells against various types of injury (Kirino et al., 1991; Kitagawa et al., 1991).
The present study did not examine HSP70 protein expression because the mouse monoclonal antibody to HSP70 we use (Kinouchi et al., 1993) does not recognize mouse HSP70 protein. Even though the hsp70 mRNA is synthesized in the hippocampus and other brain regions following KA, this does not necessarily mean that HSP70 protein is made. HSP70 protein is not usually made in cells that make hsp70 mRNA and will die after ischemic injury (Kawagoe et al., 1992; Welsh et al., 1992; Kinouchi et al., 1993). The situation may be somewhat different in KA-induced damage, however. KA induces hsp70 mRNA and HSP70 protein in the CA1 and CA3 regions of the hippocampus, cortex, amygdala, and certain thalamic nuclei (Gonzalez et al., 1989; Vass et al., 1989; Planas et al., 1994, 1995), areas known to be selectively vulnerable to KA (Foster et al., 1981). Planas et al. (1995) noted that HSP70 protein can be expressed in CA1 and CA3 pyramidal neurons that will die as well as in neurons that will survive after KA seizures. It is possible that cells die more slowly after KA-induced injury and that this allows them to make HSP70 protein as well as hsp70 mRNA even though they will eventually die. This finding is consistent with the histology that does not demonstrate the total degree of cell death until 7 days after the seizures (Table 2).
The prolonged expression of hsp70 mRNA following KA in both the wild-type and SOD-1 Tg mice suggests that continued presence of denatured proteins within the cells, as this is the major transcriptional stimulus for hsp70 as noted above. The finding that hsp70 mRNA is expressed for longer periods in the hippocampus, cortex, basal ganglia, and thalamus of the SOD-1 Tg compared with wild-type animals is consistent with the proposed idea that the biochemical function of the cells in SOD-1 Tg mice can be maintained longer; therefore, these cells can express hsp70 mRNA for longer periods. Because cells die after KA seizures via apoptosis as well as necrosis, it seems likely that increased SOD levels prolong survival from either apoptosis or necrosis produced by KA seizures. Although HSP70 has been shown to inhibit apoptotic cell death in vitro (Wei et al., 1995) and SOD has been shown to prolong cell survival in vitro (Greenlund et al., 1995), the combination of these two protective molecules appears to prolong survival but does not improve survival after KA seizures.
Footnotes
Acknowledgment:
We thank H. Kamii and H. Kinouchi for their valuable suggestions; T. Chan, S. Chen, and L. Reola for their technical assistance; and C. Christensen and J. Weigel for editorial assistance. This study was supported by National Institutes of Health grants NS-14543, NS-25372, AG-08938, and the Merit Review Program of the Department of Veterans Affairs.