
Abstract
Disturbed glucose brain metabolism after brain trauma is reflected by changes in extracellular glucose levels. The authors hypothesized that posttraumatic reductions in extracellular glucose levels are not due to ischemia and are associated with poor outcome. Intracerebral microdialysis, electroencephalography, and measurements of brain tissue oxygen levels and jugular venous oxygen saturation were performed in 30 patients with traumatic brain injury. Levels of glucose, lactate, pyruvate, glutamate, and urea were analyzed hourly. The 6-month Glasgow Outcome Scale extended (GOSe6) score was assessed for each patient. In regions of increased glucose utilization defined by positron emission tomography, the extracellular glucose concentration was less than 0.2 mmol/l. Extracellular glucose values were less than 0.2 mmol during postinjury days 0 to 7 in 19% to 30% of hourly samples on each day. Transient decreases in glucose levels occurred with electrographic seizures and nonischemic reductions in cerebral perfusion pressure and jugular venous oxygen saturation. Glutamate levels were elevated in the majority of low-glucose samples, but the lactate/pyruvate ratio did not indicate focal ischemia. Terminal herniation resulted in reductions in glucose with increases in the lactate/pyruvate ratio but not in lactate concentration alone. GOSe6 scores correlated with persistently low glucose levels, combined early low glucose levels and low lactate/glucose ratio, and with the overall lactate/glucose ratio. These results suggest that the level of extracellular glucose is typically reduced after traumatic brain injury and associated with poor outcome, but is not associated with ischemia.
Traumatic brain injury results in primary cellular death in a limited region of the brain directly involved in the insult while creating a more widespread state of metabolic dysfunction in remote areas of the brain (Feeney and Baron, 1986; Vink et al., 1988). This metabolic dysfunction is best characterized as a reduction in oxidative metabolism (Hovda et al., 1991; Vink et al., 1988). This deficit is in part compensated for by the activation of glucose metabolism (Kawamata et al., 1992; Yoshino et al., 1991, 1992). As a result of increased glycolysis, lactate production increases, but lactic acid accumulation is in part mitigated by the ability of neurons to use lactic acid as an alternative fuel (Pellerin and Magistretti, 1996).
Abnormalities of glucose metabolism have been shown in multiple animal models of brain injury (Andersen and Maramarou, 1989; Hayes et al., 1988; Hovda et al., 1991; Yoshino et al., 1992) and in human brain trauma victims (Bergsneider et al., 1997, 2000, 2001). These abnormalities occur during the acute periods of increased energy demand and proceed through a phase of increased glucose metabolism followed by a metabolic depression. The rate of recovery from the metabolic depression matches the degree of recovery (Hovda, 1996; Moore et al., 2000). Despite the universal occurrence of this phenomenon, the net impact of this abnormality on clinical outcome remains controversial.
The extracellular glucose concentration that is measured in cerebral microdialysis is a function of the availability and utilization of glucose. Delivery of glucose is rate limited via the glucose transporter. Thus, reductions in extracellular glucose levels may reflect a limitation of delivery or increased utilization. After traumatic brain injury (TBI), the glucose transporter is upregulated (Cornford, et. al., 1996; Hamlin et al., 2001) and a deficiency in glucose delivery under conditions other than ischemia is not likely, whereas availability may be reduced (Marklund et al. 1997; Nilsson et al. 1996). Measurement of brain metabolism has been performed indirectly using cerebral microdialysis, and the pattern of low glucose and elevated glycerol levels has been correlated with positron emission tomography (PET) findings showing increased glucose utilization (Vespa et al., 2002). Marked changes in the extracellular contents have been seen during terminal events, such as brain herniation (Alessandri et al., 1999; Goodman et al., 1999; Landolt et al., 1994; Langemann et al., 2001; Stahl et al., 2001a; Valadka et al., 1998). These terminal events are thought to represent anaerobic hyperglycolysis, with reductions in extracellular glucose to undetectable levels accompanied by increases in lactate.
This article will outline the time course and nature of changes in extracellular glucose levels in traumatic brain injury, the incidence of low glucose levels, and the factors that are related to low levels of glucose, and will evaluate the lactate response to low levels of glucose. We demonstrate that low levels of glucose are common and that the total duration of low glucose levels negatively affects outcome.
MATERIALS AND METHODS
The University of California at Los Angeles (UCLA) institutional review board for human research approved this study, which was conducted as an integral part of the UCLA Brain Injury Research Center in patients with severe traumatic brain injury with a Glasgow Coma Scale (GCS) score of 8 or less or with evidence of traumatic mass lesion on a computerized tomographic scan and GCS score of 12 or less. Subjects were identified in the emergency department, consented by proxy, and enrolled into the study as soon as possible. The management of these patients has been previously described (Kelly et al. 1997; Vespa et al., 1999). Acute-phase studies were carried out for up to 10 days after hospital admission, subject to constraints including catheter removal, the patient's graduation from intensive care, or death. Determination of the injury severity score was performed using the conventional assessment tool (Baker et al., 1974).
Cerebral microdialysis was performed using the CMA70 probe (10-cm flexible shaft, 10-mm membrane length, 20-kd cutoff; CMA, Stockholm, Sweden) inserted via a twist-drill burr hole adjacent to an existing ventriculostomy. The microdialysis catheter was inserted to a depth of 1.5 to 2 cm below the skin at an angle 30 degrees lateral to the trajectory of the ventriculostomy, to place the catheter into the white matter. The probe was tunneled 3 cm under the skin and secured to the scalp with a flat profile, and then attached to the CMA103 perfusion pump. Normal saline was perfused through the catheter at a rate of 2 uL/min, and fluid was collected in 60-minute samples and placed in dry ice or directly into the CMA600 instrument. The initial 60-minute sample was not used for analysis because this was the time allowed for stabilization of the probe. Microdialysis was not interrupted for transport or bedside testing. In the five most recent patients, subcutaneous probes were placed in the skin overlying the right lower abdominal quadrant in order to control for hourly systemic changes in glucose, lactate, and urea.
Positron emission tomography was performed using a quantitative method previously described (Bergsneider et al., 2001). Using an intensive care treatment model, a fluoro-deoxyglucose (FGD)-PET scan was performed using a quantitative technique (10 mCi 2-deoxy-glucose, serial arterial sampling, three-dimensional acquisition) with calculation of regional glucose metabolic rates in a 2-cm3 region of the cerebral microdialysis probe. Coregistered magnetic resonance imaging was using to confirm probe location.
The bedside nurse and research team maintained a detailed patient event log to identify important events and to record times of vial sampling. In addition, automated computerized capture of all physiological monitoring data was conducted using the UCLA-devised Brain Injury Research Program database. Using this program, sampling of the physiology occurs every 2 minutes and a 1-hour mean is generated. An experienced nurse then confirms the hourly mean values. The following data was recorded hourly: intracranial pressure, mean arterial blood pressure (MAP), cerebral perfusion pressure (CPP), heart rate, arterial oxygen saturation, core temperature (jugular), jugular venous oxygen saturation (SjvO2), regional brain oxygen partial pressure (PTiO2), electroencephalography, and GCS score. In addition, serial measurements of dose of sedatives, mannitol, and other neurologically active medications were recorded hourly.
Intermittent (daily) testing was performed using the radioactive 133Xe Kety-Schmidt technique (Kety and Schmidt, 1945) for global measurement of cerebral blood flow, and glucose (CMRglc) and oxygen (CMRo2) metabolic rates, and the oxygen/glucose ratio (OGR) using previously defined methods (Lee et al., 2001). Matched samples of arterial and jugular bulb venous blood samples were taken on a daily basis and matched to the corresponding hourly microdialysis glucose sample. Blood glucose levels were determined using the glucose oxidase method. Intravenous injection of radioactive 133Xe was performed and the global CBF-15 was determined. Thereafter, global rates of glucose and oxidative metabolism were obtained. Determination of global glucose metabolism and cerebral blood flow was performed for each patient and compared with a matched cerebral microdialysis sample taken during the hour of study.
Frozen samples were briefly centrifuged and then analyzed on the CMA600 in batch analysis. The standard CMA600 reagents were used for analysis. The hourly samples were run twice each for each analyte, and the mean final value was used. Quality control measurements using normal saline and water blank samples, as well as standardized solutions across a range of concentrations (0.025 to 3.0 mmol/L) mimicking those of the human samples, were run weekly, with an additional internal control sample for each subject. Acceptable values of coefficient of variation (3% to 5%) and accuracy were obtained in order to validate very low sample concentrations of selected analytes. Samples with extremely low glucose values (less than 0.05 mmol/L) underwent repeat testing to confirm the extreme value. The lowest confidence threshold of glucose values using this system was found to be those greater than or equal to 0.025 mmol/L. Repeat testing on selected frozen samples was conducted across a 1-year time interval to determine that no sample degradation occurred during the freezing or thawing process. High-performance liquid chromatography was performed on selected microdialysate samples to determine hypoxanthine levels using the methods of Hillered and Persson (1999). Results are expressed as the absolute microdialysis values without correction.
Subjects were closely followed up with home and outpatient office visits to monitor recovery of function over the next 6 months. At 6 months, patients underwent in-person follow-up testing using the extended Glasgow Outcome Scale (GOSe) (Wilson et al., 1998) and the Disability Rating Scale (Rappaport et al., 1982). The GOSe was deemed to be stable at 6 months after injury and was used to assess the profile of microdialysis based in each major category of GOSe.
Statistical analysis
Pearson product-moment correlations, analyses of proportions, analyses of variance, computation of odds ratios with 95% confidence intervals, and linear regression were performed to analyze the data. Data acquisition was handled in Access 97 (Microsoft Corp., Redmond WA, U.S.A.), whereas statistical procedures were conducted within Statistica 5.5 (StatSoft, Inc., Tulsa, OK, U.S.A.).
RESULTS
Thirty consecutive subjects (23 men and 7 women) were enrolled into the microdialysis observational study as part of the UCLA Brain Injury Program project. The subjects had a median GCS of 7, a mean age of 34.4 ± 12.5 years, and mean injury severity score of 32.7 ± 11.4. Microdialysis was started as soon as postinjury hour 7 to 72, with a median of postinjury hour 10. The mean number of hourly samples for each patient was 121, with a total of 2,708 samples. There were 13 contusion injuries (single or multiple), 8 subdural hematomas, 4 diffuse axonal injuries, 3 epidural hematomas, 2 traumatic subarachnoid hemorrhages, and 2 intraven-tricular hemorrhages. The mean length of hospital stay was 19 ± 15 days. The median Glasgow Outcome Scale score at discharge was 3. There was a 22% in-hospital mortality rate. At 6 months, GOSe scores were 1 or 2 in 5 patients (poor outcome), 5/30; 3 or 4 in 9 patients (moderate disability), and 5 to 8 in 14 patients (good outcome). There were no complications associated with microdialysis probe insertion or monitoring.
Probe location
The microdialysis probes were located in the dorsolateral frontal white matter ipsilateral to the ventricular catheter in all 30 cases. Location in white matter was confirmed using magnetic resonance imaging in 15 cases.
Probe recovery
The in vitro recovery of analytes from a test solution adjusted to mimic the extracellular concentrations using this system was as follows: glucose, 56% ± 1%; lactate, 63% ± 2%; glutamate, 54% ± 1%; glycerol, 99% ± 1%; pyruvate, 66% ± 2%; and urea, 76% ± 2%. The coefficients of variation for measurements of glucose were between 0.4% and 2.5% for values in the range from 0.05 to 2.0 mmol. After removal of each brain microdialysis catheter, this in vitro test was repeated and yielded similar recovery rates (glucose, 55% ± 1%; lactate, 63% ± 2%; glutamate, 55% ± 1%; glycerol, 98% ± 1%; pyruvate, 66% ± 2%; and urea, 77% ± 2%). The stability of probe recovery over time was determined by examining the changes in the concentration of urea over time (Ronne-Engstrom et al., 2001). Urea concentrations were remarkably stable during 24-hour epochs, with a 10% coefficient of variation. When a change in urea concentration of greater than 10% occurred, glucose and lactate values taken during those time points were rejected. As a result, 4% of all samples were discarded. Because similar in vitro recoveries were found using normal saline compared with artificial cerebrospinal fluid, the former was used in vivo.
To determine a comparison between our data and that of groups in which a slower perfusion rate is used, the perfusion rate was set at 0.3 uL/min in one excluded subject (patient no. 31). At this rate, the baseline mean glucose concentration was 2.5 mmol/l ± 0.7, which is comparable with previous reports (Reinstrup et al., 2000). By comparison, the perfusion rate of 2 uL/min resulted in a 56% in vivo recovery and mean microdialysis concentration of 0.76 ± 0.5 mmol under conditions of normal intracranial pressure, CPP, and SjvO2. Thus, an microdialysis glucose value less than 0.20 mmol/L at a perfusion rate of 2 uL/min is comparable to a level of less than 0.66 mmol/L at a perfusion rate of 0.3 uL/min.
Arterial and subcutaneous monitoring of glucose and lactate concentrations was performed. Subcutaneous microdialysis was used in five subjects to compare the changes in systemic glucose to those in the brain extracellular space. A poor correlation (mean r = 0.07) was found between the subcutaneous extracellular glucose values and brain glucose values within subjects, suggesting that brain microdialysis glucose values are not reflective of systemic changes in glucose. In 206 matched samples, arterial glucose ranged from 4.94 to 7.89 mmol/L (89.2 to 142.3 mg/dL) compared with microdialysis glucose values between 0.08 to 3.8 mmol/L. There was a weak positive correlation between arterial and brain extracellular glucose levels (r = 0.26, P<0.05), with no episode of arterial hypoglycemia (arterial glucose less than 5 mmol/L) occurring during episodes of reduced brain extracellular glucose (microdialysis glucose less than 0.2 mmol/L). There was a similar weak correlation (r = 0.28) between cerebral microdialysis glucose and jugular venous glucose concentrations. No correlations were found between levels of extracellular and arterial lactate (r = 0.03, n = 181 matched samples) or between levels of extracellular and jugular lactate (r = 0.02, n = 181 matched samples).
Extracellular glucose values
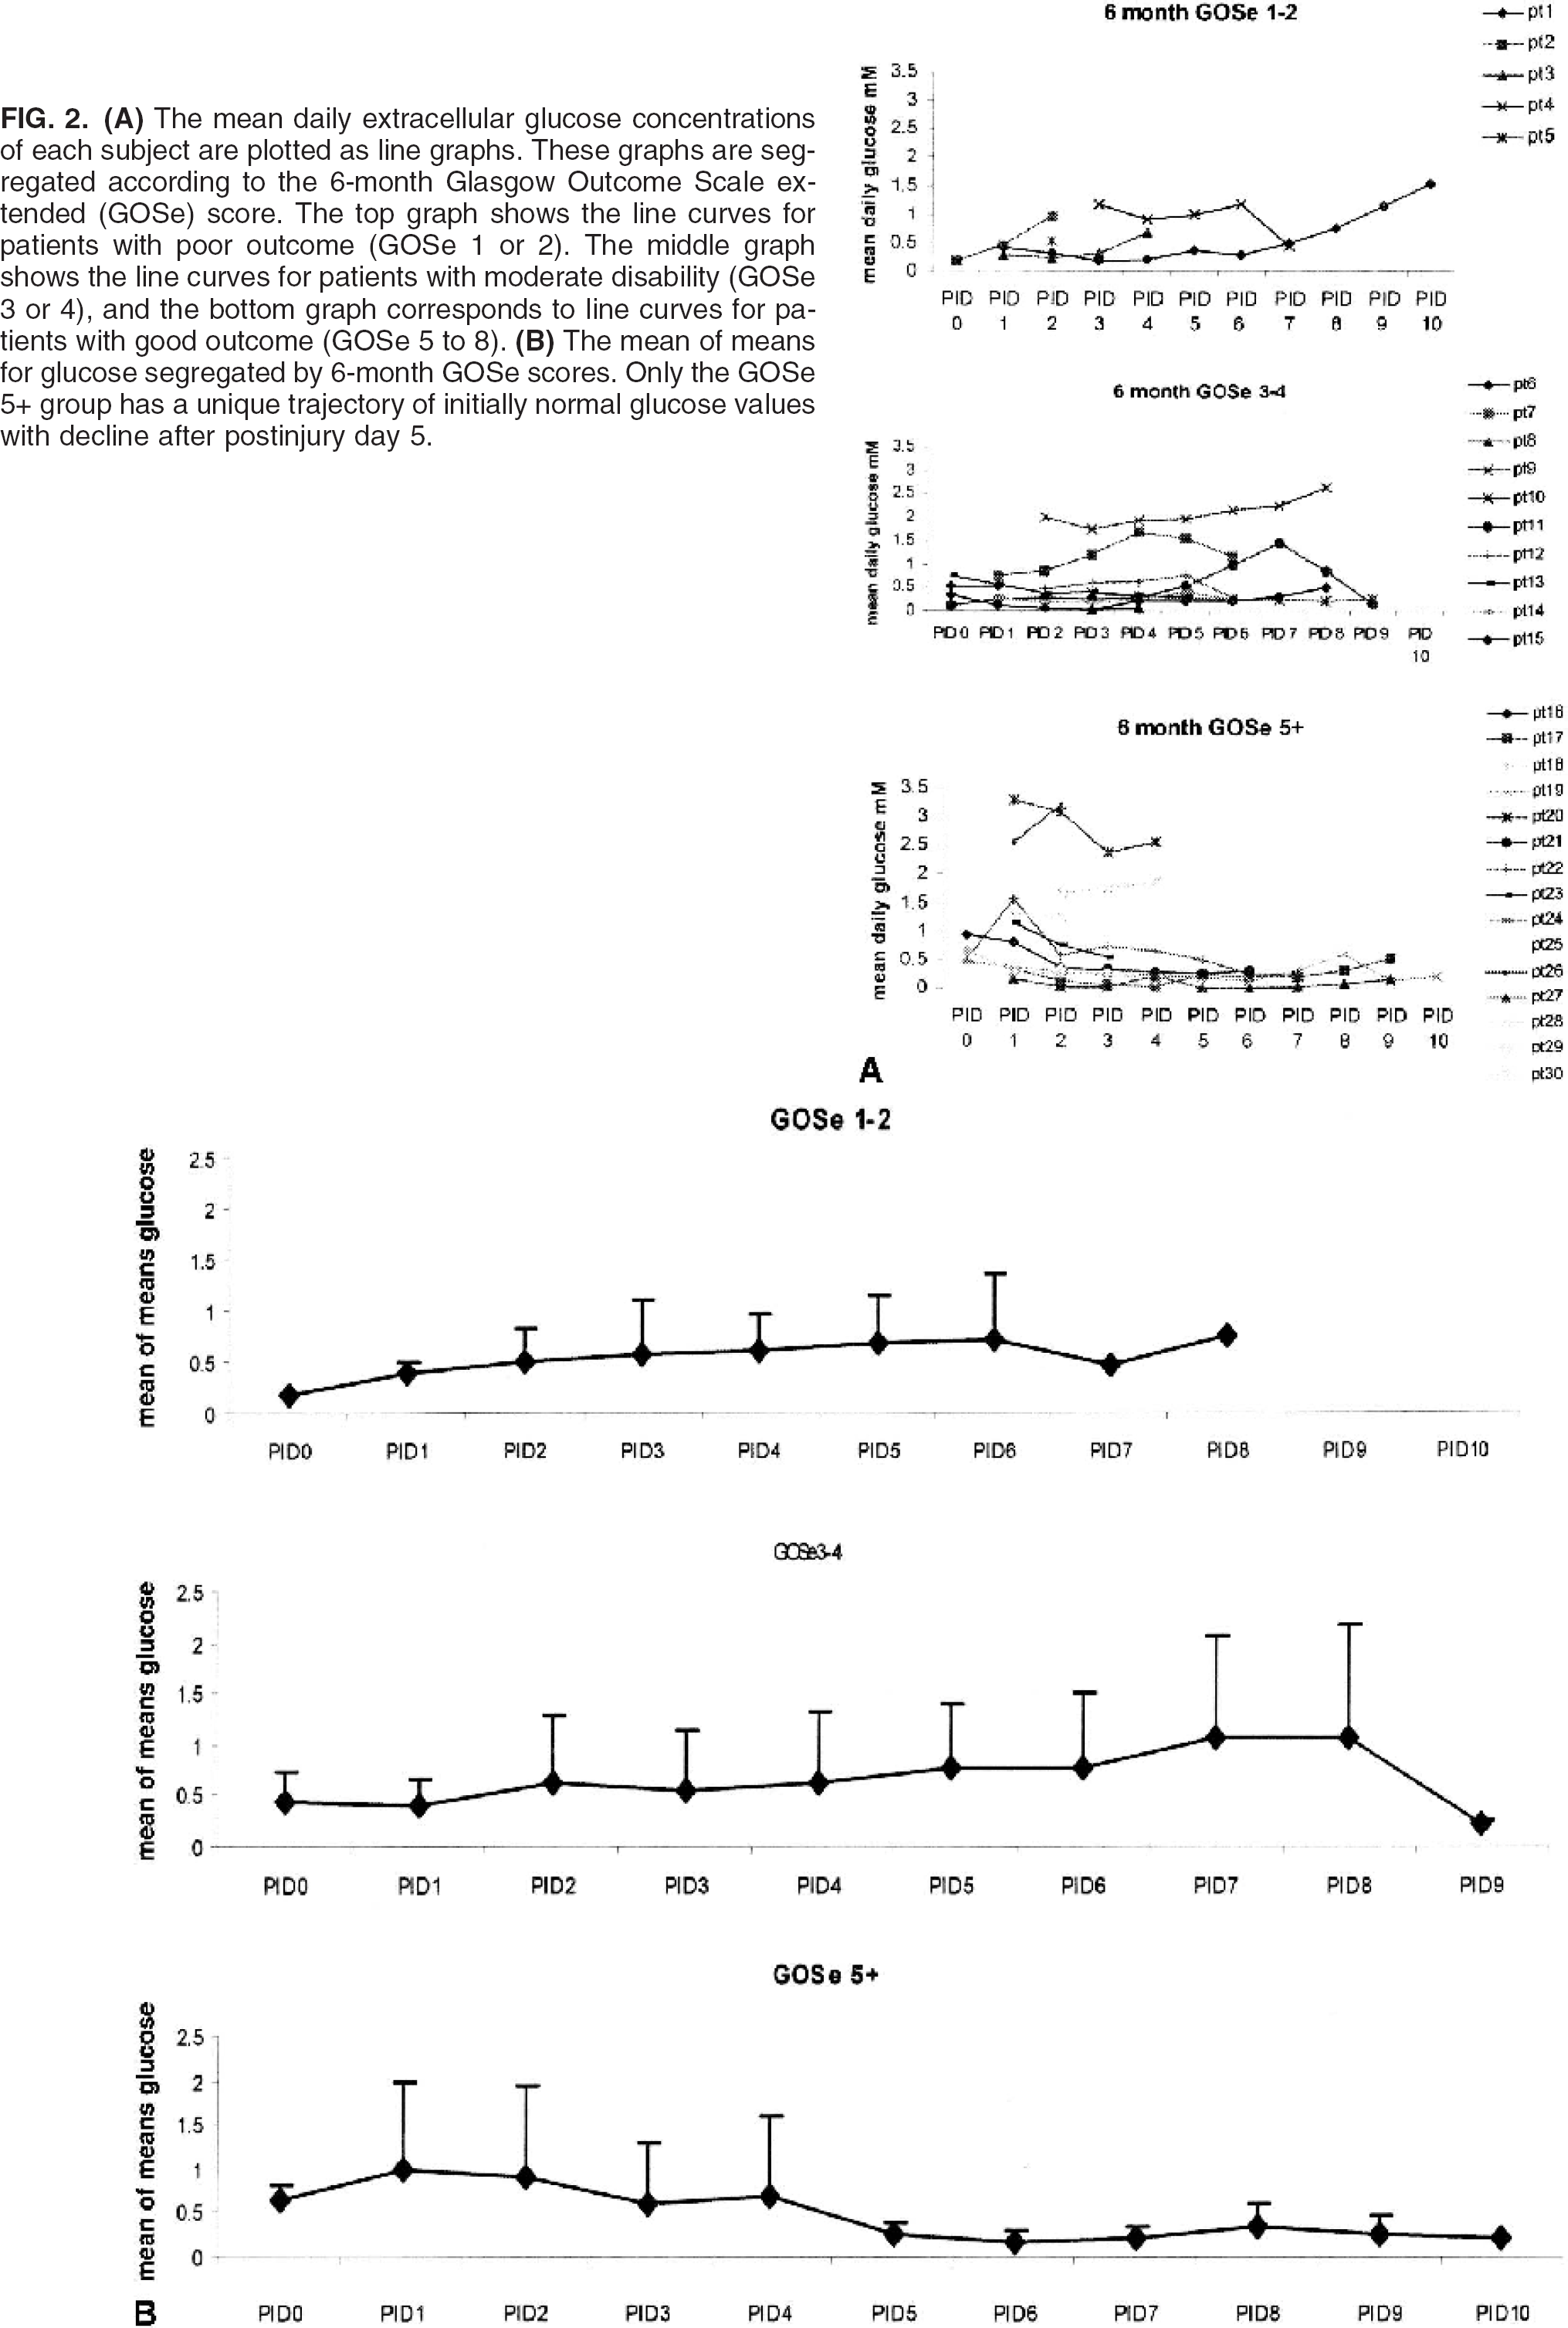
The range of hourly values of extracellular glucose values across all subjects was 0.03 to 3.8 mmol/L. Within-subject hourly glucose values varied greatly, with the coefficient of variation of ranging from 12% to 43%. Mean daily glucose values ranged from 0.05 to 3.2 mmol/L, and the population mean of the daily mean values ranged from 0.36 ± 0.36 to 0.86 ± 0.96 mmol/L. Figure 1 outlines the mean daily glucose values for the entire population. The mean glucose values were within the normal range of 0.5 to 1.0 mmol/L on all days. In Fig. 2, the daily mean values of each subject are plotted by postinjury day. Three trajectories of the daily mean glucose values were found: initially low (n = 5), variable (n = 16), and initially normal-with-late-decline (n = 9). However, only the patients with good outcome (GOSe scores of 5 or higher) demonstrated a uniform trajectory with an initially normal-with- late-decline trajectory. The initially low-trajectory patients had glucose values less than 0.50 mmol/L for the initial 48 to 72 hours with later increase into the normal range (0.5 to 1.0 mmol/L). Some patients with initially normal values demonstrated a decline below the normal range (i.e., less than 0.5 mmol/L) starting on the third postinjury day and continued to demonstrate low values after that time point.
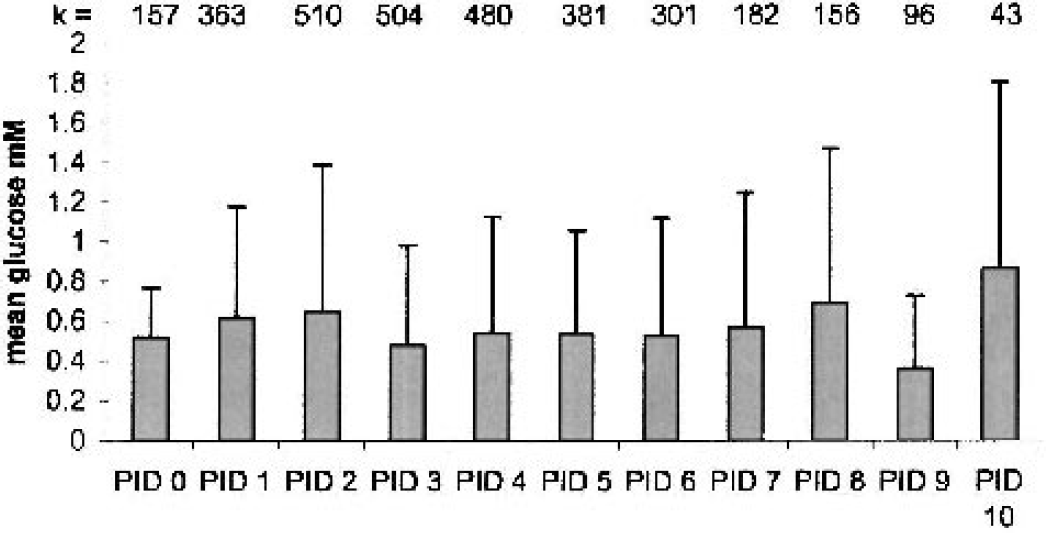
The mean (SD) daily extracellular glucose concentrations for the entire cohort of 30 patients segregated by postinjury day (PID). The total number of patients on each day appears as number inserts atop each histogram.
A threshold of extracellular glucose less than 0.2 mmol/L was selected based on the simultaneous measurement of extracellular glucose during an FDG-PET in a single patient with increased glucose utilization in the ROI encompassing the microdialysis probe (see figure 3). The corresponding regional CBF and oxygen extraction fraction showed an absence of ischemia in the region of the probe. Next, we used this threshold to determine the frequency of low glucose values in all subjects. Figure 4 shows the daily proportion of low (less than 0.2 mmol/L), normal (0.2 to 1.0 mmol/L), and high (greater than 1.0 mmol/L) glucose values on each day after injury. The percentage of values falling below this critical threshold on each postinjury day ranged from 18% to 30% during the initial 7 postinjury days. Normal and elevated levels of glucose accounted for 18% to 42% and 20% to 50% of all values during the initial 7 days. After 7 days, fewer subjects were studied (5 of 30), and the samples are skewed towards extremely low values.
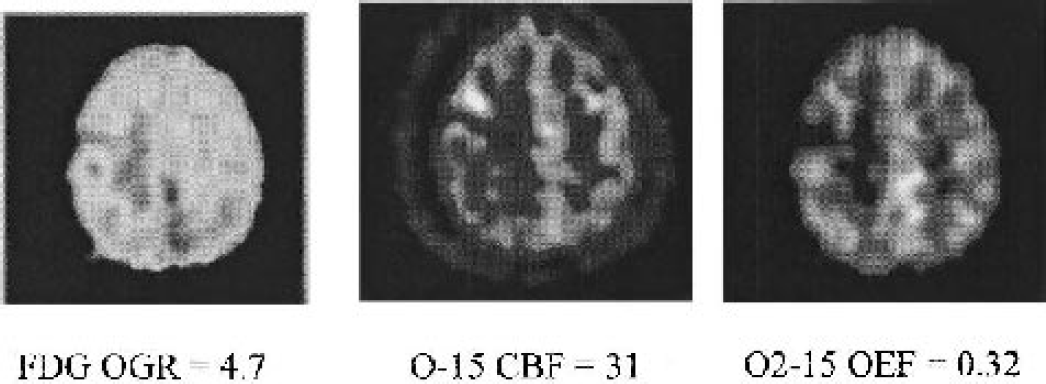
Regional extracellular glucose and lactate levels in right frontal lobe during positron emission tomography (PET) (glucose = 0.21 mmol, lactate = 0.96 mmol, lactate/pyruvate ratio = 21, hypoxanthine = 1.3).
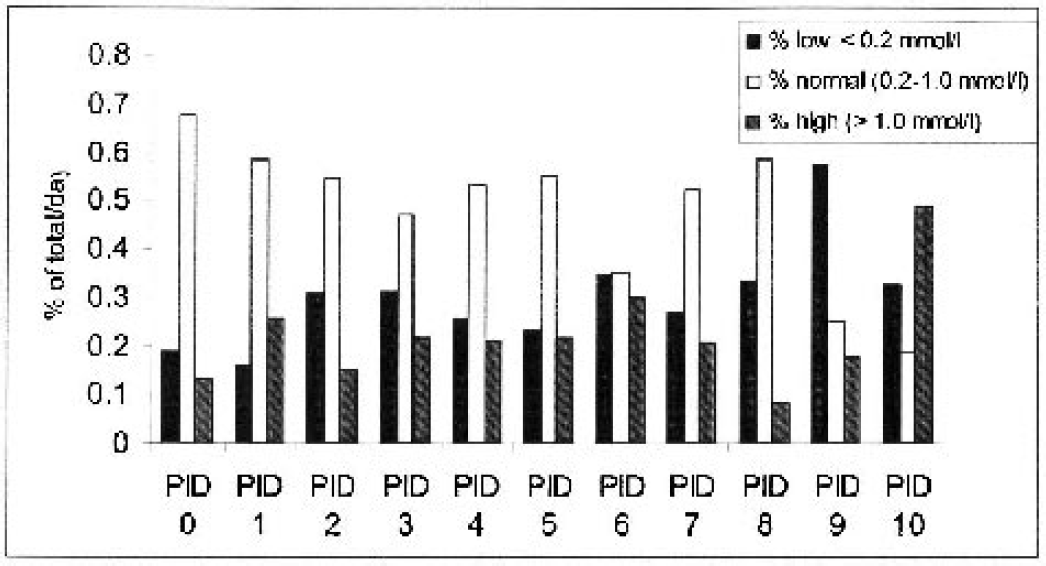
Distribution of all microdialysis glucose values by postinjury day. This graph shows the distribution of cerebral extracellular glucose values for the entire cohort segregated by the postinjury day. Shaded bars indicate the percentage of all low glucose values (less than 0.2 mmol), transparent bars indicate the percentage of all normal glucose values, and hatched bars indicate the percentage of elevated glucose values on each day.
Etiology of low glucose levels
Using a time-course analysis of matched hourly physiologic values, the following factors coincided with low glucose values: hypoglycemia (0%), jugular venous desaturation (3%), brain tissue oxygen desaturation less than 10 mm Hg (0%), reduction in CPP to less than 60 torr (3%), terminal herniation (with brain tissue oxygen desaturation) (6%), seizures (defined by EEG criteria) (10%), and unknown (72%) (Table 1). In addition, intermittent testing of a total of 185 samples of microdialysis glucose and lactate were compared with matched measures of global CBF and glucose metabolism. Global hyperglycolysis (Kety-Schmidt–derived metabolic rate of glucose greater than 5.8 mg · 100 g−1 · min−1) accounted for 2% of low microdialysis glucose values, all of which were less than 0.2 mmol/L. In contrast, global ischemia was present in 1.5% of global CBF measurements (less than 20 mL · 100 g−1 · min−1). These ischemic CBF events occurred during terminal events and were associated with low levels of microdialysis-measured glucose (less than 0.10 mmol/L). Extremely low levels of glucose (less than 0.1 mmol/L) lasting for 4 or more hours occurred in the context of terminal herniation, and were observed in all six patients with terminal herniation.
Prevalence of selected causes of low extracellular glucose levels
SjvO2, global jugular venous oxygen saturation; CPP, cerebral perfusion pressure; PTiO2, brain tissue oxygen pressure; EEG, electroencephalogram.
Rare transient reductions in extracellular glucose concentration occurred with reductions in CPP and seizures. When CPP was less than 70, there was a concomitant mean decrease in glucose of 0.2 ± 0.15 mmol/L that lasted for a mean of 1 hour. Figure 5 outlines an event of glucose reduction and modest lactate elevation with seizures. Six patients had terminal events in which brain herniation and global brain ischemia were documented by SjvO2, xenon CBF testing, and brain tissue oxygen concentration less than 10 mm Hg. An example of a terminal event is shown in Fig. 6. The hourly trend shows a marked reduction in glucose, and an increase in the lactate/pyruvate ratio and glutamate during the final 48 hours of monitoring. However, the lactate response was less well defined, with only a subtle increase during the terminal event. The lactate/pyruvate ratio progressively increased during the terminal event because of a marked reduction in pyruvate levels. Dramatic trend changes were not seen in nonterminal cases.
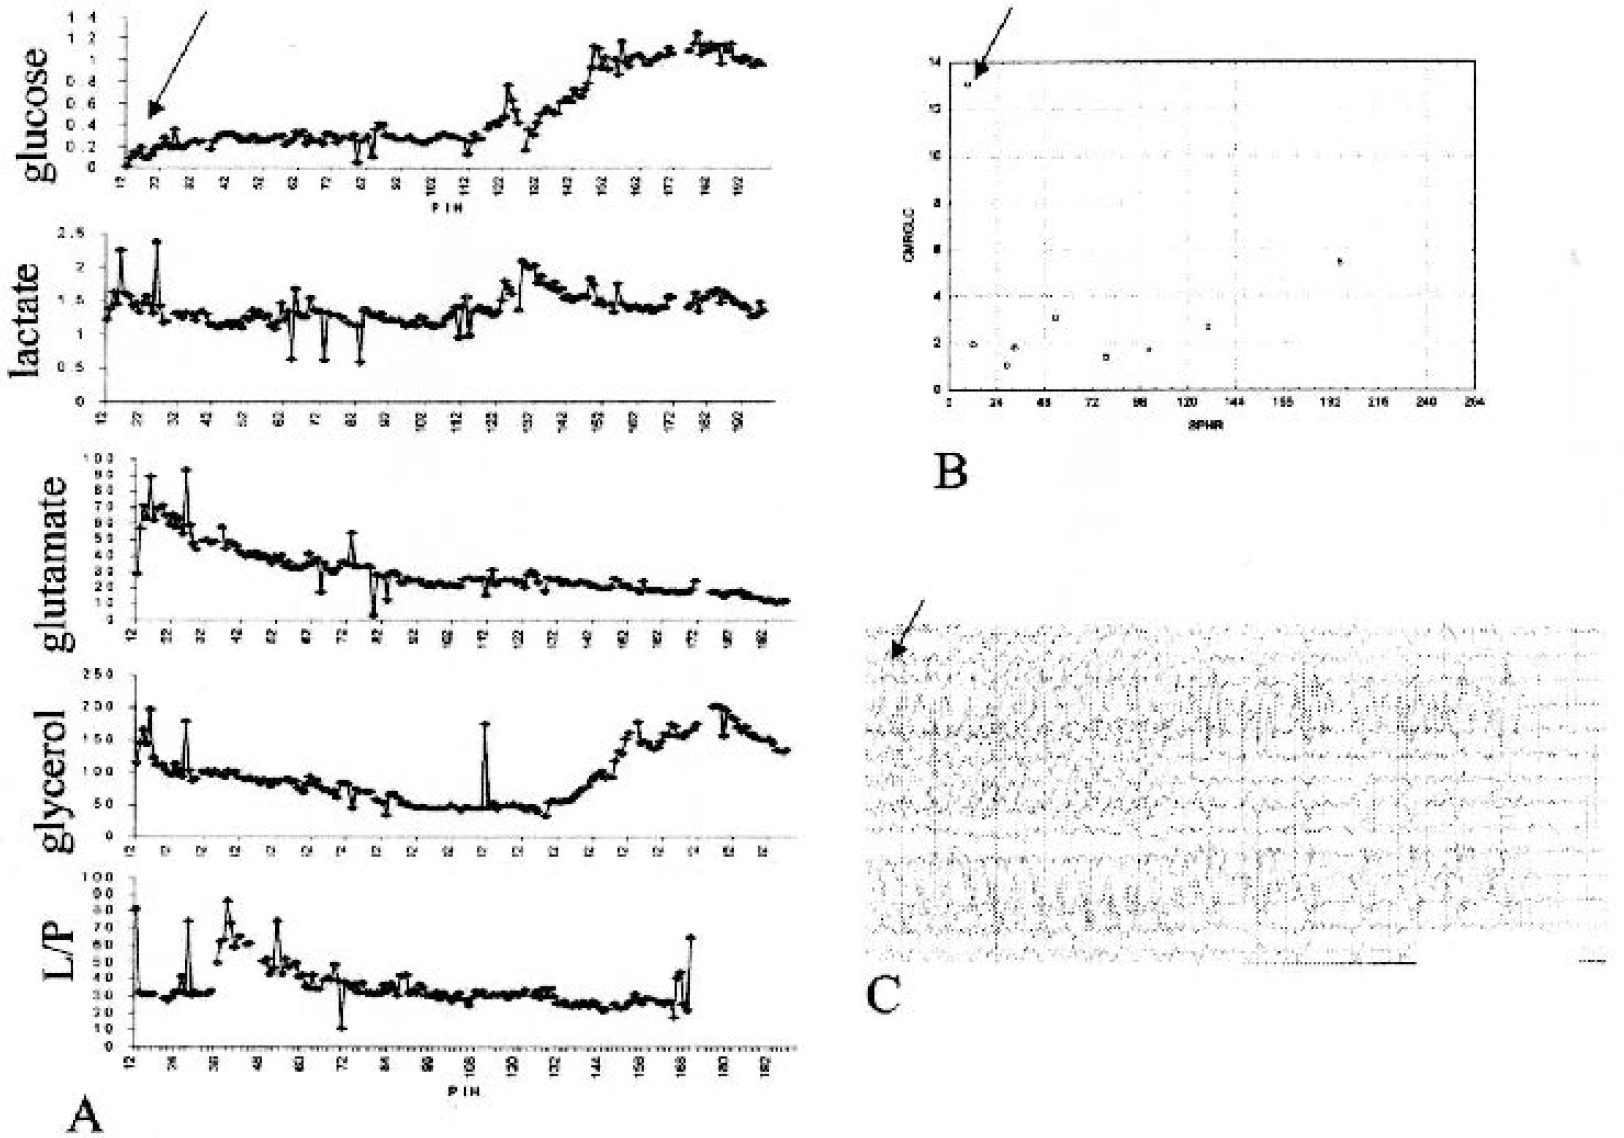
A composite figure showing a single patient who displayed a posttraumatic seizure-induced global hyperglycolysis in conjuction with low extracellular glucose levels.
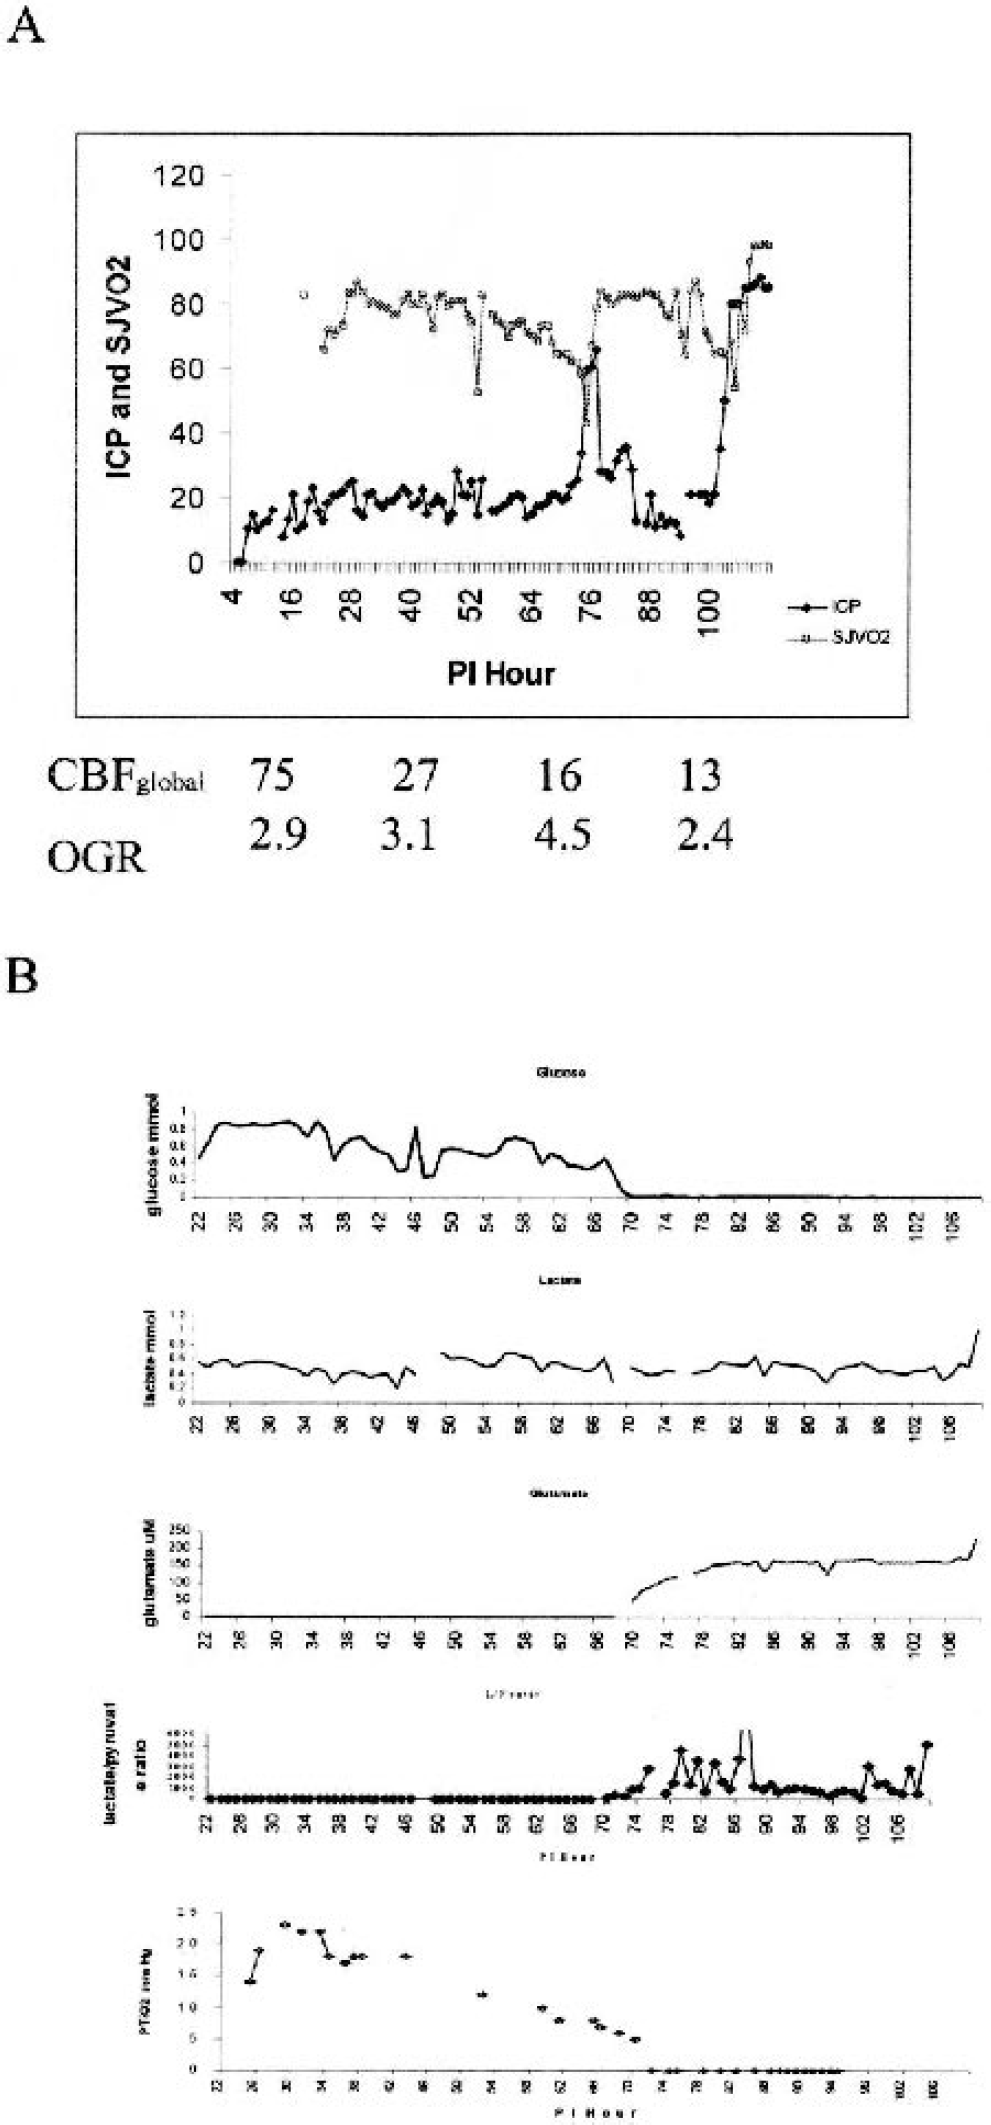
A composite figure showing a single patient who displayed a terminal herniation with a reduction in extracellular glucose levels in the context of global brain ischemia.
Distinct from global markers of ischemia, neuro-chemical markers of tissue metabolic crisis and ischemia contained within the microdialysis fluid were evaluated to determine the frequency of these markers during periods of low extracellular glucose. Lactate/pyruvate ratio of more than 40 is considered the best microdialysis marker of microenvironment ischemia (Enblad et al., 1996). In a sample of 479 hourly samples in which the glucose level ranged between 0.03 and 0.20 mmol/L, 31% of the lactate/pyruvate values were above the ischemic threshold and indicated focal ischemia. Despite a lack of markers of ischemia in most samples, glutamate levels were elevated (more than 5 umol/L) in 91% of the low-glucose samples. Glutamate elevations were present despite the absence other markers of tissue ischemia (i.e., reduction in CPP, SjvO2, PtiO2). In addition, elevated extracellular glycerol levels were present in 39% of the low-glucose samples. Thus, low extracellular glucose levels occurred in the context of one or more microdialysis markers of metabolic crisis, but were not specific markers of ischemia.
Extracellular lactate values
The hourly values of extracellular lactate across all patients ranged from 0.1 to 12.1 mmol/L. The distribution of lactate values for each patient was assessed in a manner similar to that for glucose. Lactate levels were greater than 1.2 mmol/L in 16% to 30% of samples during the initial 10 days after injury. Overall, there was no correlation between extracellular glucose and lactate concentrations (r = −0.06). During periods of low glucose, mean lactate concentrations were lower than during periods of normal glucose (0.76 ± 0.51 versus 1.01 ± 1.1 mmol/L, P<0.001). During periods of terminal herniation with very low glucose (less than 0.10 mmol/L), the mean lactate concentration remained in the normal range (0.83 ± 0.51 mmol/L). By comparison, the mean lactate/pyruvate ratio during terminal herniation was elevated but highly variable (400 ± 1000 umol/L).
Global measures of metabolism
Intermittent testing of CBF and metabolism with simultaneous microdialysis was performed in 513 samples from all 30 patients. As mentioned previously, the CBF was in the ischemic range 1.5% of the time, and ranged from 13 to 88 mL·100 g−1·min−1. Table 2 outlines the global metabolic data. Pairwise correlations were run to assess the relationship between each microdialysis analyte and global measures of CBF, CMRo2, CMRglc, and OGR. There was a poor correlation between each of the variables, and the strongest correlation (0.32) was found between CBF and glucose (Table 3). Next, the global metabolism measures obtained during a low-glucose period were compared with those in which the glucose level was in the normal or high range using analysis of variance (ANOVA). CBF was lower, but above the ischemic range, in the context of low levels of microdialysis-measured glucose (P<0.001). There was no association between microdialysis-measured glucose values and rates of oxidative or glucose metabolism. Table 4 summarizes these results.
Global measures of brain metabolism taken with microdialysis samples
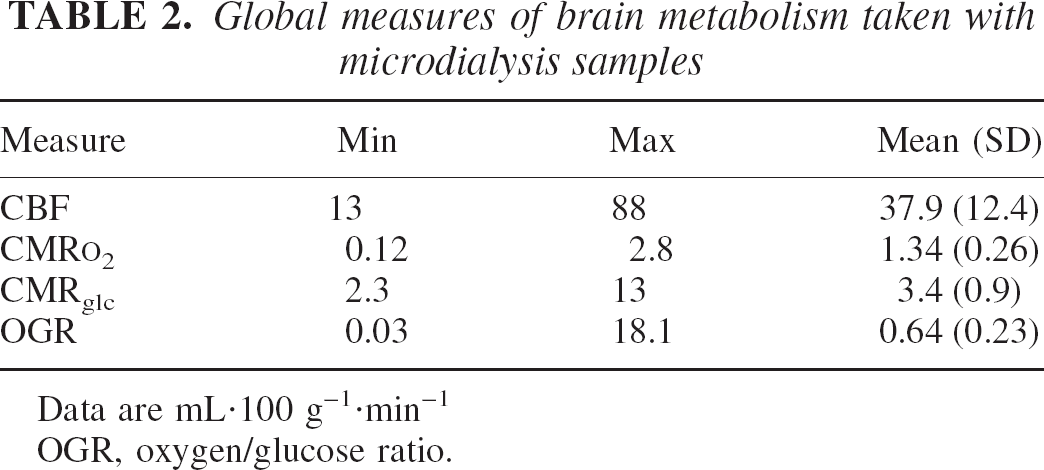
Data are mL·100 g−1·min−1
OGR, oxygen/glucose ratio.
Pairwise correlation matrix of global metabolic measures and microdialysis values
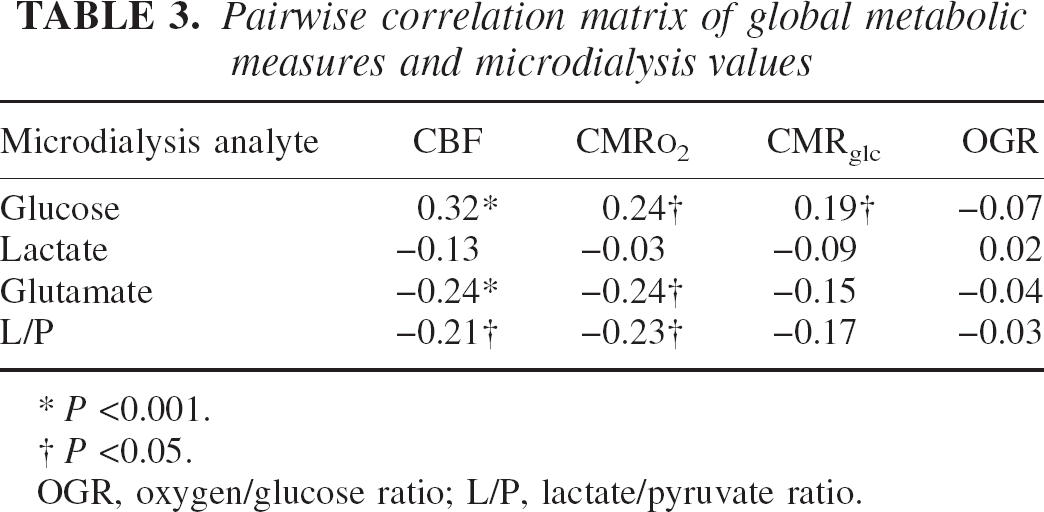
P <0.001.
P <0.05.
OGR, oxygen/glucose ratio; L/P, lactate/pyruvate ratio.
Relationship between microdialysis-measured glucose level and CBF, glucose metabolism, and oxidative metabolism
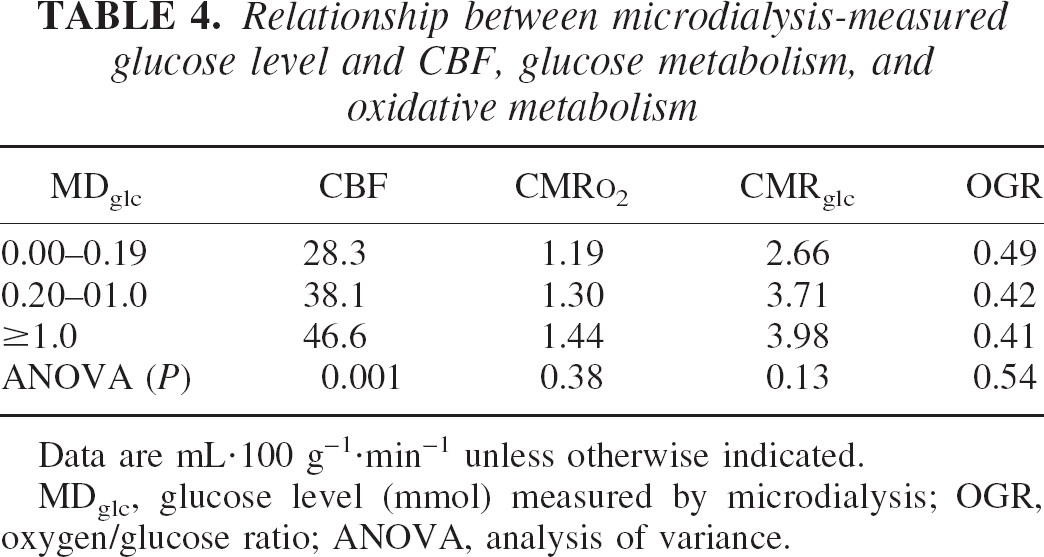
Data are mL·100 g−1·min−1 unless otherwise indicated. MDglc, glucose level (mmol) measured by microdialysis; OGR, oxygen/glucose ratio; ANOVA, analysis of variance.
Association between microdialysis and 6-month outcome
The mean hourly trends of glucose values over the initial 10 days segregated by 6-month GOSe score are shown in Fig. 7. Initial ANOVA of differences in the trend of glucose values over the entire time revealed statistical differences between the three GOSe groups (P<0001), with the GOSe 1 or 2 group demonstrating the lowest overall mean value. Visual inspection of the trends reveals a subtle difference in the trend of glucose concentration during the initial 50 postinjury hours. The GOSe 5+ group demonstrated a plateau in glucose in the high-normal range in contrast to the GOSe1 or 2 group in whom glucose was declining during postinjury hours 0 to 50. Similar mean hourly trends of lactate and lactate/glucose ratio are shown in Figs. 8 and 9, respectively. Initial ANOVA of differences in lactate and lactate/glucose trends over time revealed statistical differences (P<0.0001). Visual inspection of the lactate/glucose trends suggests that lactate/glucose values are lower during the initial 50 postinjury hours in the GOSe 1 or 2 and GOSe 5+ groups compared with the GOSe 3 or 4 group (P<0.001). However, the GOSe 1 or 2 group demonstrated a combined low glucose and lactate/glucose ratio during the initial 50 postinjury hours. There was no relationship between the overall time course or the early (50 postinjury hours) segment of the lactate levels.
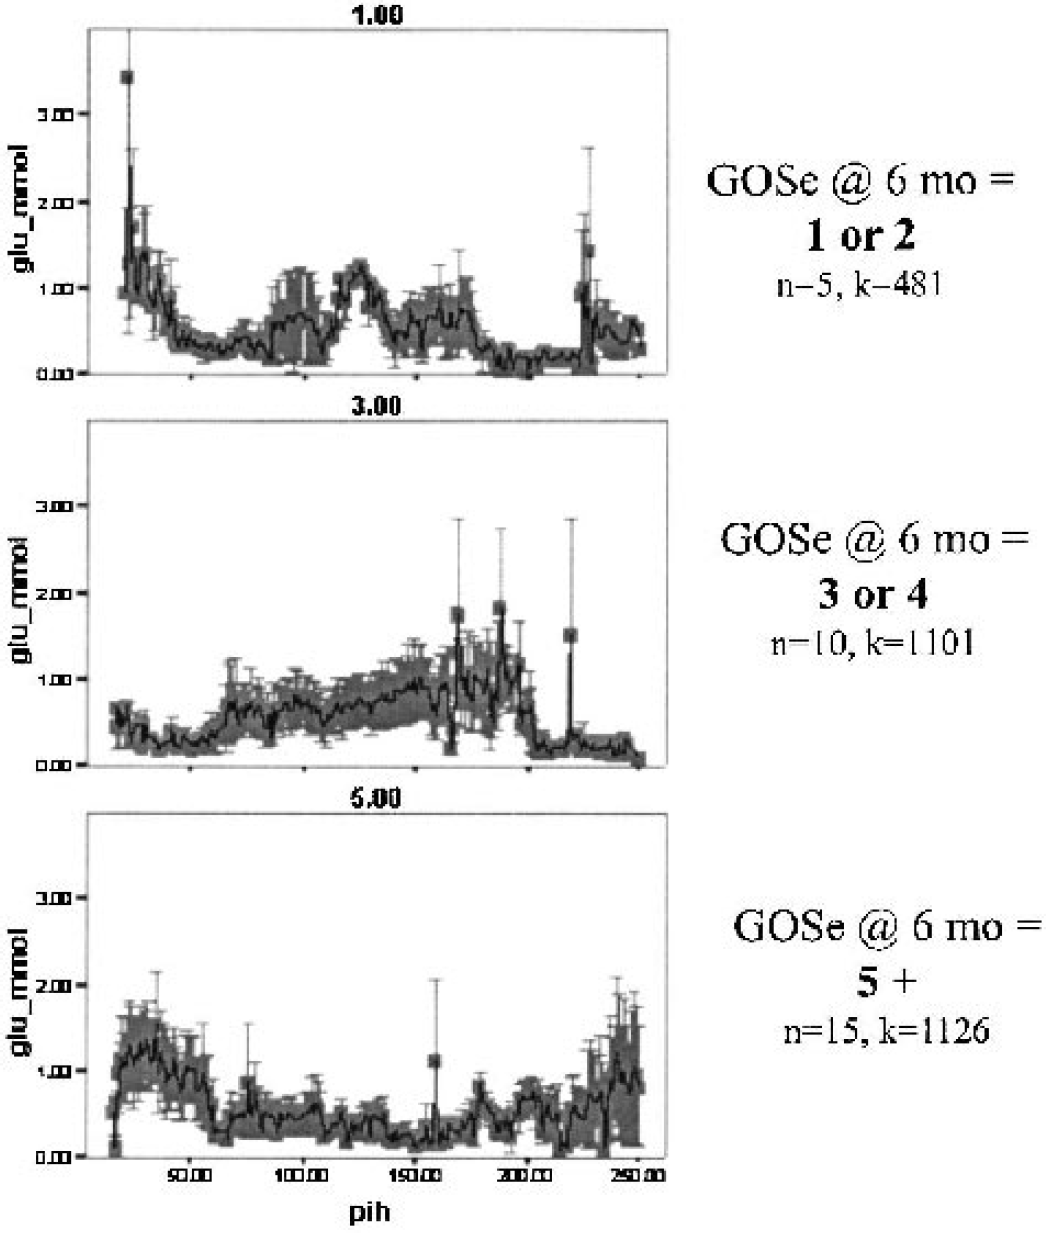
Mean hourly glucose values segregated by 6-month outcome scores. A series of three line plots of hourly glucose values (SD) segregated by the 6-month Glasgow Outcome Scale extended (GOSe) score. Normal glucose values during the initial 50 hours after injury are associated with good outcome.
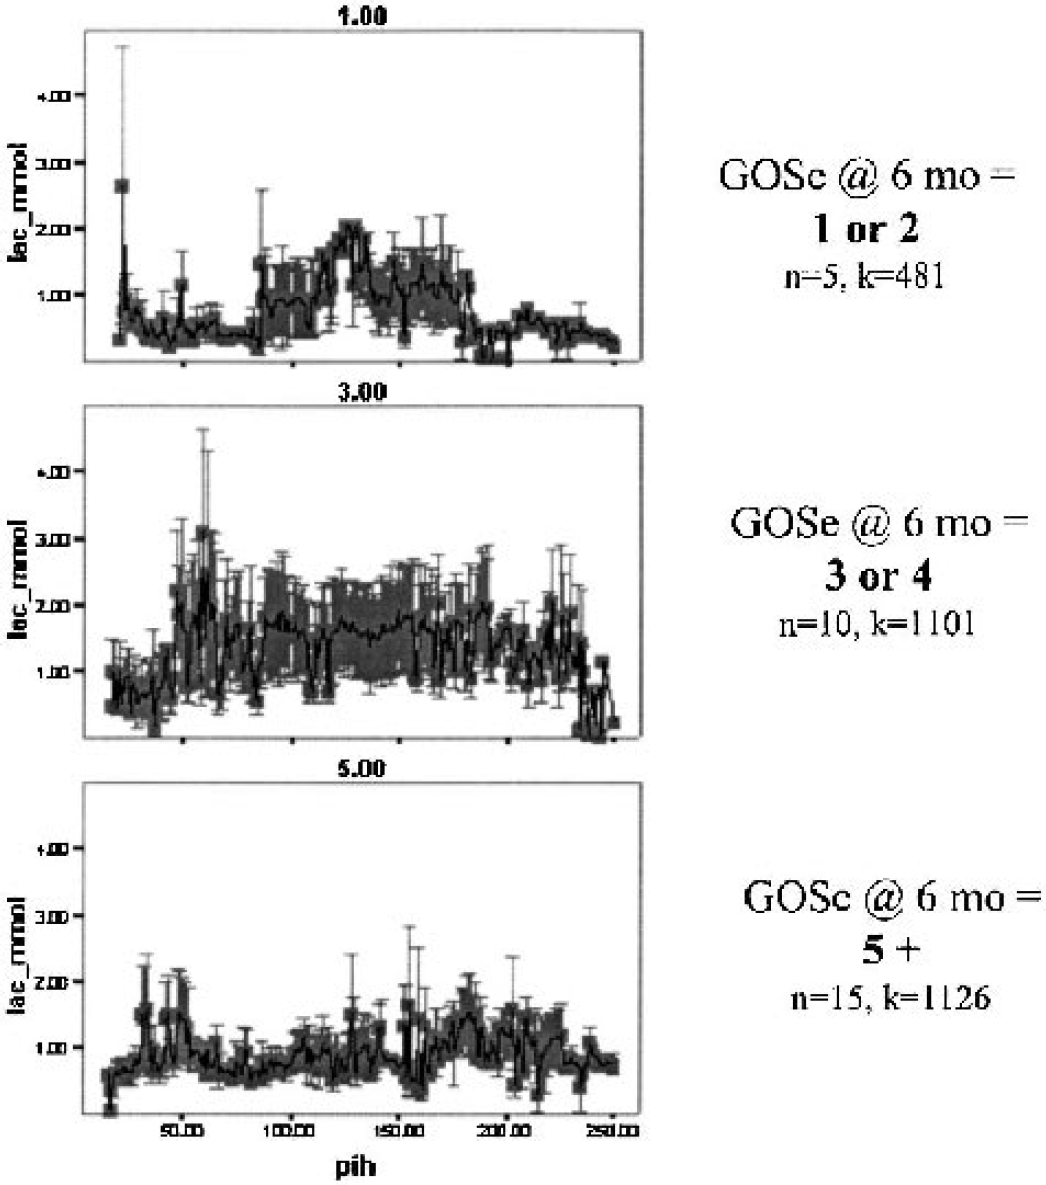
Mean hourly lactate values segregated by 6-month outcome scores. Series of line plots showing the percentage of high lactate (more than 1.1 mmol) that occurs in each outcome group, segregated by the 6-month Glasgow Outcome Scale extended (GOSe) score. Poorer outcome is associated with a longer total duration of high lactate concentration.
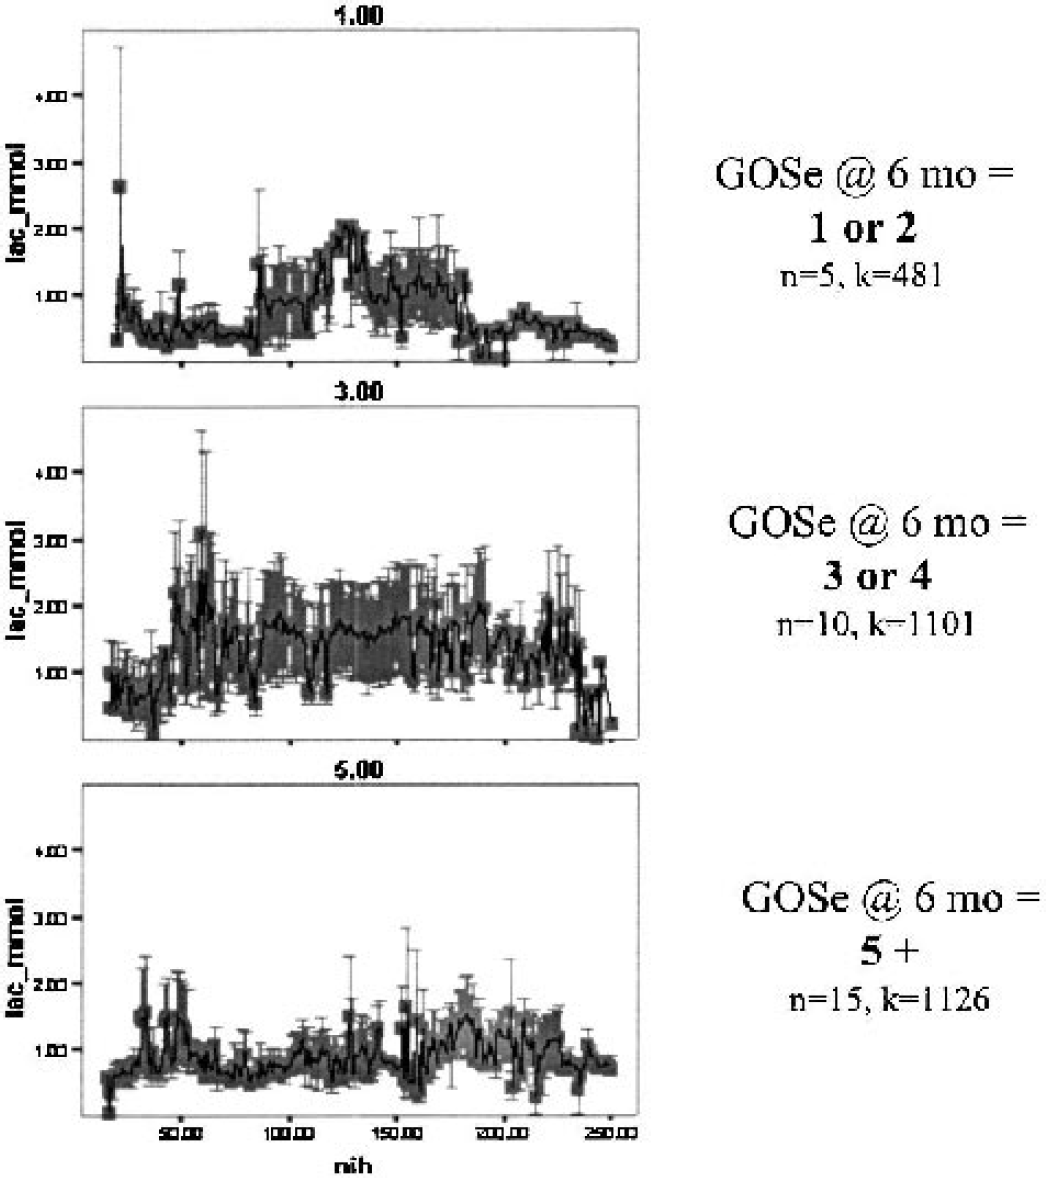
Lactate/glucose trend segregated by outcome. A series of three line plots of hourly lactate values (SD) segregated by the 6-month Glasgow Outcome Scale extended (GOSe) score. Normal lactate values during the initial 50 hours after injury are associated with good outcome.
When adjusted for a case-based analysis of these data, a regression analysis was conducted to determine the influence of levels of glucose and lactate and the lactate/glucose ratio on outcome. Using the case-based approach, analysis of the overall trends revealed that only the lactate/glucose ratio was higher in the GOSe 1 or 2 group compared with the GOSe 3 or 4 and GOSe 5+ group (P<0.01). If this trend analysis was restricted to the initial 50 postinjury hours, only the lactate/glucose ratio was predictive of outcome (P<0.04). Subgroup analysis excluding data from the terminal herniation periods revealed similar relationships among levels of glucose and lactate and lactate/glucose ratio (Table 5).
Means and significance tests of glucose, lactate, and lactate/glucose ratios
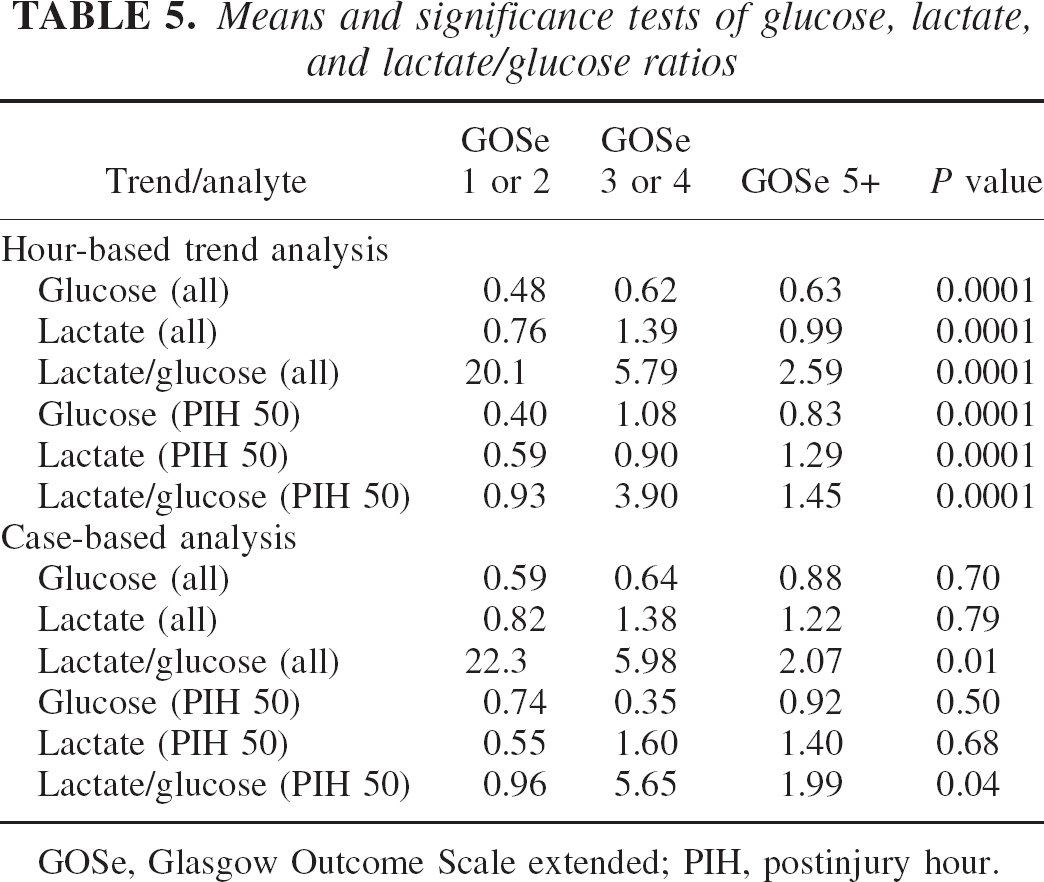
GOSe, Glasgow Outcome Scale extended; PIH, postinjury hour.
The impact of cumulative exposure to low levels of glucose were explored by comparing neurologic outcome for those patients with low glucose levels for prolonged periods. The percentage of low glucose values across all measured values was segregated by 6-month GOSe score. Eleven patients demonstrated prolonged exposure to low glucose levels and 19 did not. The 6-month GOSe score was lower in those patients with prolonged low glucose exposure compared to those without this condition [odds ratio (OR): 2.6; 95% CI: 1.96–3.6; P<0.001). A similar relationship was found between duration of low glucose and the Disability Rating Scale score (OR: 3.25, 95% CI: 0.85 − 12.5; P<0.001.
Regression analysis was performed to determine if low extracellular glucose is an independent predictor of outcome when traditional predictors of outcome were assessed in the model. The traditional predictors that were considered were initial Glasgow Coma Scale score (best in 8 hours), initial computerized tomography scan score (Marshall et al., 1992), pupil reactivity, initial hypoxemia, initial hypotension, age, and presence of elevated intracranial pressure. No independent effect of low glucose levels could be found using this model. For completeness, mean values of major analytes segregated by post-injury day are presented in Table 6.
Mean (SD) concentrations of main metabolic analytes segregated by postinjury day
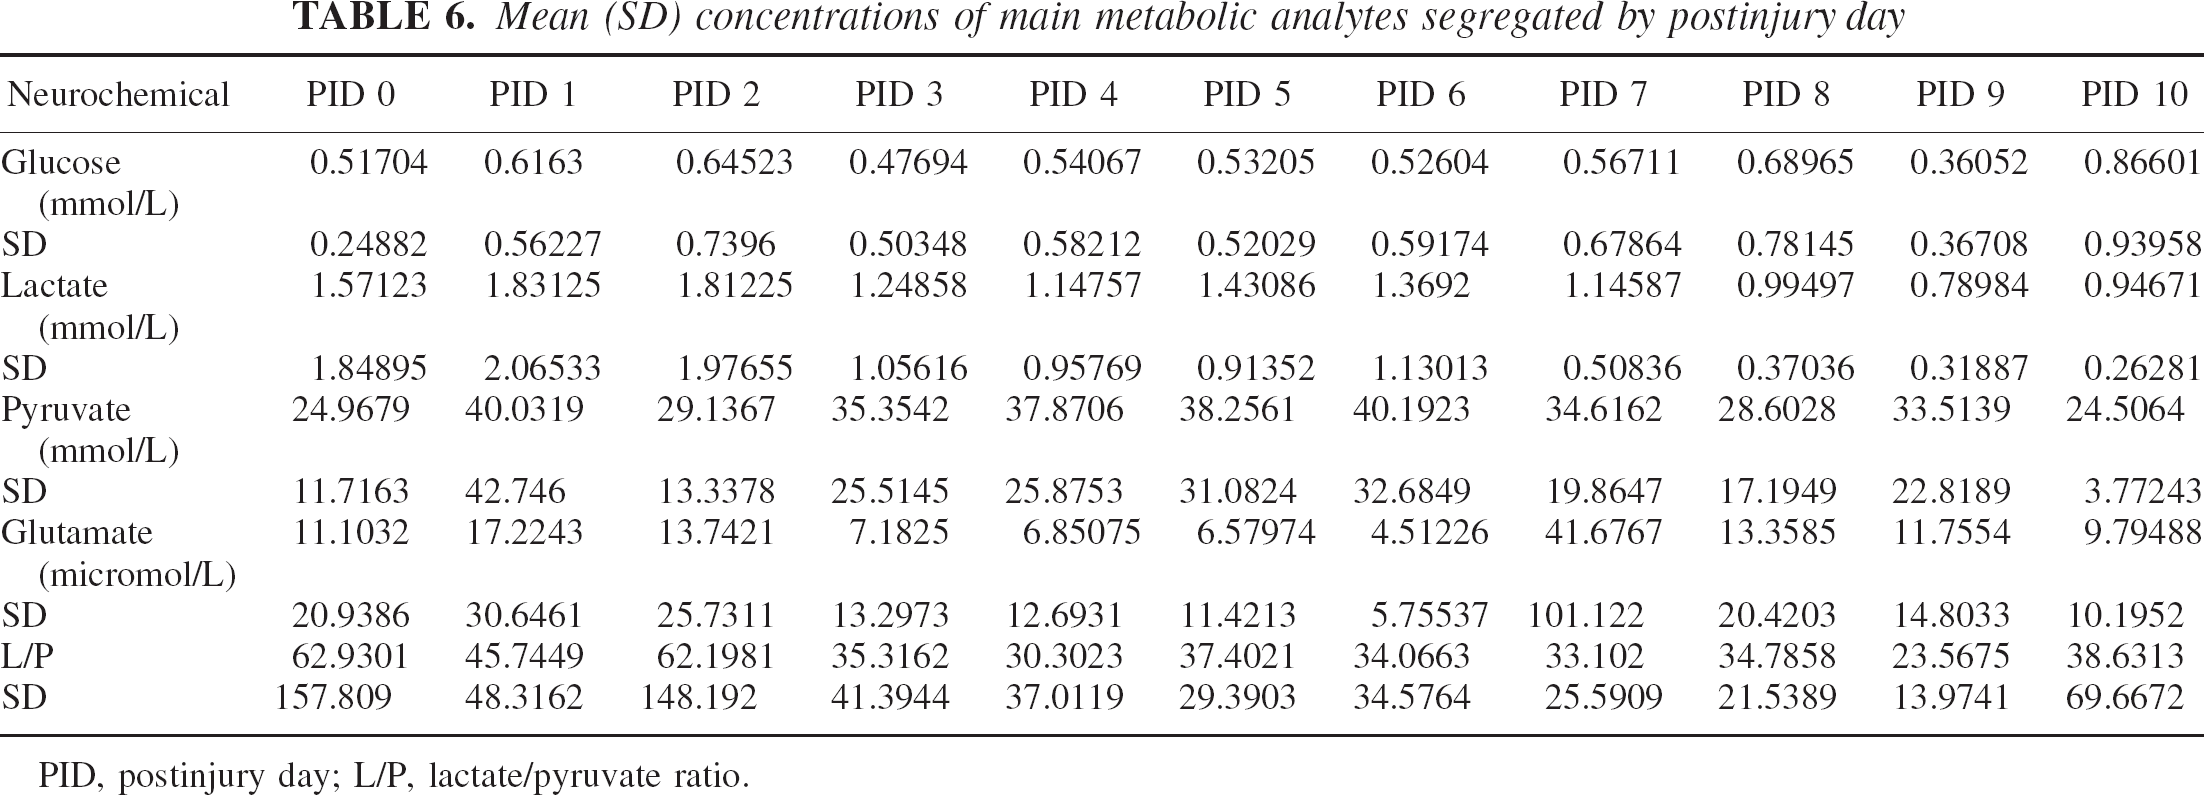
PID, postinjury day; L/P, lactate/pyruvate ratio.
DISCUSSION
This human microdialysis study reports several time-dependent observations of the behavior of extracellular glucose and lactate after traumatic brain injury. Between 15% to 30% of all values of extracellular glucose are reduced below a critical threshold after TBI. The majority of low glucose values occur in the absence of identifiable secondary ischemic insults, but persistent glucose values less than 0.1 mmol/L lasting over 4 hours occur only with terminal events. Low glucose values are associated with markers of metabolic crisis as indicated by increased extracellular glutamate. The mean lactate/glucose ratio over the entire course best predicted 6-month outcomes. Finally, reduction in glucose and lactate/glucose ratio during the initial 50 postinjury hours is associated with a poor outcome, indicating that there exists a critical time window of unexpectedly low lactate levels in poor-outcome patients.
Normal extracellular glucose concentrations
The normal extracellular glucose concentration in human brain has not been well established. Normative data are dependent on several technical factors, including the perfusion rate. Preliminary data from anesthetized neurosurgical patients in which the microdialysis probe is placed in uninjured brain tissue with perfusion rate of 2 uL/min have showed that glucose values of 0.5 to 1 mmol/L and lactate values of 0.6 to 1.1 mmol/L are considered normal. Similarly designed microdialysis measurements obtained in awake epilepsy patients with sampling of nonepileptic tissue and perfused at 2.5 uL/min showed mean glucose values of 0.82 ± 0.27 mmol/L and mean lactate levels of 1.3 ± 0.49 mmol/L (Abi-Saab et al., 2002).
In brain trauma patients in which microdialysis was conducted in minimally injured brain at a rate of 2 uL/min and under conditions of normal intracranial pressure and normal tissue oxygenation, reports of mean glucose values have ranged from 0.5 to 1.1 mmol/L (Alessanrdi et al., 2000; Goodman et al., 1999). Careful assessment of the perfusion rate is required when comparing various studies. With reduction in the perfusion rate to 0.3 uL/min, the in vivo recovery increases (Hillered and Persson, 1999; Hutchinson et al., 2000a; Reinstup et al., 2000; Stahl et al., 2001b) with glucose and lactate values in the range of 2.5 and 3.5 mmol/L, respectively. In the current study, at a perfusion rate of 2 uL/min, we obtained values similar to those found in previous studies, and had a similar response of increased basal levels with reduction in perfusion rate to 0.3 uL/min. Thus, at the perfusion rate of 2 uL/min used in the current study, the probe in vivo recovery of 56% compares favorably with the previously reported 70% recovery at perfusion rates of 0.3 uL/min (Hutchinson et al., 2000b). Thus, perfusion at 2 uL/min provides reasonable in vivo recovery so that relative changes in the extracellular glucose concentration can be tracked as reliably as with a slower perfusion rate of 0.3 uL/min.
Etiology of low glucose levels
Using a glucose threshold of less than 0.2 mmol, we found that the majority of episodes of low glucose levels occur independent of overt secondary clinical insults and independent of changes in systemic glucose levels. Persistent low extracellular glucose levels (less than 0.2 mmol/L for greater than 20% of the time) correlated independently with a poor outcome at 6 months. This finding suggests an effect of duration of low glucose levels on eventual brain function and does not simply indicate the severity of primary injury. Given the relationship between regional glucose utilization and glucose values below the 0.2-mmol/L threshold, these data suggest an increase in glucose utilization during the acute postinjury period.
Measurement of regional and global CBF and brain oxygenation did not reveal frank ischemia or cerebral deoxygenation. Our results mirror similar findings of poor correlation between ischemia and extracellular glucose (Alessandri et al., 2000; Valadka et al., 1998). This observation is tempered by concurrent microdialysis lactate/pyruvate data that suggest that 30% of the low glucose concentrations are associated with very focal ischemia, indicated only by the elevated lactate/pyruvate ratio. A lactate/pyruvate ratio greater than 40 has been correlated with regional ischemia in PET studies (Enblad et al., 1996; Hutchinson et al., 2002), whereas an increased glutamate value has not been uniformly seen with tissue ischemia. Increased extracellular glutamate levels may occur with seizures and other nonischemic insults (Vespa et al., 1998). The presence of elevated glutamate concentrations ranging from 5 to 260 umol/L suggests that the low glucose concentrations are associated with ongoing cellular injury or metabolic crisis, despite the absence of ischemia (defined by clinical indicators, CBF measurements, and increases in the lactate/pyruvate ratio). This begs the question of whether the definition of ischemia after TBI is really understood. Given the limitations in online detection of brain ischemia and the poor correlation between brain tissue Po2 and PET measures of ischemia (Gupta et al., 2002), one cannot entirely rule out that very focal ischemia was present. Therefore, the nature of ongoing cellular injury is not entirely clear from the available data, but the majority of occurrences of low glucose levels are not due to global, regional, or very focal brain ischemia.
Persistent very low levels of glucose (less than 0.1 mmol/L) appear to be a function of limited glucose supply caused by ischemia only in a few patients with terminal herniation events. Substrate (e.g., glucose) limitation is well documented in animal and human studies (Landolt et al., 1994; Langemann et al., 2001). Substrate limitation occurs with terminal herniation events or with development of brain infarction during ischemia in patients with brain trauma and subarachnoid hemorrhage (Abi-Saab et al., 2002; Hucthinson et al., 2002; Persson et al., 1996; Unterberg et al., 2001). In this context, the reduction in brain tissue Po2 did correlate with low glucose levels, a finding in agreement with that reported by Valadka and colleagues (1998). The occurrence of this terminal herniation pattern (i.e., very low glucose level and elevated lactate/pyruvate ratio) was infrequent in the present study and represents a distinct clinical entity that is beyond the hope of treatment.
The majority of low glucose values appear to be due to reasons other than substrate limitation or ischemia. We have termed this etiology as occult, related primarily to the brain trauma. Given that low levels of glucose are uniformly associated with increased glycolysis, that low glucose values do occur in conjunction with all cases of documented hyperglycolysis in this series of patients, and that low glucose is coassociated with increased glutamate in over 90% of the time, it is tempting to speculate that continued hyperglycolysis is responsible for the majority of the low microdialysis-measured glucose values reported herein. Regional and global hyperglycolysis during the initial 5 postinjury days has been documented (Bergsneider et al., 1997). The initial intent of measuring extracellular glucose in a continuous fashion has been to use this as a surrogate marker for glucose utilization. However, this study lacks sufficient data to show that all low microdialysis-measured glucose values are due to hyperglycolysis, but the high concurrence of elevated glutamate with low glucose levels and the uniform reduction in oxidative metabolism are suggestive of hyperglycolysis.
Alternative explanations for the low extracellular glucose values need to be considered. As previously mentioned, the lack of global brain ischemia or limitation of CBF may not reflect transient microenvironment ischemia. The ischemia may be very focal and/or beyond the sensitivity range of current sensors (Valadka et al., 1998). However, no evidence of focal stroke lesions occurred in the area of the probe on follow-up neuroimaging. A second possibility is that the transfer of glucose across the blood–brain barrier occurs in the perivascular astrocytic foot processes without the direct transfer of glucose into the extracellular space (Pellerin and Magistretti, 1994), resulting in a net reduction in the extracellular glucose level without a net increase in overall glucose utilization. A third possibility is that transient reduced probe efficiency due to brain edema results in an observed reduction in the microdialysis-measured glucose level (Benveniste, 1989). Evidence against this latter possibility is our measurements of steady probe recovery over time as reflected by stable urea values (Ronne-Engstrom et al., 2001) and preserved in vitro recovery after probe removal.
Microdialysis indicators and outcome
The present results indicate that several microdialysis markers are related to outcome at 6 months. These results extend previous relationships between microdialysis and acute mortality (Bullock et al., 1998; Goodman et al., 1999) and offer a unique perspective about glucose and the lactate/glucose ratio. Higher levels of lactate have been previously related to excess mortality (Goodman et al., 1999); however, this relationship is related in part to measurement of terminal events. Our results are similar to those of Cesarini et al. (2002), who demonstrated good outcome with an initial higher glucose concentration in subarachnoid hemorrhage patients. In the present study, we found that when terminal events were excluded, this relationship between lactate/glucose and outcome is the only variable that predicts outcome at 6 months. With higher mean lactate/glucose ratio, there is a greater likelihood that a poor outcome will occur. In contrast, analysis of the time course of the levels of glucose and lactate and lactate/glucose ratio show that within the initial 50 hours after injury, the lactate/glucose ratio is low in both the poor-outcome group (GOSe 1 or 2) and the excellent-outcome group (GOSe 5+). This indicates that the lactate/glucose ratio changes over time and that during a critical time window, the L/G ratio is not indicative of eventual outcome. The significance of a low lactate/glucose ratio during this time window will be discussed below.
Although it was not possible to perform repeated measures of regional glucose utilization, this conclusion cannot be independently confirmed with the available data. However, experimentally induced stimulation leads to increased glucose utilization after primary injury in the rodent fluid-percussion model and is preliminarily associated with increased cell loss (Ip et al., 2001). Thus, our clinical findings are consistent with the concept that persistent increased glucose utilization occurs and may lead to worsened outcome.
Lactate paradox
The expected response of increasing extracellular lactate level during periods of reduced glucose was not uniformly seen during reversible adverse events or terminal herniation events. The lactate/pyruvate ratio does increase with reversible adverse events and terminal herniation. After critical inspection of the available literature, it seems that an increase in lactate level is not a uniform finding. This paradox of a lack of increase in lactate concentration despite a reduction in glucose and the positive correlation between extracellular glucose and lactate levels were unexpected findings. Moreover, the lactate/glucose ratio is unexpectedly low in both the good-outcome and poor-outcome groups during the initial 50 postinjury hours, but later increases in the poor-outcome group. This early low lactate/glucose ratio is suggestive of lactate being consumed or not produced during the early phase after injury. Given the correlation between low extracellular glucose levels and increased glucose utilization, lactate consumption would be a more likely possibility.
The ability of the brain to use lactate under conditions of distress is well established (Pellerin and Magistretti, 1994), with lactate utilization leading to a relative sparing of glucose utilization (Ros et al., 2001). Increases in glucose may reflect a facultative response to this insult with an increase in glucose levels (Jones et al., 2000) and may indicate an initial increase in CBF and glucose delivery that then stabilizes. Thus, the current study shows that extracellular glucose and lactate concentrations are dynamic and reflect changes in cellular metabolism during periods of transient and terminal tissue distress.
CONCLUSION
The main findings of this study are that the extracellular glucose concentration is low after TBI and is associated with microdialysis markers of tissue distress and with poor outcome. In addition, combined low glucose levels and increased lactate/glucose ratio rather than increased lactate levels alone are associated with a poor 6-month outcome. The etiology of most occurrences of low glucose is unknown, but low glucose levels can result from posttraumatic hyperglycolysis and secondary insults, namely seizures and brain herniation that increase glucose utilization or reduce glucose supply. Combined low glucose and lactate levels within the initial 50 hours after injury are seen in poor-outcome patients, indicating that a metabolic crisis occurs in the absence of ischemia in this group. This metabolic crisis may have clinical importance given the early postinjury time window in which it occurs. This metabolic crisis of combined low glucose levels without a commensurate increase in lactate levels suggests a fundamental departure from standard hyperglycolysis. This relationship between extracellular glucose and lactate after human TBI requires additional study to determine the mechanism (e.g., lactate utilization) by which it can occur.