
Abstract
Oxygenation-induced contraction of nonconfluent cultured human brain microvascular endothelial cells (HBECs, n = 30) was examined by video-enhanced contrast-differential interferential contrast microscopy. After administering a continuous gentle blow of pure oxygen gas to the surface of the medium just above the flattened HBEC, the plasma membrane exhibited tensioning and wrinkling, resulting in a strong contraction of the cell body by 14 ± 7% (P < 0.001). When the cell stopped contracting, transient formation of a fiber network starting from certain spots (possibly adhesion plaques, though these were not visible in the majority of cases) and expanding to the whole cell was observed. The occurrence of fiber network formation was statistically significant (26 of 30 separate cells, P < 0.05). After cessation of oxygen delivery, the observed network of fibers broke up rapidly (in a period of 3.3 ± 1.2 seconds) into small particles of <0.5 μm in diameter, which subsequently fused into the cellular structure. The HBEC completely recovered the control appearance. The sequential process was completed within 30 seconds and was reproduced in individual cells each time that oxygen gas was supplied. The authors conclude that the HBEC strongly contracts in response to a transient oxygenation stimulus, followed by rapid formation/disassembly of a network structure.
Keywords
The mechanisms underlying hyperoxygenation-induced changes in tissue blood flow remain poorly understood despite a long history of investigation (Hudetz, 1997; Kety and Schmidt, 1948; Krogh, 1918; Meyer and Gotoh, 1961; Opitz and Schneider, 1950). Based on continuous recording of respiratory gases in arterial blood and jugular venous blood, Meyer et al. (1967) found that pure oxygen gas inhalation produced a marked arterial Po2 rise by 365 mm Hg (from 70.8–435.0 mm Hg, n = 6), whereas the brain tissue Po2 rose by only 9.0 mm Hg (from 25.8–34.7 mm Hg, n = 4) in men. It seemed highly likely that oxygen directly constricted pial arterioles but, strangely, no explicit evidence was forthcoming (Purves, 1972). This contrasted to the effect of hypoxia, which dilated the pial arteries in cats (Craigen Jennett, 1981). Recently, Sjoberg et al. (1999) reported that the cerebrocortical capillary blood flow was reduced by 11% during hyperoxemia, as measured by a hydrogen clearance method in anesthetized pigs. These data indicate that oxygen causes a selective reduction in blood flow at specific flow levels.
To examine the response of cultured human brain microvascular endothelial cells (HBECs) to high oxygen levels, we used video-enhanced contrast-differential interference contrast (VEC-DIC) microscopy, which enabled us to observe cultured cells in a living state at high magnification (Tomita et al., 1996a). With this technique, we have already shown that cultured human umbilical cord vein endothelial cells (HUVECs) contracted by approximately 20% on exposure to hyperoxygenated superfusing fluid (Tomita et al., 1995). In the present paper, we report the occurrence of a similar contraction in the HBEC in response to oxygen. However, in the present study we also observed a peculiar fiber network formation/disassembly process in the HBEC, in association with the contraction. Therefore, we describe for the first time dynamic morphologic changes of HBECs that are apparently of essential importance for the vasoactive behavior of capillaries, which until now have been considered to be rather passive and quiescent.
MATERIALS AND METHODS
Human brain microvascular endothelial cells of passage 2 were purchased from Dainippon Pharmaceutical Co., Ltd. (Osaka, Japan), which had imported cryopreserved cells (#376) from Cell Systems Corporation (Cambrex Corp., East Rutherford, NJ, U.S.A.). The cells were confirmed to be endothelial cells on the basis of low-density lipoprotein uptake and positive von Willebrand factor/factor VIII. Cells were seeded onto polystyrene dishes (Corning Petri dishes) containing a 175-μm thick glass coverslip coated with attachment factor (Cell Systems Corporation), and incubated in a humidified 5% CO2/95% O2 atmosphere at 37°C. The medium (Dulbecco modified Eagle medium: 45% + F12 45% + fetal bovine serum 10% + b-FGF 10 ng/mL) without astroglial cell supplement was changed every day, and observations were made at the fourth day after seeding. The coverslip with endothelial cells was attached with glue to a plastic dish, the bottom of which had a round window, so as to form the floor of a microscopic observation chamber (containing the cells). The dish was placed in a temperature-controlled metal housing unit to maintain the cell temperature at 37°C, and the coverslip was mounted on the objective lens of an inverted microscope with oil, so that subsequent video pictures would capture the ventral side of the cell. The cells were superfused continuously with the culture medium using a double pump system (infusion and suction pumps) and were maintained at 37°C in the microscopic observation chamber with a small heating pad and thermostat. Video images of the cells were contrast enhanced digitally in real time using our VEC-DIC microscopy technique at ×4000 using a halogen lamp with an ultraviolet-cut filter (Tomita et al., 1996a). A preparation of HBECs was set in place and a spread cell was selected for observation of morphologic changes. The amount of medium submerging the cell was adjusted so that the medium surface was apparently situated close to the vertex of the cell nucleus. Since the cell body was very flat (except for the nuclear region), approximately 5 (3–10) μm at the vertex and tapering to 0.3 μm at the peripheral part (Inoue et al. 1999), the surface of the medium was approximately 50 μm above the floor. After waiting for a certain period for control observation (20 minutes to 1 h), pure oxygen gas was blown gently onto the surface of the medium through an injection needle (#26), which was directed towards the cell at an angle of 30 degrees. The speed of gas introduction was a few milliliters per minute, which was so slow that ripples on the surface of the medium were barely visible. The period of oxygenation was usually less than 1 minute. This method was adopted because the previous method of superfusion with an oxygenated fluid involved a delay in the carrying tube and led to smearing of oxygen tension changes. Cell morphologic changes were videotaped, and selected parts of the images were further fed into a computer via a frame grabber card (Scion Corporation, Frederick, MD, U.S.A.) at frame rates of 2 to 15 frames/s (2–15 Hz) for analysis of details of the morphologic changes. The oxygen tension of the medium was monitored with a platinum electrode (applied potential: −0.5 V) with reference to an Ag-AgCl electrode. Although the medium was usually superfused slowly through the observation chamber with the infusion pump at the inlet and the suction pump at the outlet, observations were made mostly under static conditions of the fluid with a momentary (≤3 minutes) stoppage of the pumps. As described in Results, we confirmed that no changes in cell morphology occurred with changes in wall shear rate, which was altered by adjustment of the pump speed so as to be from 0 to 200 μm/s (the wall shear rate was calculated from the fluid thickness and volume flow passing through the chamber, assuming Newtonian properties of the superfusing fluid). To exclude other physical factors, the following were tested: fluid removal by using tissue paper; changes of temperature from 10°C to 40°C by controlling the thermostat of the circulating water; and vibration of the fluid by blowing air into the liquid. Electrical stimulation with a square pulse/triangular pulse (0.5 to 3.0 V DC/AC at frequencies of 1–100 Hz) was provided through a pair of bipolar electrodes placed in the medium above the cell.
For analysis of the rapid morphologic changes, subtraction between two frames was performed in some cases on a Scion domain by subtraction of the first image of the brain surface (control video image) from each subsequent experimental image (F-C subtraction), or by frame-by-frame subtraction in a series of frames (F-F subtraction). The contraction was broadly estimated from the diameter change of the cell body (%) as (D12–D22)/D12, where D1 is the control diameter measured at a line passing through the center of the cell and D2 is that after the contraction. The magnification was about ×3,200 or 50 μm in the full width of the monitor window, and this was confirmed from the red blood cell size (7.5 μm). The speed of extension of network formation was estimated from the frame-by-frame differential distance (μm) divided by the frame interval (seconds).
RESULTS
The HBECs changed their shape depending on the phase of their growth. When HBECs at the fourth day after seeding, as used in the present study, were spread on a glass coverslip, they exhibited a broadly similar shape and size to those described previously for HUVECs (Inoue et al., 1999): a round-top nucleus containing one or two nucleoli, and a cell body surrounded by a thin, widely spread transparent marginal portion (Fig. 1, top left), forming various flat (lamellar) or projecting radial and spiky structures (lamellipodia and filopodia). The outer boundaries of the cell were usually not discernible with the naked eye but were visible as a mesh or bundles of fibers when the actin was stained with rhodamine phalloidin. HBECs were rather opaque and their intracellular organelles were not clearly visible, whereas the intracellular organelles of HUVECs could be observed; tubular structures (presumably mitochondria), vesicles, and large or small granules or particles that glided or were translocated in a vectorial fashion, presumably along the microtubules, were noted. However, we did not observe fiber formation in contracting HUVECs.
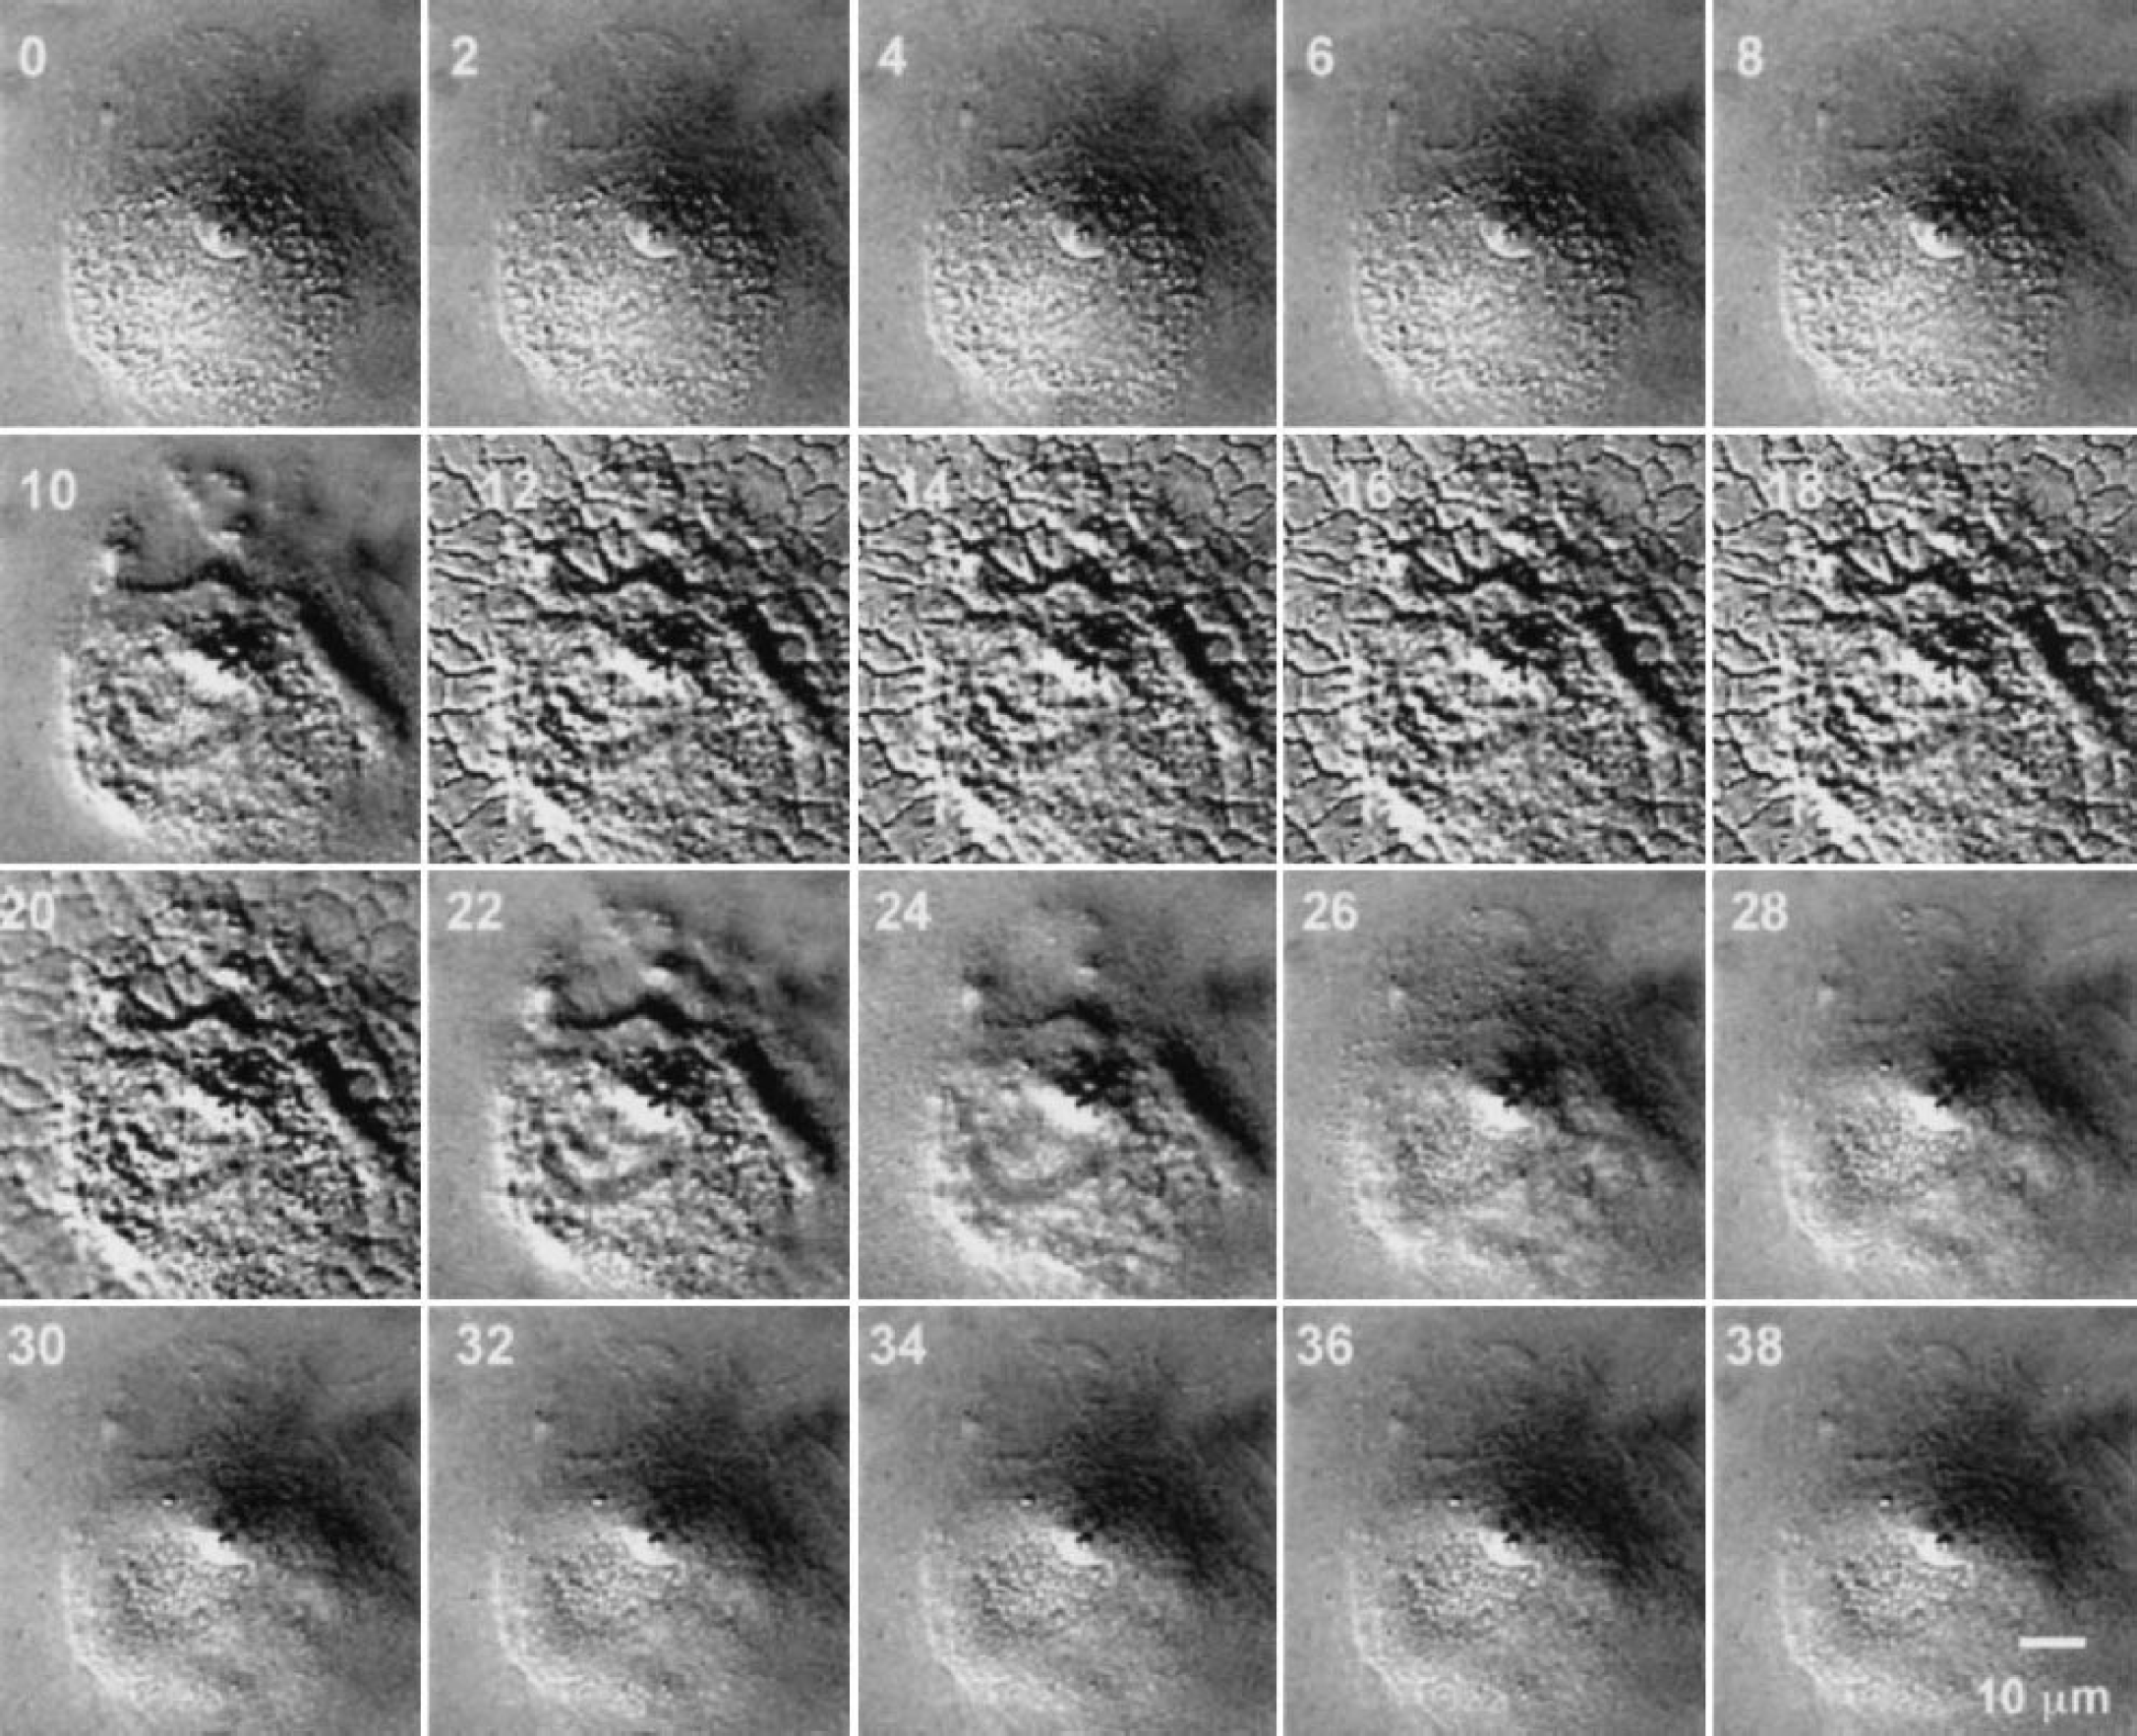
Typical processes of contraction, wrinkling, mesh network formation, disassembly, and recovery as displayed in cell 9. The appearance time of the mesh network was 10 seconds, the duration was 12 seconds, recovery time was 20 seconds (10-second disassembly time + 10-second disappearance time), fiber thickness was 0.75 μm, spread speed was 10 μm/s, and contraction was 12% (shortening of the short axis of the cell from 25.0–23.6 μm). The mesh pattern was polygonal. Time (seconds) after oxygen delivery is indicated at the top-left of each frame. The endothelium exhibits a vaguely outlined nucleus (which becomes clearly apparent after contraction) containing a nucleolus in the center, a well-demarcated cell body, and the lamella, which occupies the outer skirt portion of the cell body.
Typical morphologic changes in two independent cells in response to oxygenation are shown as montage presentations in Figs. 1 and 2. The numbers at the top left of each frame indicate the time in seconds after oxygen introduction. Within a few seconds after oxygen introduction, when the oxygen tension in the fluid reached a maximum (680 mm Hg), the cell began to contract. The surface tension of the plasma membrane appeared to increase, causing waves or wrinkles, especially in the circumferential area of the cell body. The peripheral lamella was dragged centrally towards the nucleus and the nuclear envelope became clearly demarcated and enhanced. The lamella became tightly wrapped around the edge of the cell body (frame 10 of Fig. 1 and frame 8 of Fig. 2). The cell body then began to contract and the maximum contraction was estimated from the reduction of the cell area as 14 ± 7% (mean ± SD, P < 0.001); nuclear size also decreased. When the contraction slowed down and stopped, a starlike mark suddenly appeared in nine cases as shown in Fig. 3. It started either at granules (top row of Fig. 3: presumably adhesion plaque) or at random spots without visible granules (middle and bottom rows of Fig. 3) and grew rapidly, like a spiderweb network. Figure 3 illustrates such expanding network structures as images obtained by F-F subtraction (middle row) and F-C subtraction (bottom row).
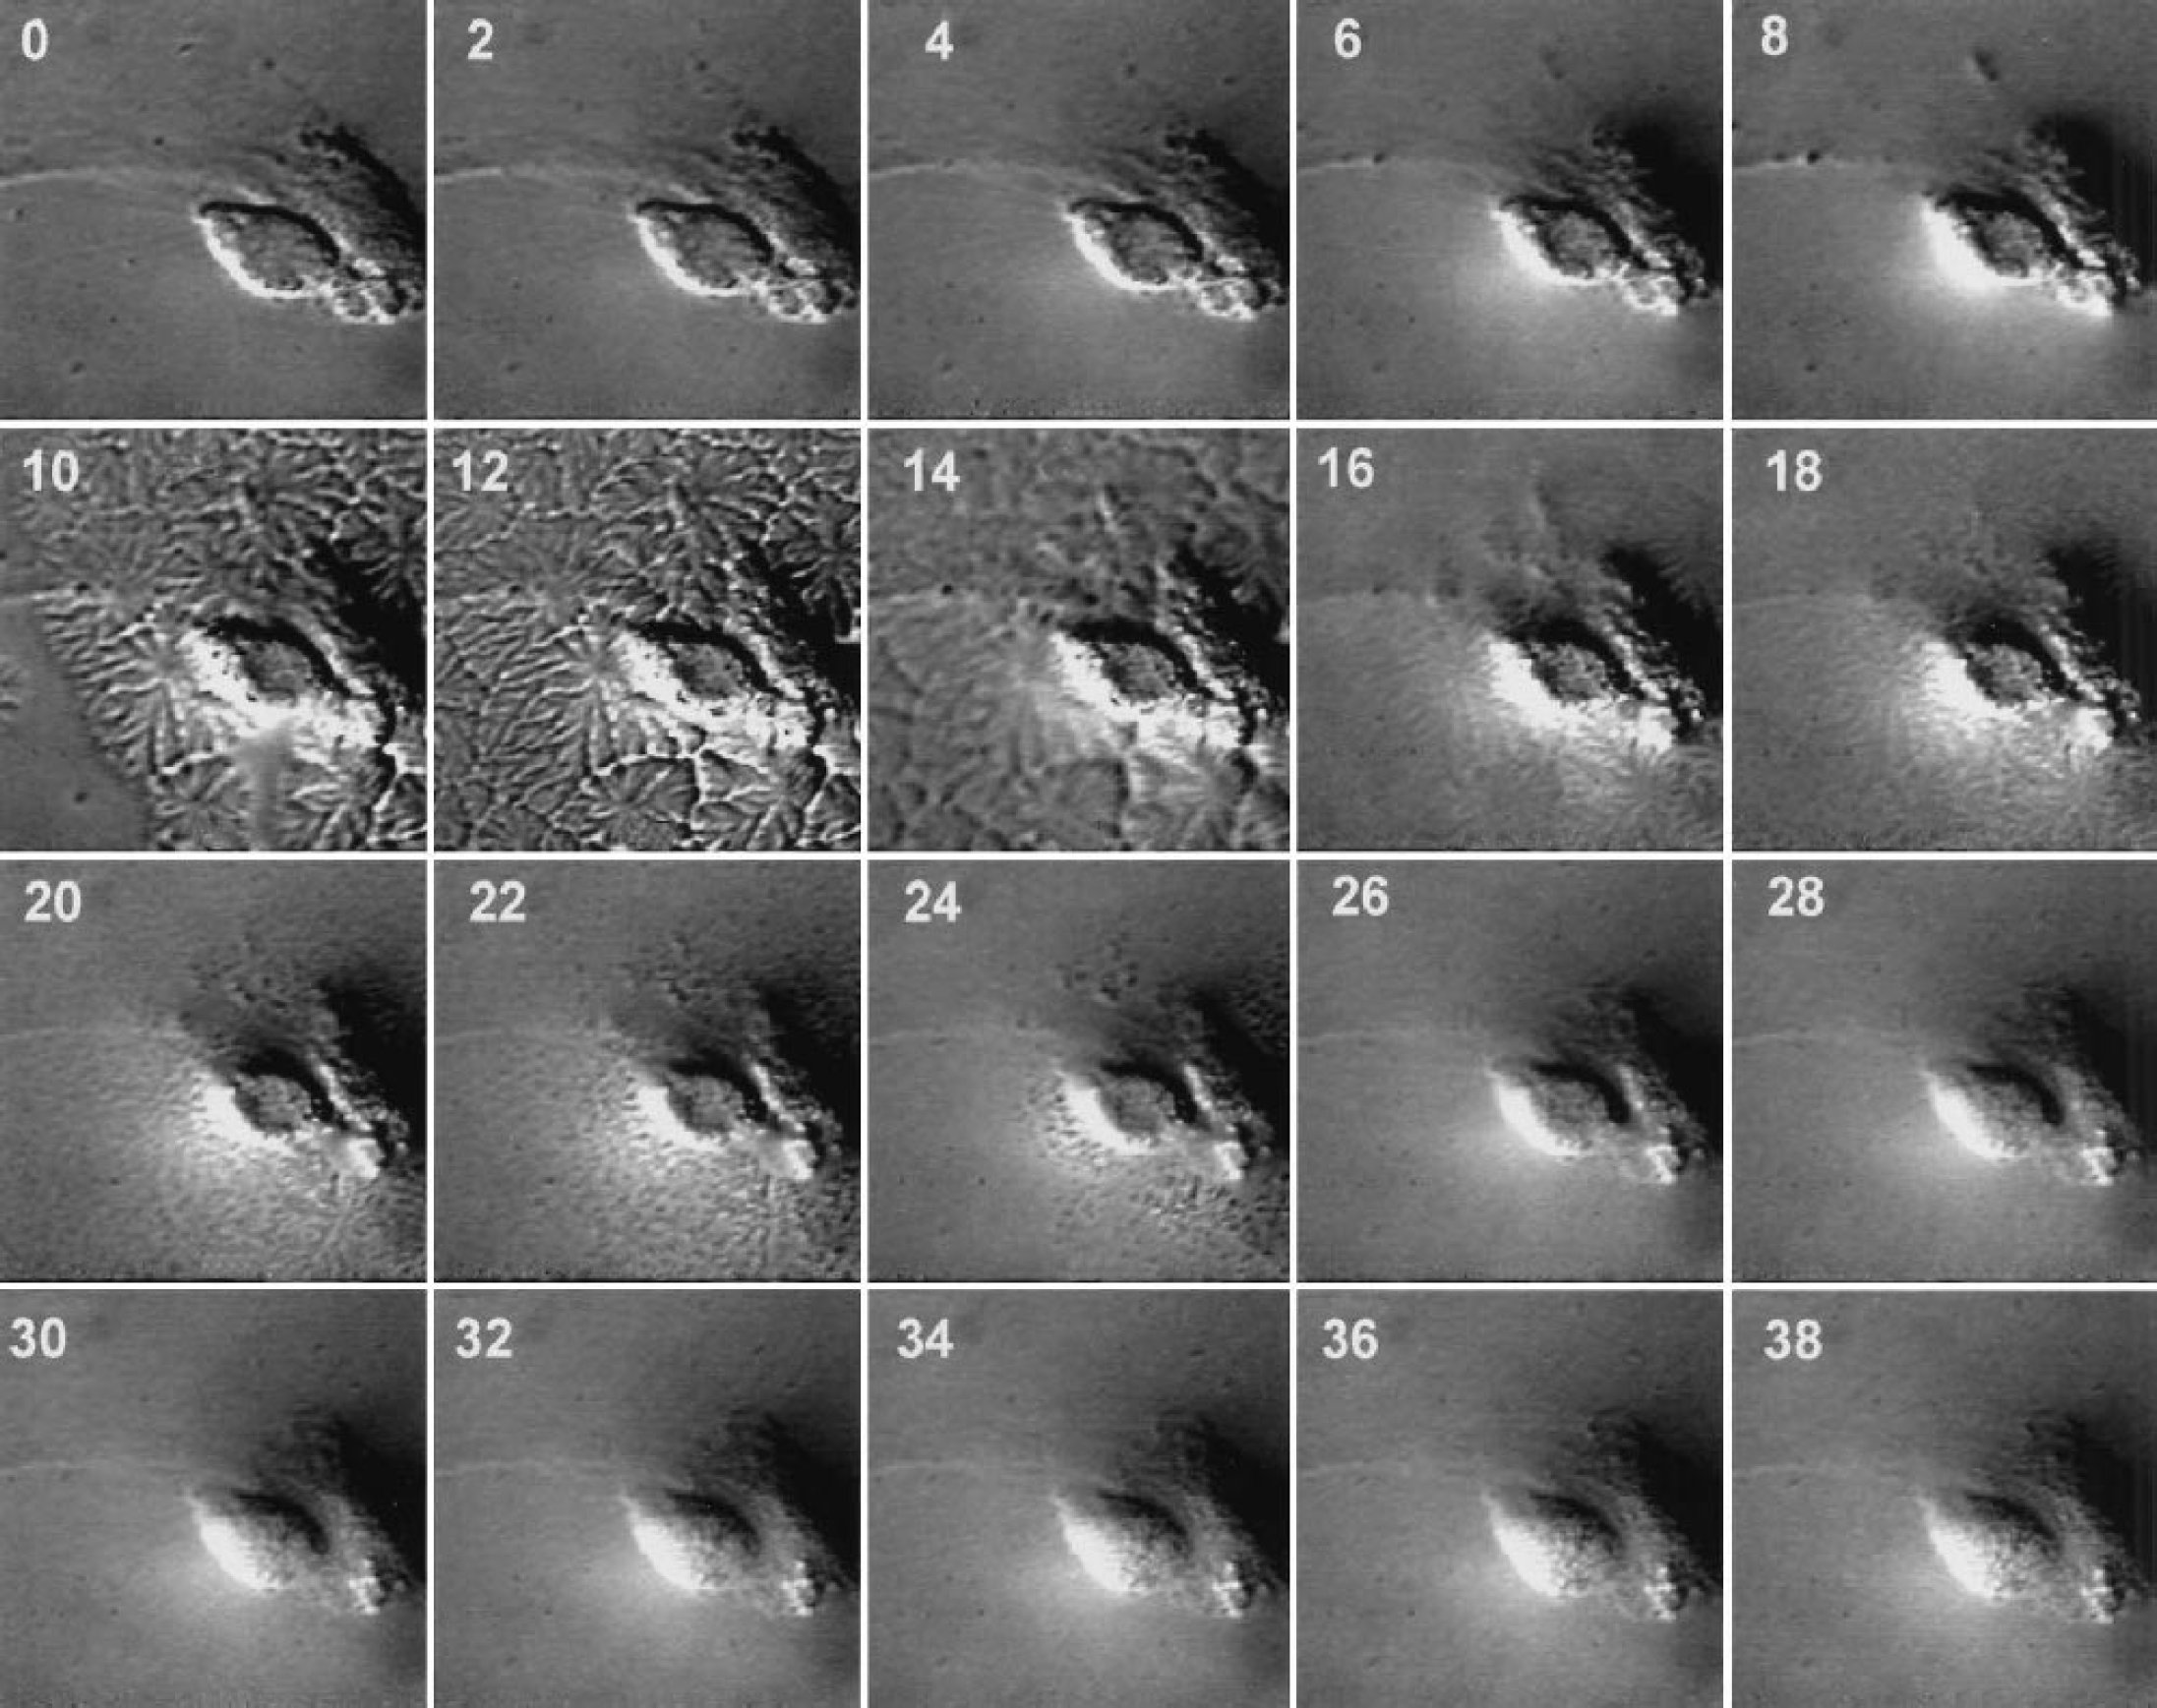
Another typical process displayed in cell 11. The appearance time was 10 seconds, duration was 6 seconds, recovery time was 15 seconds (3-second disassembly time + 12-second disappearance time), fibers thickness was 0.75 μm, spread speed was 10 μm/s, and contraction was 14% (shortening of the long axis of the cell from 14.0–13.1 μm). The mesh pattern was starlike. The cell exhibits a rather deformed cell body with a deviated nucleus and tailed cell body.
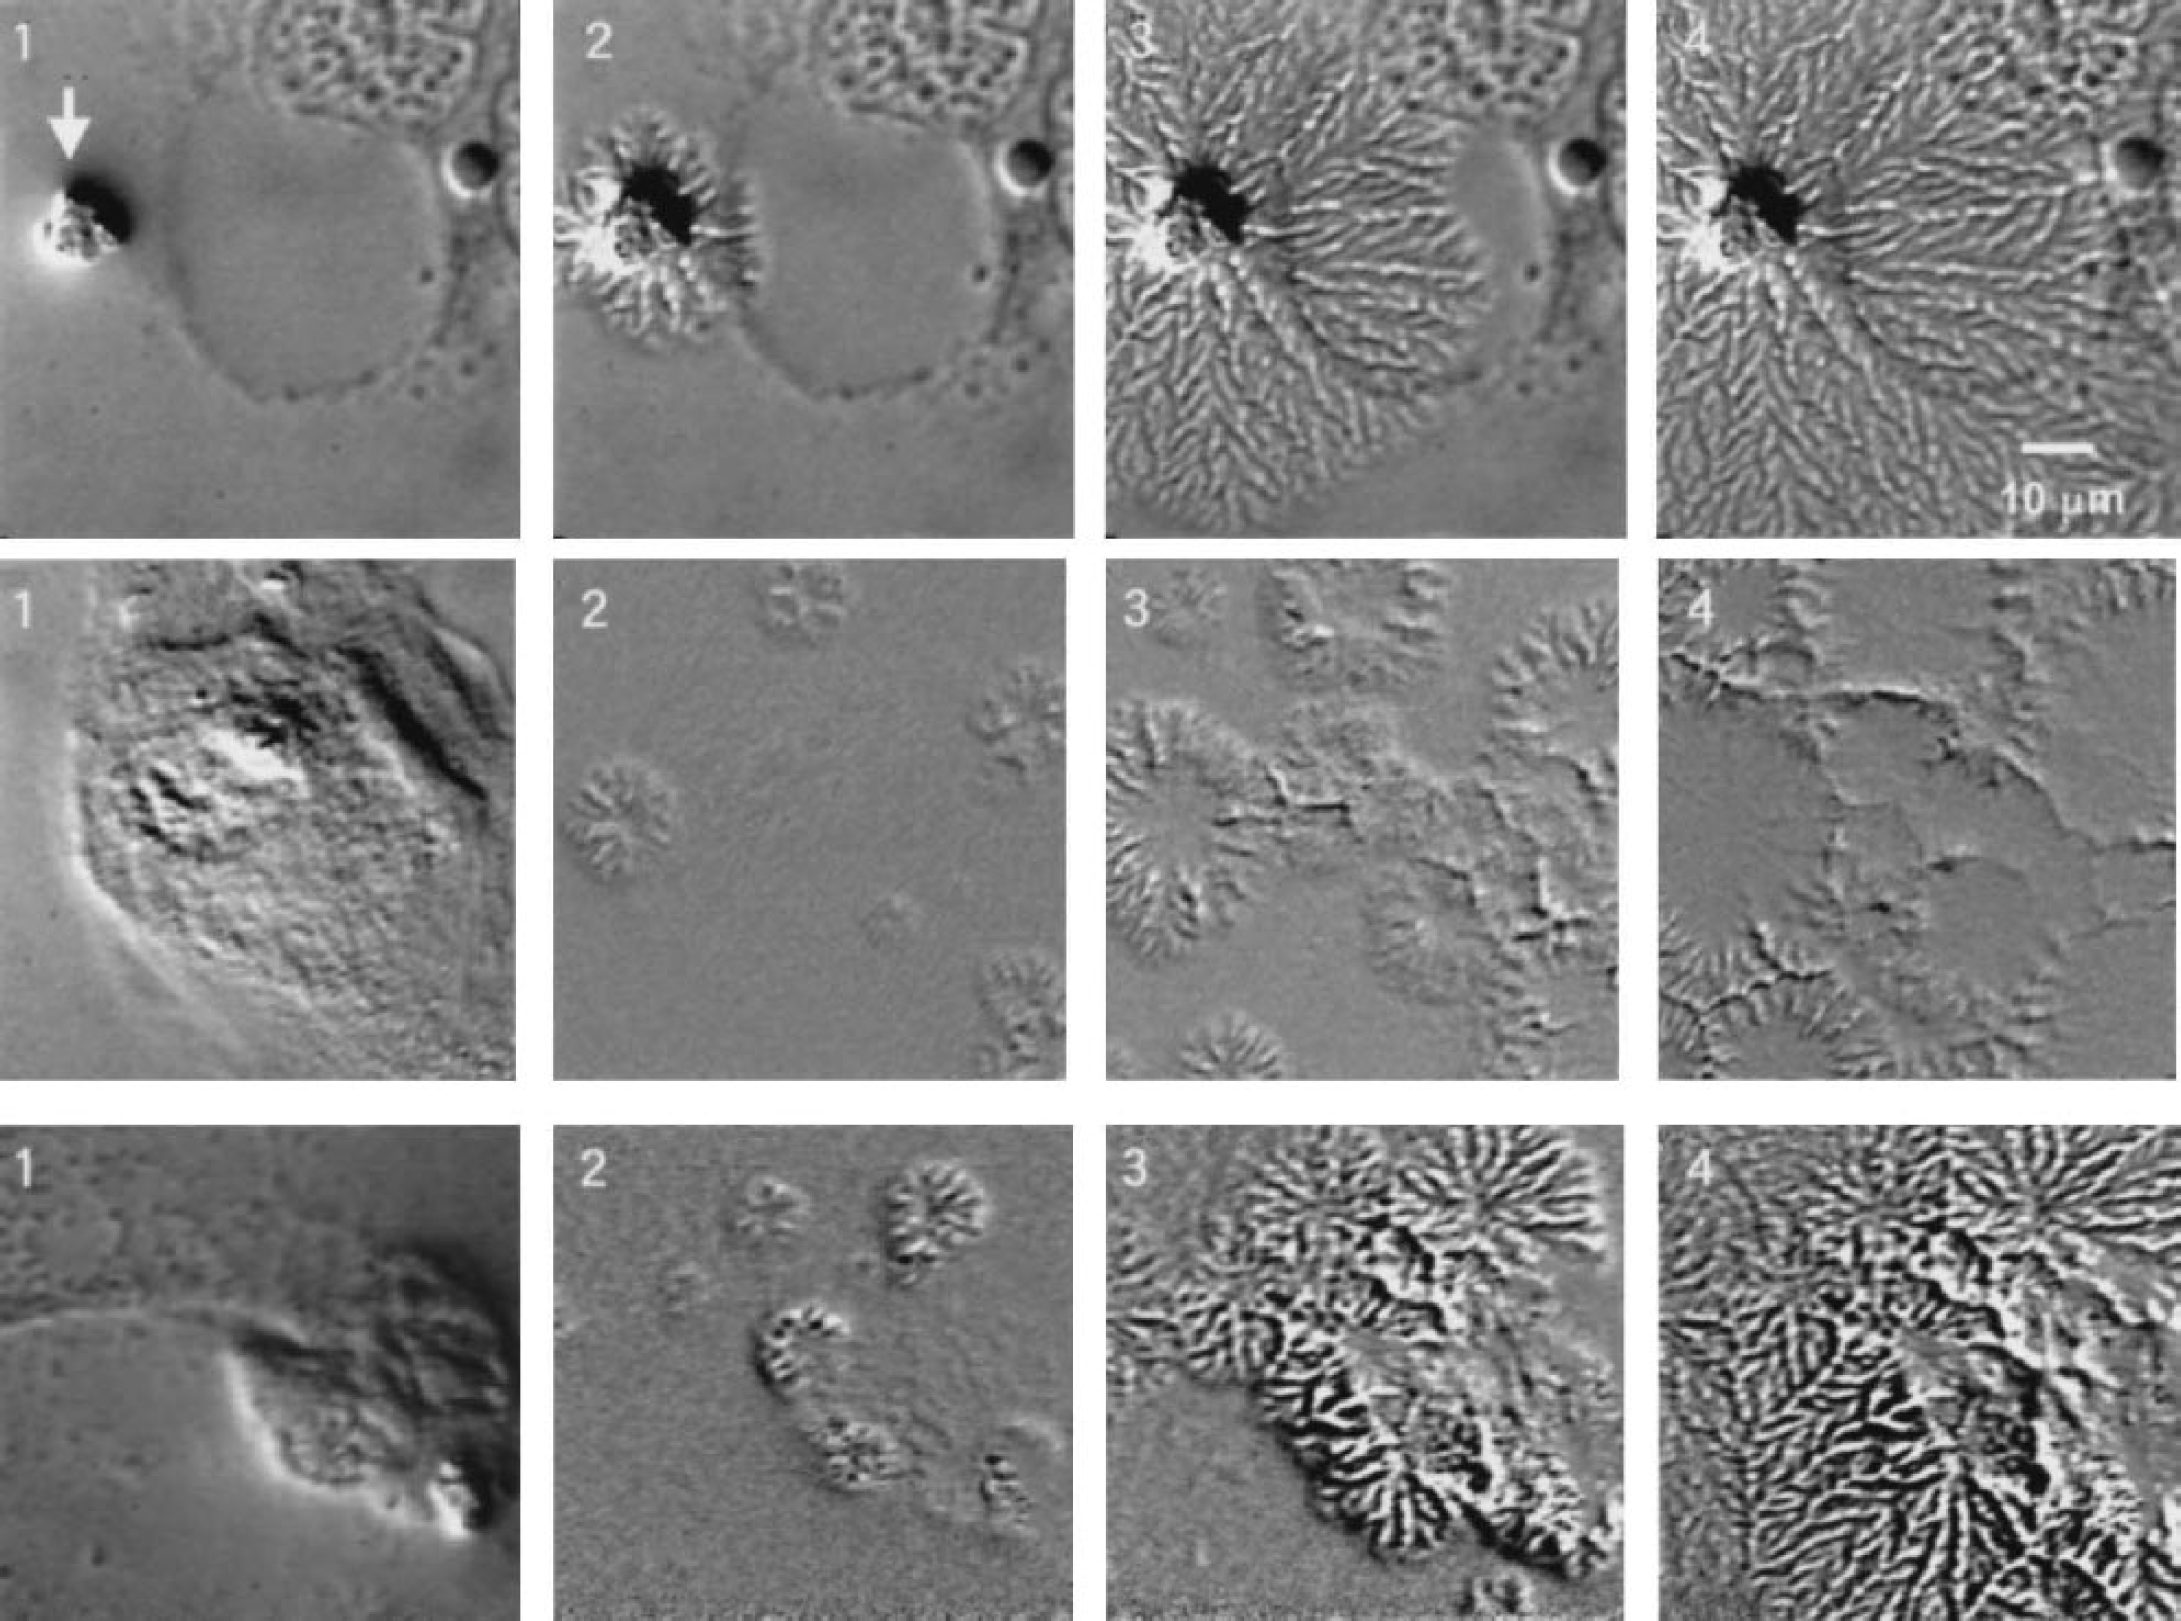
Formation of a star-shaped mesh network starting from adhesion plaques. The spread speed was 30 μm/s for cell 28 (upper row), 10 μm/s for cell 8 (middle row), and 10 μm/s for cell 11 (bottom row). The arrow in the upper panel indicates a large adhesion plaque, whereas the adhesion plaques in the lower panel (cell 11) were too small to see (if present).
The fiber network started from spots that were presumably invisible adhesion plaques in the lamella binding to the coated glass surface. Figure 4 (top two rows, A–H) shows various types of mesh mosaic patterns of the network structures. These patterns were star shaped (A; n = 9), polygonal (B–E; n = 6), fernlike (F; n = 7), brushlike (G; n = 4), or evident of a augmented nuclear envelope (H; n = 4); however, these classifications were not distinct and patterns overlapped in most cases. The average growth speed of the network was 16.3 ± 8.4 μm/s (mean ± SD). When the network was apparently fully formed, oxygen delivery was discontinued. As shown in Table 1, the average time from the commencement of oxygen exposure to the appearance of network formation was 6.5 ± 4.6 seconds, and the average duration of the network was 12.0 ± 7.8 seconds. The thickness of the mesh fibers in the network was 0.6 ± 0.2 μm. As soon as oxygen delivery was stopped (usually at full development of the network), the observed fibers rapidly began to disassemble into small particles (0.7 ± 0.2 μm in diameter) over a period of 3.3 ± 1.2 seconds, although this time is not reliable, since the oxygen tension changes in the fluid were smeared owing to saturation/evaporation processes. The small particles displayed a slow drift, exhibiting independent Brownian motion for a few seconds, and then disappeared, gradually becoming incorporated into the cell components (bottom row of Fig. 4). The cell shape recovered its original appearance, as shown in the last images of the two cells (Figs. 1 and 2). The overall recovery time, including disassembly time, was 12.6 ± 10.8 seconds. The process of HBEC morphologic change during oxygenation could (in 26 of 30 cases) be summarized as contraction-network formation in the cell to disassembly of fibers and particulation to recovery of the original cell shape, all occurring within 30 seconds. The sequential process was reproduced in all cases tested (n = 10) each time that oxygen gas was supplied. Interestingly, we found that the mesh patterns were not strictly specific to individual cells but varied (e.g., star shaped at first, fern shaped second, and polygonal third) in the same cells, even though the control appearance of cells was recoverable every time. In the other 4 of the 30 cases, the contraction process was similar to that in the abovementioned 26 cases, but there was failure to form a network, and only a clear enhancement of the nuclear envelope was seen (Fig. 3H). Subsequently, small particles appeared in the absence of any detectable fiber network, and the cell underwent a recovery phase as in other cases. Figure 4 (bottom row) illustrates the resolution of a fiber network with a fernlike pattern where the small particles dissolved one by one and disappeared sooner or later, fusing into the cell components.
Summary of HBEC changes in response to oxygenation
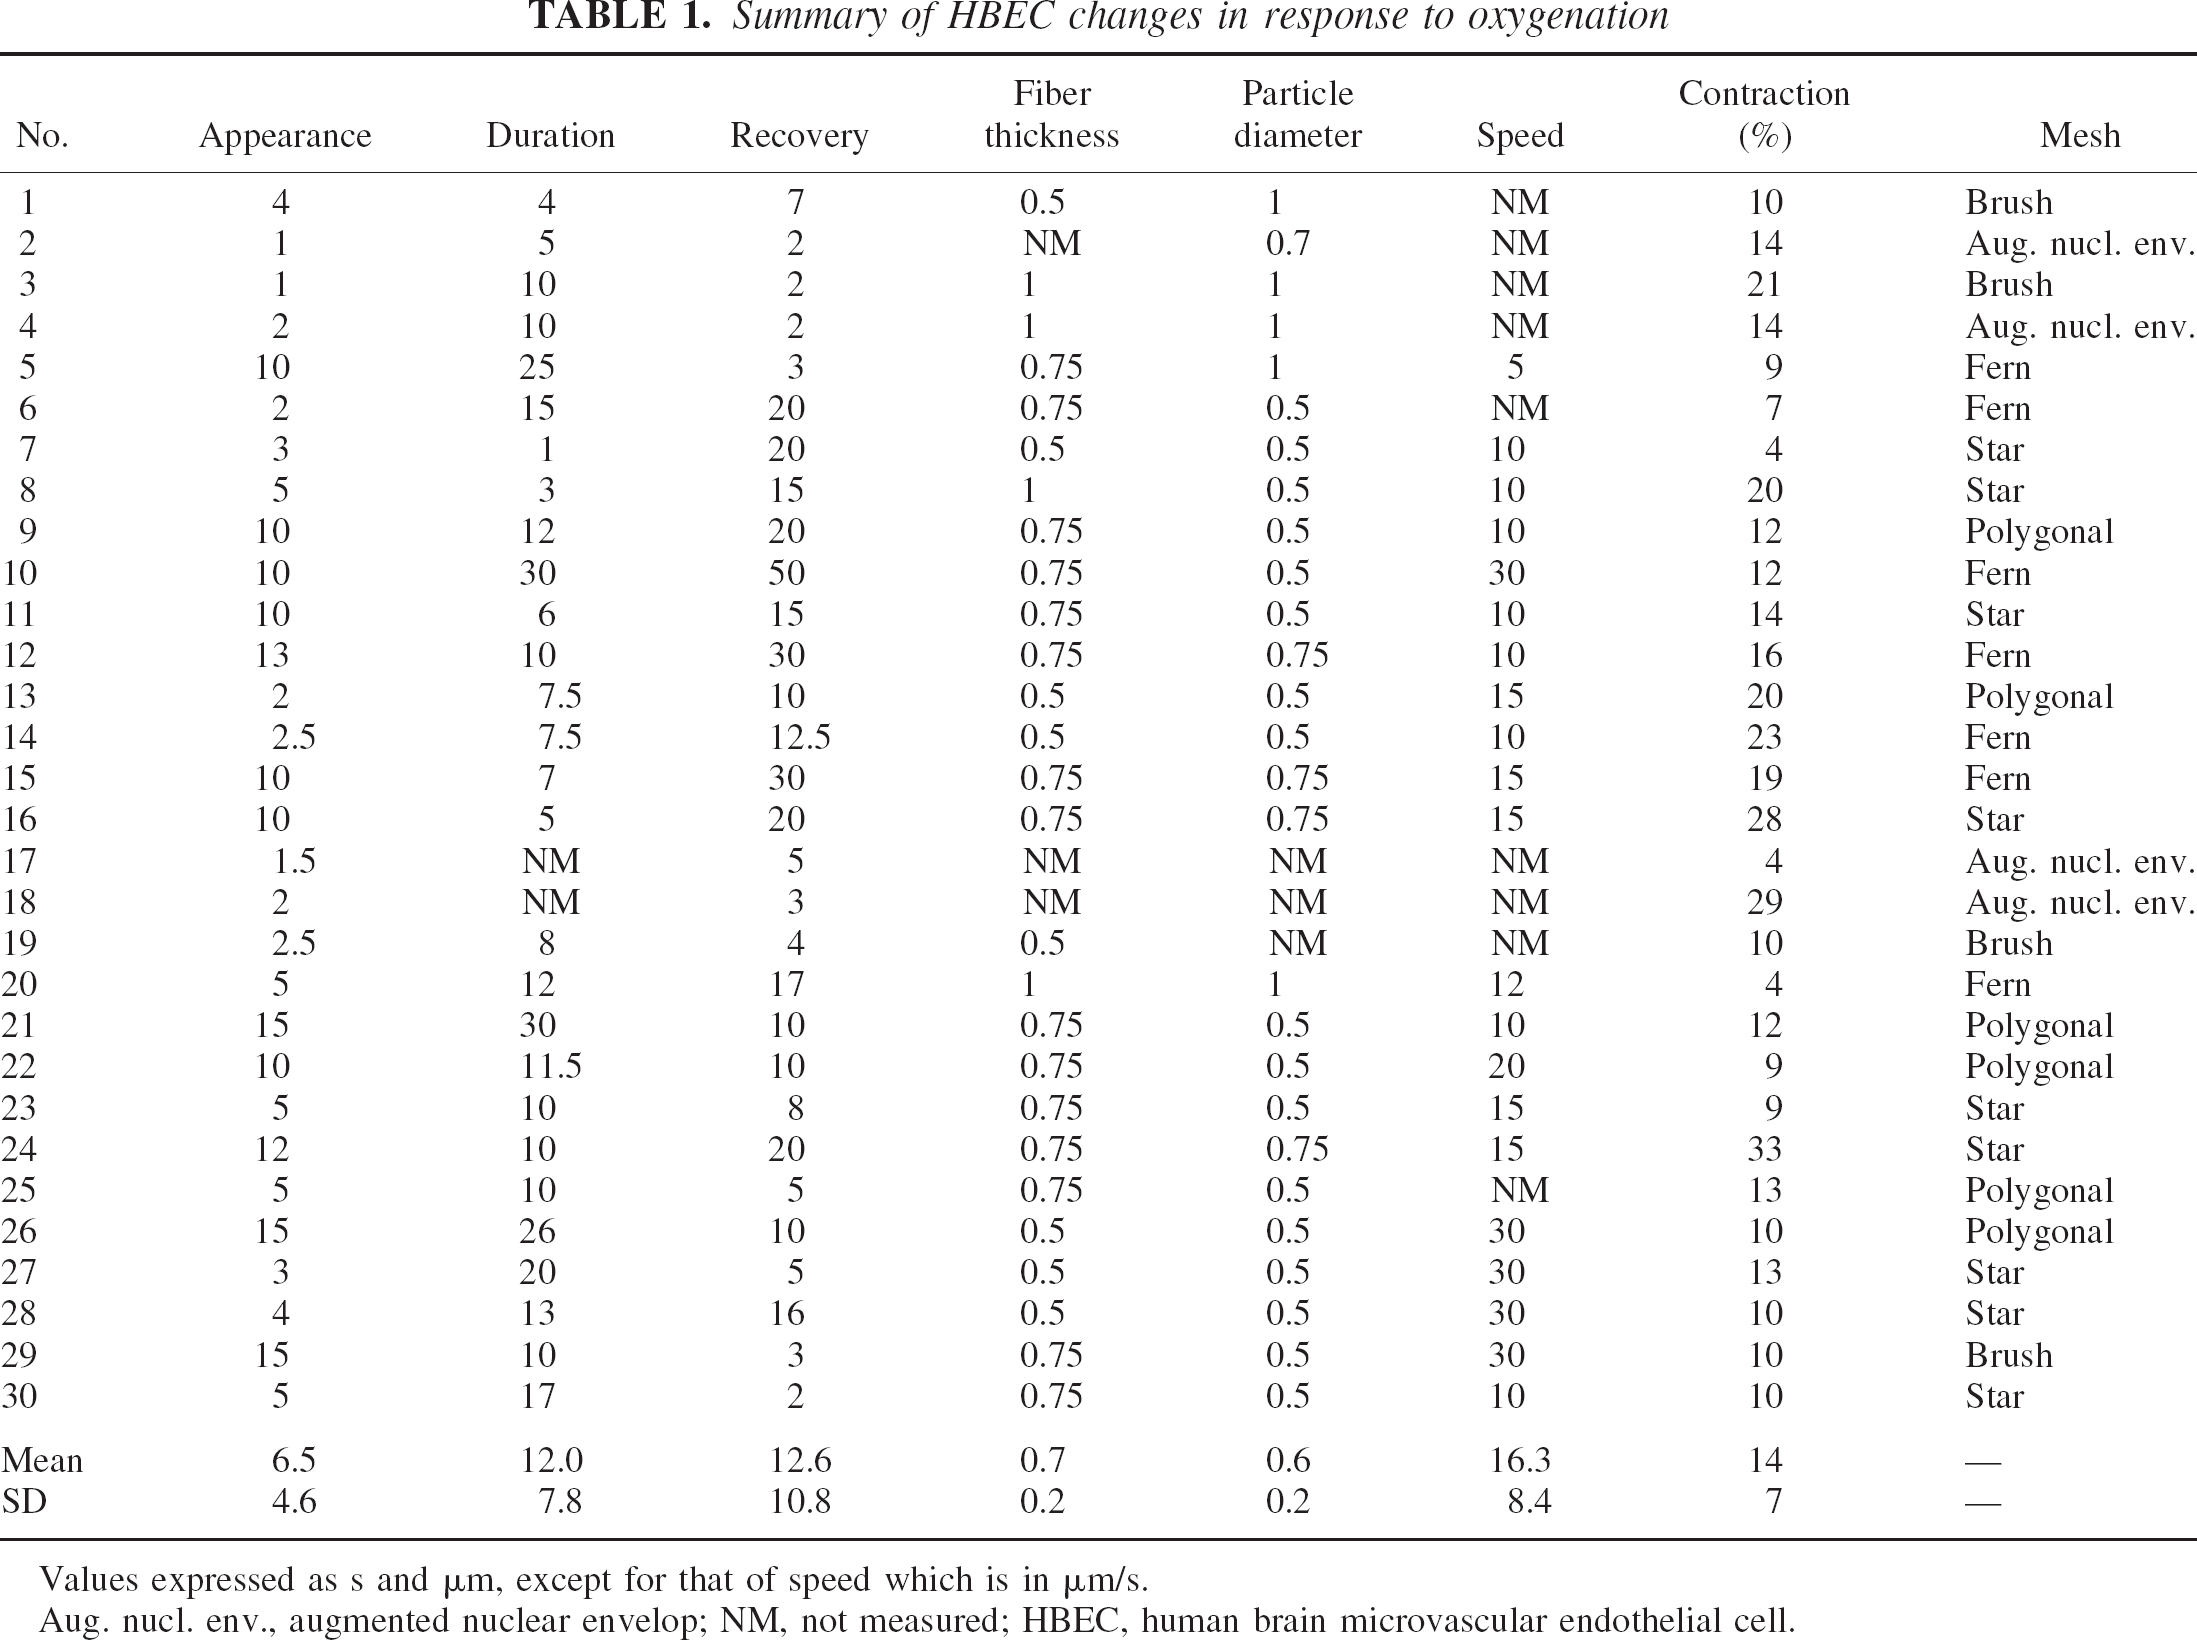
Values expressed as s and μm, except for that of speed which is in μm/s.
Aug. nucl. env., augmented nuclear envelop; NM, not measured; HBEC, human brain microvascular endothelial cell.
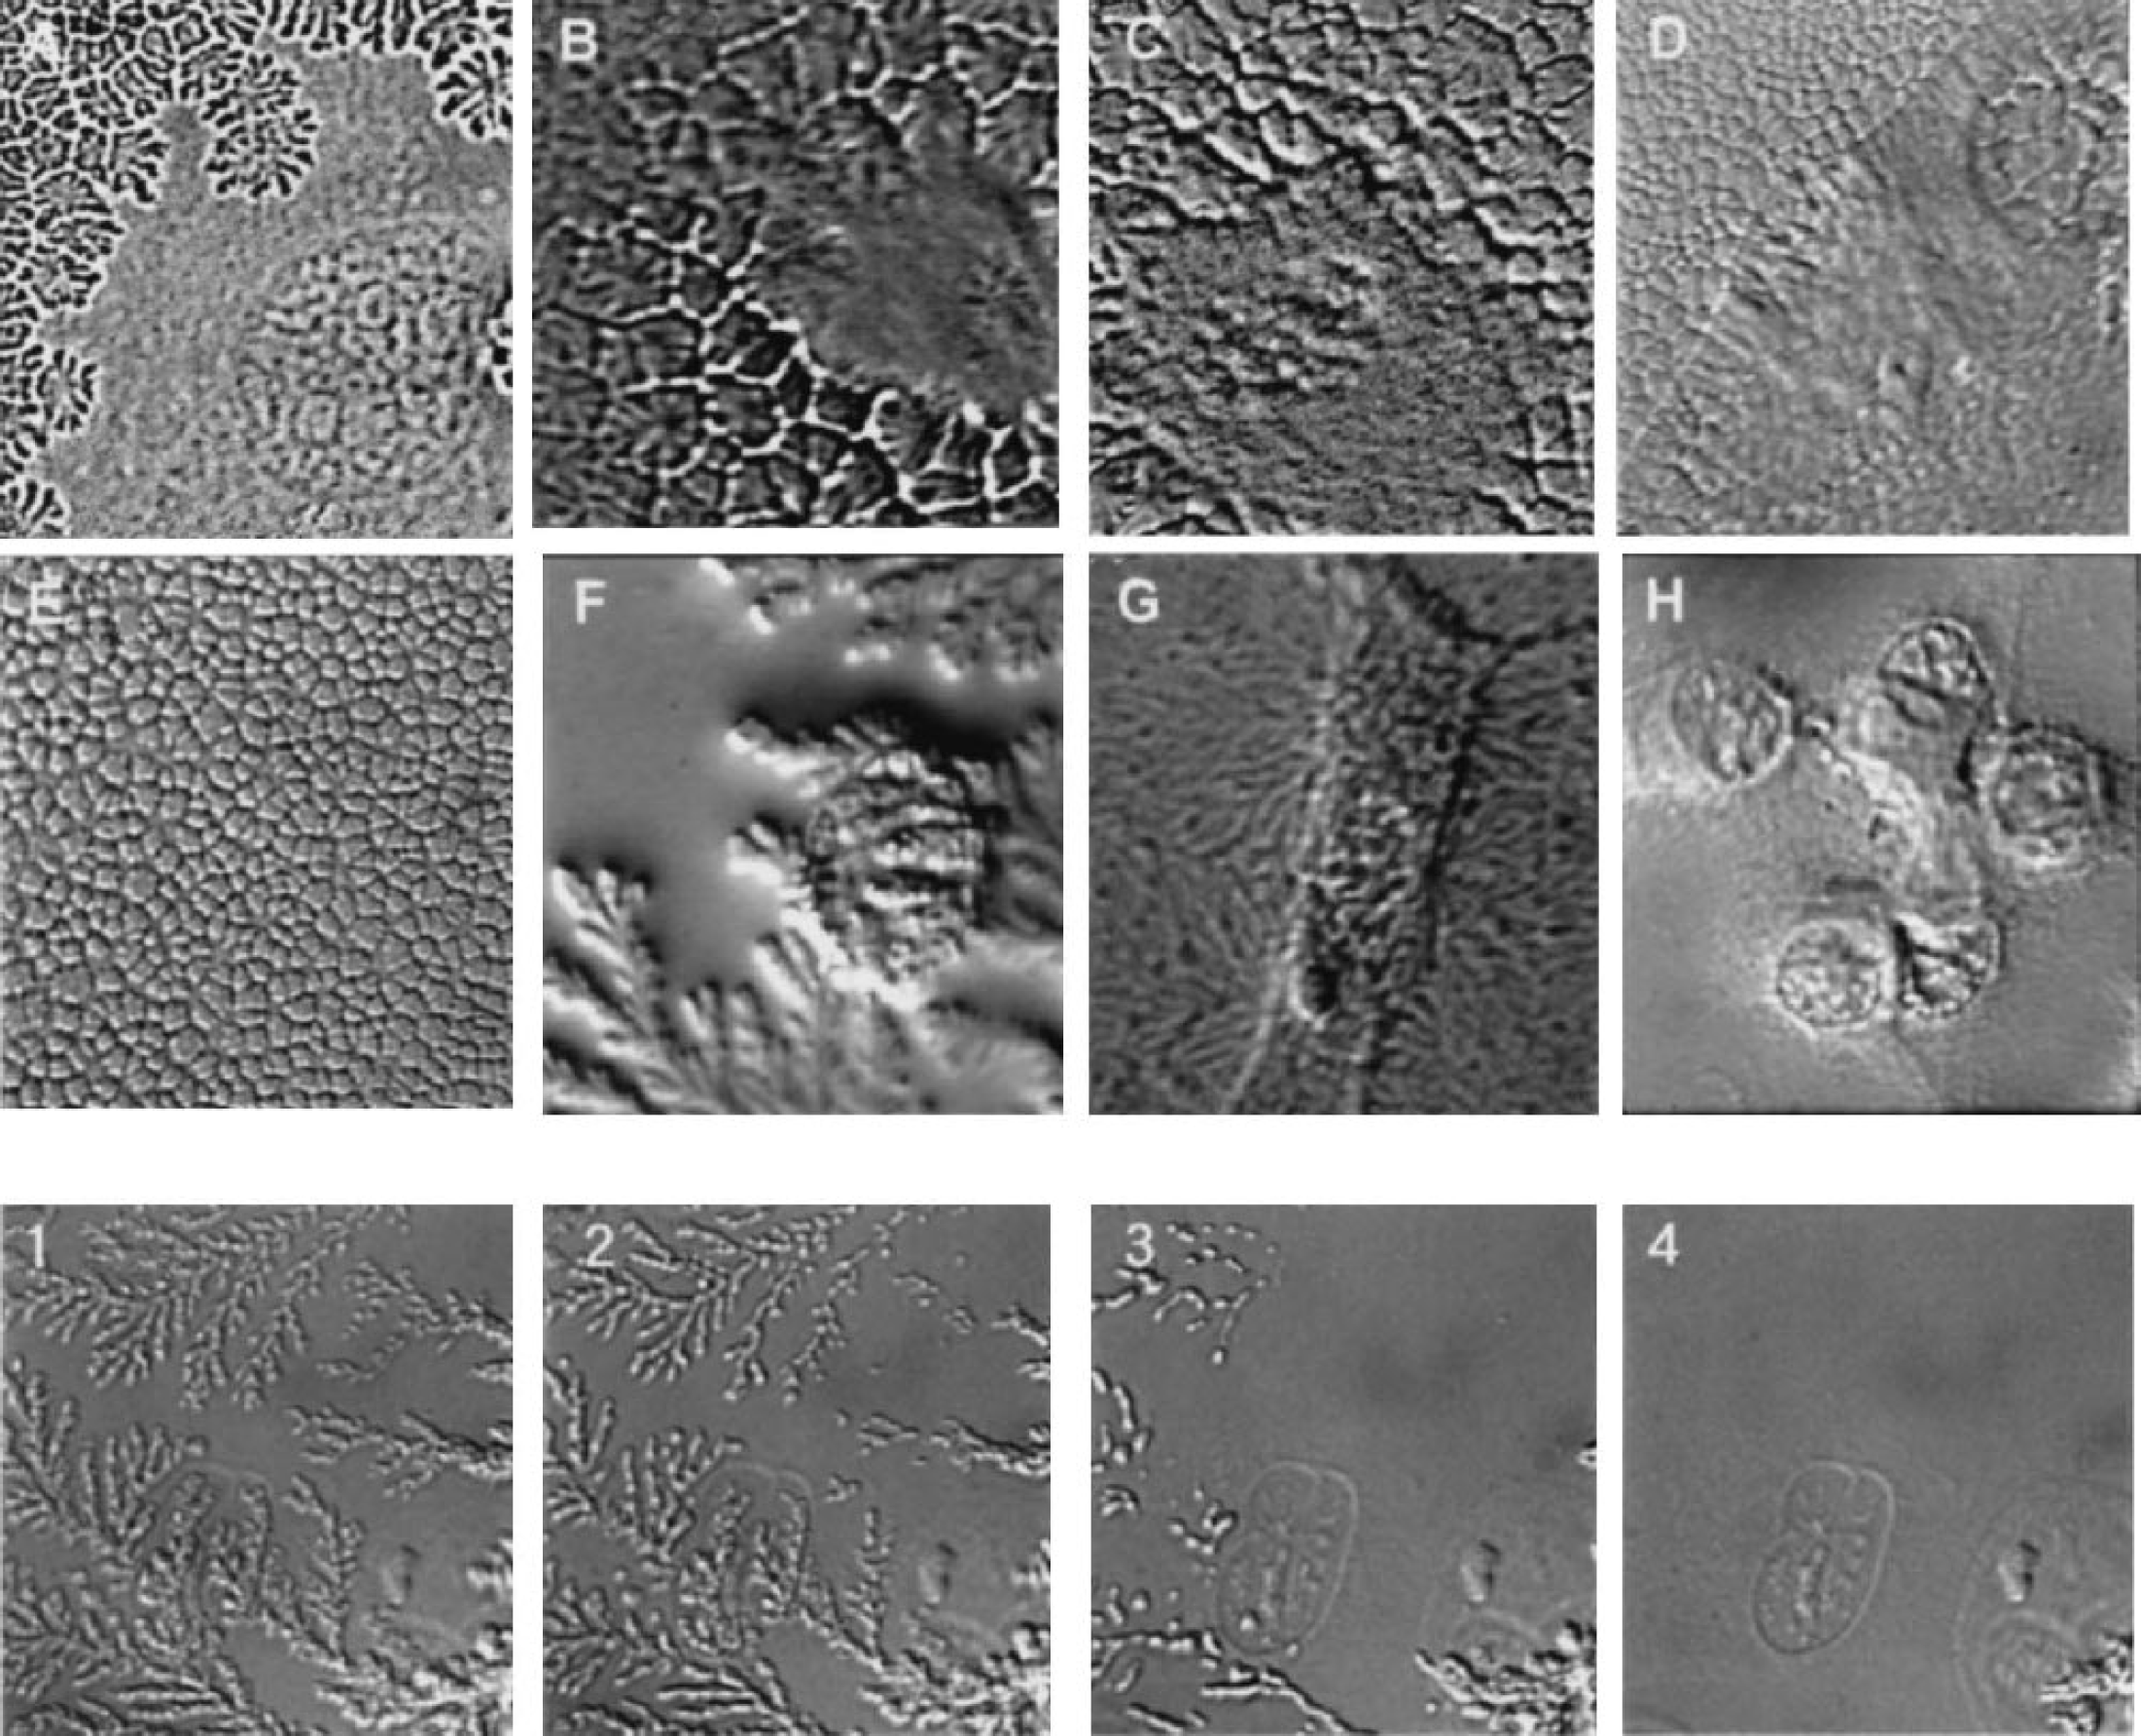
Top: Various patterns of mesh network structure. (
We confirmed that air blowing did not induce such contraction or the formation of networks. Changes in wall shear rate from 0 to 200 μm/s, and changes in temperature from 10°C to 40°C, also failed to produce contraction/network formation. Electrical stimulation at 0.5 to 3.0 V DC/AC (50 Hz), with a square pulse/triangular pulse at frequencies of 1 to 100 Hz, also failed to produce the previously described morphologic changes, but rather led to an amorphous, disorganized cell structure involving deformation, rounding, and lifting up of the cell body from the floor to which the cell had adhered. These changes were very different from the above-described, clearly defined and organized sequential events.
DISCUSSION
Doukas et al. (1994) observed that endothelial cells cultured on polymerized silicone deformed the underlying substrate, producing microscopically visible wrinkles. They interpreted this finding as being due to cellular contraction, and concluded that endothelial cells normally maintain an active contractile tone. We observed the endothelial tone more directly as wrinkles on the surface of the plasmic membrane: oxygenation induced tensioning and wrinkling of the HBEC plasmic membrane, causing contraction of the cell body by 14%. If we extrapolate this finding to the capillary (an endothelial tube) in situ, the endothelial contraction would correspond to the same magnitude of reduction in caliber (2ΔR) based on the simple relation ΔD = 2πΔR, where ΔD is the change in endothelial cell diameter or the change in the circumferential length of the capillary. In living tissue in situ, such active capillary contraction would cause a sharp rise in local capillary flow resistance owing to the inverse Fåhraeus-Lindqvist effect. This may explain the marked reduction in blood flow in response to oxygen inhalation in experimental animals, in the absence of any appreciable pial arterial diametric constriction.
Concerning the stimulus applied to the HBEC, we do not consider oxygen to be the only stimulus that might elicit such rapid changes in endothelial morphology or capillary tone, although changes in various physical factors in our experimental design (e.g., temperature, shear rate, electrical field potential, and surface vibration) had no apparent effect. In the literature, there are reports of numerous triggering stimuli, including not only chemical substances but also such longstanding physical stresses as fluid shear stress (Azuma et al., 2001; Barbee et al., 1994; Frame and Sarelius, 2000; Malek and Izumo, 1996; Schnittler et al., 1993;), stretching per se (Sugimoto et al., 1995; Wang et al., 2000; Zhao et al., 1995), and contact with leukocytes (Tomita et al., 1996b; Yuan et al., 2002) or lymphocytes (Etienne-Manneville et al., 2000). Chien and Shyy (2001) found that integrins on the abluminal side and receptor tyrosine kinases on the luminal side of endothelial cells serve as mechanosensors. Endothelial and therefore capillary tone changes in response to various stimuli must be of physiologic importance for capillary vasomotion.
The mechanism of the HBEC contraction could be related to spontaneous fiber network formation. However, peculiarly, the fibers became apparent only when contraction was almost completed, after beginning at putative adhesion plaques (integrins) and spreading to the whole cell. The fibers are presumably a cytoskeleton, which might be stress fibers comprising thick bundles of microfilaments lying along the ventral surface of the cell with their ends attached to adhesion plaques. The stress fibers are thought to contain all the elements required for active contraction: myosin, α-actin, and tropomyosin. Caldesmon, a protein regulating the motile interactions of actin and myosin, is concentrated along the margins of such stress fibers (Lodish et al., 1995). Stress fibers are thus classified as contractile, like those in the sarcomere, because they contract on addition of ATP when isolated from the cell (Katoh et al., 1998). The network that we observed is consistent in terms of fiber thickness (<0.6 μm) and manner of formation with the stress fibers reported previously, except for its mesh network appearance. Stress fibers have previously been reported to be straight (Ishida et al., 1999), whereas ours consisted of variable mesh structures. The fibers reported here could consist of actin and vimentin, but this will need to be confirmed by means of cytochemical and immunocyto-chemical analysis.
Footnotes
Acknowledgments:
The authors thank Dr. Maria Spatz (Stroke Branch, NINDS, NIH, U.S.A.) for her critical reading of the manuscript and helpful suggestions.