
Abstract
Positron emission tomography with the dopamine D2/3 receptor ligand raclopride was used to compare sequential (studies on 1 day) and nonsequential (different days) approaches to in vivo measurement of the density and affinity of receptors. The choice of temporal sequence of radiotracer injection over a range of specific activities might result in bias because of diverse factors. A strong concordance is reported between the outcomes of the sequential and nonsequential methods. This suggests that the characteristics of the dopamine D2/3 receptors are relatively stable within physiologic boundaries and can be reproducibly and reliably measured in stable conditions.
Positron emission tomography (PET) allows the measurement of binding parameters to neuroreceptors in the living brain. Farde et al. (1986) developed a quantitative in vivo method based on the serial acquisition of at least two scans to obtain an estimate of the density and affinity of the receptor system studied. The method requires the acquisition of a scan after administration of a radioligand with high specific activity (SA). This is followed later in the day by scans in which the density of available receptors is progressively decreased, either by administration of the same radioligand at a lower SA (Holden et al., 2002), co-injections of the high SA ligand with its unlabeled analog (Farde et al., 1986), or prior or conjoint administrations of a competitor (Wong et al., 1986). The main assumptions in these studies are that the tracer binds to a single receptor site, and that its kon and koff characteristics are compatible with the length of the experiment. By analogy with the in vitro situation, these multiple-ligand-concentration receptor assays (MLCRA) have been described as “Scatchard” saturation binding studies, consequently amenable to analysis with either linear analysis (Scatchard, 1949) or nonlinear analysis (Holden et al., 2002).
The in vivo “Scatchard” methods, however, differ from in vitro saturation studies in many aspects and thus may not provide the exact same endpoint. For example, the number of PET studies (i.e., points on the Scatchard plot) that can practically and ethically be obtained is limited, often to two studies, a high and a low SA, rendering the determination of Bmax and Kd extremely sensitive to the slightest experimental error in any of the studies or to violation of the assumption of a single-site linear model. The data are obtained sequentially throughout the course of 1 d, and the outcomes of the second or third study may be influenced by circadian rhythms (Smith et al., 1992; Paulson and Robinson, 1994) or by the effects of prior sequential administrations of pharmacologic doses of an antagonist of presynaptic autoreceptors (Ishizu et al., 2000; Gjedde and Wong, 2001), which may alter receptor availability by perturbing the release of dopamine (DA). True saturation studies cannot be obtained in living organisms, and the data are rarely obtained in a true equilibrium condition in a system devoid of the endogenous ligand.
We report here a comparison of the performance of sequential studies on 1 d with obtaining the data on separate days, at the same time of day and under the same conditions. Each of the studies would then be expected to be similar in terms of neurochemical and metabolic circadian rhythms, duration of anesthesia, and lack of acute effects of prior antagonist administration. The comparison was made in studies in rhesus monkeys using the selective DA D2/3 receptor antagonist [11C]raclopride. For simplicity, we refer to the 1-d acquisition method as “sequential” and to the 3-d acquisition method as “nonsequential.” Based on current knowledge of basal DA release and of the magnitude of change in synaptic DA necessary to produce a change in raclopride binding, we hypothesized that, in baseline condition, the sequential and nonsequential methods would yield similar data and thus could be used interchangeably in clinical studies.
MATERIALS AND METHODS
Six rhesus monkeys (three males and three females) were used in this study. Three animals were healthy. Three had received administrations of the selective neurotoxin N-methyl-4-phenyl-1,2,3,6-tetrahydropyridine (MPTP) and displayed moderate to severe symptoms of parkinsonism, including bradykinesia, rigidity, marked hypokinesia with stooped posture, and postural imbalance but no tremor. The PET scan procedures and anesthesia regimens have been described elsewhere (Doudet et al., 2000, 2002). All animal procedures were approved by the Committee on Animal Care of the University of British Columbia.
A stereotactic headholder mounted to a Siemens ECAT 953–31B (Siemens, Knoxville, TN, U.S.A.) bed allowed the simultaneous acquisition of 31 coronal slices through the head and brain (in-plane resolution: 6 mm full-width half-maximum; axial resolution: 5 mm). To approach a true equilibrium condition (Carson et al., 1997), raclopride was administered as a bolus (2.5 mCi in 1 minute in 10 mL saline) followed by constant infusion (2.5 mCi in 59 minutes in 30 mL saline). For the sequential acquisition method, three bolus/infusion administrations of raclopride, (SA1 > 1,000 Ci/mmol; 40 < SA2 < 20 Ci/mmol and 10 < SA3 < 5 Ci/mmol) were performed throughout the course of a day, 2.5 to 3 h apart. For the nonsequential studies, the SA values were kept within the same ranges but no special effort was made to match them exactly, so as emulate the variability in experimental conditions to be expected in the course of a clinical study. One raclopride scan was performed on a given day between 9 and 10 a.m., and the scans were spaced at least 2 weeks apart. The order of scan acquisition was random. Scan data were acquired in two-dimensional mode during 1 h (Doudet et al., 2002).
Regions of interest were positioned over the striatum as previously described (Doudet et al., 2000). The data were analyzed using the graphical analysis of Logan et al. (1996) using activity in the cerebellum as the input function, between 30 and 60 minutes after injection, by which time equilibrium was reached at all SA used. For each scan, the Logan analysis yielded a distribution volume ratio (DVR).
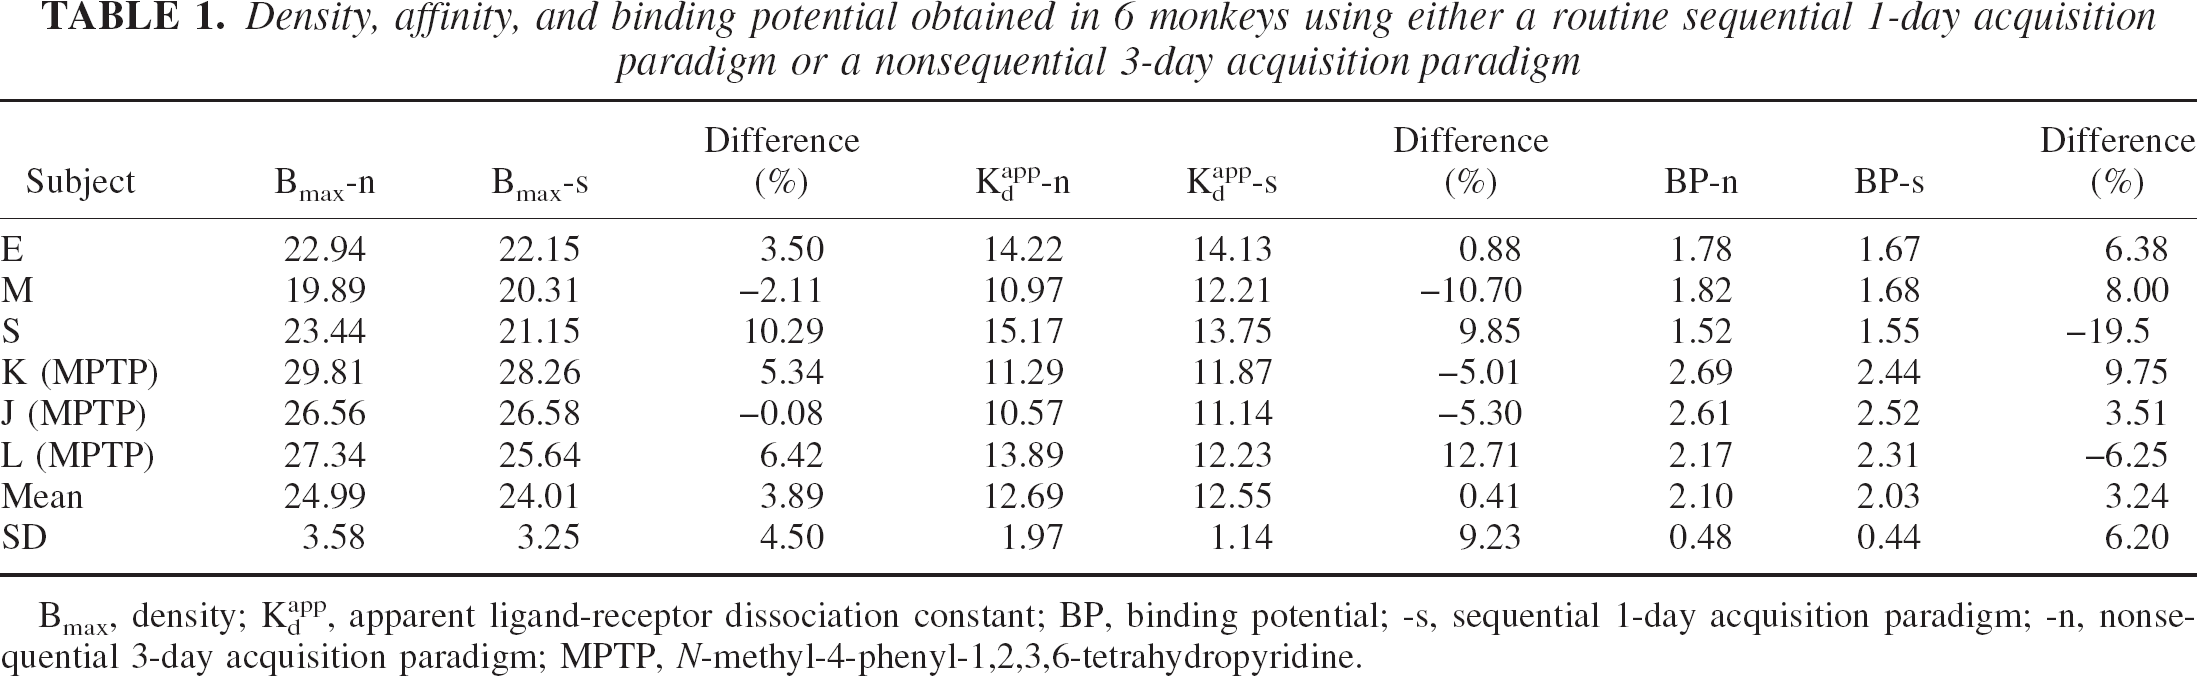
To calculate the density and affinity of the receptors with each method, we interpreted DVR minus 1 (DVR-1) as an estimate of the equilibrium ratio of bound and free ligand in striatal regions (the y-axis). This was then fitted against the bound ligand concentration in striatum using the routine straight-line method (Scatchard, 1949). The method yielded a value for Bmax (abscissa intercept), the apparent ligand-receptor dissociation constant Kdapp (negative inverse of the slope), and the binding potential (BP; ordinate intercept). Henceforth, the outcomes from the sequential method are labeled with the suffix (−s) and those from the nonsequential method with (−n).
The densities, affinities, and BP yielded by the sequential and nonsequential methods were compared using paired t-tests. The correlations between the two sets of outcomes were assessed using conventional regression analysis.
RESULTS
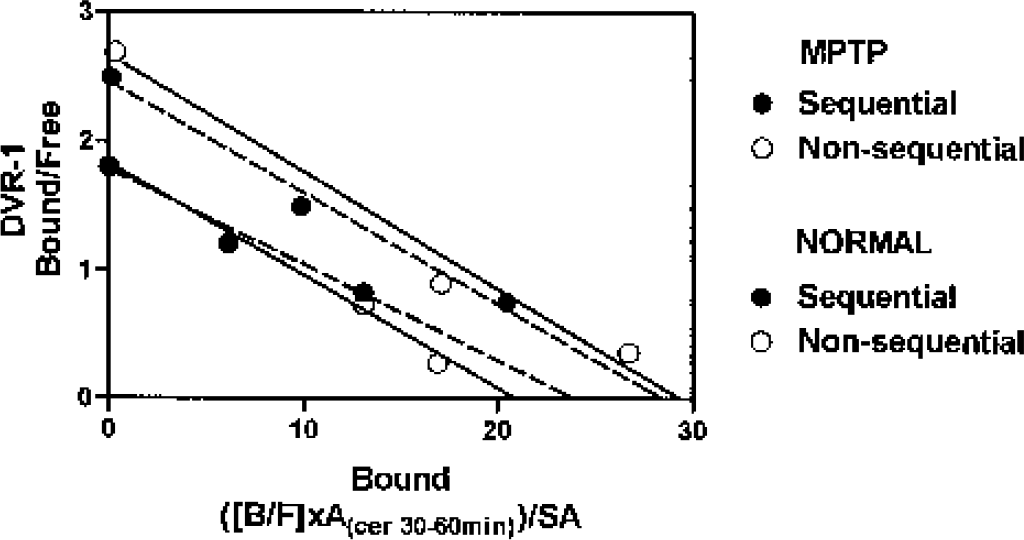
Because there were no significant differences between the left and right striatal values, the data are reported as the average (Table 1). There was no significant difference between the data obtained with the sequential and the nonsequential methods. Examples of the straight-line plots obtained from a routine sequential 1-d study and from a nonsequential study are shown in Fig. 1. There were highly significant correlations between the two sets of data for all three endpoints (Fig. 2).
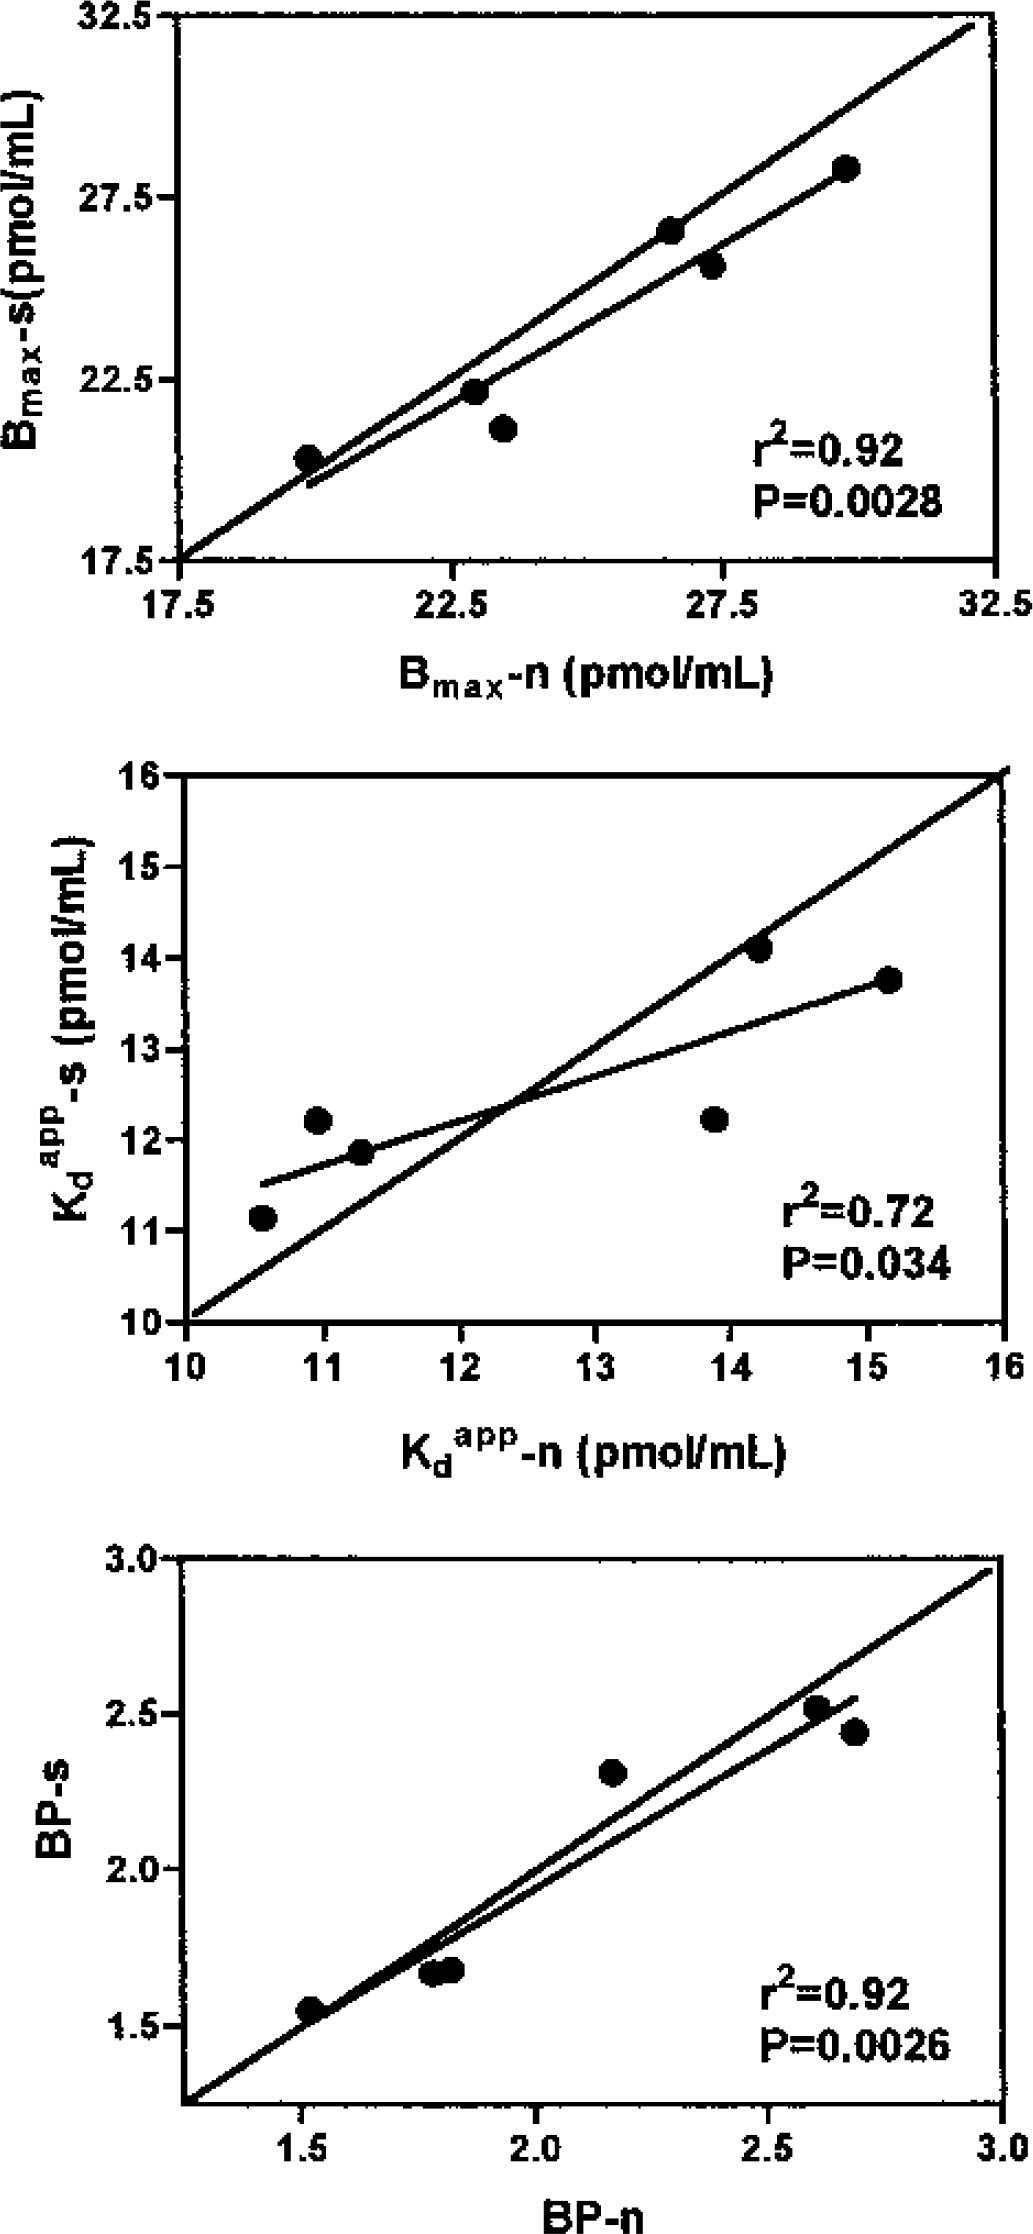
Density, affinity, and binding potential obtained in 6 monkeys using either a routine sequential 1-day acquisition paradigm or a nonsequential 3-day acquisition paradigm
Bmax, density; Kdapp, apparent ligand-receptor dissociation constant; BP, binding potential; -s, sequential 1-day acquisition paradigm; -n, nonsequential 3-day acquisition paradigm; MPTP, N-methyl-4-phenyl-1,2,3,6-tetrahydropyridine.
Comparison of the straight-line optimization procedure used to estimate binding potential and Kdapp (the apparent ligand-receptor dissociation constant) from the data measured with the sequential (closed symbols) and the nonsequential (open symbols) methods in the same animals, one healthy control and one with MPTP-induced parkinsonism. These cases were selected to represent average discrepancies between the two approaches used in our study. MPTP, N-methyl-4-phenyl-1,2,3,6-tetrahydropyridine; DVR, distribution volume ratio.
Regressions of the nonsequential (n) versus the sequential (s) methods for all three experimental outcomes.
DISCUSSION
In this study, we showed that the density and affinity of the DA D2/3 receptors are stable both throughout the course of the day and across a longer period (weeks). We demonstrated that it is possible to perform useful MLCRA studies in more than 1 d. This is an important observation because many patients may not be able to tolerate more than one study in 1 d or alternatively, to lessen technical burden.
Raclopride has been shown to be sensitive to changes in endogenous concentrations of DA (Laruelle, 2000), and thus it is important to consider the potential effect of physiologic changes in endogenous DA over the course of a day as well as over several days or weeks. Circadian changes have been reported in the DA system (Smith et al., 1992; Paulson and Robinson, 1994) that may affect the reliability of sequential measurements of DA receptor characteristics. In support of the present study, high SA raclopride scans obtained in two monkeys at various time of the day (about 9 a.m., 12 p.m., and 4 p.m.) have shown no significant changes in the BP (unpublished data, 1998, 1999). We did not determine specifically the density and affinity of the receptors, but we hypothesized that a change in affinity because of a change in endogenous DA release would have been reflected in a change in BP. Thus, taken together, our results suggest that physiologic changes in endogenous DA concentrations throughout the course of a day do not significantly alter the density and affinity of the DA D2 receptors, at least not to an extent measurable by current PET technology. Similarly, variations over several weeks appeared to have negligible effects on the measurements.
Furthermore, the sequential and nonsequential results are consistent in both healthy and MPTP-lesioned animals. Data in a larger population of healthy and MPTP-treated monkeys were published previously (Doudet et al., 2002) and thus will not be discussed further here. One should nonetheless note that the BP and Bmax in the animals with MPTP-induced parkinsonism are increased relative to levels in healthy monkeys by the same extent in the sequential (48% and 27%) and nonsequential studies (46% and 26%). These observations suggest that it is possible to use either MLCRA method to assess reliably the BP, density, and affinity of DA D2/3 receptors in a stable system. The validity and comparability, however, of the two methods to assess the acute or long-term effects of pharmacologic manipulations need to be explored further.
Another concern in the sequential MLCRA protocol is the possibility of interference between successive studies, either from changes in the receptor system excited by the administration of antagonist or from inadequate clearance of antagonist between studies. Our results strongly support the adequacy of our original estimates of the intervals between scans required to avoid interference among them.
In addition, our results also suggest that the mass of raclopride administered at the low SA (100 to 200 μg) does not measurably affect the DA D2/3 receptors for extended periods. As part of our design, each animal was scanned several times after having received at least one pharmacologic dose of raclopride during the low SA scan in the weeks before. Early studies suggested that exposure to one pharmacologic dose of neuroleptic (mainly haloperidol) could affect the DA system for weeks (Campbell et al., 1985; Hubbard et al., 1987). The results obtained in our two approaches were comparable, and thus raclopride either did not alter significantly the DA receptor characteristics (changes may be restricted to modifications in DA synthesis, for example) at the dose used, or the MLCRA method by PET is not sensitive enough to measure the changes.
One should note, however, that the range of SA used in either sequential or nonsequential studies may be an important factor in the ensuing result of Bmax and Kdapp. Although we did not attempt to match exactly the SA in the sequential versus nonsequential designs, they did not differ very significantly. Neuroleptics, both raclopride and haloperidol, have been shown to increase the release of DA (See, 1991; Pehek, 1999) and pharmacologic doses of haloperidol increase competition between endogenous DA and 3-N-methylspiperone, a D2 receptor ligand (Ishizu et al., 2000). Our own preliminary studies suggest that SA less than 5 to 6 Ci/mmol (i.e., more than about 400 μg of raclopride) significantly increase the Kdapp. Thus, for any clinical study, the range of specific activities, and especially the lowest, should be kept within predetermined limits to ensure full comparability of the measurements within subjects as well as avoid side effects.
The results presented in Table 1 clearly show that there are no significant differences between the two acquisition methods in the estimation of BP, Bmax or Kdapp. All three parameters vary in either direction between studies. There are no significant differences between the regression lines and the lines of identity (Fig. 2) for any of the three parameters, BP (P = 0.83), Bmax (P = 0.75), and Kdapp (P = 0.26).
If this negative result is accepted as evidence of the effective equivalence of the two approaches, our results also serve as a demonstration of the test–retest reproducibility of our MLCRA method. Previous test–retest reproducibility studies for raclopride were obtained from pairs of high SA scans and thus determined that only of the BP, reported to be 6% to 8% (Volkow et al., 1993). The variations in density, affinity, and BP between the single-day and the multiple-days studies (mean absolute differences 4.6%, 7.4%, and 6.0%, respectively) are entirely consistent with that previously reported for BP alone. In conclusion, the present results are consistent with the claim that the two approaches yield equal estimates of the binding parameters Bmax and Kdapp either throughout the course of 1 day or, if necessary, over several days.
Footnotes
Acknowledgments:
The authors thank Astra Research Center for their gift of the raclopride precursor. They also thank the staff of the UBC/TRIUMF PET program for their assistance and contribution to this work (TRIUMF is funded by a contribution by the National Research Council of Canada). The authors are especially indebted to Dr. T. J. Ruth (Head, PET program), Ms. M. Pronk (chemist), and C. English and C. Williams (technologists); and are grateful for the expertise of J. Grant (AHT) with the animals. Special thanks are due to Dr. J. Love and Mr. M. Boyd and the personnel of the UBC Animal Care Facilities for their outstanding care of the animals.