
Abstract
The multiple ligand concentration receptor assays (MLCRA) method allows, in a stable condition, reliable and reproducible measurements of the density and affinity of the dopamine (DA) D2 receptors with [11C]raclopride, using either a sequential method (two or more scans in one day) or a nonsequential method (two or more scans over days or weeks). We have shown that measurement of receptor density and affinity is also possible after an acute pharmacological challenge with methamphetamine and that both scanning protocols yield similar values. However, our attempts to measure receptor density and affinity after a pharmacological challenge with another class of drugs that lead to the same outcome, increase in synaptic DA concentrations, revealed opposite results with the two scanning methods: a decrease in receptor density with the sequential method and an increase in affinity with a nonsequential method. These results show the impact of the time-dependency of the effects of an ‘acute’ pharmacological challenge on MLCRA studies. A theoretical simulation is presented to account for the discrepancy in the sequential and nonsequential data. A possible alternate scanning paradigm is proposed to avoid the confounding effect of time variability of the endogenous ligand synaptic concentrations in the sequential condition.
Introduction
The in vivo measurement of the physiological characteristics of receptors in a living organism continues to be a challenge. Positron emission tomography (PET) with specific, selective tracers to a variety of receptors has opened the way to a new understanding of physiological mechanisms in health and disease. The binding potential (BP), a concept introduced by Mintun et al,(1984) almost two decades ago, remains the main end point of most in vivo neuroreceptor studies. However, it reflects both the density of the receptors in the tissue of interest and the apparent affinity between these receptors and the test ligand. By analogy with postmortem ligand-binding studies, Farde et al,(1986) and Wong et al,(1986) and a number of followers, including ourselves (Delforge et al, 1995, 1999; Holden et al, 2002; Ito et al, 1998), proposed the administration of multiple concentrations of the PET tracer as a means to measure separately density and apparent affinity in vivo. To date, most applications of these multiple ligand concentration receptor assays (MLCRA) remain devoted to the study of receptor parameters in stable systems, that is, in normal subjects or subjects with long term, chronic conditions such as parkinsonism (Rinne et al, 1995; Doudet et al, 2002) or schizophrenia (Farde, 1987). Nevertheless, even in stable systems, the in vivo and in vitro measurements of density and affinity can yield widely different results. Thus, extrapolating in vitro observations on the effects of a drug on a receptor system to its effects in vivo might be hazardous. One potential application of the in vivo MLCRA approach would be the measurement of the density and affinity in a living neuroreceptor system undergoing a perturbation such as drug challenge.
We have previously discussed some of the advantages and disadvantages of the in vitro versus in vivo approaches and issues related to the interpretation of in vivo results (for details, please see Holden et al, 2002; Doudet and Holden, 2003; Doudet et al, 2003). Very briefly, in in vitro MLCRA studies, the method used to isolate and purify the test membranes from intact tissue is a strong determinant of the experimental outcomes, the density of receptor molecules per mass of isolated membranes, and the apparent affinity between the receptors and the test ligand (expressed as the inverse of the apparent dissociation constant Kd) after the effects of nonspecific binding have been accounted for. In vivo MLCRA avoids the confounding influences of the sample preparation and, in most cases, the bound and free concentrations can be assumed to be adequately identified by the time-course data in target and references tissues. The nonspecific binding in the reference tissue is assumed to be homogenous throughout the brain. Yet, the receptors are not isolated but are embedded in the membranes of live, fully functioning cells in a fully functioning nervous system and, as such, are subject to minute endogenous influences (changes in endogenous ligand concentrations, for example) which can never be definitively identified nor fixed for any time period. The simplest in vivo MLCRA study still requires a minimum of two scans, one at high specific activity (SA) of the tracer, followed after a delay varying from 1 to 2 to 3 h by a second injection of the tracer at a much lower SA or in combination with a dose of the cold compound or an equivalent, allowing for some occupancy of the receptors. Thus, an in vivo MLCRA is usually performed over several hours, and the accuracy of the data is dependent on the amount of internal ‘adjustments' imposed on the receptors by their living environment during the PET data acquisition. Further discussions on associated issues might be found in Delforge et al, (1996), Endres et al, (1997), and Laruelle (2000). Thus, while being a minor disadvantage of the in vivo method in a stable system, the alterations in receptor environment throughout the data acquisition may become magnified in a pharmacological challenge and lead to difficulties in interpretation.
Using raclopride as the tracer, we reported recently (Doudet et al, 2003) the use of a three-points sequential (three scans throughout one day) versus a three-points nonsequential (three scans spread over several weeks, but at the same time of the day) method of data acquisition. In the absence of acute interventions, we found good agreement between the two sets of data, and we concluded that the small continuous regulation and influences imposed on the dopamine (DA) D2 receptor system in vivo throughout the day and from day to day did not represent a large source of variability in the measurements of receptor density and affinity or, more plausibly, that the changes were sufficiently small that we were unable to detect them with the available current technologies. Thus, assuming that correct measurements can be obtained in the baseline, unperturbed condition, it becomes of the highest interest to assess the validity of in vivo measurements in a ‘perturbed’ system such as that following drug treatment. In the case of benzamide tracers such as raclopride or IBZM which are sensitive to competition by endogenous DA, it is unknown how the potential changes in competition over the duration of the PET study may affect the validity of the data. We recently performed sequential versus nonsequential studies of the effect of methamphetamine on the density and affinity of the D2/3 receptors with raclopride using our previously published method (Doudet et al, 2003) and found good concordance between the data obtained by the two methods.
We report here the differential results obtained comparing the two acquisition methods after an acute challenge with another class of drugs known to increase endogenous DA, that is, DA transporter (DAT) inhibitors. Two DAT inhibitors were studied, the short half-life DAT inhibitor methylphenidate, and a long half-life (24-h) inhibitor, brasofensine (NS2214). Our original hypothesis was that, as with methamphetamine, in an acute challenge with a DAT inhibitor, the endogenous concentrations of DA would increase, leading to decreased D2 receptor affinity without change in receptor density, assuming that raclopride has the same access to internalized receptors albeit with a lower affinity. In contrast to our findings after methamphetamine challenge, we found that the three-points sequential and three-points nonsequential methods produce diametrically opposite results.
This paper presents the outcomes of the three-points sequential and nonsequential studies after challenge with the two DAT inhibitors, proposes a working hypothesis to account for the interpretation of the findings, and suggests a possible alternative two-points sequential method to still obtain representative, believable results using the less cumbersome sequential method.
Materials and methods
Three rhesus monkeys (two males, one female) who had not participated in any other drug challenge study at the time of data acquisition were included. All animal procedures were approved by the Committee on Animal Care of the University of British Columbia. The PET scans procedures and anesthesia regimens are described in detail elsewhere (Doudet et al, 2000). Relevant to this study, the animal is initially immobilized with ketamine (10 mg/kg intramuscular), an anesthetic able to affect raclopride binding in some conditions, and to account for this potential effect, the first raclopride injection did not occur before 90 to 120 mins later. Light maintenance anesthesia was obtained with isofluorane. For the scans, the animal was positioned prone to a stereotactic headholder. A Siemens ECAT 953-31B allowed the simultaneous acquisition of 31 coronal slices through the head and brain of the monkey (in plane resolution: 6 mm FWHM; axial resolution: 5 mm). Scan data were acquired in 2D mode over 1 h as previously described (Holden et al, 2002; Doudet et al, 2003). For all scans, raclopride was administered as a bolus (2.5 mCi in 1 min in 10 mL saline) followed by constant infusion (2.5 mCi in 59mins in 30 mL saline) to create a true equilibrium condition (Carson et al, 1997). For the three-points sequential acquisition, three bolus/infusion injections of raclopride, (SA: SA1 > 1000 Ci/mmol; 40 > SA2 > 20 Ci/mmol, and 10 > SA3 > 8 Ci/mmol) were performed throughout the day, 2 to 3 h apart. The lowest SA was chosen to induce occupancy up to 60% to 65%. For the three-points nonsequential studies, the SAs for each corresponding scan were similar but each raclopride scan was performed in a separate day, spaced several weeks apart. For the further two-points sequential, high-occupancy studies (please see the rationale below), the high SA remained unchanged, but the low SA was chosen to induce at least 80% receptor occupancy (5 > SA > 3 Ci/mmol). The data from the high SA three-points sequential study were used to calculate the Bmax and Kdapp of the three-points nonsequential study. This allowed us to reduce the number of scans required per monkey to 12 over the 2 to 3 years needed to acquire the data, thus reducing their radiation exposure. However, to verify that this procedure did not significantly alter the data interpretation, we performed, in at least one animal in each condition, an extra high SA raclopride scan (essentially a test—retest reproducibility scan) after the same dose of drug and the same elapsed time, and used the data from this scan to calculate the Bmax and Kdapp of both the sequential and nonsequential studies for this subject. As expected, the decrease in binding in the high SA data was sufficiently close (5% to 8% reproducibility) as not to significantly affect the Bmax and Kdapp calculations.
Two DAT inhibitors were used: NS2214 (Brasofensine; NeuroSearch Inc., Denmark), a potent and specific inhibitor with a long (24 h in human subjects) half-life, and methylphenidate (MPh), also a potent DAT inhibitor but with a shorter half-life. Racemic MPh was purified in house from its pharmaceutical preparation, ritalin. Each animal participated in the 2 studies, with a minimum of 4 to 6 months interval between drug studies. Two animals underwent the NS2214 study first, the third animal was started on the MPh study first. The scans were obtained with a minimum of 2 to 3 weeks interval between scans. NS2214 and MPh were dissolved in sterile saline. NS2214 (0.4 mg/kg intraperitoneal) was administered 45 to 60 mins before each scan of the nonsequential series, but only once before the high SA scan of the sequential series, based on its long half-life. In contrast, because of its short half-life, MPh was given as a bolus followed by constant infusion (in a different vein than raclopride infusion): the bolus (1 mg/kg intravenous) was administered 15 to 30 mins before the first scan, followed by a slow constant infusion of 0.5 mg/kg h for the remainder of the study.
The doses of NS2214 and MPh and infusion parameters for MPh were chosen to induce stable DAT occupancy over the course of the 6 to 7 h study: serial high SA scans with a tracer specific of the DAT (in our centre, [11C]methylphenidate) were performed in two monkeys (not included in the current study) after administration of the DAT inhibitor challenge with a timing paradigm similar to that used in the MLCRA studies. The binding of [11C]methylphenidate was decreased by 30% to 33% after MPh and 18% to 23% after NS2214, with less than 10% variation between the scans (e.g. similar to the test—retest reproducibility).
Furthermore, sequential high SA raclopride scans were obtained in one animal (one animal participating in the present study and one who did not participate in the study) after administration of either NS2214 or the bolus + infusion of MPh, also using the same experimental paradigm. These studies were performed to assess the synaptic DA concentrations over time after the drug challenge. In each animal, after DAT inhibition, the raclopride BP was decreased similarly in all 3 scans (29% ± 5% after NS2214 and 32% ± 3% after MPh), suggesting consistency of the synaptic DA levels throughout the study.
For all scans, regions of interest were positioned over the striatum and cerebellum (Doudet et al, 2000) and the time—activity curves were analyzed using the graphical analysis of Logan et al, (1996) using activity in the cerebellum as the input function, between 30 and 60 mins after injection, by which time equilibrium was reached at all SA used. For each scan, the Logan analysis yielded a distribution volume ratio (DVR). Distribution volume ratio minus one (DVR–1) was interpreted as an estimate of the equilibrium ratio of bound and free ligand (B/F) in striatal regions (the y-axis). This was then fitted against the bound ligand concentration in striatum using the routine Scatchard (1949) straight-line method used in most PET studies. The method yielded a value for Bmax (the x-axis intercept), the apparent ligand—receptor dissociation constant Kdapp (inverse of the slope) and the BP (y-axis intercept). For the sequential method, the data from the 3 sequential scans were combined to yield BP-s, Bmax-s and Kdapp-s, and for the nonsequential method the data from the 3 scans obtained in 3 separate days were combined to yield BP-n, Bmax-n and Kdapp-n.
Within each study, baseline, NS2214, and MPh, the densities, affinities, and BPs obtained with the two- or three-points sequential method were compared with those obtained with the three-points nonsequential method using paired t-tests. To reduce the number of comparisons, the baseline data from the sequential and nonsequential paradigms were averaged before comparison with the two sets of NS2214 and MPh data using paired t-tests. Owing to few subjects, we did not perform multiple comparison correction.
Finally, after all the studies were completed, analyzed, and interpreted, additional studies were performed in each animal to verify the validity of the hypothesis that the discrepancy between the three-points sequential and three-points nonsequential studies was due to a progressive increase in synaptic DA over the time-course of the sequential studies. We hypothesized further that, in a condition of high receptor occupancy, the influence of this increase in synaptic DA on the measured B/F ratio would be greatly reduced, thus allowing a more accurate estimate of the maximum receptor density. The additional raclopride scans were obtained at a SA sufficient to produce at least 80% occupancy, that is, 3 to 5 Ci/mmol. The scans (baseline, MPh or NS2214) were obtained in random order. One study was performed in the baseline (no pharmacological intervention) condition, the others were obtained on different days, several weeks apart, with the low SA scan performed 5 to 6 h after administration of NS2214 or bolus + infusion of MPh to mimic the original sequential scanning protocol. From these two scans, one at low occupancy (high SA) and one at high (>80%: low SA), the density and affinity at baseline and after NS2214 and MPh in a sequential scanning protocol were calculated. These results were compared with those obtained from the three-points sequential and nonsequential studies at low, mid, and moderate occupancies (up to 60% to 65%). For simplicity and to distinguish it from the routine three-points sequential method, we will refer to this method as the two-points high-occupancy sequential method.
Results
Results of the three-points sequential versus three-points nonsequential comparison are summarized in Table 1 . As previously reported (Doudet et al, 2003), there were no significant differences between the density, affinity, and BP obtained with the sequential or nonsequential method at baseline. Thus, the statistical analyses were performed using the BP, density, and affinity values obtained by averaging those from the three-points sequential and three-points nonsequential baseline studies.
Averaged density (Bmax), affinity (Kdapp), and binding potential (BP) obtained in three monkeys using both our routine sequential (Seq.) and nonsequential (Non-Seq.) paradigms in the baseline condition and after administration of two DAT inhibitors, methylphenidate (MPh) and brasofensine (NS2214)
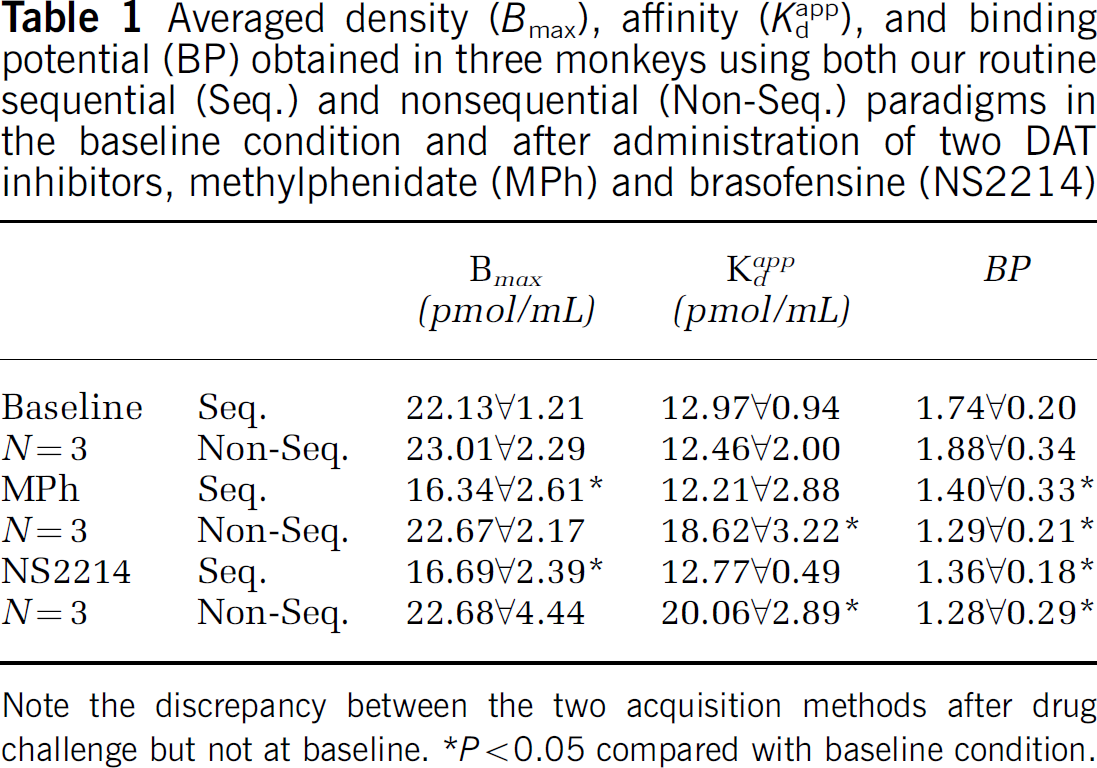
Note the discrepancy between the two acquisition methods after drug challenge but not at baseline.
P>0.05 compared with baseline condition.
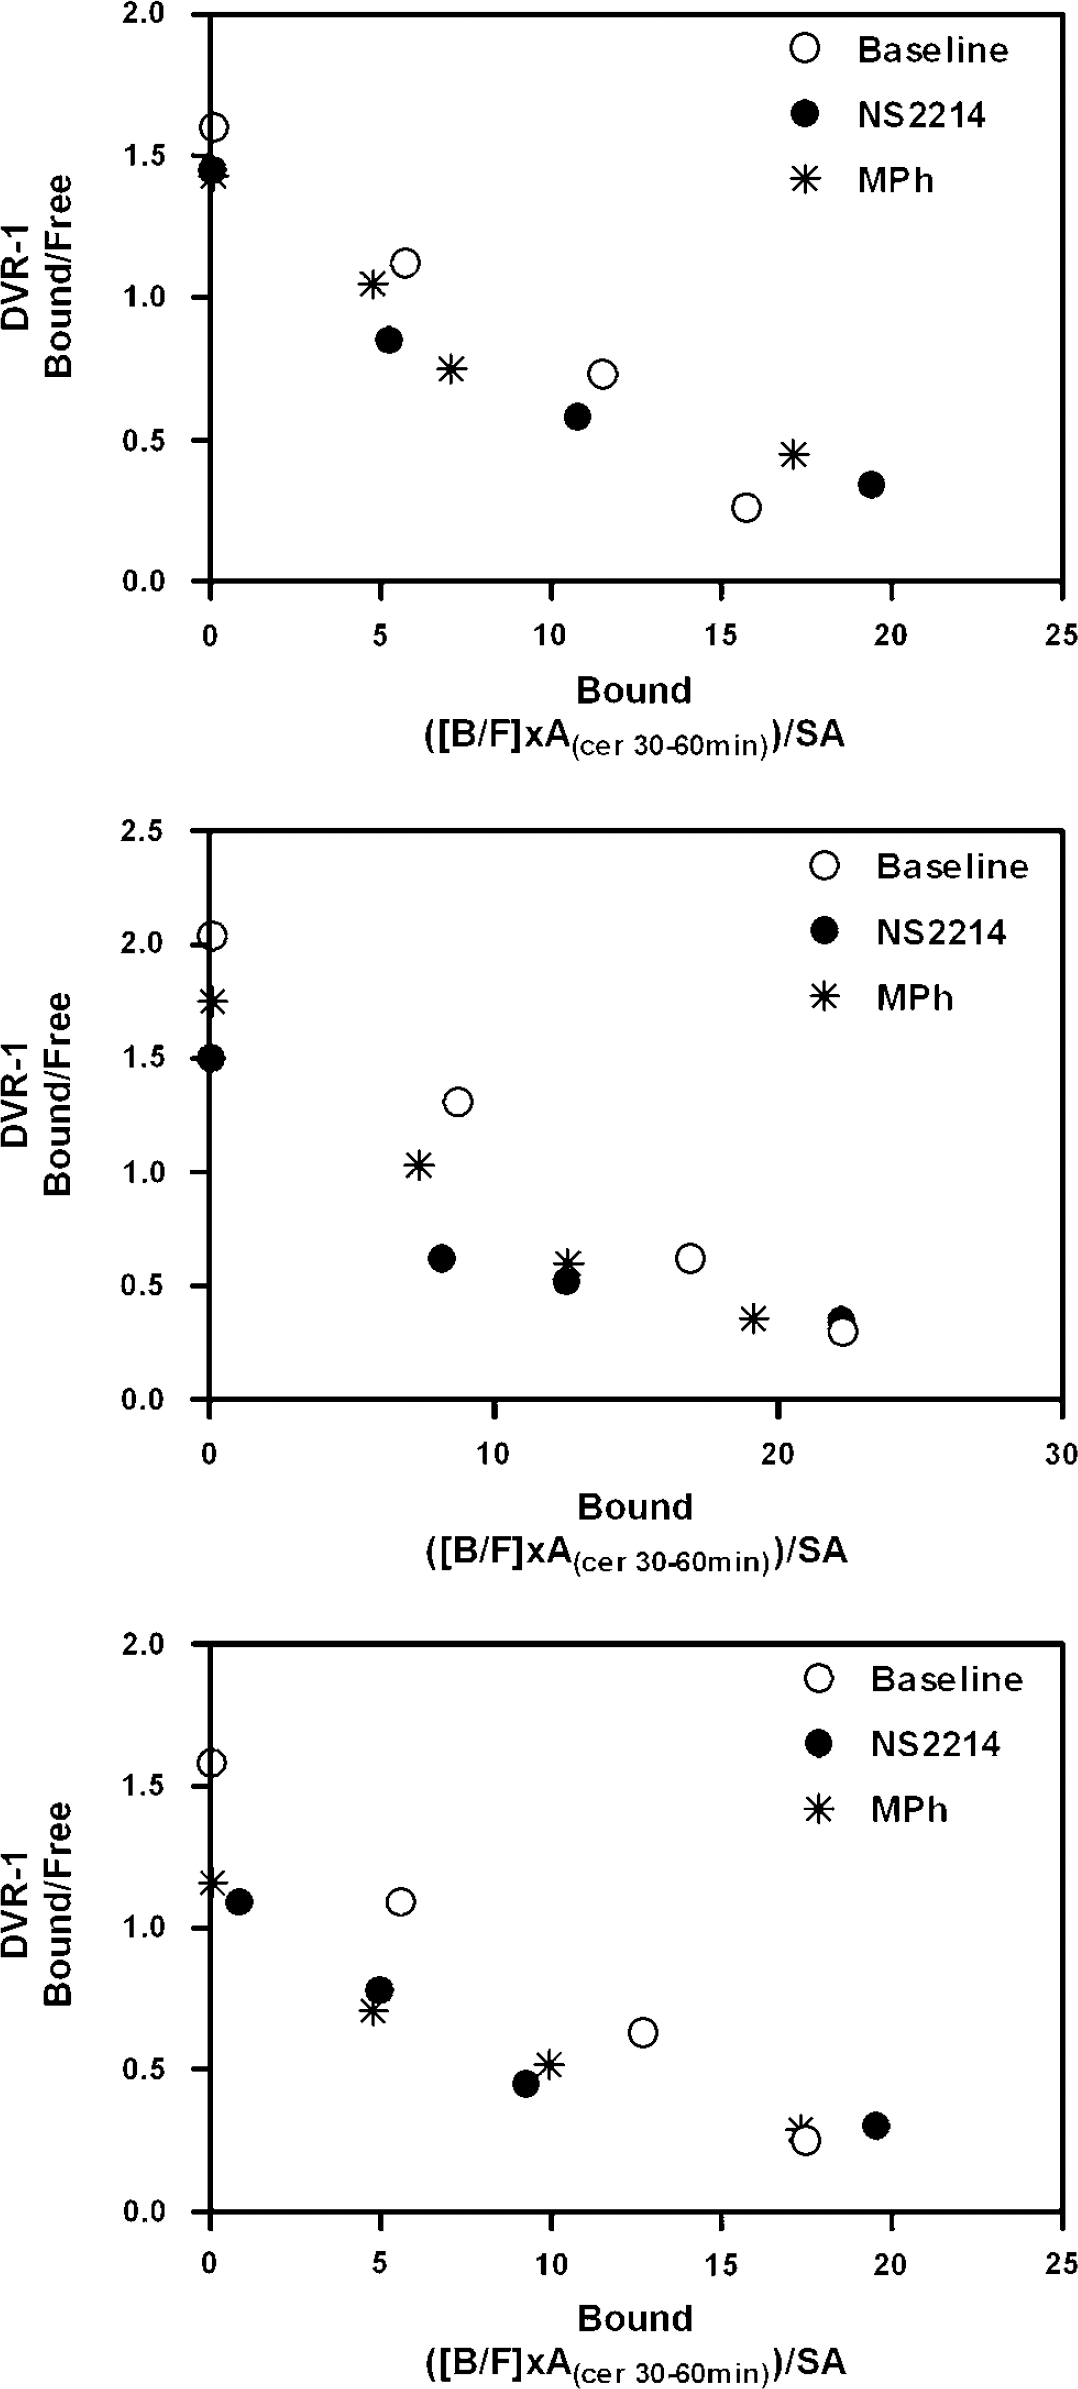
There were significant differences between the data obtained with the three-points sequential and nonsequential methods in the drug challenge conditions (Table 1). Although the BP was similar between the two acquisition methods, the Bmax and Kdapp were significantly different between acquisition methods for both drug challenges, as clearly shown in Table 1 and Figure 1.
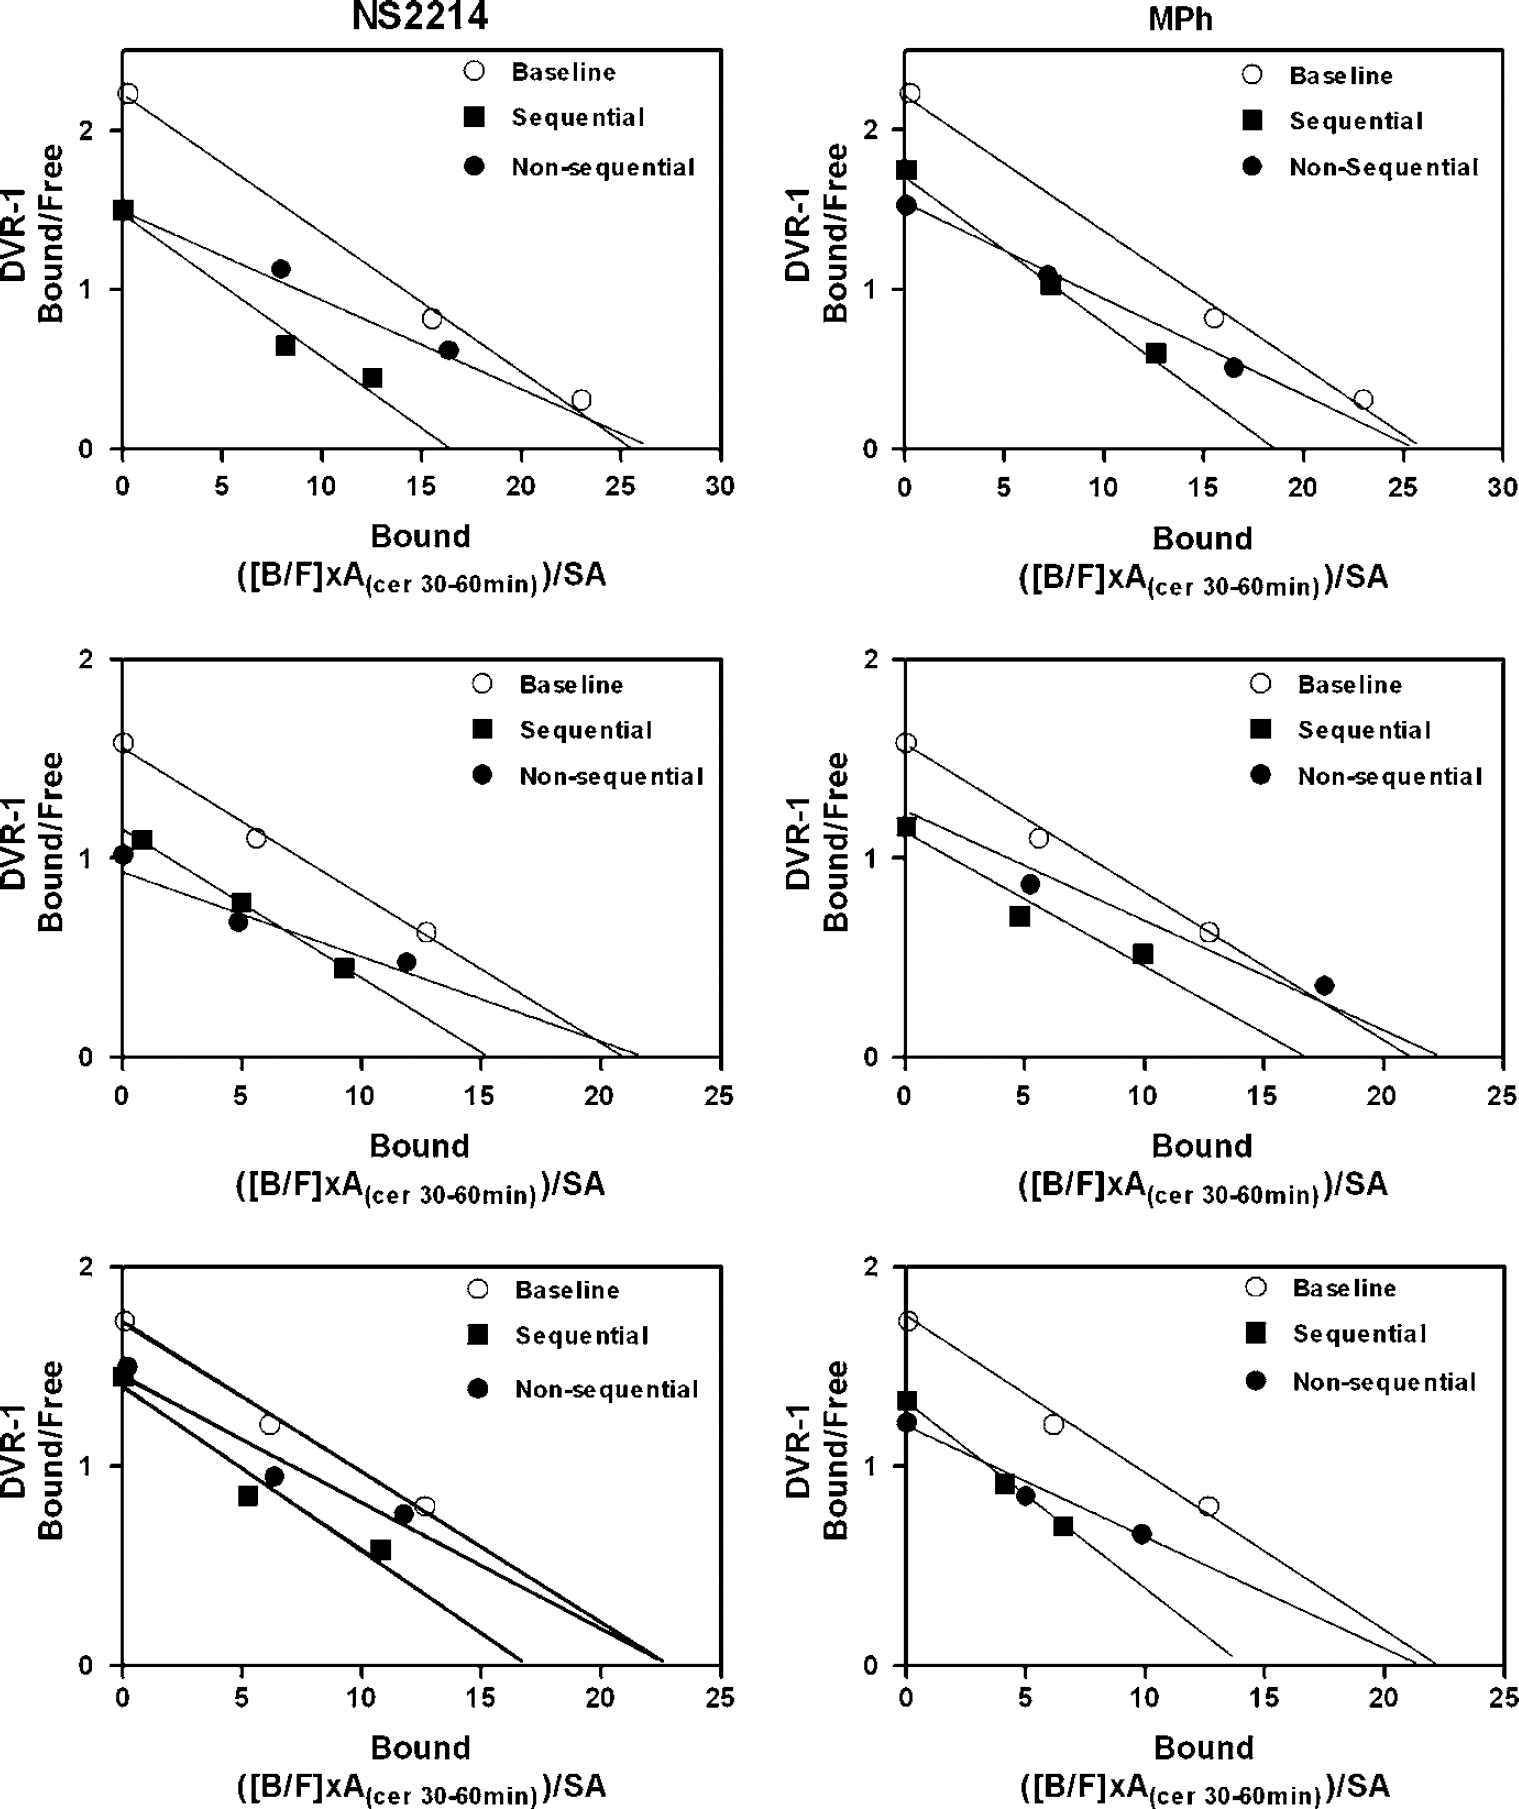
Straight-line Scatchard plots of the sequential and nonsequential data obtained in all three monkeys (arranged top to bottom) after administration of NS2214 (left) and MPh (right). The baseline data (⋄) were obtained using the routine three-points sequential method. The filled symbols show the data obtained using the routine sequential method (▪) and the nonsequential method (♦) after administration of the DAT inhibitor (see text for further explanation).
Use of the sequential scanning method with only moderate occupancy of the receptors (up to 60% to 65%) after administration of either MPh or NS2214 led to an apparent significant decrease in both the BP (respectively: BP(MPh): 22%, P=0.004; BP(NS2214): 25%, P=0.01) and the density (respectively: Bmax(MPh): 28%, P=0.012; Bmax(NS2214): 27%, P=0.005) of the receptors compared with baseline. There was no measurable change in Kdapp compared with baseline.
In contrast, in the nonsequential studies performed after administration of either MPh or NS2214, the significant decrease in BP persisted, as expected (respectively: BP(MPh): 28%, P=0.005; BP(NS2214): 29%, P=0.011), and was similar to that obtained with the sequential studies. However, the density of the D2/3 receptors appeared unchanged while the affinity decreased significantly, as shown by the significant increase in Kdapp (respectively: Kdapp(MPh): 45%, P=0.02; Kdapp(NS2214): 56%, P=0.011).
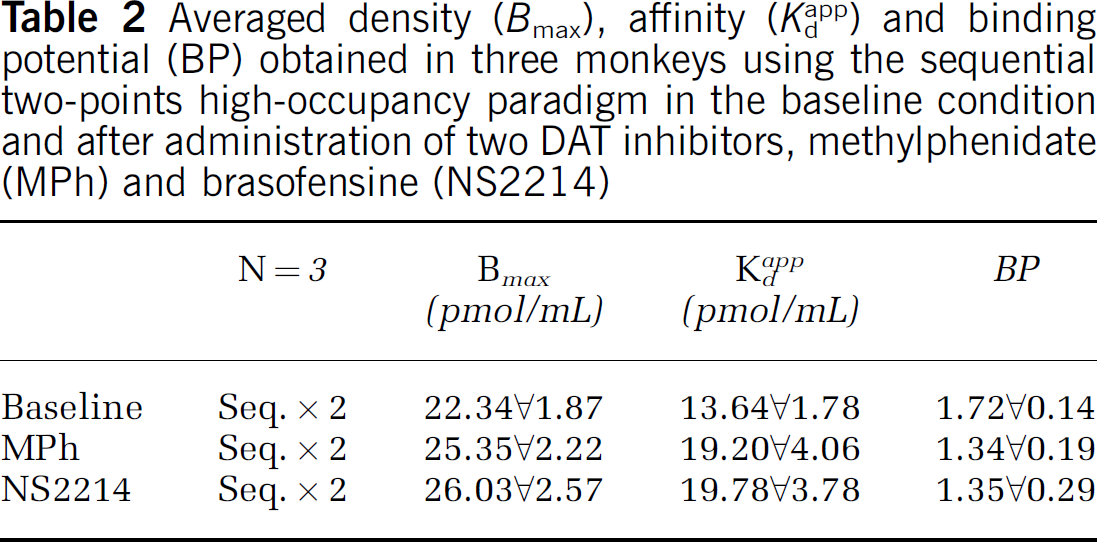
Results from the two-points high-occupancy sequential method are presented in Table 2 and Figure 2. In the baseline condition, there were no significant differences between the data obtained with the two-points high-occupancy sequential method and the three-points sequential or nonsequential methods (Tables 1 and 2). However, in the DAT inhibition studies, there were significant differences between the routine sequential and the high-occupancy sequential methods. Although both methods yielded comparable BP for each drug (MPh: 1.34 versus 1.40; NS2214: 1.35 versus 1.36, respectively), Bmax and Kdapp varied in opposite directions (compare Tables 1 and 2). In contrast, there were no significant differences between the Bmax, Kdapp, and BP values obtained with the two-points high-occupancy sequential method compared with those obtained using the three-points nonsequential method. As with the nonsequential method, compared with baseline, the two-points high-occupancy sequential method led to a decrease in BP after both MPh and NS2214 challenge (23% and 22%, respectively) and an increase in Kdapp (48% and 52%, respectively), without significant changes in Bmax (Figure 2).
Straight-line Scatchard plot of the data obtained in one monkey using the two-points high-occupancy sequential scanning method. Note that, at baseline, the fourth high-occupancy (>80%) data point falls on the same line as the data obtained with lower occupancy scans, supporting the hypothesis that raclopride labels a single class of receptors. Note also that the three high-occupancy data points fall within the same range, supporting our claim that, at high receptor occupancy, the degree of competition presented by increased concentrations of synaptic DA becomes negligible relative to the pharmacological dose of tracer.
Averaged density (Bmax), affinity (Kdapp) and binding potential (BP) obtained in three monkeys using the sequential two-points high-occupancy paradigm in the baseline condition and after administration of two DAT inhibitors, methylphenidate (MPh) and brasofensine (NS2214)
Discussion
To the best of our knowledge, this report is the first to show that the outcome of in vivo measurements of density and affinity after a pharmacological challenge might be highly dependent on the scanning method and/or its timing. Our equilibrium approach (as well as that of others) to the distinction of receptor density from affinity effects in in vivo receptor assay using PET is critically dependent on the assumption that the multiple tracer studies differ from each other only in the cold ligand concentration associated with each tracer injection. This dependence does not preclude the study of acute interventions that directly affect the receptors of interest or their environment, as long as the effects of the interventions are exactly the same at each SA of the test ligand. The results of the present study show the impact of the time of the effects of acute administrations of two DAT inhibitors on MLCRA studies designed to distinguish changes in receptor availability from those in receptor—ligand affinity after DAT inhibition.
A possible reason for the differences between the three-points sequential and nonsequential results could be a different influence of isofluorane anesthesia on raclopride binding in the long sequential studies versus shorter nonsequential studies. This, however, is unlikely: indeed, we have previously shown that, in the absence of pharmacological manipulation, there was no significant difference between the three-points sequential and three-points nonsequential studies (Doudet et al, 2003). In addition, early on in our design of the MLCRA, we ascertained in a few animals that the raclopride BP was unchanged throughout the day in isofluroane anesthetized animals receiving serial high SA raclopride scans (unpublished data). Tsukada et al, (1999, 2002) have shown that isofluorane acutely enhances the inhibitory effects of DAT blockers (cocaine and GBR12909) as well as that of methamphetamine, which could possibly account for the time dependency in a 6 h study such as ours. However, we found no time dependency effect in our methamphetamine studies and, using the same paradigms, no differences between the three-point sequential and three-points nonsequential methods after a methamphetamine challenge (Doudet and Holden, 2003). Finally, serial high SA raclopride scans after amphetamine (Carson et al, 2000) or NS2214 (unpublished results) showed no significant changes in raclopride BP between the first and last scan. Thus, we believe that, although isofluorane may exert an undeniable effect on the DAT and thus affect raclopride BP, it is unlikely that it is responsible for the time-dependent effect we observed in this specific challenge compared with amphetamine challenge.
It is notable that these two classes of drugs, amphetamine-like and DAT reuptake inhibitors, produce such profoundly different outcomes in the three-points sequential and nonsequential scanning paradigms. The drugs' ultimate outcome is the increase of synaptic DA. However, while MPh and NS2214 only block the reuptake, leading to a slow rise in synaptic DA, amphetamine-like compounds both actively release DA and block its reuptake, likely leading to a much faster, almost instantaneous climb in synaptic concentrations. This different profile of action might be responsible for the discrepancy between results from the two drug challenges.
For both methylphenidate and NS-2214, the results from the three-points sequential approach, with the multiple raclopride administrations performed on a single day and separated by only 2 to 3 h, were consistent with an apparent reduction in the density of binding sites, while the raclopride—receptor affinity remained unchanged. In contrast, when the studies were performed on separate days, which allowed the raclopride injections to be performed always after the same interval after the identical drug administrations, the results matched those from our previous study of methamphetamine effects on the same system (Doudet and Holden, 2003), in which the raclopride—receptor dissociation constant was significantly increased while the maximum receptor concentration remained unchanged.
We interpret this discrepancy as a consequence of the time-varying occupancy induced by the time-varying concentrations in endogenous DA as a result of continued blockade of the DAT by the drug. The current study is an example of our routine comparison of the sequential and nonsequential methods as the first step in the study of a new acute intervention, to test for such time-dependence effects.
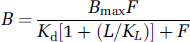
The results of the nonsequential studies are consistent with the simple competition between raclopride and endogenous DA. The competitive binding of two compounds at a single binding site is characterized by the expression
where B is the concentration of receptors bound to the test ligand, Bmax is the total receptor density, F and L are the concentrations of free raclopride and DA available for binding, and Kd and KL are the dissociation constants for raclopride and for DA, respectively. This expression makes clear that the relative degree of binding by multiple ligands is determined neither by their respective affinities for the receptor alone nor by their concentrations alone, but rather by the quotient of concentration and dissociation constant for each ligand.
Equation (1) can be rearranged into a more familiar expression relating the bound concentration to the free concentration with which it is equilibrated
Further rearrangement into the Scatchard relationship
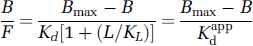
explicitly shows the dependence of the slope of the linear Scatchard plot on the concentration of competing DA in the simplest competitive binding picture. In the last term of this expression, the DA dependence has been combined with Kd to form the apparent dissociation constant Kdapp measured in our MLCRA studies.
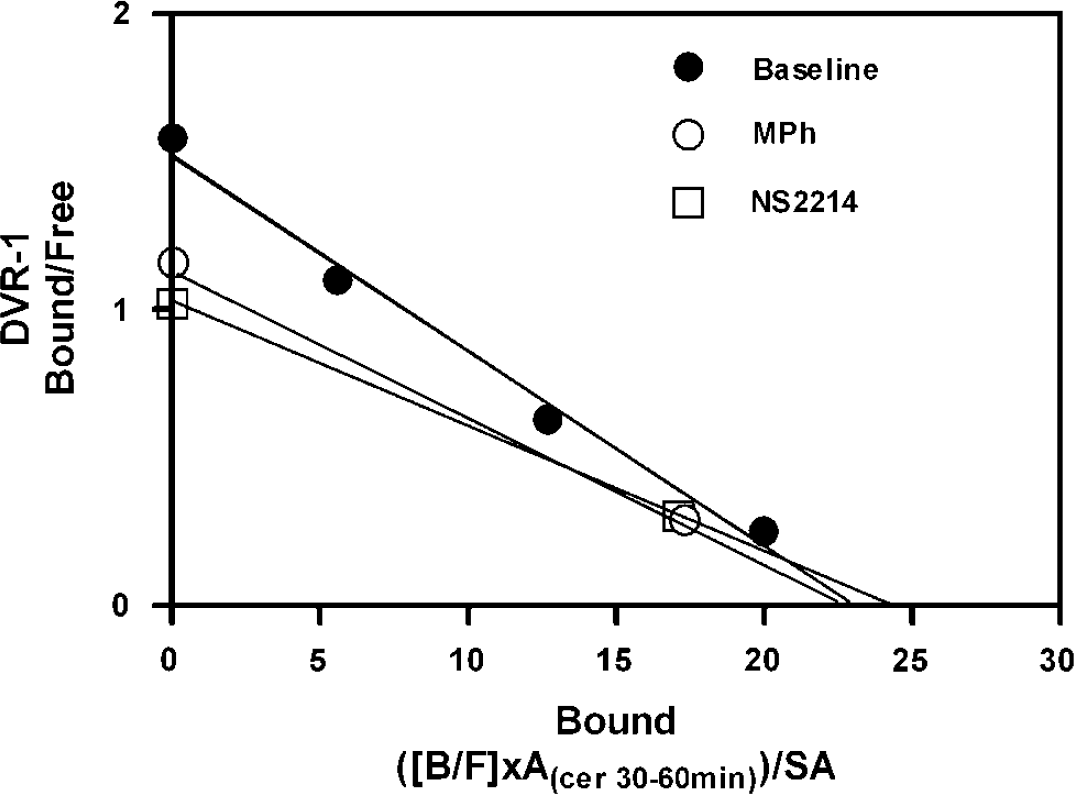
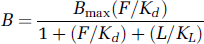
Figure 3 shows the results of a theoretical simulation of this possibility. The simulation is similar to one performed previously to argue against a putative time dependence of the dissociation constant after acute administration of methamphetamine (Doudet and Holden, 2003). As in that case, the simulation is based on the design of our sequential MLCRA studies, in which successive studies are performed with SA values intended to yield evenly spaced points on the B-axis, and the studies are in turn evenly spaced in time. In this case, a progressive increase in synaptic DA was assumed, which would cause the apparent dissociation constant to increase linearly over time. The uppermost straight line corresponds to the relationship between B/F and B for Bmax = 23 pmol/mL and a constant Kdapp = 18.5 pmol/mL. The curved line shows the relationship in the event of a linearly increasing Kdapp value. The three data points drawn from this curve correspond to the results of a hypothetical sequential MLCRA experiment under these conditions. The three points correspond to the SA values that would have yielded B values of 0, 6, and 12 pmol/mL if Kdapp had remained constant. In the simulation, the Kdapp values for these three studies were instead 18.5, 23.6, and 28.7 pmol/mL, respectively, which caused a decrease of both B/F and B from the values that would have been seen had Kdapp remained constant. Finally, the lower straight line is the standard Scatchard fit of those three data points, which yielded a Kdapp value of 12.25 pmol/mL and a Bmax value of 14.94 pmol/mL.
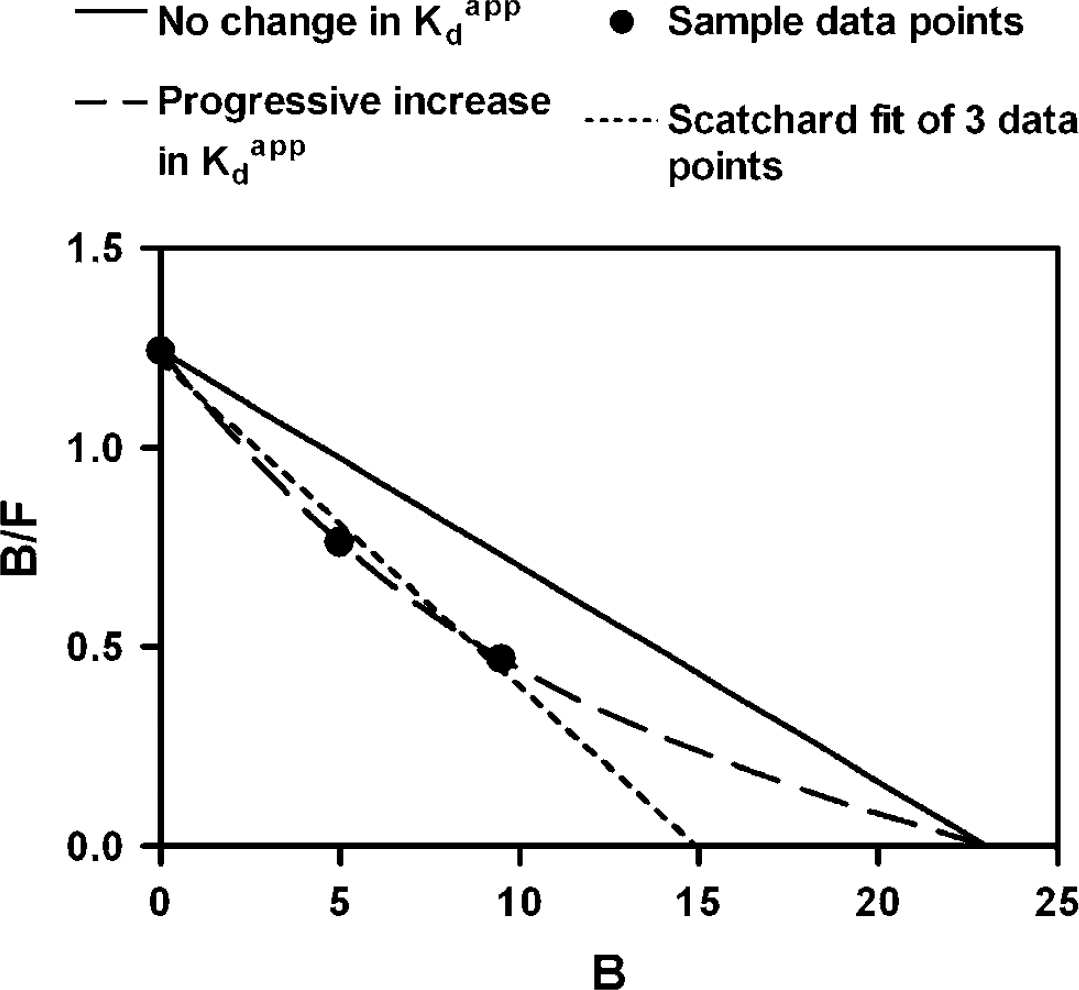
Hypothetical simulation of our hypothesis. The upper straight line shows the relationship between B/F and B for fixed values of Bmax and Kdapp, and closely resembles our experimental results from the nonsequential studies after DAT inhibition. The curved line below shows the new relationship when each successive value of B is associated with an increased value of Kdapp. Three points drawn from this curve were fitted as if they were the results of a sequential MLCRA experiment. The resulting fit yielded parameter values that closely match our experimental results from the sequential studies after DAT inhibition.
The two-points high-occupancy studies performed as part of this study had two distinct motivations. The first was to challenge the reduction in Bmax implied by the sequential data. As expected, the bound concentration B observed at these very low SA values (>80% receptor occupancy) exceeded the Bmax implied by the sequential data for both drugs in all three animals. The second was to validate a simplified approach to MLCRA studies under conditions where the affinity between test ligand and receptor might not be stable over time as in the present case. Figures 2 and 3 help clarify two features of saturation studies as occupancy approaches saturation. First, the uncertainty in the horizontal intercept (Bmax) is reduced, and, second, the sensitivity of the high-occupancy point to the dissociation constant decreases, as implied by the convergence of the hypothetical curves in Figure 3. We believe that these properties account for the excellent agreement between the two-points high-occupancy results and those from the three-points nonsequential studies. Figure 4 summarizes the data of the three-points sequential studies to which we have added the low SA activity data point of the two-points high-occupancy study. Note the curved appearance of the data after pharmacological intervention, but not in the baseline condition. In effect, the high-occupancy data point provides an estimate of Bmax that is nearly independent of the Kdapp associated with that point. This estimate, combined with the high SA data point close to the vertical axis, yields an estimate of the Kdapp value associated with that same high SA point. In this condition, however, the BP and Kdapp values are highly dependent on the determination of the BP of the first, high SA study, a data point which might be itself highly dependent on the time of tracer injection, that is, the interval between drug challenge and radiotracer administration.
Summary of the results from all three animals (top to bottom) showing the consistent discrepancies between the sequential and nonsequential methods at intermediate receptor occupancies, and the consistent agreement between the methods at high receptor occupancies, for both tracers. To the data points of the three-point sequential studies is added the data point from the low SA injection (>80% receptor occupancy) from the two-points high-occupancy sequential study, showing the curved appearance of the four points in the two pharmacological challenge conditions, but not in the baseline condition.
Another point to consider is the possible effect of administering high concentration of the tracer itself, a neuroleptic, on the response of the DA system itself. Neuroleptics have been shown to increase the release of DA (Pehek, 1999; See and Murray, 1992), and pharmacological doses of haloperidol can increase competition between the tracer and endogenous DA (Ishizu et al, 2000). We have preliminary data suggesting a small increase in Kdapp when using SA below 6 Ci/mmol (mass above 400 μg of raclopride). However, in our studies, this effect remained minimal and highly variable between subjects. Thus, if the goal of a study is to evaluate the effects of a drug challenge compared with baseline, the range of SA used should be kept as close as possible to ensure comparability of the measurements both within and between subjects.
An interesting question is raised by our anecdotal observation in two animals that a three-points sequential study performed with three high SA raclopride doses does not yield the result expected on the basis of our hypothesis of slowly increasing synaptic DA throughout the day, leading to increased Kdapp at each time point. Based on our assumption, the BP of the successive high SA raclopride scan would have been reduced compared with baseline and with the previous scan. Instead, we found that the raclopride BP remains stable throughout the day after the DAT inhibitor challenge. We however believe that this observation does not invalidate our hypothesis when it is considered in the light of biological processes, and keeping in mind that in vivo Scatchard studies are performed in a living organism in which the cells are intact (as opposed to an in vitro binding assay) and natural feedback mechanisms play a role. Thus, when raclopride is injected at high SA, the concentrations of antagonist do not interfere with normal biological processes (satisfying the PET postulate): in this condition, after the DAT inhibitor is administered, synaptic DA initially increases. This synaptic DA leaks in the extracellular space and triggers intrinsic feedback mechanism by stimulating the D2 autoreceptors, leading to decreased or complete inhibition of synthesis and/or DA release. Thus, although the DAT is blocked, synaptic DA does not continue to increase significantly and stabilize, leading to stability of the high SA raclopride BP over time.
However, during a Scatchard-type study, this biological process is hindered by administration of pharmacological doses of the D2 antagonist in the mid and low SA scans: as raclopride and DA compete for the same D2 sites, at the postsynaptic receptors and the presynaptic autoreceptors, the feedback process initiated by autoreceptors' stimulation, inhibiting DA release/synthesis, is decreased or abolished. We believe that, in that case, DA release continues and synaptic DA continues to slowly increase since the DAT is blocked. This blockade of the D2 autoreceptors and increased synaptic DA is already held responsible for the increased Kdapp noted during in vivo Scatchard studies after administration of pharmacological doses of neuroleptics (Ishizu et al, 2000). Thus, while a triple high SA study has little or no measurable pharmacological effect on the outcome of the study and can thus be used to measure the consistency or changes in synaptic DA during drug challenges, the conditions created by a Scatchard study itself modify the function of the presynaptic regulatory system, a problem magnified by the pharmacological challenge.
Thus, although apparently in contradiction, our hypothesis of increasing Kdapp in response to increasing synaptic DA throughout the Scatchard studies is not incompatible with the lack of change in BP in serial high SA raclopride studies. The questions raised by this phenomenon will be discussed in detail in a future article devoted to the issues of interpretation of the in vivo MLCRA studies in various conditions.
In summary, both the nonsequential and the two-point high-occupancy sequential approaches avoid the erroneous apparent reduction of Bmax seen in sequential studies of DAT inhibition when only moderate maximum receptor occupation is attained. Our results (Tables 1 and 2) show that the two approaches are fully consistent in their exclusion of a large reduction in receptor density, and agree that the BP reduction seen with DAT inhibition is due primarily to a change in affinity rather than a decrease in Bmax. Thus, the high-occupancy study offers an alternative in situations where multiple scan days represents an unreasonable clinical burden.
In conclusion, we show here that the MLCRA method can provide useful data on the acute effects of a pharmacological intervention, provided that a proper study design is carefully determined before the start of data collection. We also present here two possible methods by which the time-dependency of the data in the sequential studies might be avoided. Each approach presents advantages and disadvantages which should be carefully considered before the choice of one or the other be made for a particular patient population, taking into account each method's intrinsic errors. One method is to use a nonsequential scanning design which will however require the subject to come to the PET center at least twice, but permits the use of limited receptor occupancy (up to 50% to 60%). An issue is the uncertainty introduced in the measurements due to multiple repositioning of the subject over several days. The alternative is to abide by a sequential scanning protocol with the second scan obtained at high receptor occupancy (at least 80% to 90%). Although this method has the advantage of requiring only one trip of the subject to the PET center and only one pharmacological challenge, it might be neither ethical nor feasible in certain patient populations who could not tolerate high levels of receptor occupancy (such as blockade of D2 receptors in parkinsonian subjects). Another tradeoff to consider is the difficulty in accurately estimating the B/F ratio in low SA high receptor occupancy images, due to the very low contrast between specific and nonspecific binding regions. This report also emphasizes the need for stringent evaluation of a scanning method, even long proven, when used in a new paradigm or a new tracer, as errors in data interpretation are always highly possible when dealing with a live physiological system.
Footnotes
Acknowledgements
The authors thank Astra Research Centre for their gift of the raclopride precursor. We thank NeuroSearch Inc. for the generous gift of NS2214, brasofensine for these studies. The authors thank the staff of the UBC/TRIUMF PET program for their assistance and contribution to this work. TRIUMF is funded by a contribution by the National Research Council of Canada. The authors are grateful to Dr TJ Ruth (Head, PET program) and JA Stoessl (Director, Pacific Parkinson Research Centre). This study would not have been possible without the assistance of Ms S Jivan and M Pronk (chemists), C English and C Williams (technologists). The authors are especially indebted to J Grant (AHT). Special thanks are due to Dr J Love and the personnel of the UBC Animal Care Facilities for their outstanding care of the animals.