
Abstract
The ligand-receptor binding potential determined by in vivo PET studies at high ligand-specific radioactivity reflects both the receptor density and ligand-receptor affinity. This ambiguity has been resolved by various methods based on the administration of multiple unlabeled ligand concentrations. The authors aimed to implement and refine an approach to multiple ligand concentration receptor assay that combined maximum simplicity and a minimum of assumptions and model dependence that would nonetheless reliably distinguish density from affinity effects. The approach uses administration by bolus followed by infusion to obtain a true equilibrium between bound ligand and the other components of the ligand concentration, and does not require measurements of ligand in blood plasma. Four approaches to the optimization of the desired density and affinity parameters from the measured equilibrium data were implemented and compared in the analysis of raclopride studies performed in both normal control and MPTP-lesioned nonhuman primates. The authors conclude that the method is simple enough for routine use and yet reliable enough to apply in ongoing studies of both chronic and acute drug effects in the dopamine system.
Keywords
The concept of binding potential (BP) was introduced in the earliest days of the application of positron emission tomography (PET) to the study of neuroreceptors in vivo (Mintun et al., 1984). Binding potential continues to be the most prevalent experimental endpoint in such studies, primarily because its determination from measured data is so reliable and robust, regardless of the particular data-acquisition and reduction methods chosen. It is by definition, however, a reflection of both the density of receptors in the target tissue of interest and the apparent affinity between those receptors and the test ligand. This ambiguity can in principle be resolved by the use of multiple concentrations of test ligand, in analogy with similar approaches in in vitro postmortem ligand binding studies in preparations of dilute concentrations of membranes isolated from the target tissue. Despite this common principle, however, there are many important differences between multiple ligand concentration receptor assays (MLCRAs) applied in vitro in membrane preparations and in vivo using PET. We have investigated the properties of a particular approach to MLCRA using PET, particularly as a means of distinguishing density from affinity in in vivo receptor binding studies. The defining feature of our approach is test ligand administration by bolus followed by infusion (Carson et al., 1993, 1997; Laruelle et al., 1994), with the goal of attaining true equilibrium between the bound and free concentrations at each administered concentration. The properties of our approach in comparison to other MLCRA approaches reported in the literature (Delforge et al., 1995, 1999; Farde et al., 1989; Ito et al., 1998) are discussed later.
Dopaminergic striatal denervation in early Parkinson disease (Brooks et al., 1992; Gotto et al., 1989; Rinne et al., 1990) and experimental lesions of the striatum in nonhuman primates using the dopaminergic neurotoxin MPTP (Doudet et al., 2000; Falardeau et al., 1988) induce a significant increase in the BP of the test ligand raclopride to D2-type receptors. This increase may reflect the upregulation of the receptor density Bmax (Rinne et al., 1995). Because such lesions may also be characterized by decreases in synaptic dopamine concentrations, however, which would alter the apparent affinity between receptor and test ligand, this change in BP offers a good example of the density-affinity ambiguity. In the following sections, we describe our approach to data acquisition and reduction in PET MLCRA, and apply this approach to the distinction between density and affinity effects in striata lesioned with MPTP. The experimental endpoints in in vitro MLCRA are the number of receptor molecules per mass of isolated membrane and the apparent affinity between those receptors and the test ligand, expressed inversely as an apparent dissociation constant Kd. It has long been recognized that determinations of both of these parameters are strongly dependent on the details of the methods used to isolate and purify the test membranes from the intact tissue (Seeman et al., 1984). For any given well-described preparation method, however, it is at least plausible that these two parameters can be regarded as the only determinants of the behavior of the measured data, after the effects of nonspecific binding have been accounted for.
These observations bring out both the most important advantage and the most important disadvantage of in vivo PET MLCRA relative to in vitro MLCRA. The advantage is the avoidance of the confounding influences of the sample preparation; the bound and free concentrations of the test ligand are assumed to be unambiguously identified on the basis of the time-course data in target and reference tissues. In a recent report, Delforge et al. (2001) provided powerful evidence that the upper limiting value of the kinetically determined bound component represents an accurate estimate of the true total concentration of receptors in a tissue. These same authors also have provided the clearest commentary on the interpretation of the kinetically identified free ligand concentration (Delforge et al., 1996). The relation between this measured concentration and the concentration of ligand actually available for binding is, at the outset, completely unknown. If this relation is independent of ligand concentration, however, its effects are absorbed into the value of the apparent affinity between receptor and ligand. This idea is neither unique to in vivo MLCRA nor disqualifying: apparent ligand-receptor affinity values determined by in vitro MLCRA can vary by orders of magnitude (Seeman et al., 1984). The primary goal in both experimental contexts is to distinguish receptor density from affinity effects in the measured data.
The greatest disadvantage of in vivo PET MLCRA is that the receptors are not isolated, but are embedded in the membranes of intact, fully functioning cells, which are in turn part of an intact, fully functioning central nervous system. Objections raised based on the potential confounding effects of this lack of isolation can never be definitively answered. The challenge to practitioners of in vivo MLCRA is to account for such potential confounds in the experimental design to the greatest degree possible.
In both in vitro and in vivo experimental contexts, the measured relation between the multiple values of bound ligand concentration and the free ligand concentration with which they are equilibrated is used to evaluate single values of the total concentration of receptors and the apparent ligand-receptor affinity. Clearly, the assumption is made in both cases that these values are equally valid at all ligand concentrations. Perhaps the most obvious potential confound in the in vivo case is that increasing antagonist concentrations will induce changes in the concentration of endogenous ligand, in which case each data point would be characterized by a different apparent affinity. Such sensitivity of test ligand binding to the presence of exogenous ligand is the basis of the field of displacement studies recently reviewed by Laruelle (2000). In the present work, the evaluation of our proposed method included the search for systematic changes in the apparent affinity as the test ligand concentration was increased. This aspect of the evaluation found additional motivation in previous observations that high levels of haloperidol significantly increased synaptic dopamine concentrations; for example, as determined in rat by microdialysis (Walters et al., 1990) and as inferred in porcine striatum from the behavior of N-methyl spiperone (Ishizu et al., 2000).
Finally, in vivo MLCRA inherits from the in vitro context all the controversy about the best approach for evaluating the parameters of interest from the measured data. In the present work, we compare the properties of four distinct approaches. Our treatment of this question was guided by two critically important facts about in vivo MLCRA: first, that the fitted ordered pairs of data can never be fully independent and, second, that actual saturation of the receptors cannot (or should not) be attained. A third consideration was to use all of the available measured time-course data to maximum advantage.
MATERIALS AND METHODS
Radiochemistry and determination of the specific activity
Raclopride was synthesized as previously described (Namavari et al., 1992). High specific activity (SA) [11C]methyl iodide is produced via the gas-phase reaction of [11C]methane with I2 (Larsen et al., 1997; Links et al., 1997) The high SA for raclopride was greater than 1,000 Ci/mmol.
Stock solution preparation
Raclopride stock solutions were prepared by dissolving raclopride tartrate in USP water to make a 0.5-mmol/L solution. This solution was used to prepare a 0.1-mmol/L stock solution. Stock solution concentrations were precisely determined from standard calibration curves on analytical high-performance liquid chromatography (HPLC) prior to use.
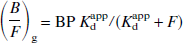
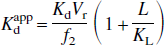
Specific activity adjustment and measurement. The tracer production was initiated such that the final formulation was completed 20 minutes (1 half-life) before the anticipated time of injection. The yield (in millicuries) was measured and the amount of stock solution to be added was calculated using the following formula:

where X is the yield at the time of formulation (mCi), Y is the desired specific activity (Ci/mmol) at time of injection, and Z is the stock solution concentration (0.1 mmol/L). The factor of two in the denominator accounts for the decay occurring between the time of formulation and the time of injection.
The carrier supplied from tracer production of >1,000 Ci/mmol was considered to be insignificant compared to what is added for the purposes of the stock solution volume calculation. The requisite volume was added, the time was noted, the vial was weighed, and an aliquot for precise measurement of the specific activity was drawn. The remainder was sent to the PET center via pneumatic pipelines. An exact volume of the quality control sample was injected onto the previously prepared analytical HPLC system. The specific activity of the adjusted solution was confirmed, and the investigators were notified of any small adjustment of the injection time required to attain the exact desired specific activity.
General experimental procedure
Data were acquired from 14 male rhesus monkeys (Macaca mulatta) were used: 8 were normal (Norm) and 6 had right unilateral MPTP-induced lesions of the nigrostriatal pathway. The latter group displayed symptoms of parkinsonism with bradykinesia, hypokinesia, and rigidity in the side of the body contralateral to the MPTP administration. Animal preparation, data acquisition, and analysis were standardized as previously described (Doudet et al., 2000). Briefly, each animal was immobilized with ketamine (10 mg/kg intramuscularly) at least 2 hours prior to the first scan. Atropine (0.05 mg/kg intramuscularly) was given to decrease secretions. A venous access line was inserted and the monkey was intubated and maintained under light anesthesia with isoflurane gas (1% to 2%) throughout the study. The strong similarity between the kinetics of raclopride in anesthetized nonhuman primates (our study) and in conscious human subjects (Logan et al., 1996) supports the expectation that the effects of this conventional anesthetic method on our results are negligible. The animal was positioned prone in a stereotaxic frame mounted to the scanner bed. The tomograph used was a Siemens ECAT 953–31B that allowed for the simultaneous acquisition of 31 coronal slices through the head and brain of the monkey, separated by 3.5 mm center to center, with an in-plane resolution of 6 mm full width half-maximum and an axial resolution of 5 mm. A transmission scan was acquired for attenuation correction.
Studies were performed with three or four progressively increasing ligand concentrations. All the animals had at least three raclopride scans: high SA (>1,000 Ci/mmol), mid-low SA (25–40 Ci/mmol), and low SA (8–11 Ci/mmol). In addition, five of the animals also had a fourth scan with a mid-high SA (70–100 Ci/mmol) and four other animals had a fourth scan with an extralow SA (3–6 Ci/mmol). The scans were separated by a minimum of 2 hours (between SA1 and SA2) and up to 3.5 hours (between SA3 and SA4). In each study, the radioactive ligand was administered as a bolus followed by constant infusion intended to attain a constant concentration in brain. A 50% bolus (2.5 mCi), diluted in 5 mL saline was injected over 30 seconds, immediately followed by a slow constant infusion of the remaining 50% (2.5 mCi) of the dose diluted in 30 mL saline over the next 59.5 minutes via a Harvard injection pump. The relative percentages for bolus and infusion were taken from Carson et al. (1997). Scanning started with the start of bolus injection. The scanning sequence consisted of six 30-second scans, two 1-minute scans, five 5-minute scans, and four 7.5-minute scans for a total duration of 60 minutes.
Regions of interest (ROIs) were placed over the left and right striatum (circular ROIs: 37 pixels; pixel size: 4 mm2) in four consecutive slices and four ROIs (16 pixels each) were positioned over an area of nonspecific 11C accumulation on the cerebellum in two consecutive slices (for location, see Fig. 1 in Doudet et al., 2000). Time-activity curves were obtained for each ROI and averaged for each animal into left and right striatum and cerebellum.
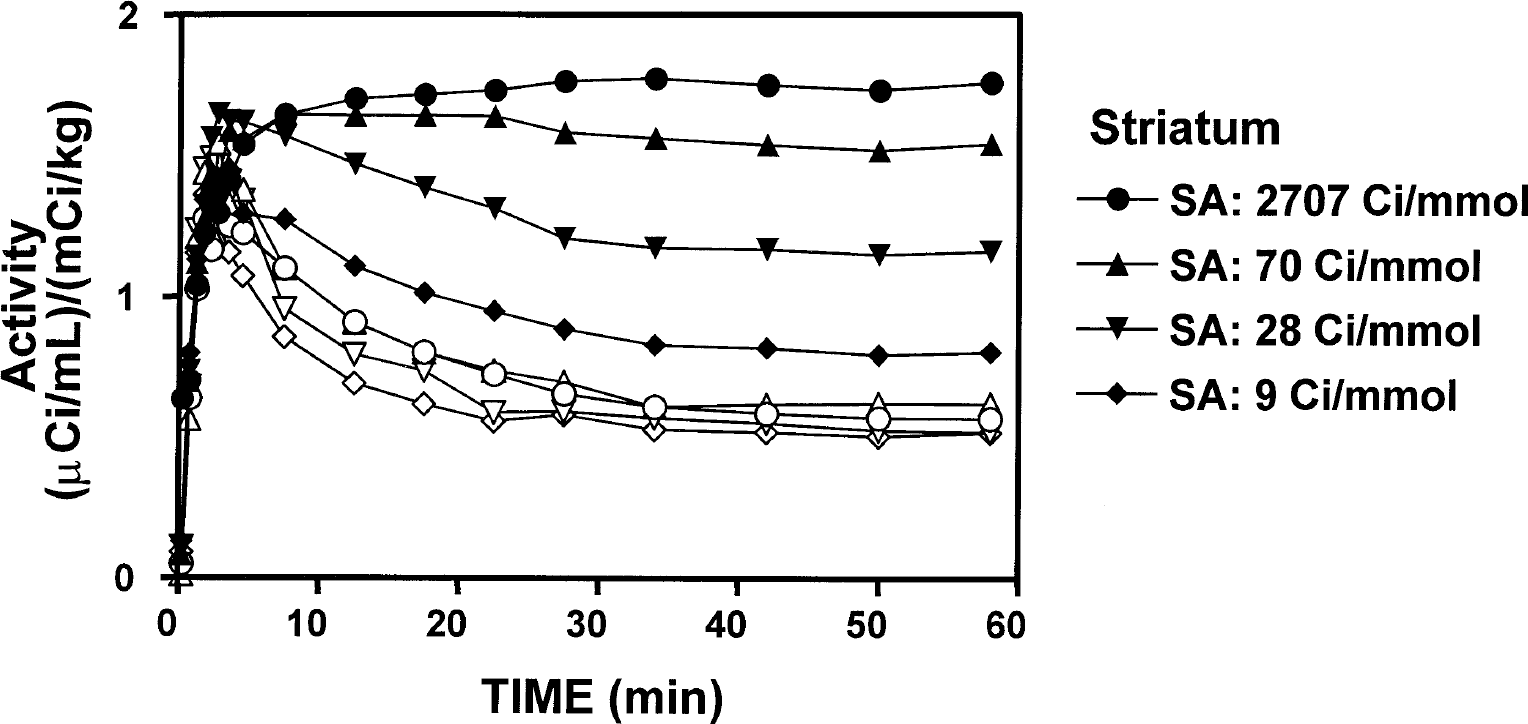
Representative time courses of radioactivity concentration in striatum (filled symbols) and cerebellum (open symbols) in a normal control animal. Constancy over time was consistently obtained in both regions during the last four frames at all specific radioactivities. SA, specific activity.
Data reduction
The primary time-course data were used to derive the values used in the fitting methods described in the next section. Three of the four methods applied required the equilibrium ratio B/F between the concentrations of bound and free ligand in the target tissue. In each case, this value was derived from the tissue-input Logan graphical method for the evaluation of equilibrium distribution volume ratios (DVR) of reversible tracers (Logan et al., 1996). The ratio B/F was estimated as DVR – 1. This ratio, enclosed in parentheses and followed by a subscript g (i.e., (B/F)g), signifies the ratio evaluated in this way, to distinguish it from the same ratio estimated as the quotient of the individually determined B and F values. The Logan fit was performed over the interval 30 to 60 minutes after injection. Because the value of k2 (the compartmental parameter describing the return of free ligand from tissue back to plasma) for raclopride is known to be large, and because the start time of the fit was so late, the Logan method was implemented without the k2-dependent term in the estimate of the abscissa values (Holden et al., 2001). Both the advantages of this use of the Logan DVR and the assumptions required are discussed later. The other variables required by the fitting routines were the equilibrium concentrations B and F themselves, which were derived from the radioactivity concentrations in striatum S(t) and cerebellum C(t) averaged over the final 30 minutes of the study, and the specific radioactivity values (SA) at the time of injection. B was estimated as (S - C)/SA and F as C/SA, where S and C represent the time averages in striatum and cerebellum, respectively. The units for S, C, and SA were chosen to give the B and F variables the unit picomoles per milliliter.
Parameter optimization
Derivations of the values for the variables (B/F)g, B, and F used in this section are described in the previous section. Four different optimization methods were applied to the data. All four methods are based on the relation between the equilibrium concentration of bound ligand B and the concentration of free ligand with which it is equilibrated:
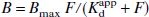
The parameter Bmax represents the total concentration of receptors in the specific tissue, and Kdapp is the apparent dissociation constant between those receptors and the raclopride test ligand. Three of the four fitting formulations do not evaluate these two parameters, but rather their ratio, the binding potential BP = Bmax/Kdapp, and Kdapp. Both the interpretation of Kdapp and the rationale for evaluating the BP and Kdapp rather than Bmax and Kdapp are given in Discussion. The same three methods use the equilibrium ratio (B/F)g derived from the Logan graphical method as described previously. Two of the methods are optimizations of linearizations of Eq. 1 and the parameters are evaluated by conventional least-squares optimization. The other two are nonlinear optimizations, performed using the nonlinear optimization routines available in the Prism data analysis system (GraphPad, Inc., San Diego, CA, U.S.A.). Because the sets of ordered pairs that were fitted in all the fitting approaches were derived identically from studies with nearly identical numbers of recorded counts, the fits in all cases are unweighted.
The first linear method (L1) is expressed as
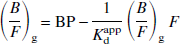
Thus, plots of (B/F)g versus (B/F)gF are fitted with a straight line; the y-intercept is the BP and the slope is the negative inverse of the apparent dissociation constant Kdapp. The second linear method (L2) is expressed as
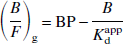
L2 is identical to L1, except for the use of B rather than (B/F)g F as the estimate of the bound ligand concentration. The first nonlinear optimization (N1) is expressed as
Pairs of (B/F)g and F values are fitted, again with the BP and apparent dissociation constant as optimized parameters. Finally, the second nonlinear approach (N2) is the fitting of the direct plot (Eq. 1) itself. Pairs of B and F values are fitted, with Bmax and Kdapp as the optimized parameters.
A fifth analysis was also performed on all the data sets, to investigate the possibility that the high antagonist concentrations induced changes in the apparent Kdapp. In this analysis, data from pairs of SA values were combined in “two-point Scatchard analyses.” If B1 and (B/F)g1 are the values derived at SA1 and B2 and (B/F)g2 are the values derived at SA2, then
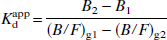
If SA1 is always the high SA point, then each multiple-concentration study yields a sequence of two or three two-point evaluations of Kdapp. The resulting values were evaluated for the presence of significant trends as SA decreased.
The parameter optimizations were performed on the points from the three SA values (high, mid-low, and low) that were common to all animals, for the sake of uniformity. Nine data sets were reanalyzed (method N1 only), with an additional point added to create four-point studies. In five cases the additional point was at mid-high SA (80–100 Ci/mmol), and in four cases at extremely low SA (3–6 Ci/mmol). This comparison provided both additional support for the constancy of the Kdapp value as SA was varied and information about the adequacy of three-point studies.
RESULTS
Confirmation of time-course constancy and Logan plot linearity
Examination of the time-activity curves showed that constancy was reached in both specific (striatum) and nonspecific (cerebellum) tissues by 25 minutes after injection in both normal and lesioned animals, and at all SA values (Fig. 1). Regression analysis showed that none of the nearly 100 time-activity curves analyzed in this study had a slope that was significantly different from zero. Furthermore, there was little evidence in the time-course data for increased variability at the end of the study, despite the more than twofold loss of true radioactivity levels over the fitted period. Similarly, the Logan plots were linear over the fitted range at all SA values in both normal and lesioned animals (Fig. 2).
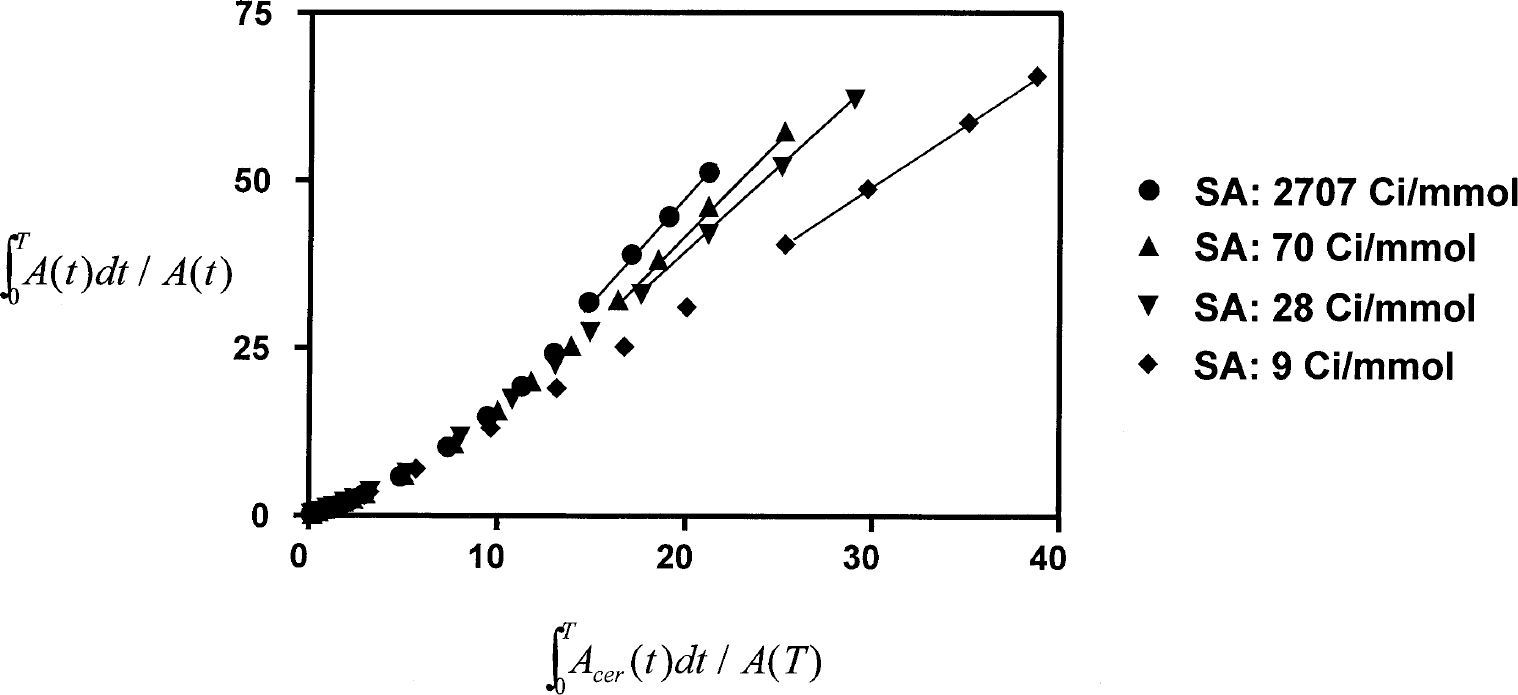
Plots from the application of the tissue-input graphical estimation of distribution volume ratios to the data shown in Fig. 1. Linearity was consistently observed over the last four frames at all specific radioactivities in both normal and lesioned striatum. SA, specific activity.
Parameter optimization
Figure 3 shows fits of a single characteristic data set using all four optimization approaches. The data consistently showed remarkable adherence to the theoretical assumption of specific binding to a single population of receptors, with maximum concentration and affinity independent of ligand concentration, as this ligand concentration was varied nearly 1,000-fold.
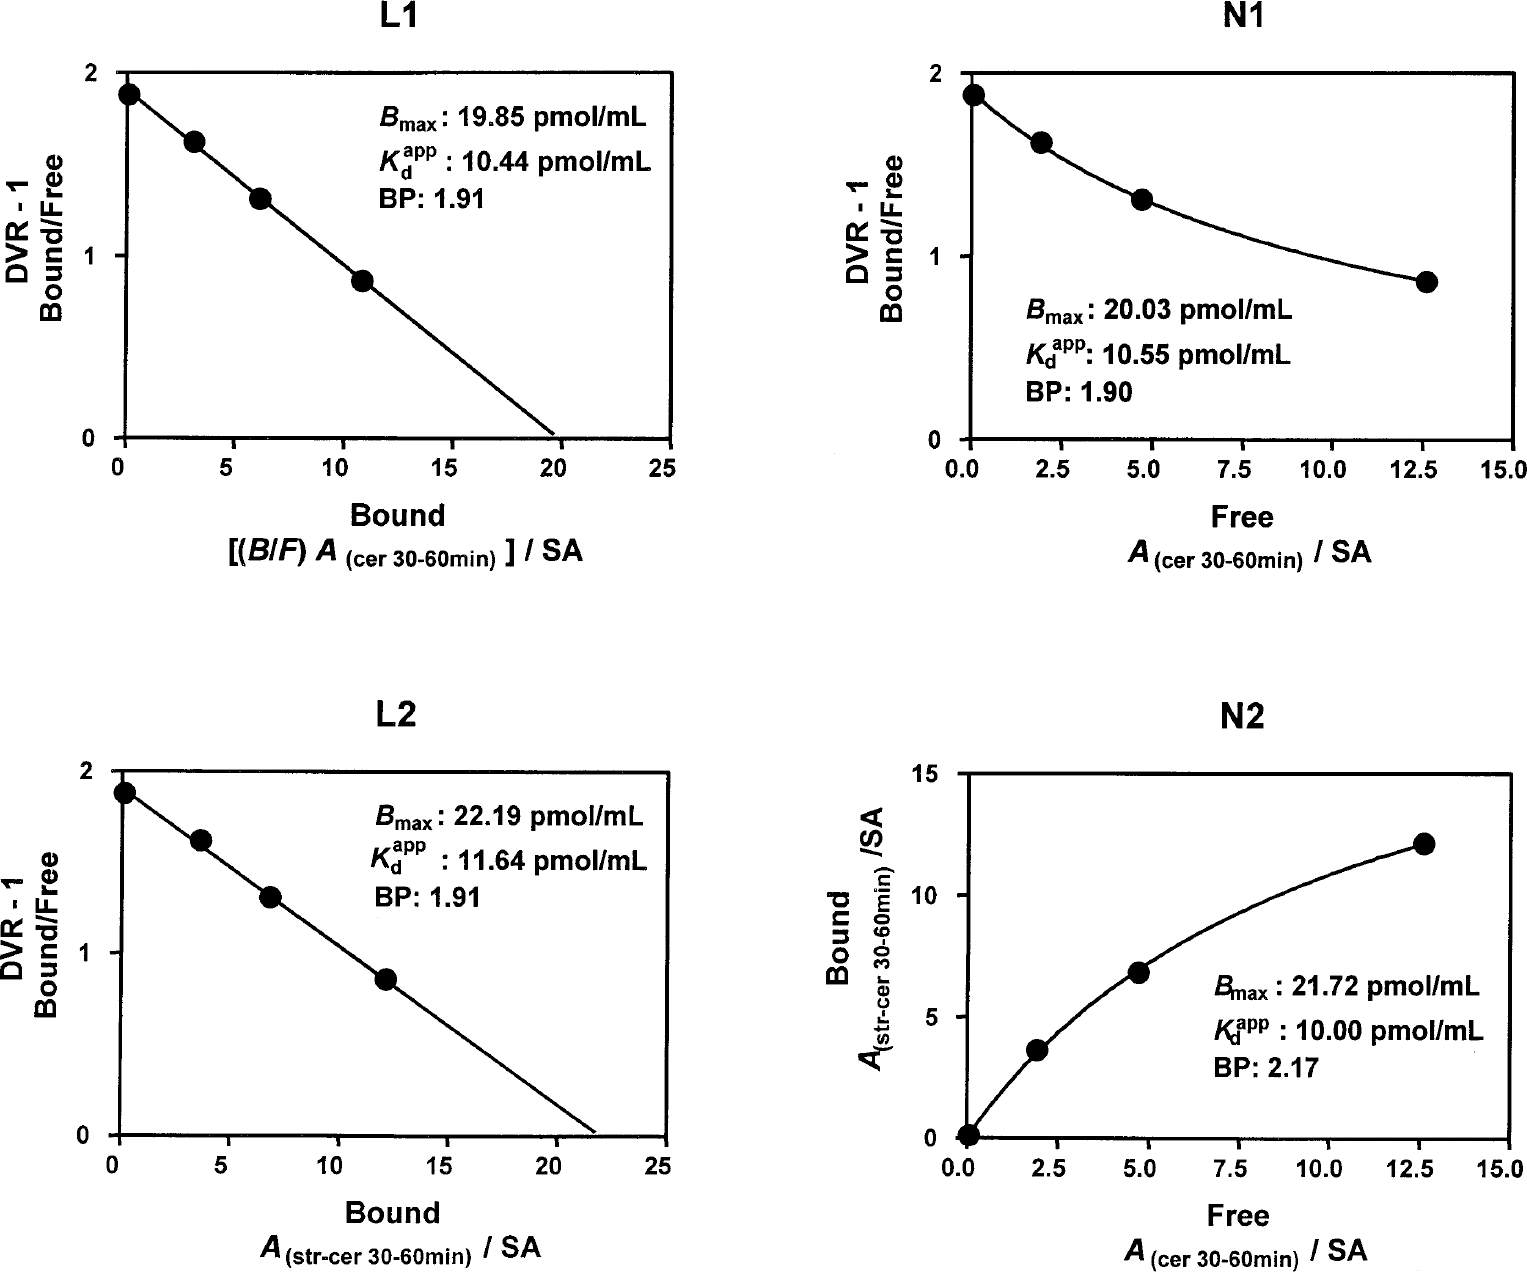
Example fits from the application of the four distinct parameter optimization approaches to a single representative four-point data set. The solid curves are the model predictions of the four respective equations with the model parameters set to the optimized values shown. SA, specific activity.
Values of BP, Bmax, and Kdapp from all four fitting methods in left and right total striatum of both normal and lesioned animals are presented in Table 1. All fits were of the three standard SA points that were common to all animals. Values are presented as means and standard deviations calculated within the normal (n = 8) and lesioned (n = 6) groups.
Means and SD of all 3 endpoints and all 4 parameter optimization methods in the normal control (Norm) and MPTP-lesioned groups (MPTP)
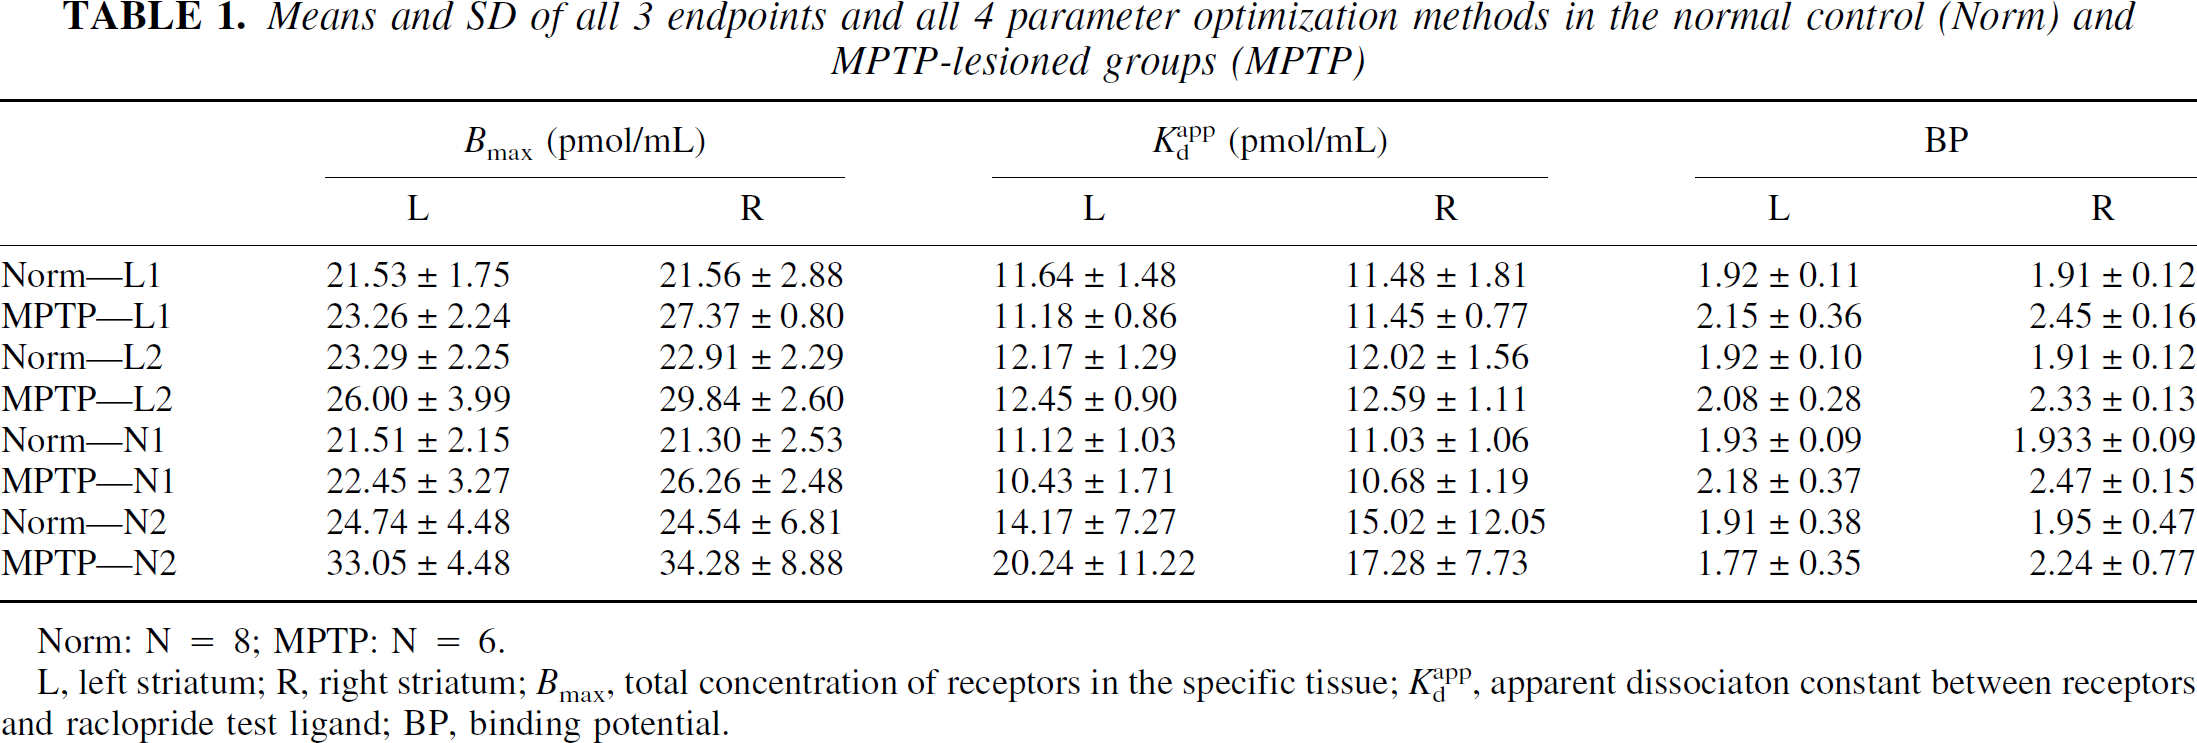
Norm: N = 8; MPTP: N = 6.
L, left striatum; R, right striatum; Bmax, total concentration of receptors in the specific tissue; Kdapp, apparent dissociaton constant between receptors and raclopride test ligand; BP, binding potential.
Comparison of lesioned with normal striatum
Group differences between normal and lesioned animals were evaluated for each method using conventional unpaired t-tests. The results are presented as P values, without correction for multiple comparisons, in Table 2. The P values were left uncorrected in order to convey the significances of the group differences in the most general way. When a particular method is selected and applied in a new experimental context, these probabilities would be multiplied by three. Note that all of the significant P values from the first three methods (L1, L2, and N1) remain significant at the 5% level even after correction for 12 simultaneous comparisons.
Significance of the differences between group means of the normal and unilaterally lesioned groups expressed as P values from two-tailed t-tests, before correction for multiple comparisons
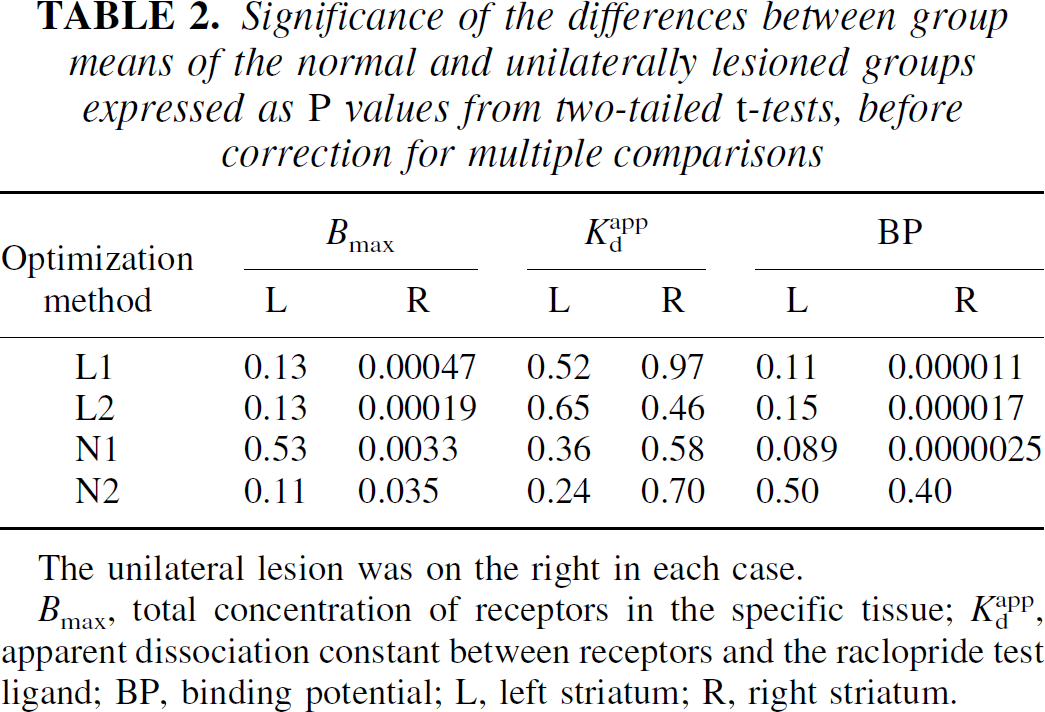
The unilateral lesion was on the right in each case.
Bmax, total concentration of receptors in the specific tissue; Kdapp, apparent dissociation constant between receptors and the raclopride test ligand; BP, binding potential; L, left striatum; R, right striatum.
Dependence of Kdapp on specific activity
Two different analyses were performed. In the first, all of the two-point Kdapp values were divided among four groups: those with SA2 values between 50 and 100 Ci/mmol, between 20 and 50 Ci/mmol, between 8 and 20 Ci/mmol, and less than 8 Ci/mmol. The means and standard deviations of the Kdapp values for the four groups were 11.3 ± 2.9, 11.0 ± 2.1, 10.8 ± 1.3, and 13.6 ± 1.3 pmol/mL, in order of decreasing SA. Comparisons among pairs of groups using two-tailed paired t-tests showed no significant differences among them. In the second analysis, the values from the nine animals with four SA values were analyzed using ANOVA to test for the significance of study order as a source of variance. Although the mean Kdapp values did indeed increase with study order (9.778, 11.62, and 11.97 pmol/mL for the second, third, and fourth studies, respectively), this trend did not reach significance.
Comparison of three- and four-point analyses
The comparison of values of Bmax and Kdapp derived using method N1, first with the standard three-point data sets and then with one additional point, is shown in Fig. 4. The best-fit regression lines are indistinguishable from lines of identity. A highly significant high degree of correlation was observed in both cases.
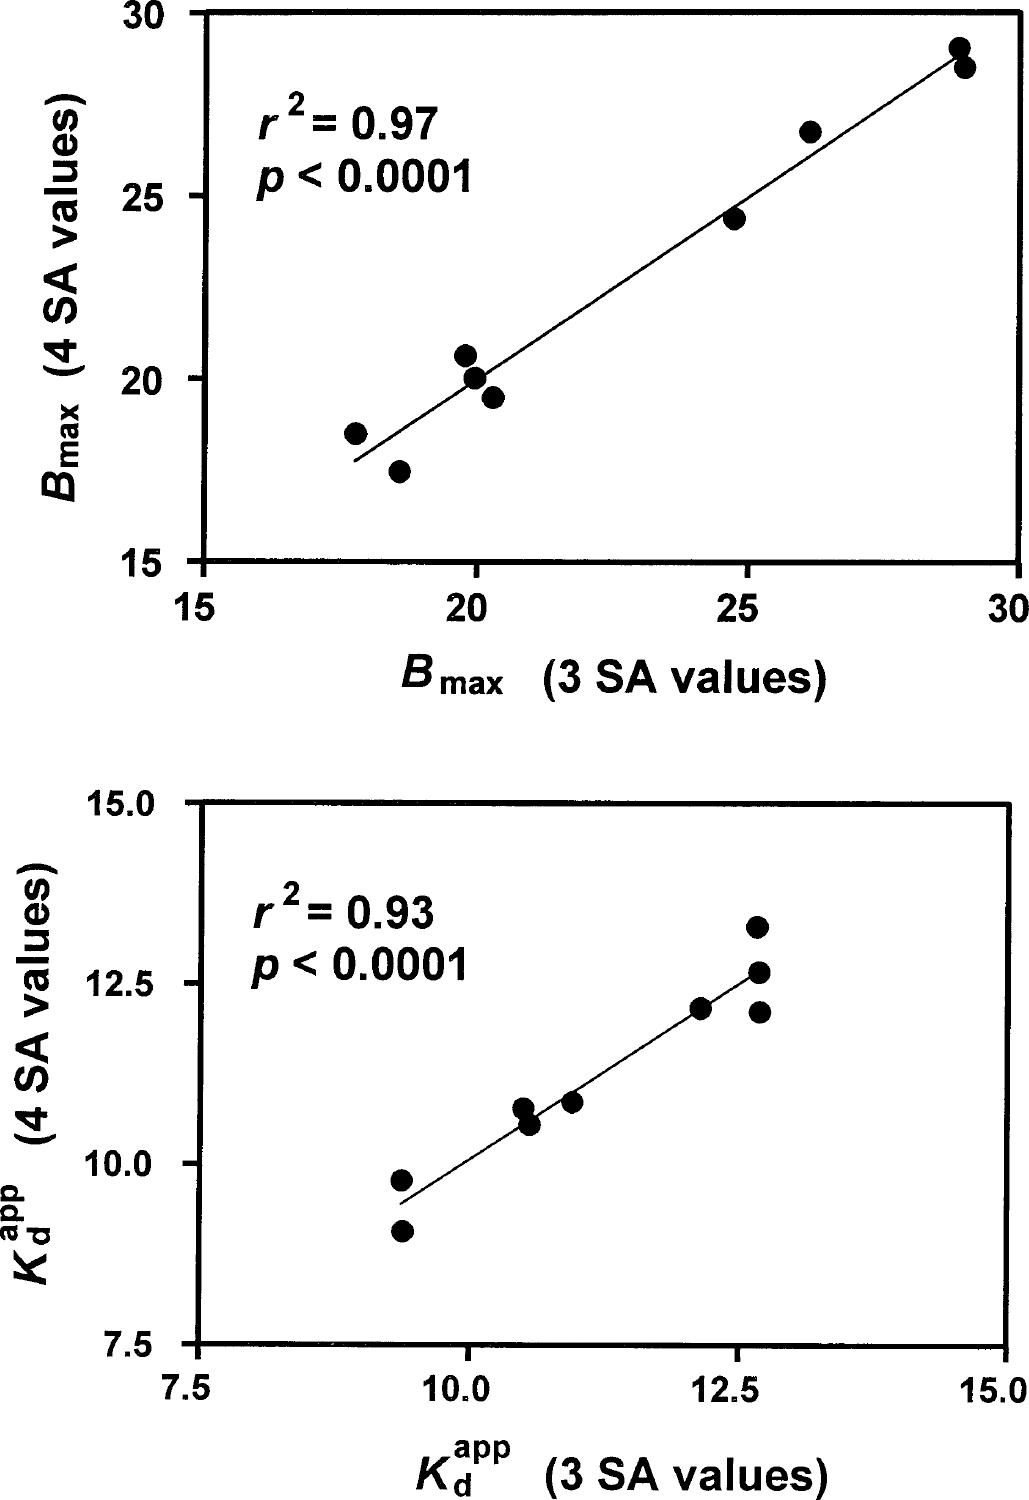
Comparison of the application of optimization method N1 to four-point data sets and to the same data sets with one point suppressed. SA, specific activity.
DISCUSSION
Our approach is one of many possible approaches to resolving the density-affinity ambiguity by the use of multiple ligand concentrations. The two main features of our design are the avoidance of blood sampling, and the attempt by infusion administration to attain true equilibrium between the bound and free components for the longest possible period, within the study duration constraints set by radioactive decay. A secondary consideration was the optimal estimation of the equilibrium ratio of bound and free concentrations for those fitting methods that require this ratio. We chose to estimate this ratio using the Logan graphical method for reversible ligands; however, this choice is not a defining feature of our approach.
Both the use of equilibrium and the absence of blood samples distinguish our approach from that of Delforge et al., (1995, 1999), which involves both the injection and coinjection with tracer of boluses of cold ligand following an initial tracer bolus. This approach potentially offers information not available from equilibrium methods, primarily additional insight into the many independent determinants of the apparent dissociation constant Kdapp. Our plans to make MLCRA one of the primary tools in our ongoing studies of receptor systems, however, motivated our decision to forgo the additional information available in return for technical simplicity and model independence.
Finally, our approach is most similar to the method of Farde and coworkers based on transient equilibrium between the bound and free components (Farde et al., 1989; Ito et al., 1998). In that method, values of B/F and B are derived from the tissue time courses at the peak of the bound component at two or more SA values and fitted with an optimization method identical to our L2. The substantive difference between this and our approach is our use of infusion administration and the Logan graphical method, which allow the B/F estimate to be derived from the maximum possible amount of the measured data.
Parameter optimization: general considerations
When the linearization of protein binding data was first suggested by Scatchard (1949), this was the only option available to most investigators. The simplex and Marquardt algorithms for nonlinear optimization, currently the standards in the field, had not yet been introduced. It was recognized even then, however, that the propagation of measurement error into parameter error is dependent on the model formulation that describes the relation between the measured data and the fitted parameters. Given the wide availability of nonlinear optimization, the nonlinear optimization of the direct plot (Eq. 1) has been suggested as a means of making the two sides of the optimization equation completely independent. Unfortunately, this independence is not attainable in in vivo PET MLCRA based on the equilibrium approach. Of our four fitting methods, method N2 (Eq. 1) comes closest to the desired independence. However, even in this case, the fitted variables B and F are not independent, as both depend linearly on the measured time course in the reference tissue. The other three fitting methods (Eqs. 2–4) vary in the additional lack of independence of the two sides of the optimization equation. Two of them (L1 and N1) differ only in this regard.
All of the methods share the assumption that the bound component can be estimated as the difference between the total concentration in the target tissue of interest and the concentration in the reference tissue, in this case cerebellum. This assumption is reflected both in the estimation of B by such a subtraction (methods L2 and N2) and in the estimation of (B/F) as DVR – 1, where DVR is the distribution volume ratio derived from the Logan graphical method (methods L1, L2, and N1). In equilibrium approaches, this assumption requires only that the reference tissue distribution volume and the portion of the total distribution volume in the target tissue that is not specifically bound ligand be the same, without requiring that the subcomponents of nonspecifically bound ligand in the two tissues be identical.
Of the three endpoints Bmax, Kdapp, and BP, only two can be optimized simultaneously, as the third is constrained to be a simple combination of the other two. The three methods that use (B/F)g as one of the fitted variables also have in common that the BP is one of the fitted parameters. The fact that the B/F value at high SA is predicted to be equal to the BP within 1% makes the BP an obvious choice for one of the fitted parameters.
Parameter optimization: comparisons of the methods
L1 versus N1
These two methods optimize BP and Kdapp from ordered pairs of (B/F)g and F. Despite their different appearances, L1 and N1 are essentially equivalent formulations, differing only in the role of the ratio (B/F)g, which could potentially alter the sensitivities of the estimated parameters to the experimental variation of this ratio. Despite this possibility, the group mean outcomes from methods L1 and N1 were very similar (Table 1). Paired t-tests over all 14 subjects confirmed the absence of significant differences for any of the three endpoints.
L1 versus L2
L2 is similar to L1 and N1, differing only in that the same parameters BP and Kdapp are now optimized from ordered pairs of (B/F)g and B. Paired t-tests showed no significant difference between the BP values derived by L1 and L2. Estimates of both Bmax and Kdapp, however, were slightly but significantly higher for L2 in comparison to those from L1 (Table 1). Inspection of the equations and the nature of the propagation of errors suggest that the value B was slightly but consistently higher than the value (B/F)gF. This difference is discussed further in the discussion of the Logan method.
N2 versus other methods
N2 is different from the other methods both in the data fitted and the parameters evaluated; Bmax and Kdapp are optimized from ordered pairs of B and F. This method offers the greatest independence of the two sides of the optimization equation. In all other respects, however, it is inferior to the other methods. The other methods, with (B/F)g as one of the fitting variables and BP as one of the fitted parameters, take full advantage of the fact that the data from the high SA study by themselves provide a precise estimate of the BP. The remaining data points then serve to evaluate Kdapp, with only minimal correlation between the two fitted parameters. In the direct plot, the data from the high SA study essentially lie at the origin, and unless the fit is constrained to pass through the origin, the relation between this point and the BP contributes almost nothing to the fitting process. The remaining two or three data points, with typical maximum saturation values of 65% (low SA), are poorly conditioned for the evaluation of Bmax and Kdapp. Figure 3 gives a clear sense how the measured data fail to specify the value of Bmax with precision in method N2. Furthermore, the high degree of correlation between the two fitted parameters assures that this lack of precision is propagated into a similar imprecision for Kdapp. The results in Table 1 show the group standard deviations for method N2 for all three endpoints to be many times larger than those from the other methods.
Summary
The results clearly demonstrated the superiority of the three methods that include (B/F) as one of the fitted data sets, and BP as one of the fitted parameters, over the one that does not. Interestingly, quantitative measures of quality of fit did not distinguish among the methods. Residual discrepancies were comparably small and without trend in all cases. In contrast, the methods differed significantly in the degree of correlation between the two fitted parameters, evaluated from the correlation matrix produced during the fitting process. Method N2 was again the worst case, with correlation values close to unity. The two linear methods (L1 and L2) had very similar degrees of correlation, with values averaging 0.7. Finally, for method N1 the correlation is reduced even further, to an average of about 0.55. These combined results would suggest N1 as the method of choice, except that the results from N1 were statistically indistinguishable from those from L1. Both N1 and L1 have the further favorable property of not requiring the evaluation of the concentration B.
Comparison of lesioned with normal striatum
The P values presented in Table 2 show that fitting approaches L1, L2, and N1 were similar in the confirmation of a significant increase in both Bmax and BP in the lesioned group in comparison to the normal group, and the lack of a significant change in Kdapp. In contrast, method N2 showed only a trend to significance in the change of Bmax (recall that the P values are uncorrected), and no apparent difference in the BP. Comparison of this particular P value (P = 0.4) with those from the other three methods provides a dramatic demonstration of the insensitivity of the direct plot to the BP when the maximum saturation levels are limited.
Interpretation of the effective dissociation constant Kdapp
The superscript app (apparent) on this dissociation constant signifies the several differences between binding assay experiments in vivo with PET and in vitro experiments performed under idealized conditions. In in vitro binding assays, the concentration of receptors is assumed to be directly available to the binding ligand, with binding limited only by the diffusion of ligand through the aqueous solvent. Second, the aqueous concentration of ligand in a given tube and the concentration of free ligand available for binding are assumed to be the same, in the limit of dilute protein concentrations. Finally, every attempt is made to free the preparation of all competing ligands. In vivo binding assays using PET deviate from this ideal situation in at least three ways. Several authors have suggested the concept of reaction volume to bring the in vitro and in vivo data into accord (Delforge et al., 1996; Vera et al., 1986). Each PET ROI is associated with an apparent reaction volume (Vr, milliliters solvent/milliliters tissue) that reflects the differences in receptor environment in the in vitro and in vivo situations. Second, only a fraction (conventionally denoted f2) (Mintun et al., 1984) of the ligand in the ROI that is not specifically bound can be regarded as dissolved in tissue water and limited only by diffusion; the remainder is taken to be weakly bound to nonspecific protein binding sites. Finally, in in vivo studies the test ligand necessarily competes for binding sites with the endogenous ligand. Thus,
where Kd is the ligand-receptor dissociation constant evaluated under idealized conditions and Vr and f2 are as defined previously. The term in brackets reflects the apparent increase in the dissociation constant in the event that competing endogenous ligand is present at concentrations L that are comparable to its own dissociation constant KL for the same binding sites.
Clearly, the analysis of the in vivo data in terms of an apparent dissociation constant implies the assumption that all of the elements on the right side of Eq. 6 remain constant at all ligand concentrations.
Search for specific activity-induced trends in Kdapp
The results of the two-point estimations of Kdapp, the consistently striking agreement between the model fits and the measured data (Fig. 3), and the comparison of three- and four-point evaluations (Fig. 4), all strongly support the effective constancy of the apparent dissociation constant even as the antagonist concentration is varied by a factor of 1,000. These results, however, do not definitively exclude any change in Kdapp, but only confirm that it was sufficiently independent of SA to allow valid parameter estimation. Because of the degree of intragroup variation and the small number of cases in some categories, the t-tests used to compare the two-point Kdapp estimates had a power of only 0.7 for the detection of change. Furthermore, the highest fractional receptor occupancy attained in this study was 70%, and most maximum occupancies were about 60%. It is certainly possible that higher receptor occupancies, whether induced by the use of bolus rather than infusion administration of the antagonist (Walters et al., 1990) or by even lower SA values, may indeed induce a dopamine release sufficient to change the dissociation constant value to a degree that would invalidate the fitting methods reported here.
Comparison of three- and four-point fits
The agreement between three- and four-point fits for both Bmax and Kdapp implies that the fourth data point fell on or very near the theoretical curves from the three-point fits. This result provides secondary support for the independence of Kdapp from the SA, as noted in the previous subsection, and furthermore endorses the adequacy of three points in the routine application of our approach, once the constancy of Kdapp has been established in a particular experimental context.
The use of the tissue-input Logan plot to determine B/F
The results clearly demonstrate the advantages of rearranging the direct plot such that the ratio B/F is one of the fitted data sets and BP is one of the optimized parameters. We have chosen to use the Logan graphical method for reversible tracers to evaluate the ratio B/F from the measured data, but this is not a defining feature of our approach. The constancy of the measured time courses (Fig. 1) in both target and reference tissues would support the alternative of subtracting the mean concentration in cerebellum from that in striatum, and dividing the difference by the concentration in cerebellum. This approach, however, requires true equilibrium, whereas the Logan method requires only the less stringent steady-state condition. The use of the Logan method allows us to avoid making case-by-case decisions in the event that a measured time course is not adequately constant over time.
Comparison of the fitted parameter values from the two linear fitting methods, L1 and L2, indicates that (B/F)g is consistently several percentage points smaller than the same ratio derived from the time-course means. This may be an example of the inherent noise-dependent bias of the graphical method identified by Slifstein and Laruelle (2000). Although their treatment dealt with the properties of the method using a plasma input function, the noise propagation properties of the DVR estimation used in our method would be expected to be identical. The bias in the fitted slope values was shown to be strongly dependent on both noise level and the slope value itself, with larger slopes suffering a disproportionately larger underestimation. The tracer dose, bolus and infusion administration, study duration, and frame durations used in our method all contribute to the very favorable noise levels in our time-course data (Fig. 1). Since the slope (DVR) values encountered in the present study ranged between 2 and 3, the treatment cited previously would predict the bias to be very small. The data shown in Fig. 1 indicate further that the dependence of the noise on SA is minor. Whatever small increase in noise levels is encountered as SA decreases is offset by the corresponding decrease in the true slope value. Clearly, however, the use of the graphical method would have to be reconsidered in studies of ligands with large DVR values.
Future applications with pharmacologic interventions
The search for systematic trends in the Kdapp values as SA decreases is one example of the kinds of considerations that must be attended to in in vivo MLCRA, arising from the fact that the receptors are part of an intact, neurochemically responsive system. In a similar way, the potentially transient nature of the effects of acute pharmacologic interventions must be considered. The application of MLCRA to the study of long-term drug treatment would be expected to be similar to the case reported here of the effects of MPTP lesions, in that the multiple SA values could be studied back to back on the same day. It is our opinion, however, that its application to acute pharmacologic interventions must deal with the small likelihood that the drug effect would remain stable over the 5 hours required even for a three-point study. For this reason, in our ongoing applications of MLCRA to the study of acute drug interventions, we are performing the studies with different SA values on different days so that the time relation between acute drug treatment and tracer administration is fixed as SA is varied.
CONCLUSIONS
The use of multiple ligand concentrations in in vivo PET receptor assays allows the ligand-receptor BP to be resolved into its component parts: the total concentration of receptors and the apparent dissociation constant that represents ligand-receptor affinity. We have investigated the properties and performance of an equilibrium approach to MLCRA.
Investigation of several reformulations of the relation between the bound and free concentrations at equilibrium showed the benefits of having the equilibrium ratio B/F as one of the fitted data sets and the BP as one of the optimized parameters, as these are predicted to be equal in the limit of high SA. We think that the small risk of inappropriate propagation of measurement error into parameter error is more than compensated for by the robustness of the fits and the decreased correlation between the fitted parameters. Test ligand administration by bolus followed by infusion and the use of the tissue-input Logan graphical method allowed the ratio B/F to be evaluated from a maximum amount of the measured data with a minimum of prior assumptions.
The evaluation of receptor density and ligand-receptor affinity from the relation between bound and free concentrations at multiple ligand concentrations clearly requires the assumption that these are constant over the course of the study. Our data provided a variety of both direct and inferential evidence that the apparent dissociation constant, which represents the affinity between raclopride and D2-like receptors in in vivo PET studies, is independent of cold ligand concentration.
We applied our approach to investigating the increase in BP seen in striatum lesioned by MPTP in nonhuman primates. The increase was shown to be due entirely to increased receptor concentrations.
Our approach allows the distinction of concentration from affinity effects with a minimum of technical complexity and prior assumptions, and is a key component of our ongoing studies of acute and long-term drug treatments in the dopamine system.