
Abstract
The 5-HT1A ligands [F]FPWAY and [18F]FCWAY are metabolized in vivo to [18F]fluorobenzoic acid (FB) and [18F]fluorocyclohexanecarboxylic acid (FC), respectively. To quantify the penetration of these acids into the brain, dynamic positron emission tomography studies were performed in rhesus monkeys with [18F]FB and [18F]FC. High-performance liquid chromatography analysis of arterial blood samples showed no metabolites for [18F]FB, whereas [18F]FC was rapidly metabolized to [18F]fluoride. A model with one tissue compartment and vascular radioactivity was used to analyze gray matter time-activity curves. For [18F]FC, an additional term was added to account for [18F]fluoride skull spillover into the brain; this term accounted for 70% to 90% of the measured radioactivity concentration at 90 minutes. For [18F]FB, mean gray matter parameters were as follows: K1, 10 ± 3 μL · min−1 · mL−1; distribution volume V, 0.052 ± 0.006 (mL/mL). For [18F]FC, the values were as follows: K1, 15 ± 4 μL · min−1 · mL−1; V, 0.29 ± 0.06 mL/mL. The V values were consistent with a physiologic model that included brain-to-blood pH difference and the plasma free fraction of the acid. Simulations based on [18F]FCWAY human data showed that [18F]FC uptake produces significant biases in V estimates in regions with low specific binding. These results can be used to correct the tissue [18F]FCWAY time-activity data for brain uptake of [18F]FC using the measured [18F]FC input function.
A wide variety of quantitative methods have been devised to estimate receptor-binding parameters from positron emission tomography (PET) brain studies. These methods typically assume that radioactivity in the brain is in the form of free, nonspecifically bound, or specifically bound parent tracer, and that no radioactive metabolites cross the blood—brain barrier (BBB). Many of these methods also depend heavily on measurements in a reference region with little or no specific binding to obtain estimates of binding potential (Mintun et al., 1984), the equilibrium ratio of bound to free tracer. For example, the cerebellum is used as such a region for the D2 ligand [11C]raclopride (Farde et al., 1989) and the 5-HT1A ligand [11C]WAY 100635 (Gunn et al., 1998). The reference region data are applied in a variety of mathematical approaches to account for the nonspecifically bound tracer in the region of interest. These data are sometimes used as a normalization term, in which case the binding potential is an estimate of the equilibrium ratio of bound tracer to free plus nonspecifically bound tracer.
If radioactive metabolites do enter the brain and no corrections are applied, the PET tissue measurements will overestimate the parent activity. Even if metabolite uptake is low, a large percentage error in the reference region concentration data may occur, particularly if the uptake of parent tracer in this region is low. The case of interest that motivates this study is that of the 5-HT1A antagonist WAY 100635 and its 11C- and 18 F-labeled analogs. For the tracer [11C]WAY 100635, Osman et al. (1998) showed that the metabolite [11C]cyclohexane-carboxylic acid is produced. Separate PET studies of this radiolabeled acid showed that it did cross the BBB (Carson et al., 1997; Osman et al., 1998). Subsequently, we have developed fluorinated analogs including [18F]FCWAY (Carson et al., 2000b; Lang et al., 1999b) with the 18 F label at the trans 4 position of the cyclohexane ring and with comparable 5-HT1A affinity to [11C]WAY 100635. As with the 11C compound, the acid metabolite [18F]fluorocyclohexanecarboxylic acid (FC) was found in blood of both monkeys (Carson et al., 2000b) and humans (Carson et al., 2000a), as well as [18F]-fluoride. Subsequently, another 18 F analog, [18F]FPWAY, with lower 5-HT1A affinity than [11C]WAY 100635, was developed with pyrimidine and 4-fluorobenzene moieties replacing the pyridine and cyclohexane, respectively, and previously named FBWAY (1,3 N) (Lang et al., 1999a, 2000). [18F]FPWAY is also metabolized in vivo to [18F]fluorobenzoic acid (FB) (Carson et al., 2001). For all of these analogs, the cerebellum, a potential reference region owing to its low 5-HT1A receptor density, has very low radioactivity levels, so the evaluation of the potential uptake of a metabolite and its impact on receptor quantification is required.
Acid—base balance affects the uptake of radiolabeled acids into the brain, since the labeled tracer exists in both acid and base forms in blood and brain. This effect was used to develop a physiologic model for the measurement of local brain pH using PET and [11C]CO2 (Brooks et al., 1984; Buxton et al., 1984). The theory behind this radiolabeled acid suggested that arterial and brain pH and acid pK would be the physiologic driving forces for the acid's equilibrium tissue-to-blood ratio (i.e., its distribution volume).
In this study, PET scans were performed in rhesus monkeys with the 18 F-labeled acids [18F]FB and [18F]FC to determine: (1) whether these acid metabolites cross the BBB; (2) whether a compartment model based on the model for [11C]CO2 can a be devised to describe the brain uptake of these acids in terms of tissue and blood pH; (3) what bias in receptor parameter quantification is produced by the uptake of the acid metabolites in studies of the 5-HT1A ligands ([18F]FPWAY and [18F]FCWAY); and (4) whether a practical algorithm that can correct for acid metabolites in tissue can be devised and applied to human studies.
MATERIALS AND METHODS
Theory
The distribution volume (V) of a radiotracer is defined as the equilibrium concentration ratio between tissue and plasma. In cases where the tracer in plasma can be either free or bound to proteins, with free fraction f1, V can be expressed as follows:
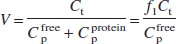
where the t and p subscripts correspond to tissue and plasma, respectively. For radiolabeled acids such as [11C]CO2 (Brooks et al., 1984; Buxton et al., 1984), the tracer is present in its charged and uncharged forms in the blood and brain, with the acid—base balance determined by the difference between the local pH and the acid's pK:
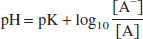
where A and A− represent the uncharged and charged moieties, respectively. Assuming that the uncharged moiety can cross the BBB and reach equilibrium, inserting Eq. 2 into Eq. 1 yields the following equation:
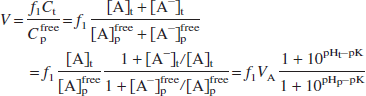
where VA is the equilibrium concentration ratio of the uncharged moiety between tissue and plasma water. For a typical blood pH of 7.4 and brain pH of 7.0 (Guyton, 1976; Siesjo, 1985), the equilibrium distribution volume for [11C]CO2 is 0.43, assuming that pK = 6.12 (Buxton et al., 1984) and f1VA = 1.0. The presence of pHt in Eq. 3 is the basis for the use of [11C]CO2 as a tracer for tissue pH. For stronger acids, however, such as fluorobenzoic acid and cyclohexanecarboxylic acid, with respective pK values of 4.16 and 4.90 (Lide, 1996; Ludwig et al., 1986), the concentration ratio of charged to uncharged moieties is greater than 100:1, and Eq. 3 can be approximated as follows:
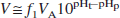
and the value of pK has an insignificant effect on V. Our a priori hypothesis is that radiolabeled acids should behave in this manner with distribution volume consistent with Eq. 4.
Radiosynthesis
The synthesis and characterization of [18F]FB and [18F]FC are described by Lang et al. (1999b) as part of the synthetic process for the fluorinated analogs of WAY 100635, [18F]-FPWAY and [18F]FCWAY, respectively.
Positron emission tomography procedure
Fasted male rhesus monkeys weighing ∼10 kg were initially anesthetized with ketamine (10 mg/kg intramuscularly) to permit endotracheal intubation and insertion of an intravenous line in a distal lower extremity. The animals were then transported to the PET suite, anesthetized with isoflurane (1% to 2%), and positioned on the scanning table. The head was placed in a stereotactic head holder so that coronal images were acquired. Blood pressure, respiratory rate, ECG, temperature, and end-tidal PCO2 were monitored continuously. These studies were performed under a protocol approved by the NIH Clinical Center Animal Care and Use Committee.
Studies were performed with [18F]FB (n = 3) and [18F]FC (n = 4). Scans were performed on the GE Advance tomograph with reconstructed emission images including corrections for attenuation (transmission scan), scatter, randoms, dead time, and calibration in nCi/mL. After the transmission scan, 2 or 3 injections of 4 mCi of [15O]water were performed at 10-minute intervals. One-minute scans were acquired after each injection, and images were reconstructed, averaged, and used for placement of regions of interest (ROIs).
Dynamic PET studies were performed with [18F]FB (7 to 9 mCi) and [18F]FC (3 to 8 mCi) with injection of radiotracer over a 1-minute period. Two hours of dynamic scans were acquired in each case. Scans for [18F]FB were acquired in three-dimensional (3D) mode (n = 3), whereas scans for [18F]FC were acquired in two (n = 3) and three dimensions (n = 1). To compare two-dimensional (2D) and 3D data, 3D scan frames were interleaved during data acquisition in two of the 2D studies at the rate of one 2-minute scan per 10-minute period from 10 to 120 minutes after injection. Gray and white matter ROIs were placed visually on the [15O]water images and time—activity curves (TACs) were generated for the acid studies.
Input functions
Arterial input functions were measured both for [18F]FB and [18F]FC. Arterial samples were collected via a permanent arterial access port implanted subcutaneously at the hip. Approximately 30 samples were acquired for each study. The radioactivity concentration values in whole blood and plasma were measured in a calibrated γ counter.
For [18F]FB, the parent fraction of radioactivity was assessed by high-performance liquid chromatography (HPLC) from samples taken at 5, 20, 40, and 120 minutes after injection. In addition, a reference blood sample taken before the injection to which ∼5 μCi of [18F]FB was added was used to assess the efficiency of this metabolite procedure. First, 0.3 mL plasma, 60 μL unlabeled FB, and 0.3 mL acetonitrile were mixed, vortexed for >15 seconds, and centrifuged at 23,000g for 2 minutes. The acetonitrile separation efficiency was 92% ± 1% and did not change with time. HPLC studies were performed with a HP series 1100 HPLC system (Agilent Technologies Company, Palo Alto, CA, U.S.A.). HPLC used a YMC-Pack Pro C18 reversed-phase column (3μ, 150 × 4.6 mm I.D., YMC Inc., c/o Waters, Milford, MA, U.S.A.), eluted with 50 mmol/L ammonium acetate and acetonitrile at a 0.5-mL/min flow rate and a gradient of 0% to 65% acetonitrile over 10 minutes followed by isocratic elution at 65% acetonitrile for an additional 2 minutes. An aliquot of 50 μL of the supernatant from the plasma acetonitrile extraction was injected onto the column. The entire column eluent was collected by a fraction collector (Gilson, Model 203) (36 samples at 20 sec/sample) and samples were counted in a γ counter for 2 minutes each. Radioactivity recovery from HPLC was 100% ± 3%. The HPLC data showed one peak for all samples, consistent with [18F]FB.
For [18F]FC, the parent fraction of radioactivity was assessed by thin-layer chromatography (TLC) after extraction with acetonitrile from samples taken at 3, 8, 15, 30, 60, and 120 minutes after injection as well as from a reference blood sample. Thin-layer chromatography was used instead of HPLC because a larger number of samples could be analyzed, providing better definition of the parent fraction curve. A 40-μL sample of the supernatant was placed on a Whatman LK6DF silica gel plate and developed using a solvent mixture of 1-propanol, ammonium hydroxide, and acetonitrile (50:30:20). The TLC plate was placed on a phosphor imaging plate overnight and radioactivity was measured with a Fuji BAS-1500 Phosphorimager. The TLC data showed the presence of two peaks for all samples excluding the reference, with the nonparent peak consistent with [18F]fluoride (Carson et al., 2000b). These data were analyzed to determine the fraction of parent compound in the acetonitrile supernatant and were then corrected for the time-varying reduction in acetonitrile extraction efficiency, which dropped from ∼90% for the reference sample to ∼40% at 120 minutes owing to reduced extraction of the [18F]fluoride. After normalization to an initial value of 1.0, the parent fractions were fitted to a two-exponential function.
For both [18F]FB and [18F]FC, the fraction of radioactivity unbound to plasma proteins (f1) was assessed by ultrafiltration (Carson et al., 1993) using the reference sample.
Data analysis
A model with one tissue compartment (1T) was chosen to fit the [18F]FB TACs. The parameters were the influx constant from plasma to brain tissue K1 (μL · min−1 · mL−1), the clearance from the brain to blood k2 (min−1), and the blood volume Vb (mL/mL). The tissue distribution volume V (mL/mL) was calculated from K1/k2. Because there were no metabolites in plasma for [18F]FB, the plasma radioactivity curve CPFB(t) was used as the input function, and the model equation is:

where ⨂ is the convolution operator and CbFB(t) is the whole-blood TAC.
For [18F]FC, one addition was made to Eq. 5. [18F]Fluoride, the radioactive metabolite produced after [18F]FC injection, rapidly accumulates in the skull. To account for [18F]fluoride spill-in to the brain TACs due to the partial volume effect (Hoffman et al., 1979), we assumed that there is a known true skull TAC (Cs(t)), and each region receives a fractional contribution s of this TAC:

where s is a dimensionless fraction, with higher values of s expected in regions closer to the skull. In this case, CPFB(t) is the metabolite-corrected [18F]FC plasma input function. Model Eq. 6 has four parameters (K1, k2, Vb, and s) and assumes that the shape of the radioactivity TAC in all skull regions is identical; differences in scale of the curve are corrected with the parameter s.
In the [18F]FC studies, the skull showed the highest activity in images obtained 60 to 120 minutes after injection. Thus, to estimate Cs(t), the peak activity in the summed image was determined, and skull pixels were defined as those having at least 95% of the peak value. The average TAC from these peak pixels (Cpeak(t)) was then obtained. This TAC was then fitted to a model with two tissue compartments (2T) and parameters K1F, k2F, and k3F (Cook et al., 2000; Hawkins et al., 1992); that is, a model with irreversible tracer uptake:
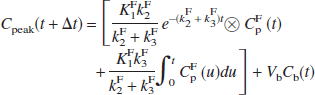
where CPF(t) is the [18F]fluoride input function (calculated from the difference between total plasma radioactivity and CPFC(t). Thus, the peak TAC was fit to Eq. 7 using five parameters: K1F, k2F, k3F, Vb, and At, the time delay between skull and plasma. Then, the ideal skull curve Cs(t) was taken as the term in square brackets in Eq. 7 and used in the fits of the [18F]FC TACs with Eq. 6.
Before fitting the [18F]FB and [18F]FC TACs, the delay between brain and plasma was determined by fitting a whole-brain TAC to the appropriate model (Eqs. 5 and 6, respectively) with the time delay as an additional parameter. This value was then fixed for the fitting of the ROI TACs. In all fits, data were weighted by the square of the inverse of the data standard deviation, determined from the product of the normalized standard deviation and the mean activity in the head. Normalized standard deviation was determined from the total scanner count rates for prompt and delayed coincidences (Pajevic et al., 1998).
All ROI TACs were analyzed with time durations of 120, 90, 60, and 30 minutes. The mean and SD across animals were calculated by region for the 120-minute fits. The percent difference of the parameter estimates from the shorter fits was calculated with respect to the 120-minute values.
Simulation of brain uptake of metabolites in human ligand studies
[18F]FB and [18F]FC are metabolic products that are created after the injection of 5-HT1A ligands [18F]FPWAY and [18F]FCWAY, respectively. Brain uptake of these acid metabolites will affect the ligand brain TACs and, if no correction is applied, introduce bias into parameter estimates such as the volume of distribution. Having modeled brain uptake of these acid metabolites, it is possible to predict the brain time course of these metabolites in the ligand studies with knowledge of the acid's input function and the regional kinetic parameters. Simulations were performed to calculate the bias in volume of distribution (V) and binding potential (BP = V(ROI)/V(cerebellum)-1) due to acid uptake in human studies.
Simulations for [18F]FPWAY and [18F]FCWAY were performed with a 2T model with four parameters. For [18F]FCWAY, simulations were performed for temporal cortex, frontal cortex, occipital, and cerebellum, with distribution volume values from human studies of 5.0, 3.0, 2.4, and 0.38 mL/mL, respectively. Input functions for the ligand and the acid were taken from 27 human subjects (Carson et al., 2000a; Toczek et al., 2003). For [18F]FPWAY, human data are not available, so the parameters were chosen from monkey studies (Carson et al., 2000a) in the same regions with V values of 8.8, 10.7, 5.4, and 3.3 mL/mL, respectively. The input functions for the ligand and the acid from one bolus injection monkey study were used.
To simulate the acid contribution, the 1T model was used, and average acid rate constants were obtained by taking the mean across all gray matter regions and all monkeys. Because human rate constants for the acids are not available, we assumed that human and monkey constants for acid uptake are similar, based on the theoretical considerations described previously. The total TAC for each brain region was calculated as the sum of the ligand and acid TACs. For the case without correction, these contaminated curves were fitted to the four-parameter 2T model and the bias in V and BP were determined. To correct these TACs, the simulated acid TAC based on the average monkey rate constants was subtracted from the total TAC. Because kinetic parameters for these acids are not available in humans, it is likely that some error would be introduced using monkey kinetic parameters. Thus, simulations were also performed where the true values of K1 or V for the acid were increased and decreased by 50% compared with the monkey values, whereas the correction used the nominal rate constants. Then, biases in human V and BP were determined for these cases of inaccurate corrections.
RESULTS
[18F]FB and [18F]FC brain uptake
Figure 1 shows images from early and late postinjection times for [18F]FB and [18F]FC from one monkey. For [18F]FB, brain uptake of tracer is visible at early times, although the activity is less than that of the surrounding tissue. This pattern persists in the later data. For [18F]FC, the early images are similar to those of [18F]FB, although noisier owing to the 2D acquisition, compared with 3D acquisition for the [18F]FB images. For [18F]FC, the later image shows a pattern of bone uptake, consistent with metabolism of [18F]FC to [18F]fluoride.
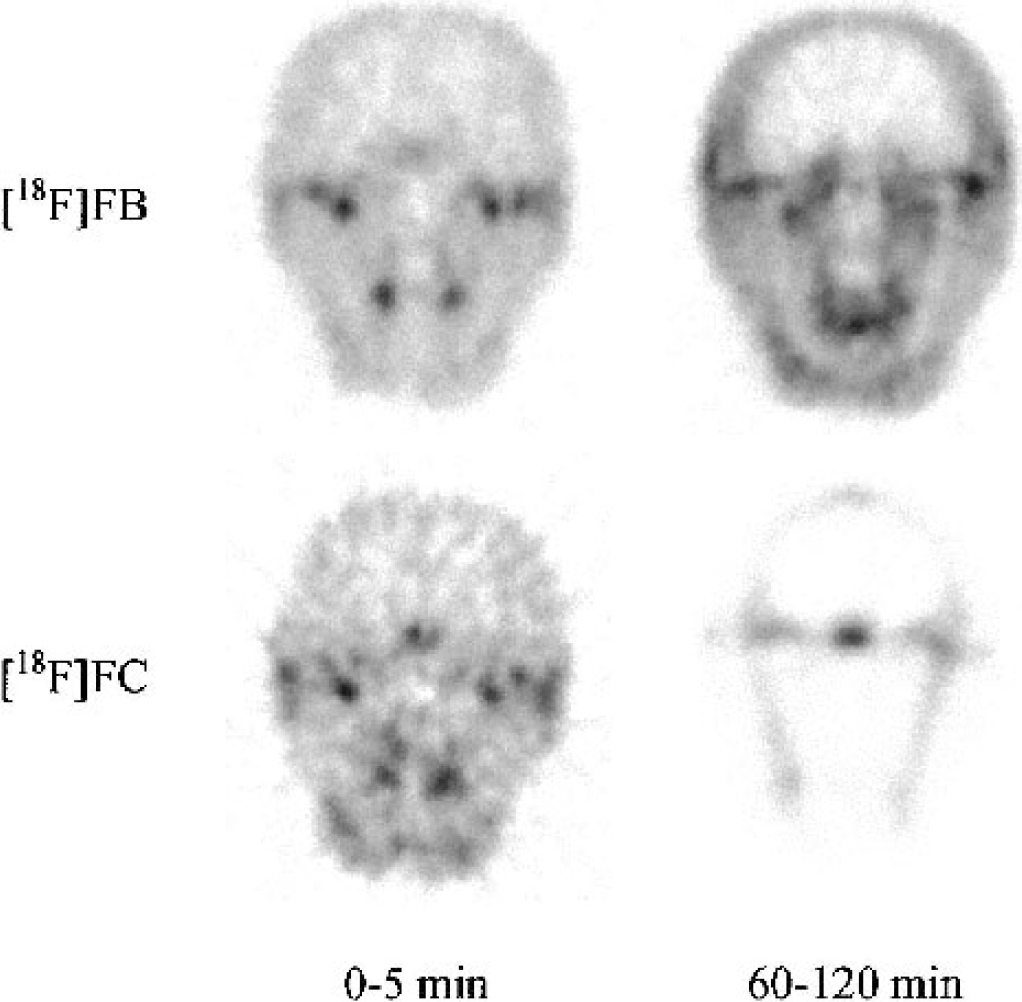
Coronal images of [18F]FB and [18F]FC from a central slice through the brain of one monkey. Image data from 0 to 5 minutes and 60 to 120 minutes after injection were summed for the left and right columns, respectively. The [18F]FB images were acquired in 3D mode after a bolus injection of 6.5 mCi, whereas [18F]FC images were acquired in 2D mode after a bolus injection of 5.2 mCi. Each image is scaled to its own maximum value. Brain uptake is visible in the early images for both acids. The late [18F]FC images show a bone uptake pattern due to metabolism to [18F]fluoride. [18F]FB, [18F]fluorobenzoic acid; [18F]FC, [18F]fluorocyclohexanecarboxylic acid.
Arterial input functions
Because there were no peripheral radiolabeled metabolites produced after injection of [18F]FB, the total activity in plasma was used as the input function. The parent fraction of [18F]FC in arterial plasma from the four studies is shown in Fig. 2. [18F]FC was rapidly metabolized to [18F]fluoride, with ∼60% of plasma radioactivity in the form of [18F]fluoride by 10 minutes.
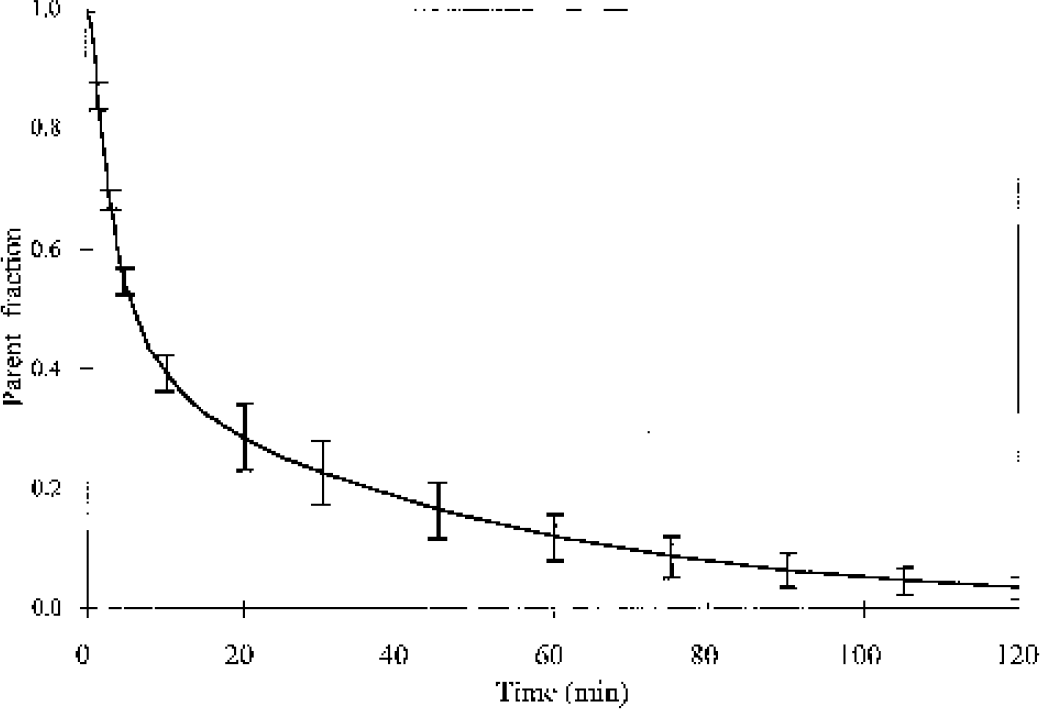
The mean and SD of the parent fraction of [18F]fluorocyclohexanecarboxylic acid in arterial plasma from four monkey studies. The original fraction data were fitted to multiexponential curves, which were averaged.
[18F]FB compartment modeling
The 1T model was applied to fit the [18F]FB data and all TACs were well fit by this model. One typical fit for a cerebellum region is shown in Fig. 3, with separation of the tissue and vascular components from the model Eq. 5. Based on the fit, the tissue component exceeds the vascular component after the first few minutes. The mean and SD of the parameter values are shown in Table 1. For [18F]FB, the mean gray matter parameters were as follows: K1, 10 ± 3 μL · min−1 · mL−1; V, 0.052 ± 0.006 mL/mL; and Vb, 0.04 ± 0.01 mL/mL. The average percent SD values across animals for K1, V, and Vb were 30%, 6%, and 12%, respectively. The estimated blood volume of 4% is a reasonable physiologic value for gray matter. The mean gray matter V value of 0.05 mL/mL was quite low, but is in agreement with the low plasma free fraction for [18F]FB of 12 ± 3% (Eq. 4). The mean K1 value was also quite low, since only a small fraction of the tracer that is uncharged and not bound to plasma proteins can most readily enter the brain. These parameters have relatively uniform distributions across brain regions (Table 1), and some or all of the interregional differences can be attributed to the partial volume effect.
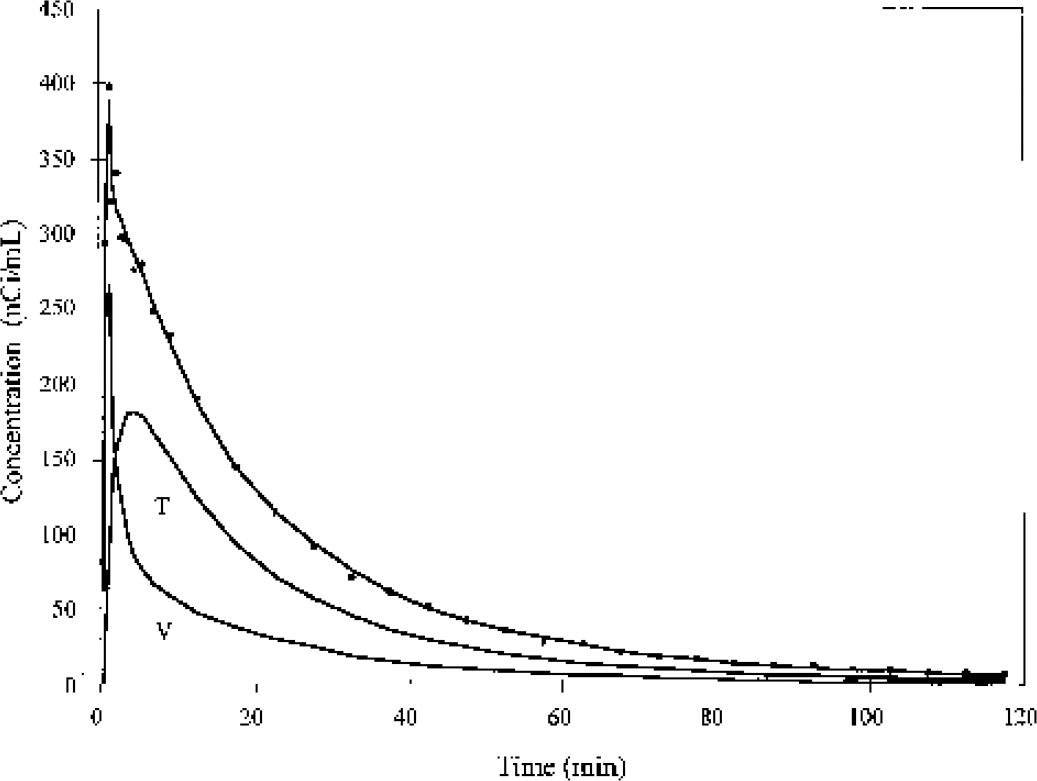
Time—activity curve from an [18F]fluorobenzoic acid monkey study in cerebellum (points) with fit to a one-tissue-compartment model (Eq. 5). The solid lines labeled T and V represent the tissue and vascular components, respectively.
Kinetic parameters
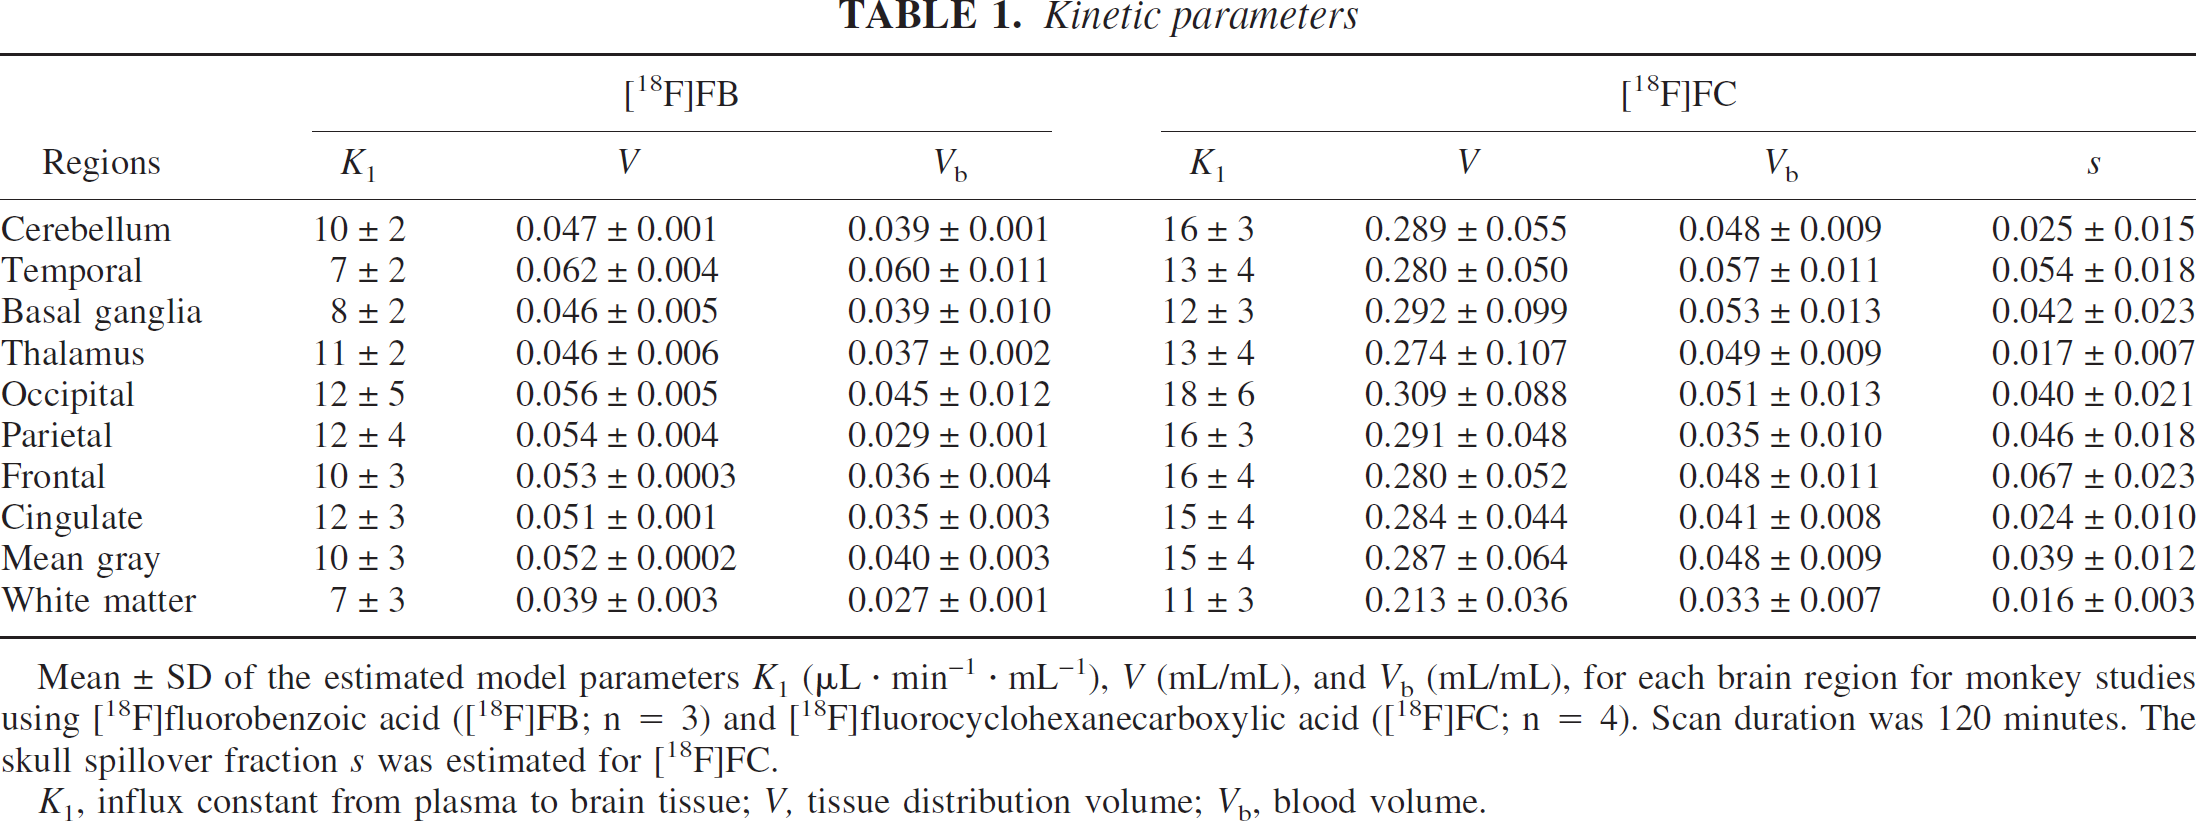
Mean ± SD of the estimated model parameters K1 (μL · min−1 · mL−1), V (mL/mL), and Vb (mL/mL), for each brain region for monkey studies using [18F]fluorobenzoic acid ([18F]FB; n = 3) and [18F]fluorocyclohexanecarboxylic acid ([18F]FC; n = 4). Scan duration was 120 minutes. The skull spillover fraction s was estimated for [18F]FC.
K1, influx constant from plasma to brain tissue; V, tissue distribution volume; Vb, blood volume.
[18F]FC compartment modeling
To analyze the [18F]FC brain TACs, the skull TAC (Cs(t)) was defined by analysis of the peak skull activity. An example of a peak skull TAC with fit to the irreversible uptake [18F]fluoride model (Eq. 7) is shown in Fig. 4, with the two components of this model: skull and vascular. The mean [18F]fluoride K1 and K (K1k3/(k2 + k3)) values were 0.14 and 0.09 mL · min−1 · mL−1, somewhat higher than the values of 0.11 and 0.04 found in humans by Hawkins et al. (1992). Fitted k2 and k3 values were substantially lower than those derived from the human [18F]fluoride studies. These kinetics differences may be attributed to uncorrected spill-in of [18F]FC to bone at early times in these monkey studies, or the inclusion of k4 in the model fitting for the human studies. Inclusion of k4 in the model for these data did not improve the quality of the fit.
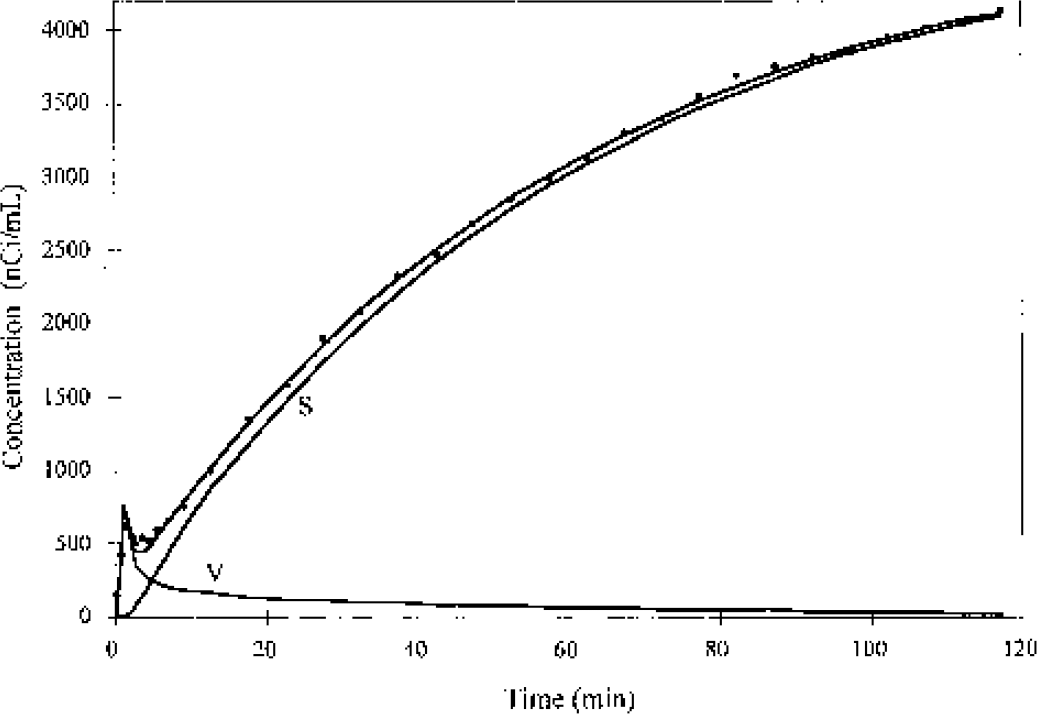
Time—activity curve (circles) from an [18F]FC monkey study in skull pixels with the highest activity (>95% of the peak value), with fit to the [18F]fluoride model of Eq. 7. Data are taken from a study with three-dimensional acquisition. The solid lines labeled S and V represent the skull and vascular components, respectively. The skull component (Cs(t)) was used in the fitting of [18F]FC brain time—activity curves using Eq. 6. [18F]FC, [18F]fluorocyclohexanecarboxylic acid.
[18F]FC brain TACs for all the monkeys were well fit with the four-parameter model (Eq. 6), which included vascular radioactivity, tissue uptake, and skull spillover. Two typical fitting examples (cerebellum and frontal cortex) are shown in Fig. 5. After the vascular peak, the tissue uptake was the predominant term in the TACs. At later times, the skull spillover term accounted for progressively higher percentages of the total activity. At 90 minutes, for example, the skull activity, as estimated by the model, accounted for 70% to 90% of the total activity. The different shape of the TACs from cerebellum and frontal cortex in Fig. 5 can be explained by the different spillover of skull activity with s values of 0.046 and 0.095, respectively.
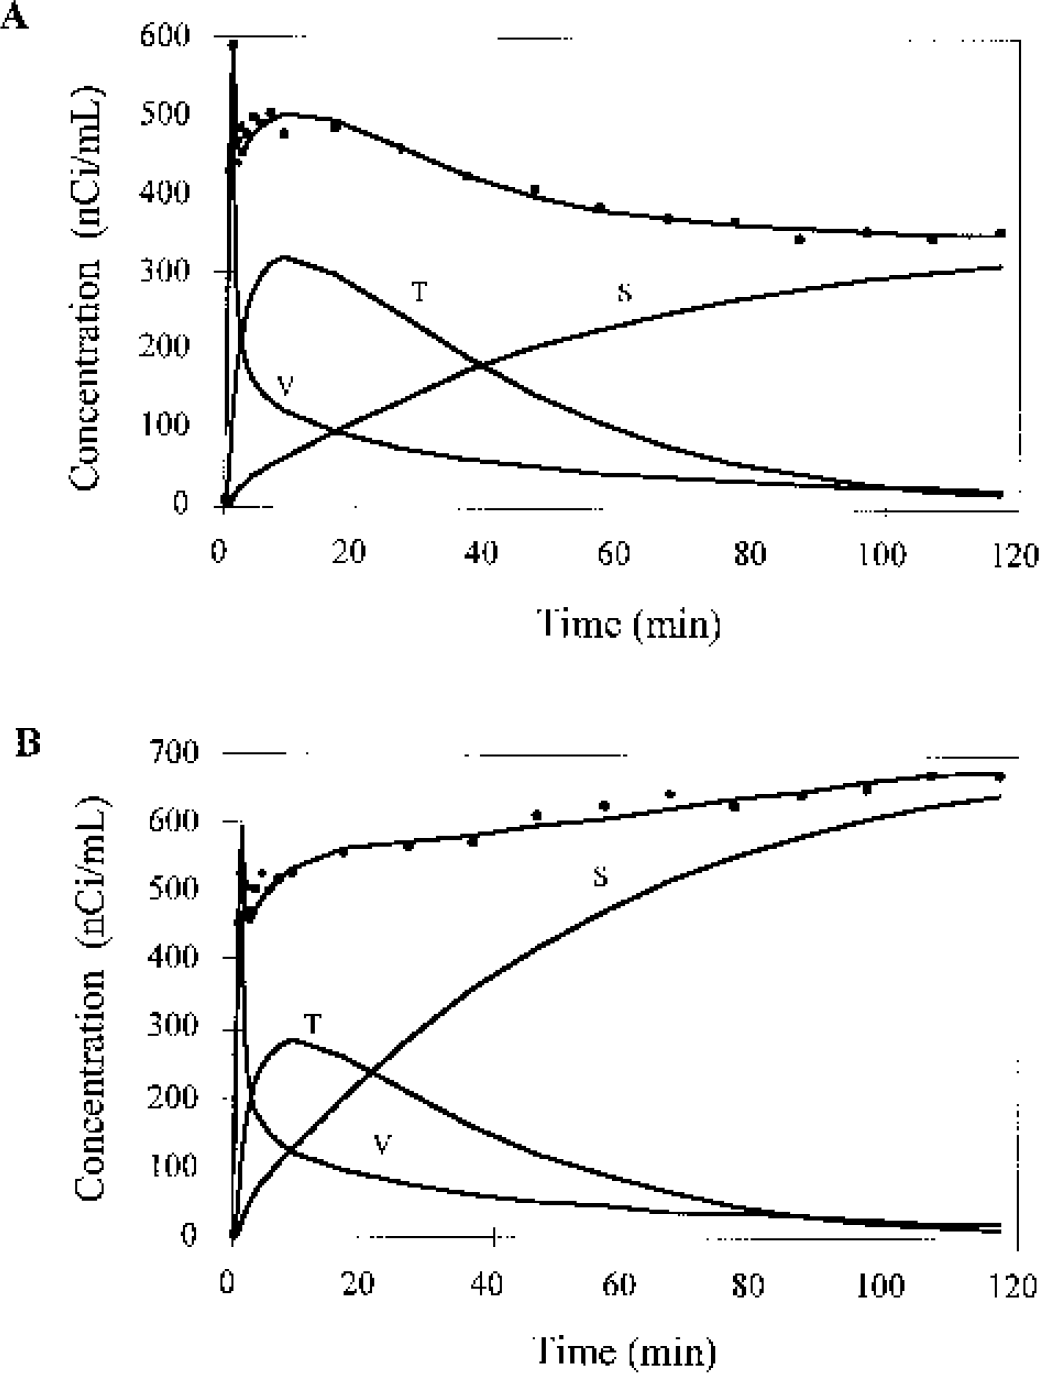
Examples of fitting brain time—activity curves (TACs) from an [18F]fluorocyclohexanecarboxylic acid monkey study in the cerebellum
The [18F]FC model parameters, K1, V, Vb, and s for each region are shown in Table 1. The mean gray matter parameters were as follows: K1, 15 ± 4 μL · min−1 · mL−1; V, 0.29 ± 0.06 (mL/mL); Vb: 0.05 ± 0.01 (mL/mL); and s: 0.04 ± 0.01. The blood volume values were consistent with those of [18F]FB. The V value of 0.29 mL/mL was much higher than that of [18F]FB, consistent with the higher plasma free fraction for [18F]FC of 78 ± 6%. The mean K1 value was also quite low, but was slightly higher than that of [18F]FB, consistent with the higher plasma free fraction. The average percent SD values across animals for K1, V, Vb and s were 27%, 23%, 22%, and 41%, respectively.
The stability of the volume of distribution estimation process was evaluated for [18F]FB and [18F]FC by comparing the parameter estimates from shorter data-analysis periods to those obtained by 120-minute analyses. Table 2 shows these values, presented as mean biases with respect to the 120-minute values. For V estimation with [18F]FB, the biases were very small for all data-analysis periods. For [18F]FC with a 30-minute scan duration, approximately 25% of fits failed to converge or produced estimates of V with large (>50%) standard errors. This instability is presumably due to the lack of sufficient data to kinetically differentiate the vascular, tissue, and skull components in the model of Eq. 6. With longer data analysis periods, the magnitude of the skull component grew and provided sufficient signal to accurately determine the skull component s, allowing reliable estimation of vascular and tissue components from the early data. For the converging 30-minute fits, V values were underestimated by ∼30%, K1 values were overestimated by ∼30%, and s values were overestimated by ∼70% compared with the 120-minute values. These biases may be due to errors in the skull partial volume correction (see Discussion).
Effect of data analysis duration on distribution volume estimates
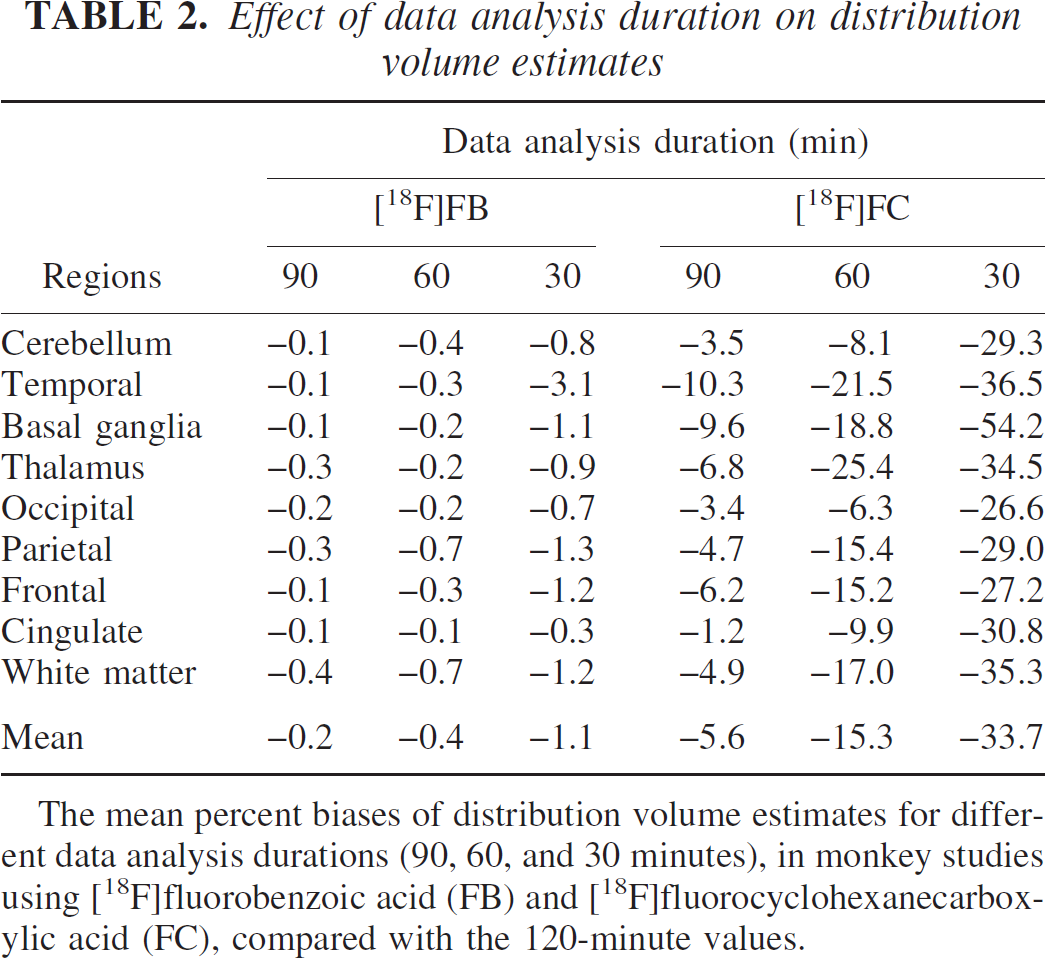
The mean percent biases of distribution volume estimates for different data analysis durations (90, 60, and 30 minutes), in monkey studies using [18F]fluorobenzoic acid (FB) and [18F]fluorocyclohexanecarboxylic acid (FC), compared with the 120-minute values.
The plasma free fraction, f1, was 12% ± 3% for [18F]FB studies and 78% ± 6% for [18F]FC studies. Equation 4 predicts a linear relation between V and f1. This relation is shown in Fig. 6, including all gray matter values for both [18F]FB and [18F]FC. The slope of the regression line is 0.37 (correlation coefficient of 0.94). The data in Fig. 6 are consistent with Eq. 4; given that there are two clusters of points, however, these data do not provide definitive validation of this relation. Assuming arterial pH of 7.4 and tissue pH of 7.0 (Guyton, 1976; Siesjo, 1985), the slope of 0.37 corresponds to a VA value of 0.93 mL/mL, which is consistent with the distribution space of water in gray matter of 1.03 mL/mL (Herscovitch and Raichle, 1985).
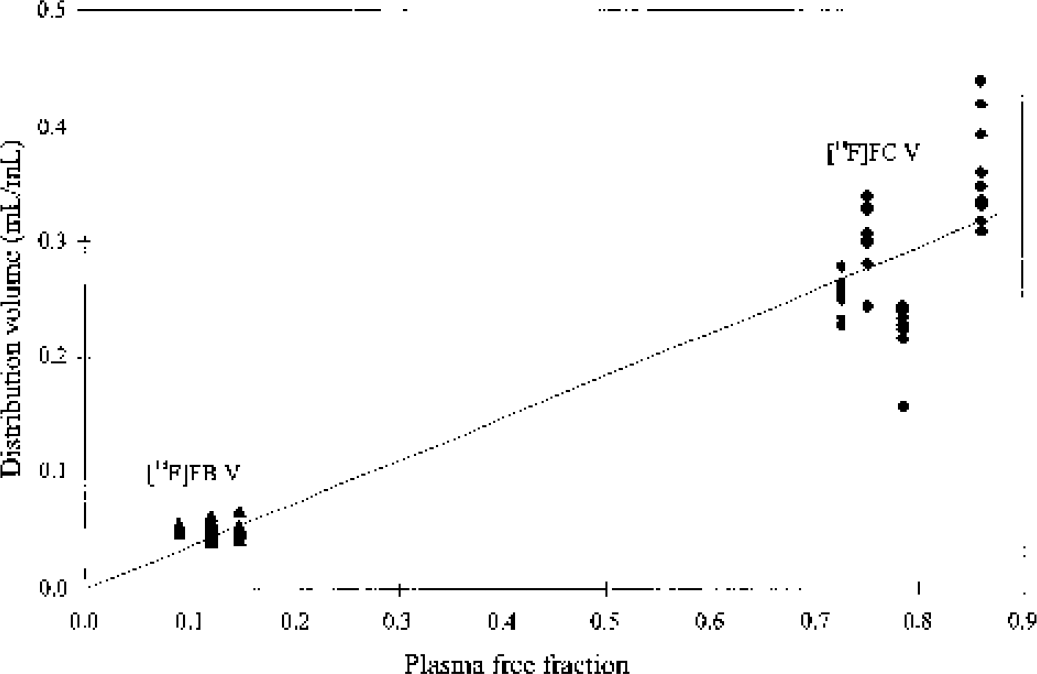
Relation between plasma free fraction f1 and the distribution volume V for radiolabeled acids. Points correspond to fitted gray matter V values for each monkey for both [18F]FB (▴) and [18F]FC (♦). The line in the figure is the linear fit of all points (intercept forced through 0.0), with slope of 0.37 and a correlation coefficient of 0.94. [18F]FB, [18F]fluorobenzoic acid; [18F]FC, [18F]fluorocyclohexanecarboxylic acid.
Simulation of brain uptake of metabolites in human ligand studies
The mean biases of human kinetic parameters estimated for [18F]FCWAY with and without correction for brain uptake of [18F]FC are shown in Tables 3 and 4. Regions with highest specific binding (temporal cortex) showed little bias in V (Table 3) even without correction. As the specific binding decreases, V is progressively overestimated by higher percentages owing to the uncorrected [18F]FC activity. For cerebellum, which has the lowest V, the overestimate was ∼40% with the nominal [18F]FC rate constants, and ranged from 21% to 66% if the [18F]FC rate constants differed. These biases also had large variability across subjects of −15%. If BP is calculated using these biased values (Table 4), the average underestimate is ∼30% in all regions, since the predominant source of error is the bias in V for the cerebellar reference region. For the BP values, the percent SD values (calculated across the 27 input functions) were ∼20% to 30% of the mean percent bias values.
[18F]FCWAY bias due to brain uptake of [18F]FC: volume of distribution
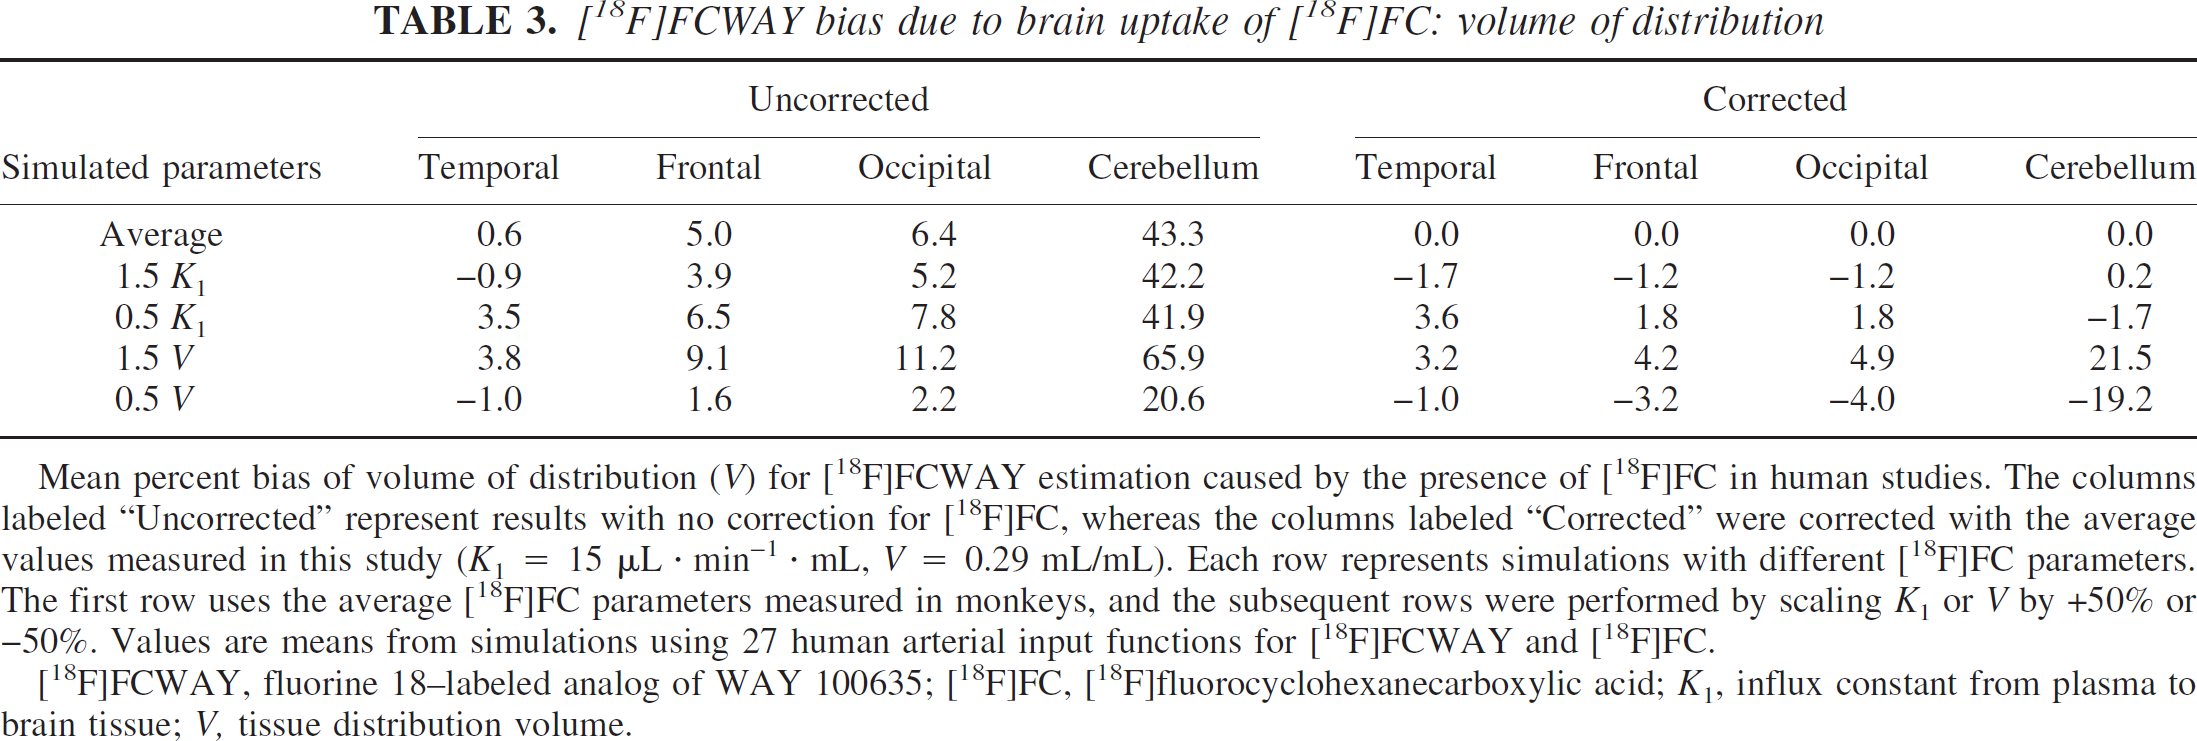
Mean percent bias of volume of distribution (V) for [18F]FCWAY estimation caused by the presence of [18F]FC in human studies. The columns labeled “Uncorrected” represent results with no correction for [18F]FC, whereas the columns labeled “Corrected” were corrected with the average values measured in this study (K1 = 15 μL · min−1 · mL, V = 0.29 mL/mL). Each row represents simulations with different [18F]FC parameters. The first row uses the average [18F]FC parameters measured in monkeys, and the subsequent rows were performed by scaling K1 or V by +50% or −50%. Values are means from simulations using 27 human arterial input functions for [18F]FCWAY and [18F]FC.
[18F]FCWAY, fluorine 18–labeled analog of WAY 100635; [18F]FC, [18F]fluorocyclohexanecarboxylic acid; K1, influx constant from plasma to brain tissue; V, tissue distribution volume.
[18F]FCWAY bias due to brain uptake of [18F]FC: binding potential
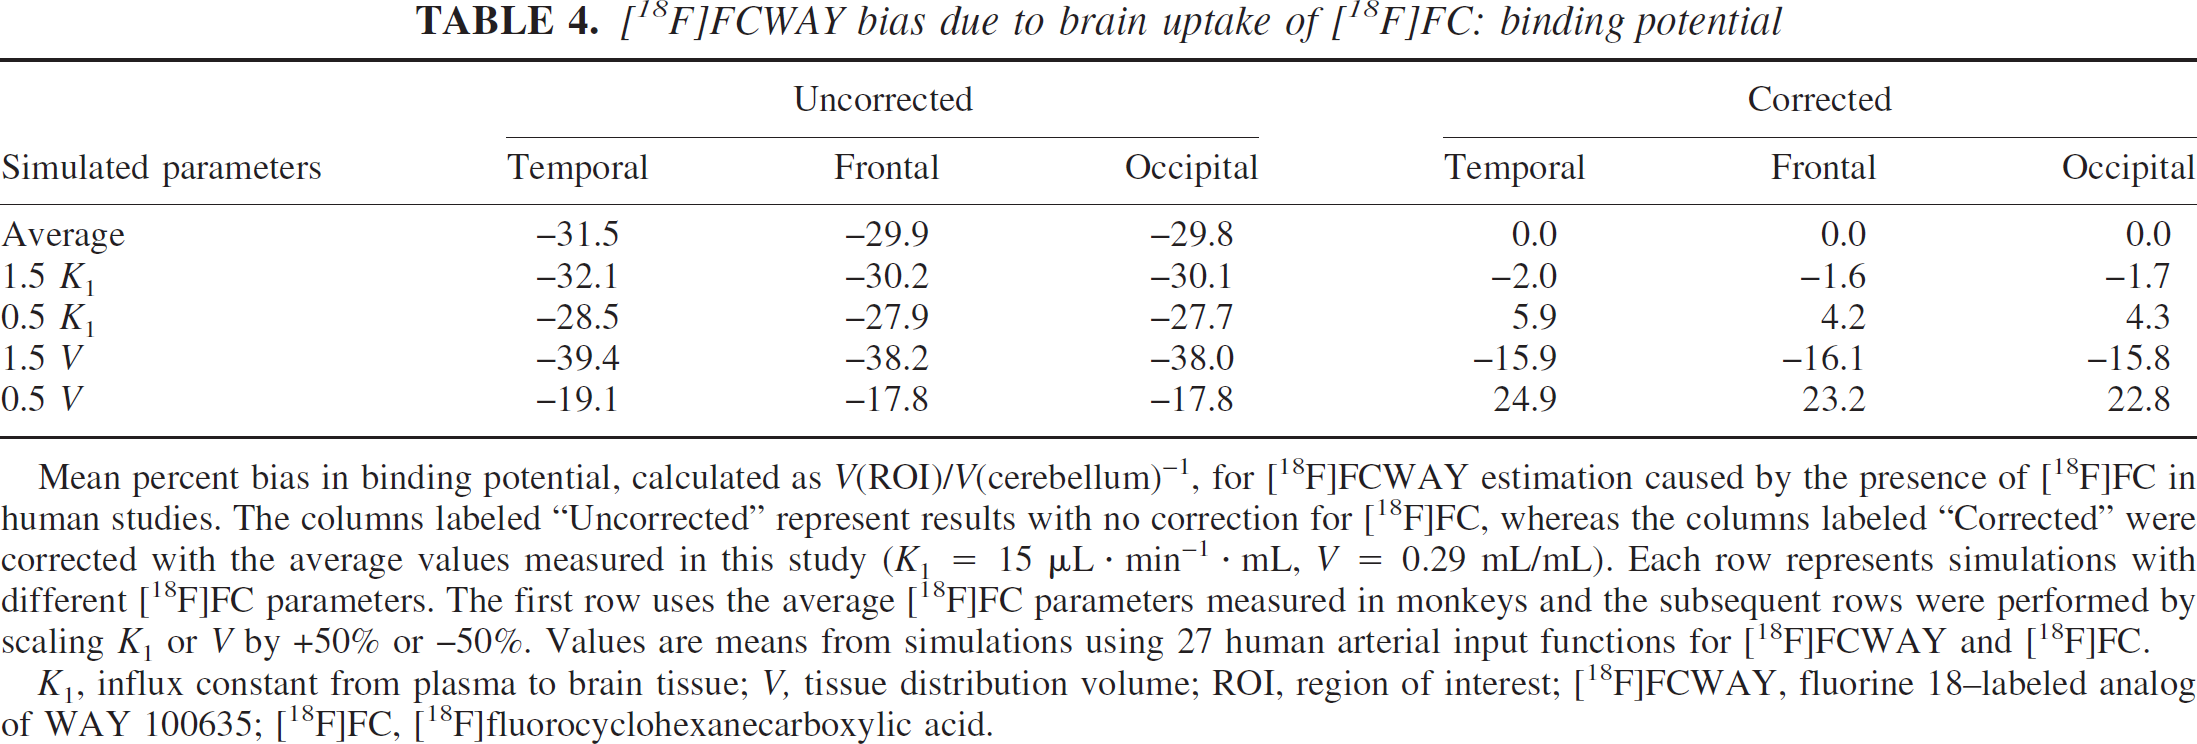
Mean percent bias in binding potential, calculated as V(ROI)/V(cerebellum)−1, for [18F]FCWAY estimation caused by the presence of [18F]FC in human studies. The columns labeled “Uncorrected” represent results with no correction for [18F]FC, whereas the columns labeled “Corrected” were corrected with the average values measured in this study (K1 = 15 μL · min−1 · mL, V = 0.29 mL/mL). Each row represents simulations with different [18F]FC parameters. The first row uses the average [18F]FC parameters measured in monkeys and the subsequent rows were performed by scaling K1 or V by +50% or −50%. Values are means from simulations using 27 human arterial input functions for [18F]FCWAY and [18F]FC.
K1, influx constant from plasma to brain tissue; V, tissue distribution volume; ROI, region of interest; [18F]FCWAY, fluorine 18–labeled analog of WAY 100635; [18F]FC, [18F]fluorocyclohexanecarboxylic acid.
The predicted magnitude of error induced by acid uptake in [18F]FCWAY studies was much larger in humans than in monkeys, where [18F]FC uptake contributed 6% to 7% of cerebellum activity from 60 to 120 minutes (Carson et al., 2000b). This was the case because V values in monkeys (e.g., cerebellum V = 3.9 mL/mL) are higher than those in humans (cerebellum V = 0.38 mL/mL), in part owing to differences in tracer plasma free fraction (e.g., 49% in monkeys vs. 7% in humans).
After [18F]FC correction, the large biases in occipital cortex and particularly cerebellum were reduced. Inaccurate values of acid K1 of ±50% had a relatively small effect on [18F]FCWAY V values. A significant change in the acid's true volume of distribution, however, caused a substantial residual error in the cerebellum V of approximately ±20%, leading to a comparable error in BP. Thus, a correct estimate of human acid V is necessary for accurate cerebellum quantification.
For [18F]FPWAY and its acid metabolite [18F]FB, the effects of acid uptake on receptor quantification are much smaller. The biases of V estimation without [18F]FB correction for [18F]FPWAY were typically 1% for regions with higher specific binding, increasing to 4% for the cerebellum. There are two reasons why this error is small. First, the V of [18F]FB is small (∼0.05 mL/mL), so the magnitude of tissue uptake is much smaller than that of [18F]FC. Second, as with [18F]FCWAY, the V values for [18F]FPWAY in monkey are higher than those of [18F]FCWAY in humans (e.g., cerebellum V = 3.3 mL/mL). Thus, for [18F]FPWAY in monkeys, no correction for [18F]FB uptake is necessary; this issue, however, should be reevaluated for [18F]FPWAY studies in humans.
DISCUSSION
The radiolabeled acids [18F]FB and [18F]FC, the metabolites of [18F]FPWAY and [18F]FCWAY, respectively, do enter the brain, and a 1T model can describe their tissue uptake. The K1 and V values in different regions of the monkey brain are relatively uniform. The K1 values found in the present study were quite low, consistent with the low fraction of radiolabeled acid that is present as its uncharged moiety at physiologic pH. As with [11C]CO2, the volume of distribution is controlled by the difference in pH between tissue and plasma. In addition, we propose that the plasma free fraction f1 also has a controlling influence on V (Eq. 4), and this relation was supported by the correlation of V and f1 for [18F]FB and [18F]FC (Fig. 6).
Several technical issues in these studies have an effect on the accuracy of the kinetic parameter estimates. Positron emission tomography data were acquired in both 2D and 3D modes as part of this study. The 2D data have a lower scatter fraction (∼10%), and 2D scatter was corrected with a convolution algorithm (Bergstrom et al., 1983), whereas the 3D data have a higher scatter fraction (∼35% in these data) and were corrected with a simpler Gaussian fit method (Stearns, 1995). Thus, it would be expected that the 2D data would be more accurate, given the low brain uptake with higher levels of surrounding head radioactivity (Fig. 1). In contrast, however, most neuroreceptor imaging is performed in the more sensitive 3D mode. Thus, it would be advantageous to measure the apparent kinetic parameters in 3D mode, so that any 3D-induced bias would be handled automatically in any correction method based on the estimated parameters. For two animals studied with [18F]FC, 3D scan frames were interleaved between the 2D frames. Comparing the reconstructed activity values in ROIs (integrals from 30 to 90 minutes) showed that the 3D data were slightly higher than the 2D data, by 12% ± 12% and 3% ± 6% in the two animals, with larger percent overestimates in regions with lower values. In addition, the one animal from which 3D data were used for [18F]FC fitting did not show different parameter values than the 2D study results.
As with [18F]FCWAY (Carson et al., 2000b), injection of [18F]FC leads to the presence of [18F]fluoride in blood, which rapidly accumulates in bone. With its irreversible uptake in bone (Hawkins et al., 1992), this activity rapidly exceeds that of brain and leads to spillover of counts into the brain ROIs. One approach to correct the TACs for skull spillover is a partial volume correction method (Meltzer et al., 1999; Muller-Gartner et al., 1992). This approach would require exact knowledge of the skull size and position, the true radioactivity concentration in the skull, and the assumption that skull uptake is uniform. Because x-ray computed tomography images of these monkeys were not available and accurate bone edges could not be defined from magnetic resonance images that were available, this approach was not pursued.
As an alternative solution, a method for spillover correction of [18F]fluoride into brain was developed using compartment modeling in Eq. 6. This approach is analogous to that used for correction of spillover of ventricular radioactivity in cardiac tracer studies (Herrero et al., 1989; Iida et al., 1992). The parameter s was fitted for each ROI to account for the relative contribution of the skull TAC, deduced by a preliminary fit of a TAC from the peak skull pixels (Fig. 4). The s values ranged from 2% to 7% (Table 1), with higher values in ROIs closer to the skull. For example, the lowest s values were found in the thalamus and the white matter. The absolute values of s appear to be quite low, but they are not unreasonable in light of the thin rhesus skull (∼1 to 2 mm). For example, for a skull thickness of 2 mm, theoretical calculations assuming a one-dimensional Gaussian point-spread function predict s values of 0.10, 0.05, and 0.02 for pixels at 3, 4, and 5 mm from the edge of the skull.
In the modeling of [18F]FC, the correction for the skull TAC plays a critical role (Fig. 5). This correction was performed with an idealized skull TAC (Cs(t)) derived from fits of the peak skull pixels (>95% of the peak pixel value). These peak TACs were taken from a small number of pixels (two to nine). To evaluate the influence of this threshold on the [18F]FC parameter estimates, the following analysis was performed. Lower threshold values were applied to the images from each animal, and new peak TACs were generated and fitted to Eq. 7. The original ROI TACs were then fitted with the new Cs(t) curves using Eq. 6 and the percent changes in V compared to the 95% threshold values were determined. For pixel selection thresholds of 90% (3 to 21 pixels), 80% (8 to 56 pixels), 70% (19 to 114 pixels), and 50% (59 to 383 pixels), the percent changes in V were 0.6% ± 1.6%, −0.7% ± 2.2%, −0.9% ± 1.9%, and −4.5% ± 3.9%, respectively. Regions with higher s values had larger errors. This simulation suggests that the thresholding method for estimating the idealized skull TAC provides stable estimates of V.
An assumption of the skull-correction method of Eq. 6 is that all skull pixels have the same kinetic shape; that is, the scale factor s could be used to account for the regional partial volume effect as well as any regional variation in skull kinetics compared with the peak skull TAC. The accuracy of this assumption depends on the regional skull variation of k2F and k3F in Eq. 7. The tissue component of this equation consists of a reversible and irreversible component. If the irreversible component is the dominant term, the use of a single scale factor is appropriate because this term is a linear multiple of the integrated plasma input function. Using the estimated k2F and k3F values and Eq. 7, the irreversible component accounted for 75% to 90% of the tissue radioactivity from 30 minutes onward. Thus, the simple scaling model of Eq. 6 may not be appropriate at early times in the presence of regional variation in the [18F]fluoride parameters, and this may contribute to the negative biases in the 30-minute [18F]FC V values compared with the 120-minute values (Table 2). Instability in the [18F]FC parameters for the 30-minute data-analysis period may also be due to lack of correction of the Cs(t) data for spill-in from extracranial activity at early times (Fig. 1).
Correction for tissue uptake of radiolabeled metabolites is not uncommon in brain tracer studies. For example, for 6-[18F]fluoro-L-dopa (FDOPA) (Huang et al., 1991; Gjedde et al., 1991), the compartment models accounted for the brain uptake of the peripheral metabolite 3-O-methyl-6-[18F]fluoro-L-dopa (OMFD) by measuring its input function and proposing a model for OMFD uptake. Studies in rhesus monkeys showed that the uptake of OMFD could be described by a reversible 1T model with distribution volume near 1 mL/mL (Doudet et al., 1991). Because FDOPA and OMFD both cross the BBB via the large neutral amino acid transporter, their kinetic parameters were linked in the FDOPA compartment model configurations, to limit the number of additional parameters required in the data fitting.
As another example, Tan et al. (1999) characterized the metabolites of the 5-HT2A ligand [18F]altanserin as likely to cross the BBB. At equilibrium, however, these metabolites should not affect quantification of specific binding calculated as the difference between the ROI and reference region concentrations, under the assumption that metabolite uptake is uniform throughout brain. To estimate BP, the concentration of specifically bound tracer at equilibrium is divided by the concentration of free parent in plasma. Price et al. (2001a, b ) evaluated compartmental and graphical methods to account for uptake of [18F]altanserin metabolites in bolus-injection studies. To reduce the number of free parameters, the uptake rate constant (K1) for the metabolite was constrained to equal that of the parent compound.
Another example can be found in studies with [123I]epidepride and SPECT (Ichise et al., 1999), where graphical and multilinear approaches were developed to account for tissue uptake of metabolites. By fitting data after an initial period t*, estimates of the volume of distributions of parent and radioactive metabolite could be obtained simultaneously, given knowledge of both arterial input functions. Alternatively, Gunn et al. (2000) presented a general dual-scan approach, whereby a parent compound scan together with a supplementary scan in which the radiolabeled metabolite of interest is administered. The metabolite tissue impulse response is determined from the supplementary scan, and this is then combined by convolution with the metabolite plasma curve from the primary study to yield the correction TAC.
These previous approaches for correction of brain uptake of metabolites can be categorized as follows: (1) inclusion of the metabolite component in the model with direct estimation of metabolite parameters along with those of the parent compound; (2) inclusion of the metabolite component in the model with one or more metabolite parameters linked to the parameters of the parent tracer; (3) direct subtraction of metabolites based on measurement of metabolite kinetic parameters in a separate study; or (4) use of a reference region to estimate metabolite uptake as well as free plus nonspecifically bound parent tracer.
Based on our results, a correction for the uptake of [18F]FC into the brain will be important for accuracy of V estimates in regions with low receptor binding such as cerebellum (Table 3). Because a similar effect may occur in the quantification of [C]WAY 100635 owing to brain uptake of [11C]cyclohexanecarboxylic acid ([11C]CHCA), we performed simulations similar to those described previously for [18F]FCWAY and [18F]FC. Here, the C-11 parent and metabolite fraction curves were taken from Osman et al. (1998) and the [11C]WAY 100635 rate constants were taken from Gunn et al. (1998). Because kinetic parameters for [11C]CHCA were not available, we used the mean [18F]FC parameters. The simulation predicted that the acid metabolite accounted for 25% to 35% of the cerebellum activity (V = 0.4 mL/mL) from 30 to 120 minutes. For medial temporal cortex (V = 5.2 mL/mL), the bias was smaller (2% to 5%). This simulated acid uptake generated overestimates of V for cerebellum and medial temporal cortex of ∼35% and ∼2%, respectively. Thus, if the kinetic parameters for [11C]CHCA are similar to those of [18F]FC, which would be the case if the f1 values for [11C]CHCA and [18F]FC are similar, then errors in [11C]WAY 100635 V estimation due to [11C]CHCA will be similar to those due to [18F]FC uptake in [18F]FCWAY studies.
Accurate values of the [18F]FCWAY distribution volume in regions of low specific binding are critical in order to use the binding potential measurement, defined as V(ROI) / V(cerebellum)-1. To achieve accurate quantification of the [18F]FCWAY distribution volume, we propose the following correction method. Measure the [18F]FC arterial input function in each subject and predict the time course of [18F]FC in the brain using the 1T model. This approach assumes that no acid is produced by metabolism of [18F]FCWAY in brain tissue itself, or that the amount of such acid is small compared with that delivered from plasma. To apply the 1T model, the kinetic parameters obtained here may be used. In gray matter regions, the average K1 value of 15 μL · min−1 · mL−1 could be used since K1 values were relatively uniform across regions (Table 1) and the accuracy of the model correction was relatively less sensitive to errors in this value than distribution volume (Tables 3 and 4). V values were also quite uniform throughout gray matter, and the average value of 0.29 mL/mL could be used. The accuracy of the correction method, however, is more sensitive to the assumed value of V (Tables 3 and 4), thus any improvement in the accuracy of the V value would be helpful.
Based on theory and our results, pH and f1 (free fraction of [18F]FC) are the main physiologic driving forces affecting the acid's V. Because tissue pH is well regulated (Siesjo, 1985), it is likely that intersubject variation in acid V will be affected mostly by variation in f1. Adjustment of V for f1 with Eq. 4 could be performed if f1 can be measured in each subject. Note that in the four-step [18F]FCWAY synthesis (Lang et al., 1999b), [18F]FC is produced as an intermediate product, and thus the in vitro measurement of f1 by ultrafiltration can be performed with a sample of each subject's blood obtained before [18F]FCWAY injection. Preliminary data in three subjects acquired as part of ongoing human [18F]FCWAY studies (Toczek et al., 2003) showed an [18F]FC f1 of 62% ± 1%, lower than that measured in the anesthetized monkeys (78% ± 6%). Based on Eq. 4, an appropriate human V value for [18F]FC is 0.23 mL/mL, 21% lower than that of monkeys. If the higher monkey V value of 0.29 mL/mL was used to correct [18F]FCWAY human data, the cerebellum V values would be underestimated by approximately 8%, based on the bias value in Table 3 determined for the case of true V = 50% of the correction V.
Correction for [18F]FC uptake in an [18F]FCWAY human study by this approach requires the measurement of the [18F]FC input function in addition to that of [18F]FCWAY. It is worth considering if there are other quantification options that do not require this additional measurement. For example, if quantification of only those regions with high specific binding is of interest, direct use of V may be appropriate because the magnitude of nonspecific binding for [18F]FCWAY is small (mean V values in temporal cortex and cerebellum are 5.0 and 0.38 mL/mL, respectively) and because the percent errors in V uncorrected for [18F]FC are also small (Table 3). If correction for nonspecific binding is considered important, a receptor measure could be obtained from the difference of binding potentials in the ROI and the cerebellum [V(ROI) - V(cerebellum)]. Note, however, that without correction for tissue [18F]FC, this measure will have some residual bias because the absolute magnitude of the [18F]FC-induced bias in V is not uniform across regions.
Based on these results, the uptake of radiolabeled acid metabolites is a larger concern for [18F]FCWAY than [18F]FPWAY. This finding, however, does not suggest that [18F]FPWAY is a superior tracer than [18F]-FCWAY. [18F]FPWAY has lower affinity for the 5-HT1A receptor; this is reflected in binding potentials in monkeys, which are approximately 25% that of [18F]-FCWAY (Carson et al., 2001). Lower affinity tracers may be more useful to assess dynamic changes in synaptic serotonin. Alternatively, the high affinity of [18F]-FCWAY yields images with better contrast and better delineation of the raphe, a small structure with high 5-HT1A receptor concentration.
CONCLUSIONS
The acid metabolites [18F]FB and [18F]FC cross the BBB, and their tissue concentrations can be described with a 1T model using a distribution volume adjusted for plasma free fraction. For [18F]FPWAY studies, the uptake of [18F]FB has minimal effect on quantification of monkey kinetic parameters. For [18F]FCWAY in humans, [18F]FC uptake produces significant biases in distribution volume estimates in regions with low specific binding. These results can be used to correct the tissue TACs from [18F]FCWAY studies for brain uptake of [18F]FC using the measured [18F]FC input function. This approach should be applicable to other radiotracers with acid metabolites.
Footnotes
Acknowledgments
The authors thank Drs. Dale Kiesewetter and Giampiero Giovacchini for helpful discussions and acknowledge the excellent technical support of the NIH PET staff, particularly Ms. Wendy Territo. The veterinary assistance of John Bacher, D.V.M., and his staff is also greatly appreciated.