
Abstract
O-methyl metabolite (L-[β-11C]OMD) of 11C-labeled L-3,4-dihydroxyphenylalanine (L-[β-11C]DOPA) can penetrate into brain tissue through the blood–brain barrier, and can complicate the estimation of dopamine synthesis capacity by positron emission tomography (PET) study with L-[β-11C]DOPA. We evaluated the impact of L-[β-11C]OMD on the estimation of the dopamine synthesis capacity in a human L-[β-11C]DOPA PET study. The metabolite correction with mathematical modeling of L-[β-11C]OMD kinetics in a reference region without decarboxylation and further metabolism, proposed by a previous [18F]FDOPA PET study, were implemented to estimate radioactivity of tissue L-[β-11C]OMD in 10 normal volunteers. The component of L-[β-11C]OMD in tissue time-activity curves (TACs) in 10 regions were subtracted by the estimated radioactivity of L-[β-11C]OMD. To evaluate the influence of omitting blood sampling and metabolite correction, relative dopamine synthesis rate (kref) was estimated by Gjedde–Patlak analysis with reference tissue input function, as well as the net dopamine synthesis rate (Ki) by Gjedde–Patlak analysis with the arterial input function and TAC without and with metabolite correction. Overestimation of Ki was observed without metabolite correction. However, the kref and Ki with metabolite correction were significantly correlated. These data suggest that the influence of L-[β-11C]OMD is minimal for the estimation of kref as dopamine synthesis capacity.
INTRODUCTION
The central dopaminergic system has an important role in the pathophysiology of neuropsychiatric or neurodegenerative diseases. Dopamine synthesis capacity, a presynaptic function of the central dopaminergic system, can be measured by positron emission tomography (PET) using radiolabeled L-3,4-dihydroxyphenylalanine (L-DOPA), the substrate for enzymatic dopamine synthesis by amino-acid decarboxylase. The 18F-labeled analog of L-DOPA, 6-[18F]fluoro-L-DOPA ([18F]FDOPA), has been applied to investigate the integrity of dopaminergic neurons in various neurological diseases such as Parkinson's disease,1, 2, 3, 4 schizophrenia,5, 6 and epilepsy. 7 Alternatively, 11C-labeled DOPA, L-[β−11C]DOPA, were also proposed as tracer to investigate the integrity of presynaptic dopamine neuron. 8 L-[β−11C]DOPA has also been applied in pharmacological and pathophysiological studies, including the determination of antipsychotic agent responses 9 and the pathophysiology of schizophrenia. 10
O-methylated metabolites of radiolabeled DOPA (i.e., L-[β−11C]O-methyl-DOPA (L-[β−11C]OMD) or [18F]O-methyl-FDOPA ([18F]OMFD)) can penetrate into brain tissue through the blood–brain barrier, and contribute to radioactivity in the brain acquired during a PET scan. For example, an [18F]FDOPA tissue assay study in monkey demonstrated that radioactivity of [18F]OMFD consisted of 40% of total radioactivity in the caudate at 90 minutes after [18F]FDOPA injection. 11
Some previous animal studies imply that the contribution of L-[β−11C]OMD is smaller than the one of [18F]OMFD. For example, in high-performance liquid chromatography (HPLC) analysis of brain homogenate of rats with L-[β-11C]DOPA, the radioactivity of L-[β-11C]OMD consisted of 17% of total radioactivity at 40 minutes after the injection, 12 whereas the fraction of [18F]OMFD in the striatum of rat injected with [18F]FDOPA was ∼50%. 13
The presence of O-methyl metabolite (L-[β-11C]OMD) in the brain can complicate the estimation of dopamine synthesis capacity by kinetic analysis. For accurate measurement of the presynaptic dopamine system, the component of L-[β-11C]OMD in the brain should be eliminated. A number of methods to eliminate the component of L-[β-11C]OMD from the tissue time-activity curve (TAC) have been proposed in several [18F]FDOPA PET studies. Subtraction of TAC in a reference region, in which decarboxylation and further metabolism of [18F]FDOPA is negligible, from total TAC in regions of interest has been proposed as a correction for [18F]OMFD, with the assumption of a uniform diffusion of [18F]OMFD throughout the brain.14, 15 However, overcorrection for [18F]OMFD by subtraction of cerebellar TAC, resulting in the underestimation of the net influx of [18F]FDOPA, was previously reported as some radioactivity in the reference region is attributed to [18F]FDOPA. 16 To avoid this overcorrection, a method of subtracting the [18F]OMFD component in the brain, calculated mathematically by compartment model analysis with arterial input function of both [18F]FDOPA and [18F]OMFD, was proposed.6, 16
According to the finding that the contribution of L-[β-11C]OMD is smaller than the one in [18F]OMFD, the influence of L-[β-11C]OMD in the tissue has not been considered in the L-[β-11C]DOPA PET studies with human.9, 17, 18, 19, 20 However, whether L-[β-11C]OMD affects the dopamine synthesis capacity estimated by kinetic analysis of human L-[β-11C]DOPA PET study remains unclear.
The aim of this study was to evaluate the impact of L-[β-11C]OMD on the estimation of dopamine synthesis rate by kinetic analysis in humans using L-[β-11C]DOPA PET. We applied mathematical modeling for both L-[β-11C]DOPA and L-[β-11C]OMD kinetic in the brain, as previously reported, 16 to TACs acquired from 10 healthy volunteers. The difference of net dopamine synthesis rate (Ki) estimated by Gjedde–Patlak graph plot analysis21, 22, 23, 24 between without and with metabolite correction was examined. To evaluate the influence of omitting blood sampling and metabolite correction, the relative dopamine synthesis rate (kref) was also estimated by Gjedde–Patlak analysis with a reference tissue input function, and compared with Ki with the metabolite correction.
MATERIALS AND METHODS
Subjects
L-[β-11C]DOPA data acquired from 10 healthy males (21 to 32 years of age, 23.4±3.3 years (mean±s.d.)) in previous PET study 17 were analyzed. The subjects were free of somatic, neurologic, or psychiatric disorders on the basis of their medical history and magnetic resonance (MR) imaging of the brain, and they had no history of drug abuse or addiction. This study was approved by the Ethics and Radiation Safety Committees of the National Institute of Radiological Sciences, Chiba, Japan. This study was performed in accordance with ethic guideline for clinical research, issued by Ministry of Health, Labor and Welfare, Japanese Government (2008).
PET Procedures
All PET scans were performed with a ECAT EXACT HR+ system (CTI-Siemens; Knoxville, TN, USA), which provides 63 sections with an axial field of view of 15.5 cm. The intrinsic spatial resolution was 4.3 mm in-plane and 4.2 mm full-width at half-maximum axially. 25 Reconstruction with filtered back projection and a Hanning filter (cut-off frequency: 0.4 cycles/pixel) resulted in a final in-plane resolution of 7.5 mm full-width at half-maximum. Data were acquired in three-dimensional mode with scatter correction. A head fixation device with thermoplastic attachments for individual fit minimized head movement during PET measurements. The injected radioactivity of L-[β-11C]DOPA, synthesized as described previously,26, 27 was 320 to 402 MBq. The specific activity of L-[β-11C]DOPA was 29 to 89 GBq/μmol at the time of injection.
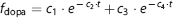
After intravenous rapid bolus injection of L-[β-11C]DOPA, dynamic scanning was performed for 89 minutes, consisting of seven 1-min frames, five 2-min frames, four 3-min frames, and twelve 5-min frames. A transmission scan for 10 minutes was first performed for correction of attenuation. To obtain the arterial input function, 28 samples of arterial blood were taken at 15, 25, 35, 45, 55, 65, 75, 85, 95, and 105 seconds, and 2, 2.5, 3, 4, 5, 6, 8, 10, 12, 15, 20, 30, 40, 50, 60, 70, 80, and 90 minutes after injection. The fraction of radioactivity representing L-[β-11C]DOPA and L-[β-11C]OMD in plasma was determined by HPLC.17, 28, 29 For HPLC analysis, arterial blood samples were drawn at 3.5, 18, 32, 46, 59, 75, and 89 minutes after injection. The 6% perchloric acid was added to each plasma sample, and samples were then centrifuged. The obtained supernatant was subjected to radio-HPLC analysis (column, Finepak SIL C18T, Jasco, Tokyo, Japan; mobile phase, 9:91 acetonitrile/sodium phosphate buffer (100 mmol/L, pH 2.0) and 5 mmol/L sodium octanesulfonate). Plasma protein binding was not determined in the present study. The delay of input function from the appearance of radioactivity in the brain was corrected as previously reported. 30 The measured fraction for L-[β-11C]DOPA and L-[β-11C]OMD were interpolated by fitting with the exponential function, as shown in equations (1 and 2), respectively. 31 The input functions for L-[β-11C]DOPA and L-[β-11C]OMD were calculated with the plasma activity and interpolated fraction.
All MR imaging studies were performed with a 1.5T MR scanner. Three-dimensional volumetric acquisition of a T1-weighted gradient echo sequence produced a gapless series of thin transverse sections (TE: 9.2 milliseconds; TR: 21 milliseconds; flip angle: 30°; field of view: 256 mm; acquisition matrix: 256 × 256; slice thickness: 1 mm).
Regions of Interest
All MR images were coregistered to the PET images with the standard routine ‘Coregister’ in statistical parametric mapping system. 32 We chose the normalized mutual information as objective function in the coregistration. 33 Regions of interest were drawn on coregistered MR images and transferred to the PET images. Regions of interest were defined for the putamen, caudate head, midbrain, parahippocampal gyrus including amygdala, thalamus, anterior region of the cingulate gyrus, frontal cortex, temporal cortex, parietal cortex, and the occipital cortex. Each region of interest was drawn in three adjacent sections, and data were pooled to obtain the average radioactivity concentration for the whole volume of interest.
Metabolite Correction by Modeling for L-[β-11C]OMD
The component of L-[β-11C]OMD in the total radioactivity in each brain region was calculated mathematically by the compartment model analysis proposed by Kumakura et al
16
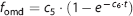
With the assumption of the uniform distribution of OMD around the brain,12, 34 the reference region in which decarboxylation and further metabolism of L-[β-11C]DOPA is negligible was analyzed in the compartment analysis model described in Figure 1. The model is based on the following physiologic constraints:
The ratio (q) of the influx rate constants of L-[β-11C]OMD (K
1
M) and L-[β-11C]DOPA (K
1
D) was fixed to the previously determined value of 1.5 (q=K
1
M/K
1
D=1.5).2, 12, 16, 34, 35
L-[β-11C]DOPA and L-[β-11C]OMD were assumed to have a common blood–brain distribution volume (V
e=K
1
D/k
2
D=K
1
M/k
2
M).
16
Model of the radiolabeled 3,4-dihydroxyphenylalanine (DOPA) and its O-methyl metabolite (OMD) in the reference region in which decarboxylation and further metabolism of DOPA is negligible. The model defines the influx rate constant through the blood–brain barrier (BBB) of DOPA (K1D) and OMD (K1M), and the corresponding rate constants for the efflux to circulation (k2D, k2M).
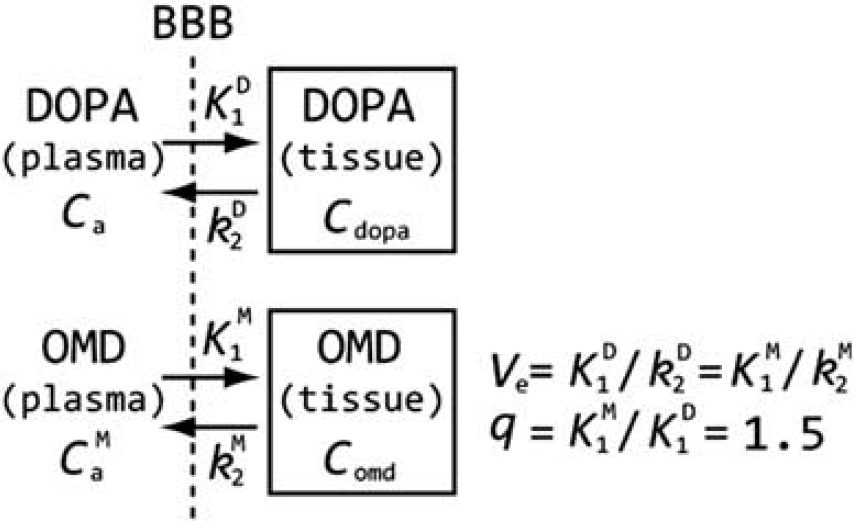
We used the occipital cortex, which has the lowest dopamine concentration 36 and lowest amino-acid decarboxylase activity, 37 as the reference region. The K1D and Ve magnitudes in the reference region were first determined with the plasma input function for both L-[β-11C]DOPA and L-[β-11C]OMD. The K1M and k2M in the occipital cortex were also calculated according to the assumption described above (K1M=q·K1D, k2M=K1M/Ve). Next, TAC for L-[β-11C]OMD in the brain (Comd) was calculated as a convolution of the plasma input function for L-[β-11C]OMD (Cpomd) and the determined K1M and k2M (Eqn. 3).
Finally, the calculated L-[β-11C]OMD TAC was subtracted frame-by-frame from the original dynamic recording.
Graph Plot Analysis
The net dopamine synthesis rate (Ki) was estimated by Gjedde–Patlak analysis21, 22, 23, 24 with plasma input function of L-[β-11C]DOPA and TAC in each region with or without the metabolite correction, as above. In this analysis, Ki values were estimated by linear regression based on the following:
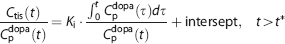
where Ctis is total radioactivity concentration in regions of interest and t∗ is the equilibrium time of the compartment for unchanged radiotracer in the brain tissue. Data after t∗ were used in the linear regression.
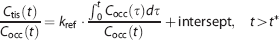
To evaluate the influence of omitting blood sampling and metabolite correction, Gjedde–Patlak analysis with reference region input function was applied to TACs without the metabolite correction. The relative dopamine synthesis rate (kref) was estimated with TAC in the occipital cortex as the reference region with little decarboxylation to dopamine as follows:
The t∗ was set to 29 minutes and data up to 64 minutes and 89 minutes were included in the fit for both the estimation of Ki and kref, as previously reported. 17
Statistical Analysis
Differences between the estimated Ki without and with the metabolite correction were tested using a paired t-test. The correlation of Ki without the metabolite correction and kref to Ki with metabolite correction was also tested by single regression analysis. The R Project for statistical computing (http://www.r-project.org) was used for statistical analyses.
RESULTS
Metabolite Correction
Fraction and input function for L-[β-11C]DOPA and L-[β-11C]OMD in plasma are shown in Figure 2. The mean values of K1M and k2M estimated by the compartment model analysis with TACs in the occipital cortex were 0.0497±0.0101 mL·mL−1· min−1 and 0.0605±0.0061 min−1, respectively. OMD TAC calculated from the determined K1M and k2M is shown in Figure 3. The fraction of the OMD TAC in the total occipital TAC was 16.5±3.4% in area under curve analysis. Uncorrected and metabolite-corrected TACs in representative regions, i.e. putamen, midbrain, and parietal cortex, corresponding to the regions with high, moderate, and low amino-acid decarboxylase activity, 37 respectively, are shown in Figure 4. There were no obvious differences in TAC between without and with the metabolite correction. The OMD fraction in area under curve for the total TAC was within 20% (9.0% to 17.0%, maximum at the midbrain and minimum at the putamen).
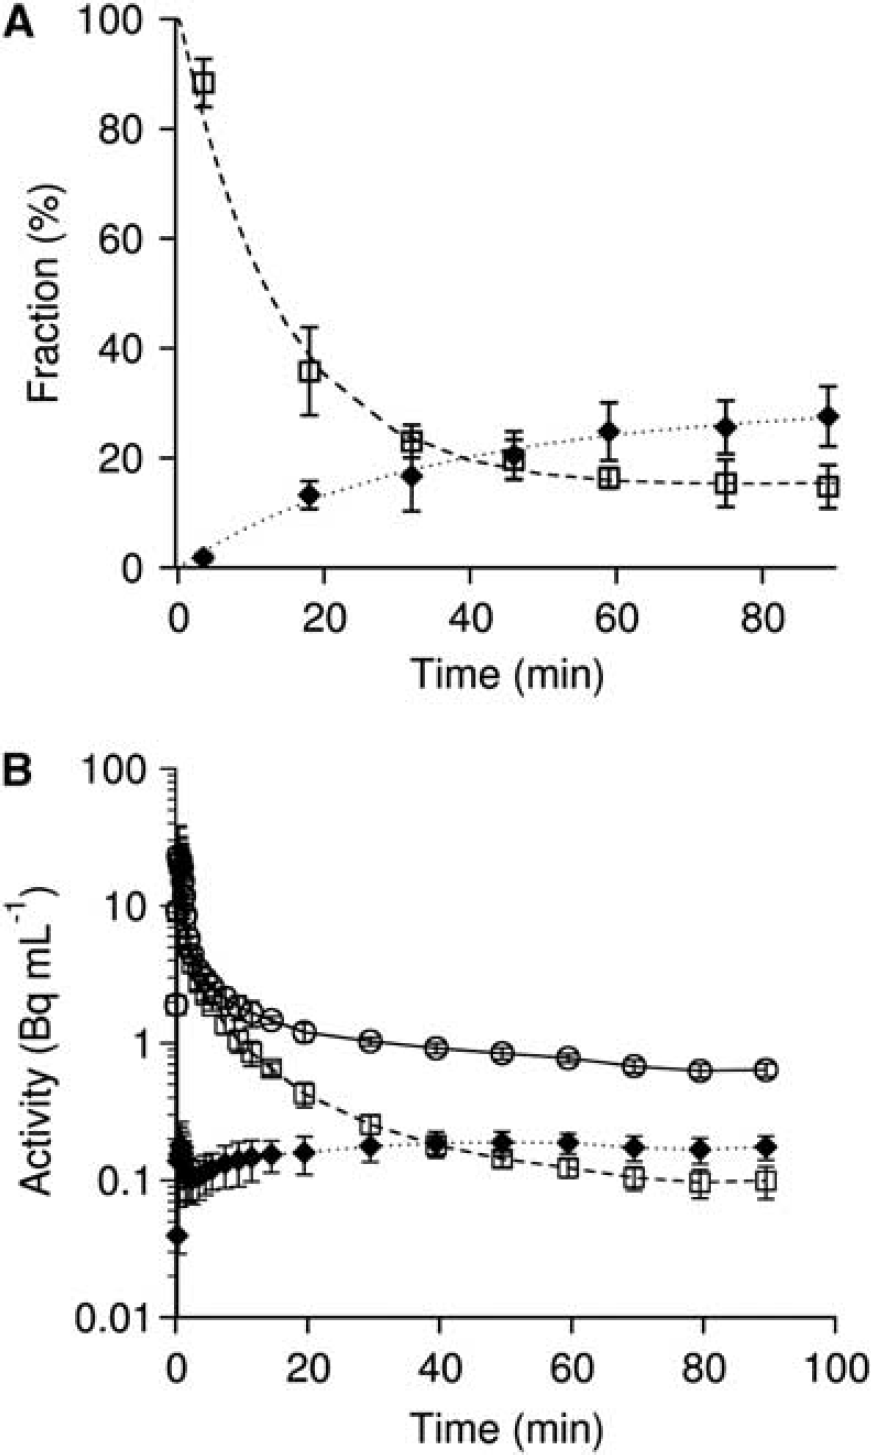
Levels of L-[β-11C]DOPA and L-[β-11C]OMD in the plasma. (
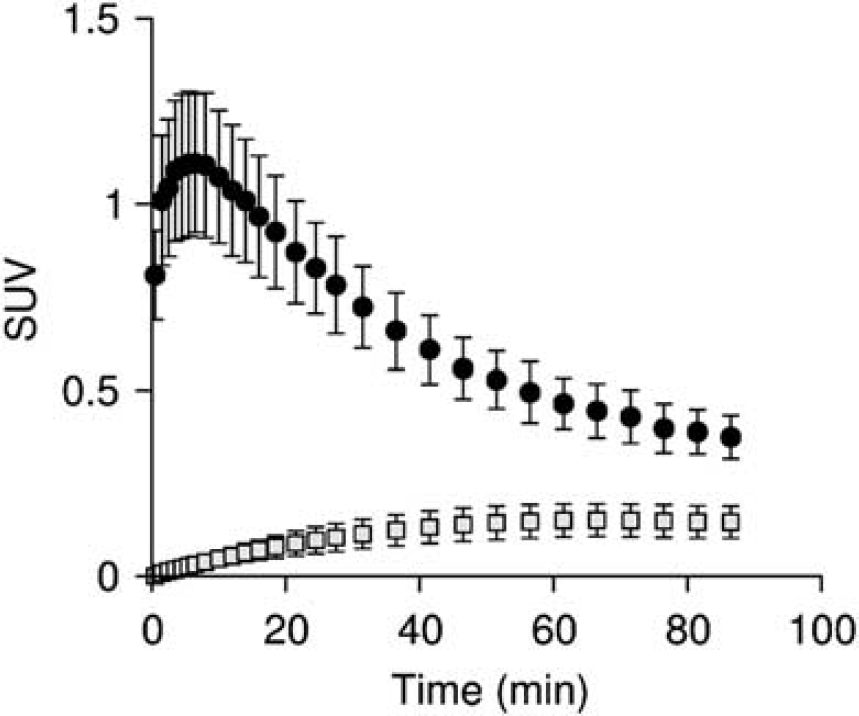
Mean of time-activity curve (TAC) in the occipital cortex (closed circle) and calculated O-methyl metabolite (OMD) TAC (striped square). The radioactivity was normalized with body weight and injected dose, and indicated as standardized uptake value (SUV). Error bars indicate s.d. in 10 normal volunteers.
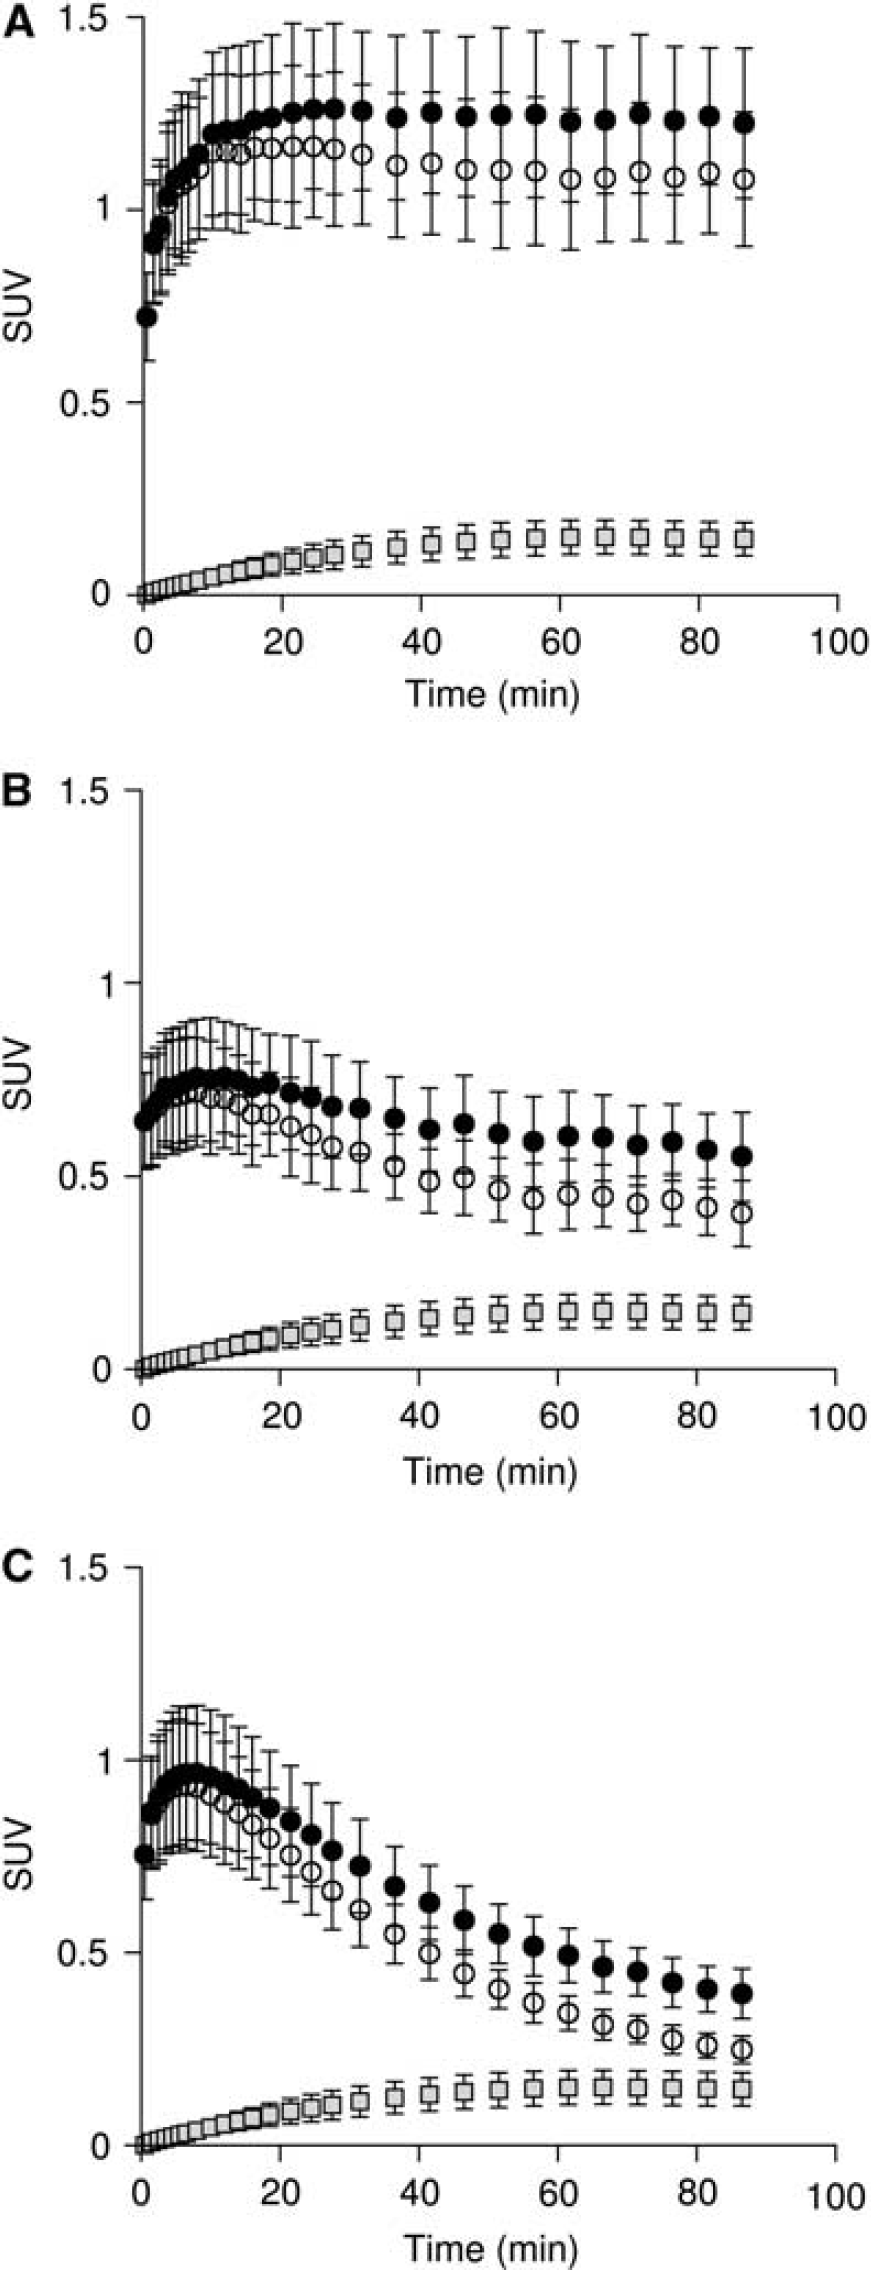
The uncorrected and metabolite-corrected time-activity curves (TACs) in the representative regions with high (putamen (
Graph Plot Analysis
Ki values estimated with and without metabolite correction by Gjedde–Patlak analysis, and kref values estimated by analysis with reference tissue input function, are summarized in Table 1. The scatter plot between Ki with and without metabolite correction is shown in Figure 5. There was a significantly high Ki value without metabolite correction when compared with Ki with metabolite correction (P<0.001, paired t-test, see also Figure 5). Ki with the metabolite correction was significantly correlated with Ki without the metabolite correction (r=1.000, P<0.001 (both 29 to 64 and 29 to 89 minutes)). There was also a significant correlation between kref and Ki with metabolite correction (r=0.986, P<0.001 [29 to 64 minutes]; r=0.9890, P<0.001 [29 to 89 minutes]), as shown in Figure 6.
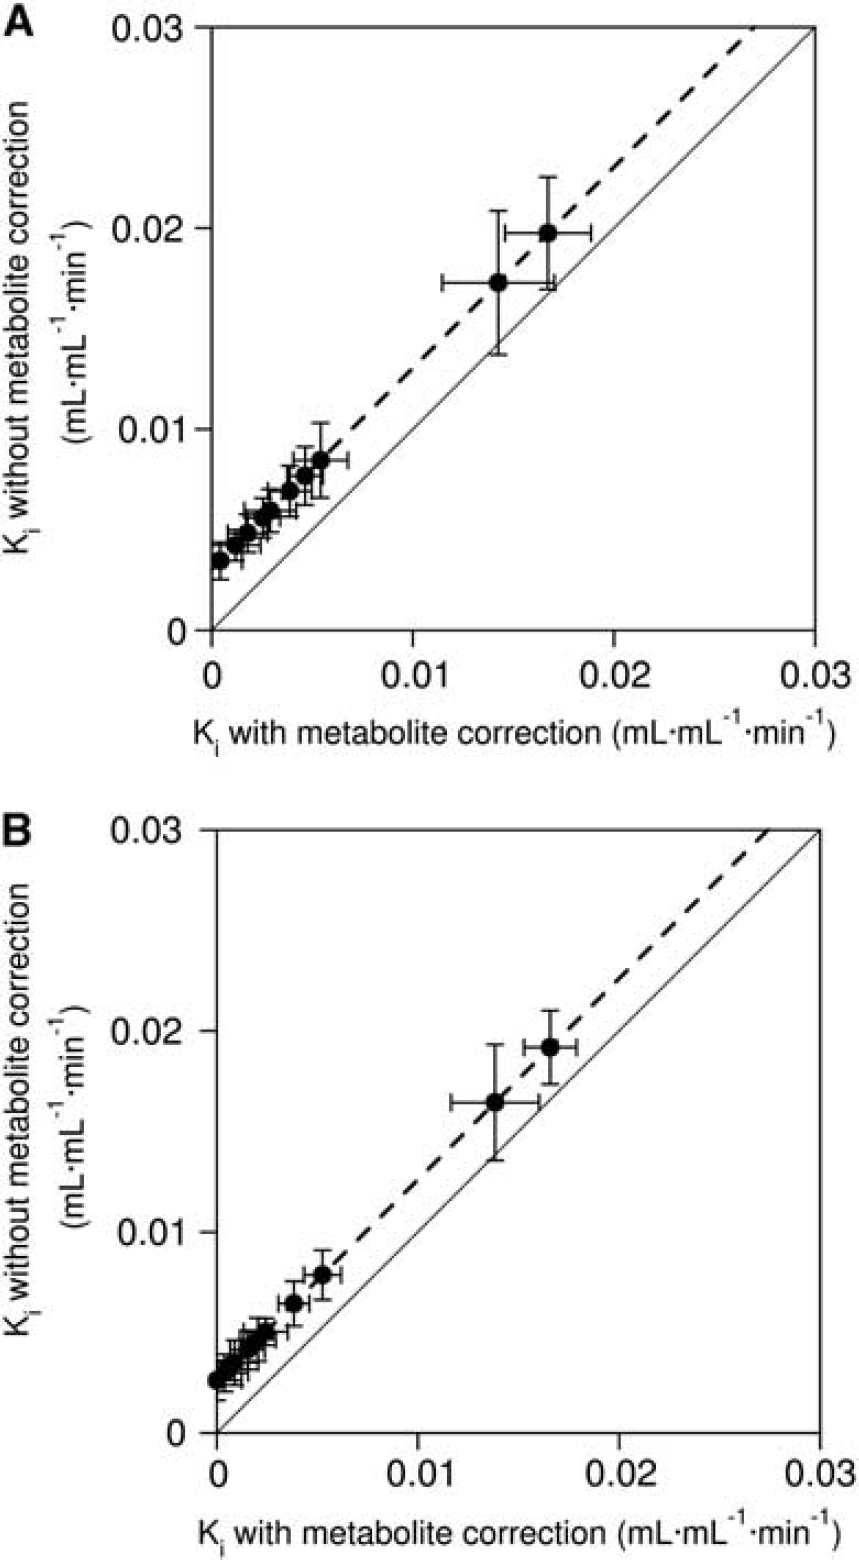
Scatter plot between Ki estimated with and without the metabolite correction, in case to fit data up to (
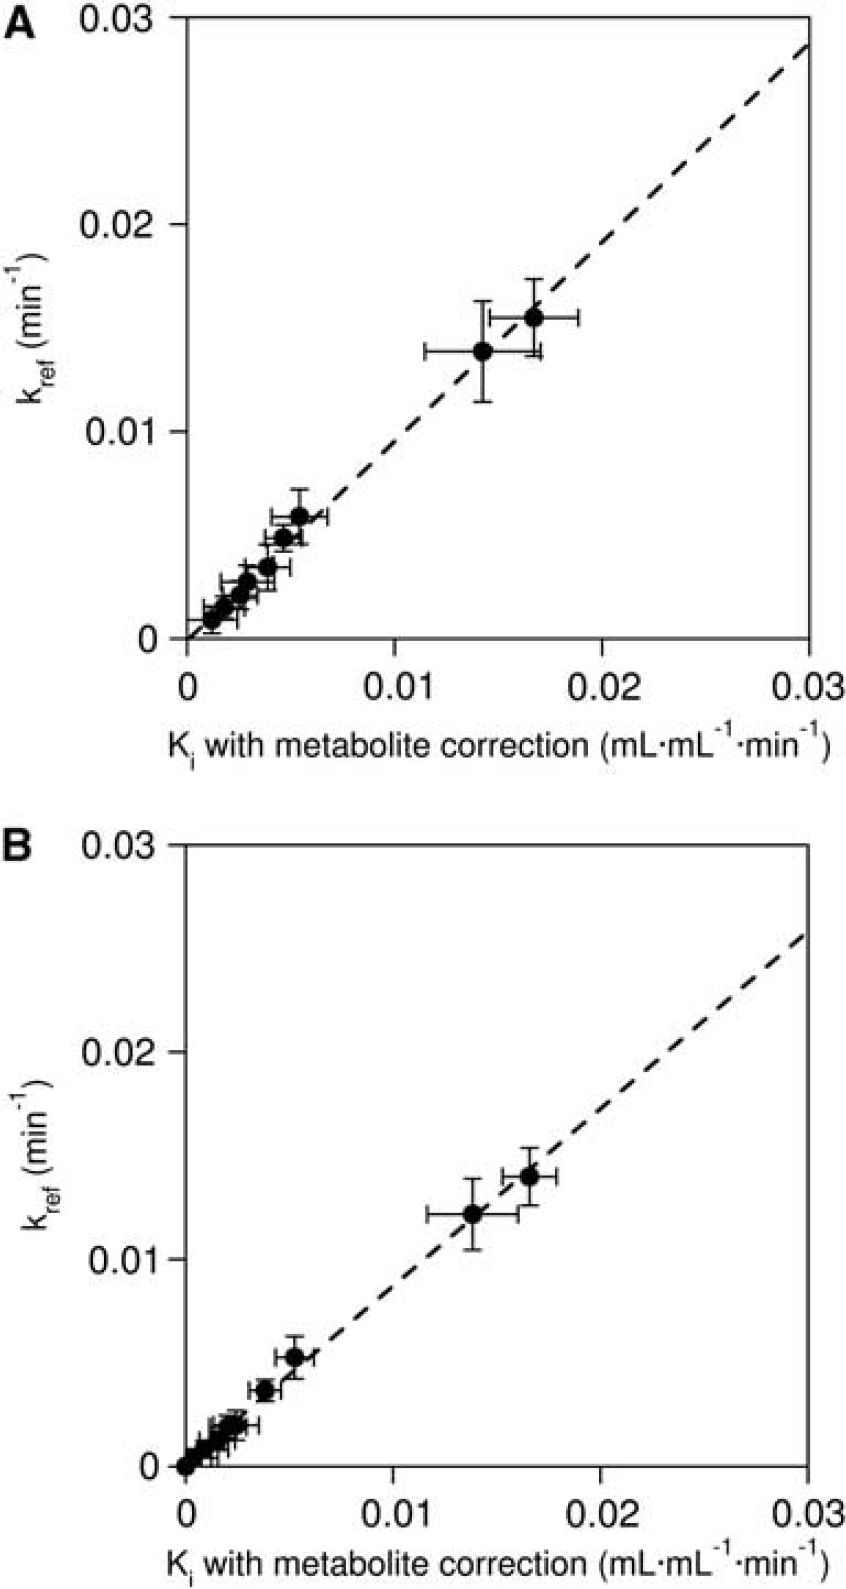
Scatter plot between Ki estimated with the metabolite correction and kref estimated with the reference tissue input function, in case to fit data up to (
Dopamine synthesis rate estimated by Gjedde–Patlak analysis without and with the metabolite correction, and Gjedde–Patlak analysis with reference tissue input function
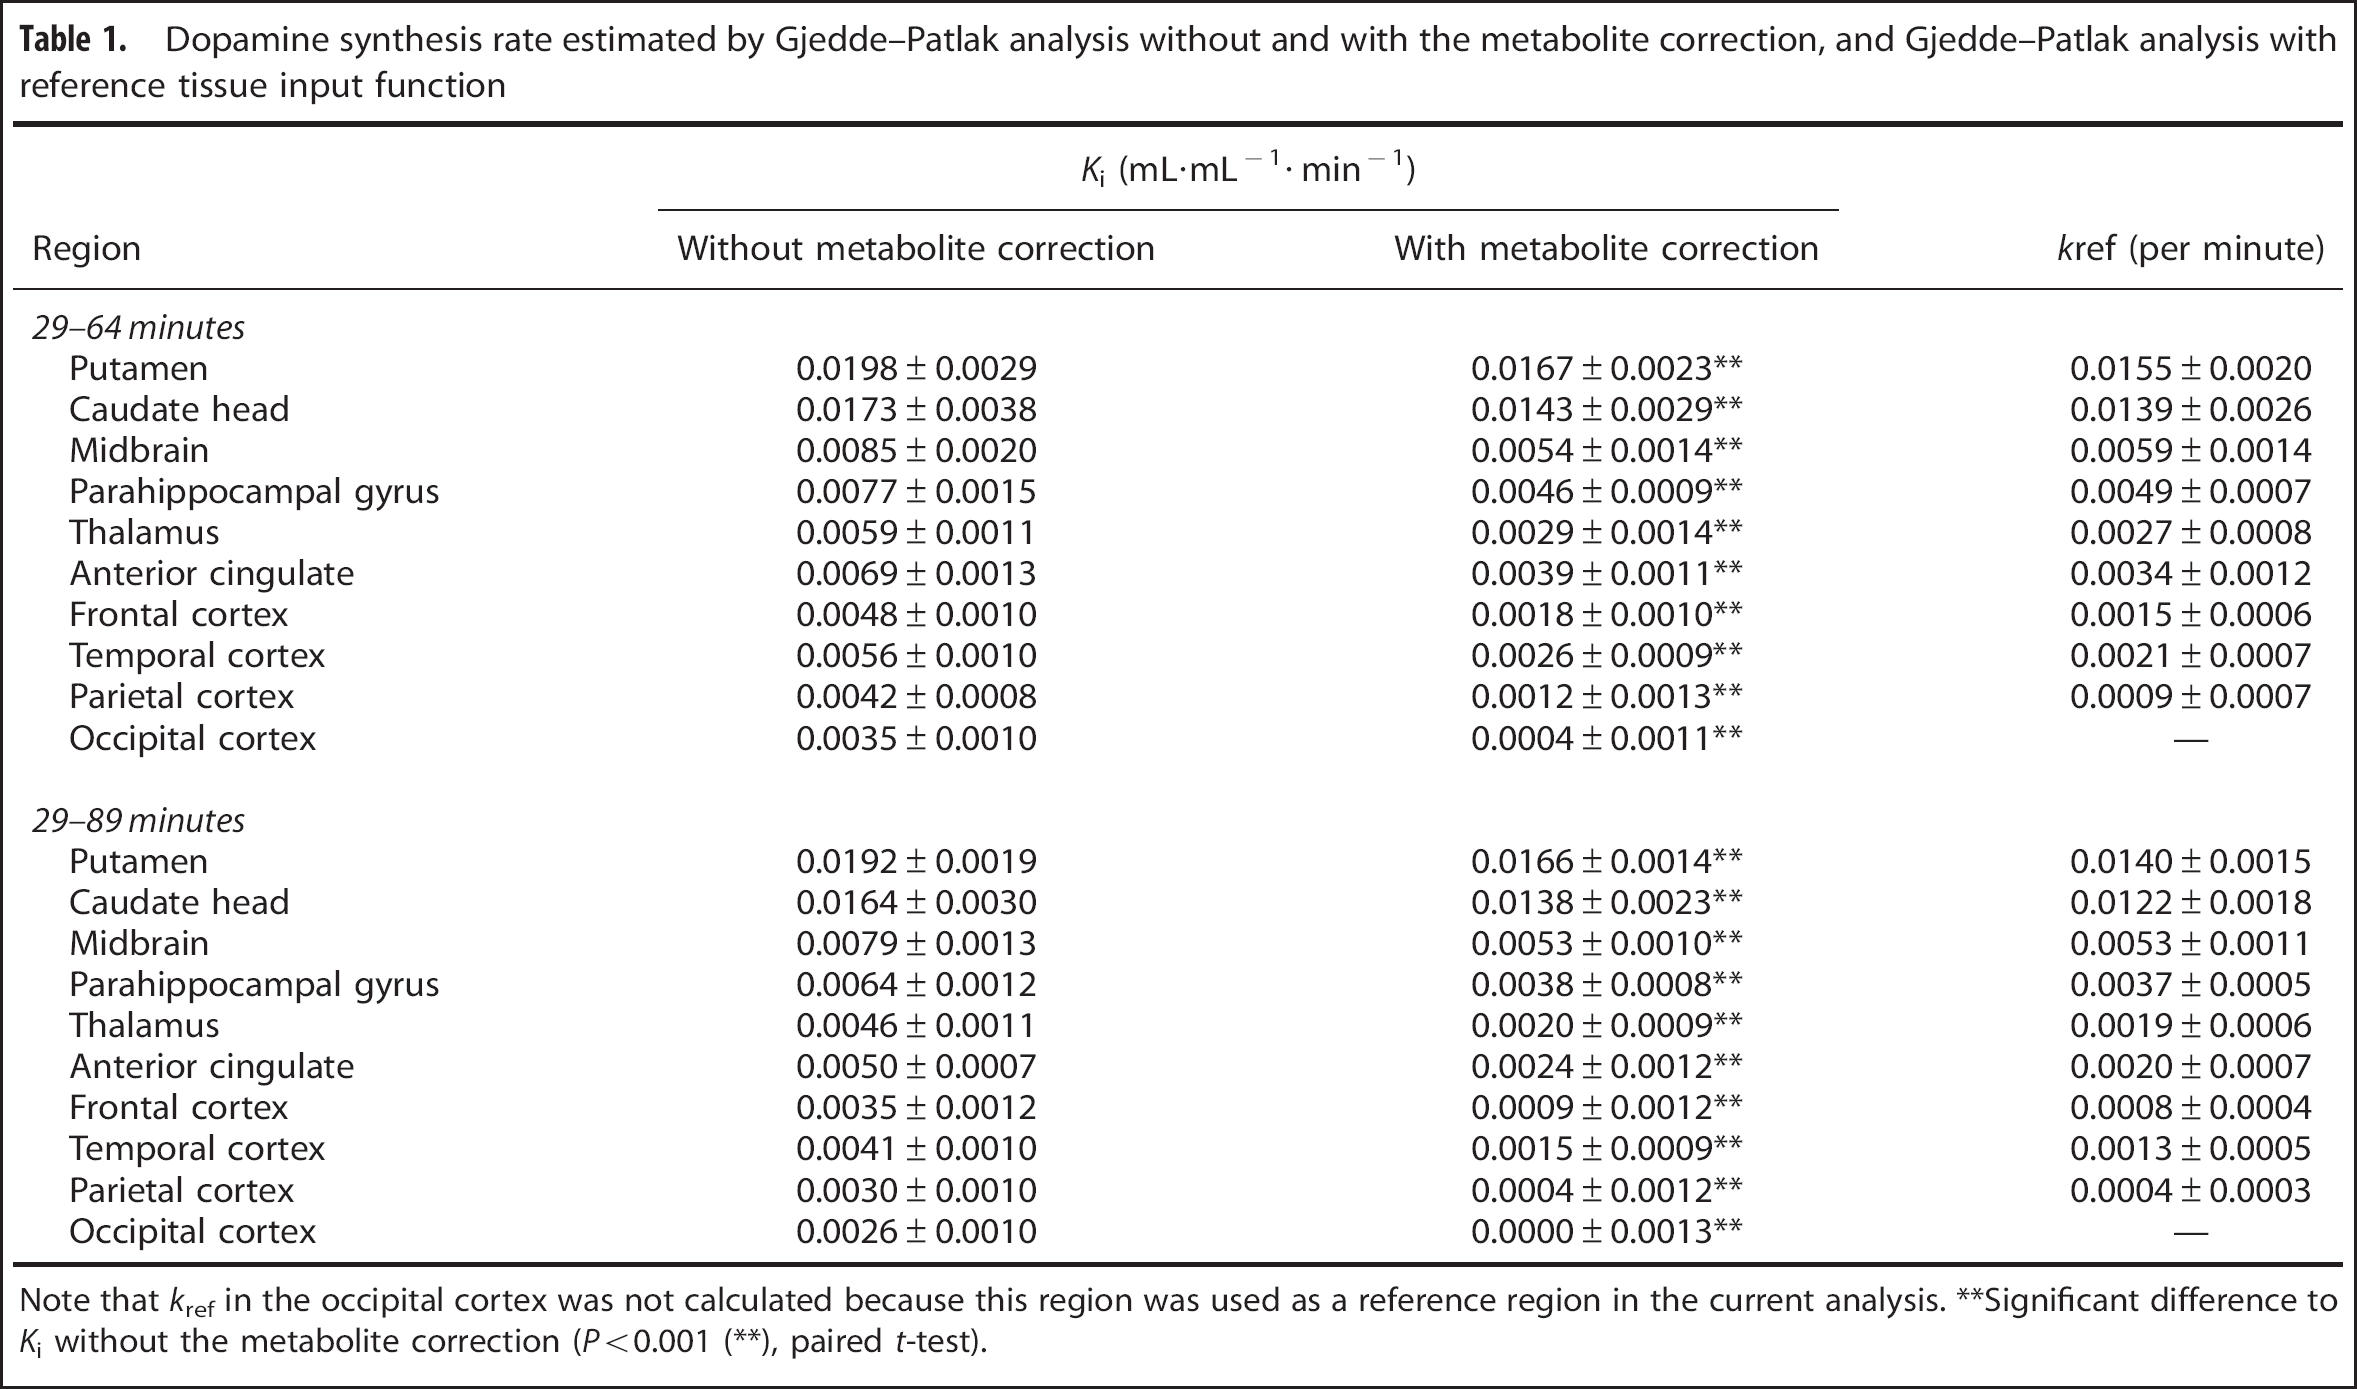
Note that kref in the occipital cortex was not calculated because this region was used as a reference region in the current analysis.
Significant difference to Ki without the metabolite correction (P<0.001 (∗∗), paired t-test).
DISCUSSION
We mathematically estimated the component for L-[β-11C]OMD in the brains of normal volunteers injected with L-[β-11C]DOPA using the method proposed by Kumakura et al. 16 We found that the metabolite correction accounted for 10% to 20% of L-[β-11C]OMD in tissue TACs acquired from human L-[β-11C]DOPA PET data. These results agree with a previous rat HPLC study (17% and 27% in striatum and cerebellum, respectively), 12 and suggest that the contribution of L-[β-11C]OMD to tissue radioactivity in human L-[β-11C]DOPA PET data are marginal. These findings support the advantage of L-[β-11C]DOPA relative to [18F]FDOPA PET data in terms of the metabolites.
We found a significant linear relation between net influx rate constant Ki with and without metabolite correction, and a significant correlation between kref estimated by Gjedde–Patlak analysis with reference tissue input function and Ki with metabolite correction. These findings suggest that kref can sufficiently reflect the dopamine synthesis capacity without acquisition of arterial input function and metabolite correction in L-[β-11C]DOPA PET. These results agree with previous findings in a monkey L-[β-11C]DOPA PET study using an inhibitor of COMT, an enzyme required for O-methylation to L-[β-11C]OMD. 8
The higher Ki value without the metabolite correction compared with that with metabolite correction demonstrates overestimation of Ki by omitting the metabolite correction, assuming that the metabolite-corrected Ki reflects only true influx, efflux, and decarboxylation of L-[β-11C]DOPA. The difference of Ki between without and with metabolite correction may reflect the influx and efflux of L-[β-11C]OMD. These findings suggest that the metabolite correction in Gjedde–Patlak analysis with the arterial input function should be implemented.
The metabolite correction used in the present study assumes some physiologic constraints, as follows: (i) q, the ratio of the influx rate constants of L-[β-11C]OMD and L-[β-11C]DOPA (K1M/K1D), was fixed to the previously determined value of 1.5;2, 16, 35 (ii) L-[β-11C]DOPA and L-[β-11C]OMD have a common blood–brain distribution volume (Ve=K1D/k2D=K1M/k2M); (iii) the rate constant for decarboxylation of L-[β-11C]DOPA (k3) in the reference region is assumed to be zero; and (iv) the distribution of L-[β-11C]OMD is uniform around the brain. For assumption (iii), we used the occipital cortex as the reference region, as this region is known to have the lowest dopamine concentration and amino-acid decarboxylase activity.36, 37 The uniformity of the distribution of L-[β-11C]OMD was also validated in a previous study, 12 as well as that of 18F-labeled OMD ([18F]OMFD). 34 To our knowledge, there are no reports of our assumption (i) and (ii) for L-[β-11C]DOPA, although these assumptions have been reported for [3H]DOPA and [18F]FDOPA. The q value utilized in our study (q=1.5) was previously reported for [3H]DOPA 35 and [18F]FDOPA.2, 16 In addition, we confirmed that the OMD TAC does not change drastically even if q value is set to the other value to 1.5 (see Supplementary Information). Evidence of a common distribution of L-[β-11C]OMD in the cortex has been also demonstrated in [18F]FDOPA studies.2, 34, 38 Furthermore, the fraction of tissue L-[β-11C]OMD calculated in the present study agrees with that previously reported.2, 12, 34, 38 These findings support the validity of the metabolite correction and its results used in the present study.
It should be noted that the contribution of L-[β-11C]OMD to the estimation of dopamine synthesis rate is expected to be larger in [18F]FDOPA PET than L-[β-11C]DOPA PET. A high fraction of [18F]OMFD in tissue radioactivity after injection of [18F]FDOPA relative to L-[β-11C]DOPA was reported.11, 13, 39 Moreover, the distribution of acidic metabolites of [18F]FDOPA from the striatum was found after mathematical correction, 16 such as the one implemented in this study. This finding contrasts with the small difference of TAC between without and with the metabolite correction in the present study. Thus, the differences in tracer kinetic between L-[β-11C]DOPA and [18F]FDOPA are important considerations in PET studies. We should also consider the advantage of [18F]FDOPA in terms of longer half-life than L-[β-11C]DOPA as well as the tracer kinetic when we choose the tracer.
We also examined the influence of L-[β-11C]OMD in tissue for estimation of the net dopamine synthesis rate in L-[β-11C]DOPA PET data from normal human volunteers. However, the contribution of L-[β-11C]OMD can vary in patients with neurologic disease. For example, a previous human [18F]FDOPA PET study demonstrated a reduction of the rate constant for clearance of [18F]OMFD from plasma in elderly normal volunteers and patients with Parkinson's disease. 16 Further studies of patients with neurologic diseases are required to determine the influence of L-[β-11C]OMD to the estimation of dopamine synthesis capacity in a wide range of patients.
Our findings provide further support for the use of L-[β-11C]DOPA PET, in which the L-[β-11C]OMD of L-[β-11C]DOPA can be negligible. 8 These findings in this article also support the advantage of L-[β-11C]DOPA, the smaller contribution of L-[β-11C]OMD than [18F]FDOPA. Furthermore, the finding that the dopamine synthesis rate can be quantified sufficiently by kref estimated with reference input function also supports the methodological validity of previous L-[β-11C]DOPA PET studies applying Gjedde–Patlak analysis with reference input function.9, 10 Because of the simple and non-invasive procedure after omission of blood sampling, Gjedde–Patlak analysis with reference input function has been widely utilized to investigate the presynaptic function of dopamine neurons, including pathophysiological and clinical studies in patients with various neurologic diseases1, 4, 5, 9, 10, 18, 20, 40, 41, 42 and in pharmacological studies.9, 19 We believe that our study provides a further advance for the use of L-[β-11C]DOPA PET to investigate dopamine synthesis capacity.
In conclusion, by implementing the metabolite correction with mathematical modeling, we found a marginal effect of L-[β-11C]OMD on the estimation of dopamine synthesis rate in L-[β-11C]DOPA PET. We also found that kref estimated by Gjedde–Patlak analysis with reference input function could sufficiently estimate the net dopamine synthesis rate without metabolite correction. By contrast, not correcting for L-[β-11C]OMD can lead to an overestimation of Ki in Gjedde–Patlak analysis with arterial input function. We believe that these findings support the methodological validity of previous L-[β-11C]DOPA PET studies and provide a further advance for the use of L-[β-11C]DOPA PET to investigate dopamine synthesis capacity.
Footnotes
References
Supplementary Material
Please find the following supplemental material available below.
For Open Access articles published under a Creative Commons License, all supplemental material carries the same license as the article it is associated with.
For non-Open Access articles published, all supplemental material carries a non-exclusive license, and permission requests for re-use of supplemental material or any part of supplemental material shall be sent directly to the copyright owner as specified in the copyright notice associated with the article.