
Abstract
Optical approaches to investigate cerebral function and metabolism have long been applied in invasive studies. From the neuron cultured in vitro to the exposed cortex in the human during neurosurgical procedures, high spatial resolution can be reached and several processes such as membrane potential, cell swelling, metabolism of mitochondrial chromophores, and vascular response can be monitored, depending on the respective preparation. The authors focus on an extension of optical methods to the noninvasive application in the human. Starting with the pioneering work of Jöbsis 25 years ago, near-infrared spectroscopy (NIRS) has been used to investigate functional activation of the human cerebral cortex. Recently, several groups have started to use imaging systems that allow the generation of images of a larger area of the subject's head and, thereby, the production of maps of cortical oxygenation changes. Such images have a much lower spatial resolution compared with the invasively obtained optical images. The noninvasive NIRS images, however, can be obtained in undemanding set-ups that can be easily combined with other functional methods, in particular EEG. Moreover, NIRS is applicable to bedside use. The authors briefly review some of the abundant literature on intrinsic optical signals and the NIRS imaging studies of the past few years. The weaknesses and strengths of the approach are critically discussed. The authors conclude that NIRS imaging has two major advantages: it can address issues concerning neurovascular coupling in the human adult and can extend functional imaging approaches to the investigation of the diseased brain.
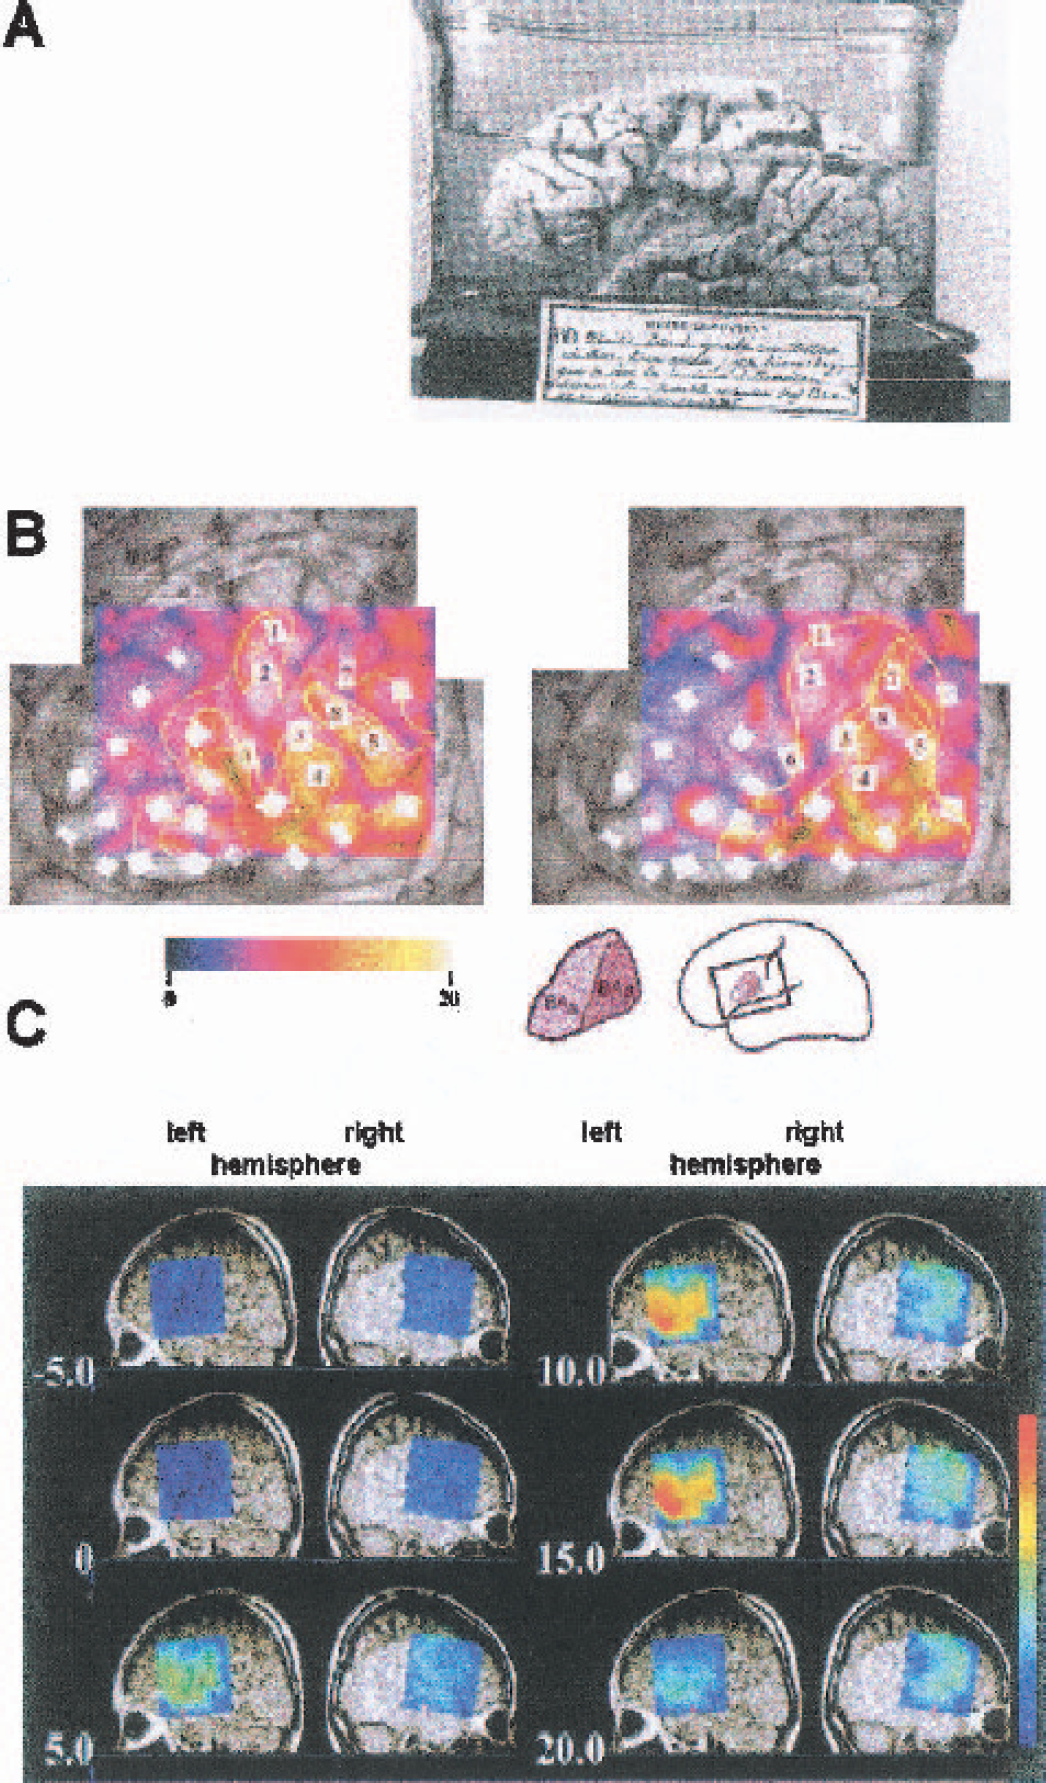
The first investigations into the functional anatomy of the human cerebral cortex were based on lesion studies. The role of specific cortical areas involved in a specific task was inferred by comparing a patient's dysfunction to the lesion seen at autopsy (Fig. 1A). Whereas initially only electrophysiologic techniques allowed noninvasive functional studies of the human brain, the advent of modern imaging techniques such as functional magnetic resonance imaging (fMRI) and positron emission tomography (PET) have increasingly dominated the field during the past decade. The great advantage is the spatial resolution, which for fMRI is steadily improving and may even allow the differentiation of different cortical layers. There is an increasing need, however, for a better understanding of the signal physiology, in particular of blood oxygenation level-dependent (BOLD) contrast, since the basic principles of the coupling between the neuronal and the vascular response to functional stimulation are still not fully understood (Villringer and Dirnagl, 1995).
Three approaches to the functional-anatomic research into language areas.
In the present article we focus on noninvasive imaging approaches in the human using light. Near-infrared spectroscopy (NIRS),* the technique on which such imaging approaches are based, has been covered in previous articles that reviewed its potential to detect changes in cerebral oxygenation in response to functional stimulation (Obrig and Villringer, 1996; Villringer and Chance, 1997). The method also relies on the vascular response to a stimulus to define cerebral activation. In brief, functional NIRS (fNIRS) studies are founded on the fact that changes in hemoglobin content and oxygenation are related to the regional cerebral blood flow (rCBF). An increase in rCBF disproportional to the increase in oxygen metabolism results in a focal hyperoxygenation (Fox and Raichle, 1986), reflected in an increase in the concentration of oxygenated hemoglobin accompanied by a decrease in the concentration of deoxygenated hemoglobin (Obrig et al., 2000b).
By and large, NIRS approaches have relied on sampling one site, or a few, on the head. Hence, localization was restricted to rough specifications of the cortical area under investigation, somewhere between the division into lobes and gross functional divisions into primary and secondary areas. During the past few years, however, different groups have developed systems that produce low-resolution oxygenation images of an area covering up to 10 × 10 cm on the surface of the head (Fig. 1C). These imaging approaches are the focus of the present review. They are noninvasive and use light in the spectral range between 650 and 950 nm. Optical imaging, however, is not a novel approach. If the cortex is exposed, high-resolution images of the cortical surface can be generated using invasive approaches. These approaches combine an excellent spatial and a good temporal resolution and have been shown to detect changes linked to the neuronal, metabolic, and vascular responses to functional stimulation (Fig. 1B).
Here, we proceed from a broad description of the major results of the invasive techniques to a focus on the noninvasive techniques, which can be performed exclusively in the near infrared. By differentiating between the “visible” and the “invisible” approaches we intend to highlight the fact that the latter are investigating cortical tissue covered by 1 to 2 cm of highly scattering biologic tissue. These techniques are thereby limited to a rather narrow spectral window of 650 to 950 nm in the invisible part of the spectrum. When compared with other noninvasive functional imaging techniques, NIRS produces a blurry image of lesser functional anatomic value, but this disadvantage may be balanced in part by a good temporal resolution, a high specificity as to the parameters monitored, and the rather undemanding technical requirements, lending itself to investigations in comparatively “natural” environments including at the patient's bedside. Even though the exquisite spatial resolution of optical techniques when applied to exposed tissue may not be reached, progress in the technology will augment “visual acuity.” The noninvasive approaches, therefore, may finally serve as a link. They may help to bridge the gap between functional imaging and the patient's bedside, and they may link the high-resolution optical images of invasive techniques to the investigation in the human. Intraoperative optical imaging as has been performed by a few groups (e.g., Fig. 1B) is one of the major pillars of such an attempt.
THE VISIBLE
Changes in optical properties have long been known to reflect changes in the functional state of neuronal tissue (Hill and Keynes, 1949). This fact has led to the development of several different techniques monitoring neuronal processes at grossly different spatial and temporal scales, extending from microscopic structural changes (Tasaki and Byrne, 1994), the release of transmitter quanta, (Murthy, 1999) and the axonal spread of action potentials (Svoboda et al., 1997) to changes of a much larger spatial and temporal scale, as induced by changes in regional blood flow (rCBF) (Mayhew et al., 2001). Whereas many of the approaches use dyes to visualize changes (e.g., voltage changes), the investigation into “intrinsic optical signals” (IOSs) has been recognized as permitting the monitoring of different neuronal processes and being at the same time less invasive. The term IOS has been ambiguously used.† In the present article we use IOS method to refer to all approaches not involving dyes.‡ We provide a brief overview of the many studies that have been performed to study IOSs in isolated neuronal structures, brain slices, and the cortex exposed in vivo.
Neuronal structures (giant axons, nerves)
In the isolated nerve of a shore crab Hill and Keynes (1949) reported on an increase in light scatter over some 20 seconds, followed by a slower decrease in scatter peaking about 120 seconds after electrical stimulation of 5 seconds. Whereas these optical signals had an exceptionally slow time-course, the time courses of action potentials, on the order of milliseconds, are likewise paralleled by change in optical parameters. Preparations of single giant neurons, mainly of the squid, enabled the investigation into action potential propagation. These preparations also allowed for the comparison between several optical parameters, such as retardation,§ scattering, volume changes, and electrophysiologic parameters, in particular membrane potential and current. By manipulating the bathing solution, theories on the ionic origin of such changes were examined. Cohen et al. (1971) report a simple quadratic relation between membrane potential and retardation, whereas changes in scattering were found to reflect changes in both in current and membrane potential (Cohen et al., 1972). The latter view is not supported by more recent reports (Stepnoski et al., 1991). This is potentially owing to the very large isolated neurons under investigation in the earlier work. (For review of the earlier work on single neurons, see Cohen [1973].) By comparing the response evoked by electric stimulation under alterations of the ionic composition of the bathing solution, a slow and fast component of optical parameters and configuration in the isolated olfactory nerve of the garfish have been attributed to Ca and Na/K changes, respectively. Both components are on the order of milliseconds and correlate with the electrical changes (Tasaki and Byrne, 1994). Similarly fast optical changes were described in isolated neurons of Aplysia by Stepnoski et al (1991). They showed a linear correlation between scattered light and changes in membrane potential over a range of ∼200 mV, and the preparation of the cultured neuron additionally provided information on the behavior of such a fast response in different sections of the neuron. For the much slower response (on the order of seconds), also stemming from scatter changes but not correlated to the time course of individual electrophysiologic events, a recent study by MacVicar et al. (2002) has shown the importance of nonneuronal cells. Comparison between the optic nerve from one intact eye and one eye enucleated in early life in the rat, the IOSs during stimulation is in part explained by astrocyte swelling induced by a NA/K-2CI cotransporter.
Brain slice preparations
The examination of brain slices provides a closer prediction of the changes in optical properties that may be expected in vivo in the intact brain. As with isolated nerves and neurons, however, there is no opportunity for hemodynamic changes to influence the signals. In these preparations, therefore, the origin of IOSs is related to scatter changes unless a change in absorption is expected by the cytochromes' redox state. Some preparations allow for a differentiation between scatter and absorption changes by comparing reflectance and transmission ∥ (Aitken et al., 1999). Several studies have reported that an increase in cell volume leads to a decrease in reflectance. The signal mostly referred to develops in the order of seconds and is thereby sluggish when compared with the electrophysiologic response and temporally more similar to the vascular response discussed further on. With respect to functional stimulation, an example of early work is the study of Lipton (1973) using pulsed electrical stimulation (60 Hz 10V) leading to a decrease in reflectance with a latency of some seconds. Although vascular changes can be excluded as candidates for the optical changes monitored, the many studies performed in bloodless slice preparations have shown that several different mechanisms underlie the IOSs in slices. MacVicar and Hochman (1991) find IOSs related to synaptic activity induced by Schaffer collateral stimulation in hippocampal slices. From the distribution of the changes and their pharmacological modulation, MacVicar and Hochman infer the underlying physiologic process being detected is potassium-related glial swelling, which begins 2 to 3 seconds after stimulus onset, peaks at 6 seconds, and resolves some 20 seconds after stimulus cessation. Intrinsic optical signal changes in response to hypoxia have been attributed to both cell and mitochondrial swelling (Haller et al., 2001), whereas the option to monitor extracellular space by IOS changes in the slice has been established by Witte et al. (2001) and Holthoff and Witte (1998). The IOS response to electrical stimulation has been shown to increase linearly with stimulus intensity. In this preparation, however, it is slightly faster than the one reported previously, peaking at 3 seconds and decaying with a time constant of 23 seconds (Holthoff et al., 1994). Similarly, IOS change was found to linearly correlate with excitatory post-synaptic potential (which does not hold true for the local field potential). Unfortunately, the time course of the optical response in not reported, but most probably the slow scatter changes are analyzed (Cerne and Haglund, 2002). It has been highlighted by Buchheim et al. (1999) that response direction of the IOS is not uniform in conditions leading to changes in extracellular space. In the adult rat brain slice they have shown that, for spontaneous neuronal hyperactivity, transmission changes have an opposite response direction, depending on whether the discharges represent synaptic or nonsynaptic mechanisms (Fayuk et al., 2002). Aitken et al. (1999) have differentiated between 4 subtypes of IOS responses, that is, responses to (1) synaptic activation, (2) hypoxia, (3) classical normoxic spreading depression, and (4) those stemming from osmolarity changes in the bath. The underlying mechanisms are cell swelling (inversely correlated to the extracellular space) and swelling of cell organelles, in particular, mitochondria (not influencing the extracellular space). Another potential explanation for the diverging results under different perturbations of the slice is an artefact that has been discussed under the heading “lensing effect” but cannot explain the full range of findings (Kreisman et al., 1995).
In sum, studies of bloodless preparations, from the neuron to the slice, report on changes in optical parameters with different latencies. There is a very fast component, which develops in parallel to the electrical potential change across the neuron's membrane (with a contribution of the current, which is still controversial). There is a second component, however, which is much slower, developing through some 3 to 6 seconds and resolving with a latency of some 20 seconds after cessation of the stimulus. This slower component is often referred to exclusively by the term IOS. Its physiologic origin is as yet not fully clear. The candidates are shifts in the extra- and intracellular ion concentrations, as well as accompanying shifts in water content or the resulting changes in extracellular space. The role of the nonneuronal cells in slice preparations (glial swelling) has also been pointed out in the literature.
Exposed cortex
The use of optical imaging for visualization of functional activation in the exposed cortex without application of dyes has been greatly developed by the groups of Grinvald Blasdel and Frostig (Blasdel, 1989; Grinvald et al., 1984, 1986; Masino et al., 1993). Whereas PET and fMRI may dominate the noninvasive research in human brain function, in invasive approaches the IOS has become an excellent tool to image cortical function with an exquisite spatial (μm) resolution (Ts'o et al., 1990).¶ Over the past years the acuity of such maps has greatly increased, and the IOS can be considered a gold standard when functional topographical knowledge on the visual system is investigated invasively (Blasdel and Campbell, 2001). Also, by improving cranial window preparations, long-term investigation into the stability and plasticity of cortical representations has become feasible (Shtoyerman et al., 2000). Optical imaging has the advantage of ease of assessment of functional changes in a larger area with high resolution and with a much higher spatial specificity than the electrophysiologic methods. (Single-unit recordings may pinpoint activity in the smallest functional entity of the brain. Even if several cells are monitored in succession, however, the localization within certain cortical regions can be reliably assessed only when correlated to macroscopic anatomic features—that is, by histology performed at the end of the experiment.)
In contrast, recent years have seen vivid discussion as to the origin of the IOS. The question, not even fully answered for bloodless slice preparations, is even more complex when the vascular response is added into the system. The matter is further complicated by the fact that the vascular response shares temporal features with the response based on the slow scatter changes. One methodological approach to this riddle is spectroscopy.
For different wavelengths, the magnitude and time course of the IOS changes were found to differ. Several studies (e.g., Grinvald et al., 1991) have reported a biphasic time course for the shorter wavelengths. Analyzing the spectrum of the reflectance changes, two different components of the vascular contribution to the intrinsic signal, differentiating between changes in oxygenation and in blood volume, have been postulated (Frostig et al., 1990). The findings were further explored by a spectroscopic approach, in which lines of the image were sequentially analyzed by optical spectroscopy (Malonek and Grinvald, 1996). The results yielded a theory postulating an initial increase in concentration of deoxygenated hemoglobin (deoxy-Hb). This initial feature of the vascular response was of even more interest because, besides its higher temporal resolution, it was found to be more localized than the “classical” hyperoxygenation (Fox and Raichle, 1986) in its succession. The theory has been supported by direct measurement of the focal oxygen tension (Vanzetta and Grinvald, 1999); it remains controversial, however, since several investigators could not reproducibly find the “initial dip” in optical (Lindauer et al., 2001) and in fMRI (Fransson et al., 1998) studies. The term “dip” originates from the fact that the initial increase in deoxy-Hb is paralleled by a BOLD-contrast decrease as has been reported by some fMRI groups, especially at higher field strengths (Menon et al., 1995; Hu et al., 1997). The debate over the existence of a dip and its potential relevance for issues of neurovascular coupling is far from being resolved (for excellent coverage of the different views, see NeuroImage, Vol. 13, 953–1015, 2001 [Buxton, 2001; Jones et al., 2001; Lindauer et al., 2001; Vanzetta and Grinvald, 2001]). At present there is no explanation for the contradictory results of the two groups of researchers using very similar physiologic and analytical models (Jones et al., 2001; Lindauer et al., 2001), but the controversy has made it clear that an in-depth analysis of the signal is necessary and that this may lead to elucidation of differing physiologic processes.
Closely linked to changes in blood flow is the physiology of cellular oxygen metabolism. In vitro the well-established mechanisms of the respiratory chain have been mostly elucidated by optical methods, a fact reflected in the very term: cytochromes (for review see Chance, 1991). The transfer into in vivo research, however, is not trivial. Some work has been dedicated to characterizing the in vivo spectrum of cytochrome oxidase in vivo (Cooper et al., 1996; Cooper and Springett, 1997). In addition, dual-wavelength spectroscopy has been applied to study spontaneous oscillations in cytochrome-oxidase redox state (Vern et al., 1997, 1998), and evidence of a change in the redox state of cytochrome oxidase in response to functional stimulation has been put forward from both animal (LaManna et al., 1987) and human studies (Heekeren et al., 1999). Finally, the issue has been explored by an imaging approach by Mayhew et al. (1999) The investigators, however, do not find evidence for an increase in cytochrome-oxidase oxidation with short somatosensory stimulation in the rat (Mayhew et al., 1999). Interestingly, the study also shows that some discrepancies concerning these issues—the cytochrome-oxidase redox state and the initial deoxygenation—may be related to the aforementioned slow spontaneous oscillations, known as vasomotion or low-frequency oscillations (Mayhew et al., 1996). These spontaneous oscillations may be of relevance to fMRI (Biswal et al., 1995, 1996) and have also been examined by noninvasive optical methods in the human (Obrig et al., 2000a).
Beyond these controversies are several other relevant issues that have been examined by intrinsic signals in the exposed brain preparation. Deviation from linearity of the response has been shown by varying the frequency and number of successive stimuli, which alters latency and magnitude of the response, in a whisker-stimulation study in the rat (Blood et al., 1995). In addition, by combining stimulation of whisker and forelimb, two studies have elegantly highlighted the relevance of vascular anatomy to the spatial extent of the vascular response, while demonstrating a vascular “overspill” when two distinct cortical representations are activated (Blood et al., 2002; Blood and Toga, 1998).
With respect to the relation between the electrophysiologic and the optically assessed responses, the IOS method has shown signal changes beyond the representation of receptive fields, as defined by electrophysiologic parameters. Peterson et al. (1998) find a greater sensitivity of the IOS method for weak somatosensory stimuli when compared with multiunit recording. Although there are several potential candidates for this difference in the maps acquired by single-unit recordings, subthreshold activity in dendrites is thought to cause more than half of the maximal IOSs in visual cortex (Toth et al., 1996). Another difference was reported by Cannestra et al. (1998b), who found a difference between the stable amplitude of evoked potentials (acoustically and somatosensory evoked potentials [AEP/SEP]) as opposed to a “refractory period” when auditory and somatosensory stimulus succession was 3 or less seconds in a rodent model and in intraoperative human studies. In contrast, when comparing topographic information by the IOS method to the results using voltage sensitive dyes, the early component of the IOS spatially corresponds to and correlates with the electrophysiologic response as assessed by the dye (Takashima et al., 2001). Additionally, Toga et al. (1995) have reported similar time courses of the signals between invasive rodent and intraoperative recordings with a peak response after 2 to 3 seconds, after stimulus onset, and a slower resolution at 6 seconds after stimulus cessation.
Working in an exposed cortex model Rector et al., (1995, 1997) dedicated several studies to tracing the fast optical response, which is temporally correlated to the electrophysiologic response. In a recent article they differentiate four different responses based on their different temporal characteristics (Rector et al., 2001). Two fast components parallel the components of the evoked potential (N30 and P80), whereas an intermediate negative deflection of the optical response (termed N300 in analogy to the electrophysiologic responses) and a late component, P800, are unrelated to the electrical recording (Fig. 2). The latter most likely represents the “classical” hyperoxygenation response (Kleinschmidt et al., 1996; Obrig et al., 1996), whereas the intermediate response temporally corresponds to the aforementioned “dip.” The question as to whether it stems from slow scatter changes as reported in slice preparations (MacVicar and Hochman, 1991) or corresponds to the early deoxygenation (Vanzetta and Grinvald, 2001) is unresolved. As shown in this imaging approach, the responses have differential distributions. Although this does not resolve the questions concerning the IOS physiology, the study may be the state-of-the-art approach to invasive studies with respect to diversity of responses, instead of just one response to functional stimulation.
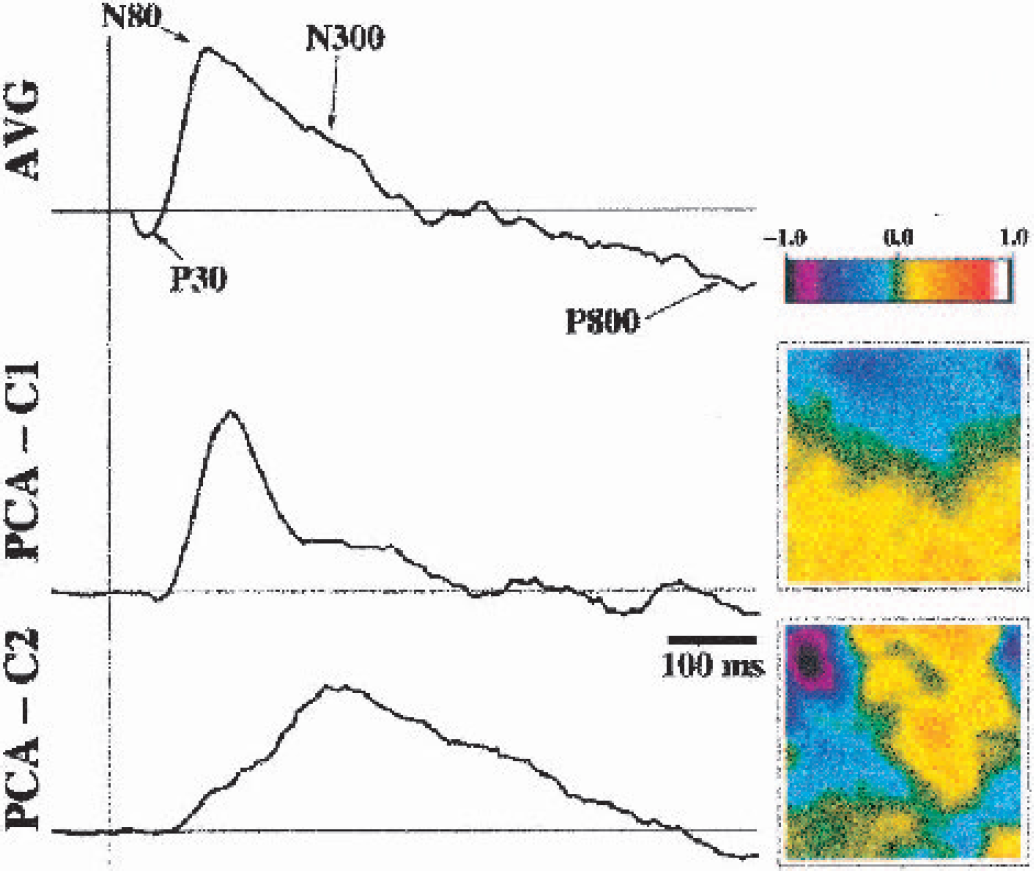
Optical response to single pulses of 0.04 mA to the vagal nerve in the rat. A 3 × 3-mm area of the rat's brain stem was imaged (illumination at 780 nm, CCD-camera). The average response is shown in the upper trace and shows 4 deflections in response to the stimulus, averaged across 1,000 trials. Principal component analysis (PCA) shows two strong components (PCA-C1 and PCA-C2), of which one resembles the N80 component (seen in the electrophysiologic measurements [not shown]), whereas the other component (N300) is unrelated to the electrophysiologic changes. This component results either from the early deoxygenation as described by Grinvald's group or from the slow scatter changes as have been also described in bloodless slice preparations (see text). The P30 component is related to the early electrophysiologic positive deflection, whereas P800 stems from the hyperoxygenation resulting from the “classical” vascular response. (Reprinted from NeuroImage, vol. 14, Rector DM, Rogers RF, Schwaber JS, et al., Scattered-light imaging in vivo tracks fast and slow processes of neurophysiological activation, pp. 977–994, 2001, with permission from Elsevier Science.)
Intraoperative
The intraoperative recordings of IOSs form the link between the numerous exposed cortex studies in rodents, cats, and monkeys and the noninvasive NIRS approach to the human pioneered by Haglund et al. (1992). There are reports on epileptiform afterdischarges, motor and somatosensory, as well as language-activation studies (Cannestra et al., 1998a, 2000). The early component of the signal (300 to 500 milliseconds) is reportedly more localized than the larger and later component of a latency on the order of 3 to 5 seconds (Cannestra et al., 1998a). This early component may be equivalent to the initial increase (the dip) in [deoxy-Hb] as has been postulated from animal studies and has been discussed previously. Concerning the very fast optical changes, shown to parallel electrophysiologic responses (Rector et al., 1997), as yet no studies have been performed in humans intra-operatively. Studying a word-discrimination task intra-operatively, Cannestra et al. (2000) found a difference in time course over Wernicke's and Broca's areas, the physiologic basis of which is still poorly understood. When comparing the response of the intraoperative IOS approach with the results of BOLD-contrast fMRI, the authors found that IOSs will show larger and rather gyral structures, as opposed to the distribution of the BOLD-contrast changes that tend to highlight the sulci, potentially also contributing to a long-standing controversy of BOLD-contrast origin (“brain or vein”) (Frahm et al., 1994). Interestingly, the maps generated by direct electrical stimulation better colocalize with the areas shown to be activated according to IOSs than those defined by BOLD contrast (Pouratian et al., 2002).
Considering the many studies performed, there is a surprising uncertainty as to the origin of the IOSs. This results from several methodological shortcomings, but—probably more relevant—it has shown the multiplicity of changes elicited by a functional activation. These changes certainly comprise a much wider range than the action potential on the one side and the increase in BOLD contrast on the other. The recent interest in the correlation of the two and the surprise at the problems encountered when doing so (Heeger et al., 2000; Lauritzen 2001; Logothetis et al., 2001; Rees et al., 2000) may highlight the importance of considering the diversity of responses, many of which may be investigated optically.
THE INVISIBLE
To summarize, as long as the tissue is exposed a full variety of responses elicited by a stimulus can be mapped by optical methods with high precision in a neuron, in a brain-slice, or in a cortical area viewed through a cranial window. There are changes in optical properties accompanying the electrophysiologic, the metabolic, and the vascular response; and there are IOSs, whose exact origin may be under debate but whose versatility to generate high-resolution maps of the cortex “at work” is unsurpassed by any other technique. (Figure 3 shows different structures, from the single neuron to the intact head, to be investigated by different optical approaches.) In the attempt to apply the wealth of differentially tinted views of the activated brain to the human, however, we are confronted with a paradox: only in the diseased brain, exposed for neurosurgery, do we have the opportunity to “see” some of the cortex. From these results we try to infer principles of the intact, healthy brain. Moreover, only a limited area is potentially visible in the intraoperative optical imaging approach (Fig. 4).
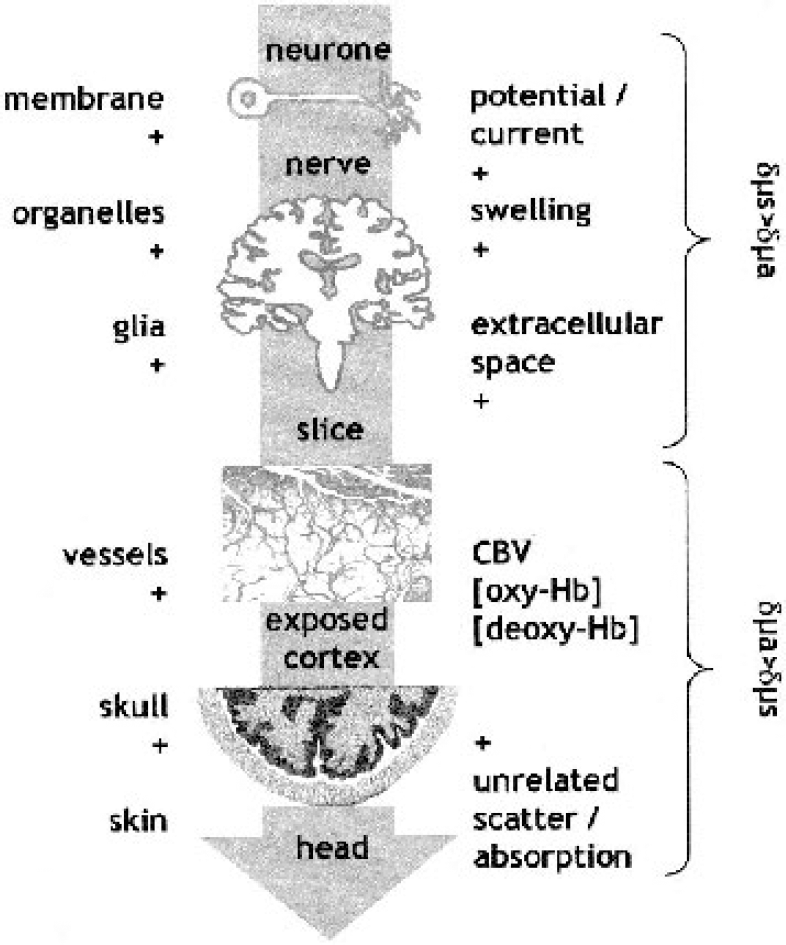
Sketch of the different biologic structures and the physiologic processes that contribute to different optical approaches in the neuron, slice, exposed cortex, and noninvasive near-infrared spectroscopy of the adult head. The contribution is additive along the arrow. Note also that the expected contribution to changes in scatter (Δμs) and absorption (Δμa) changes reverses along the same direction. [oxy-Hb], oxygenated hemoglobin; [deoxy-Hb], deoxygenated hemoglobin.
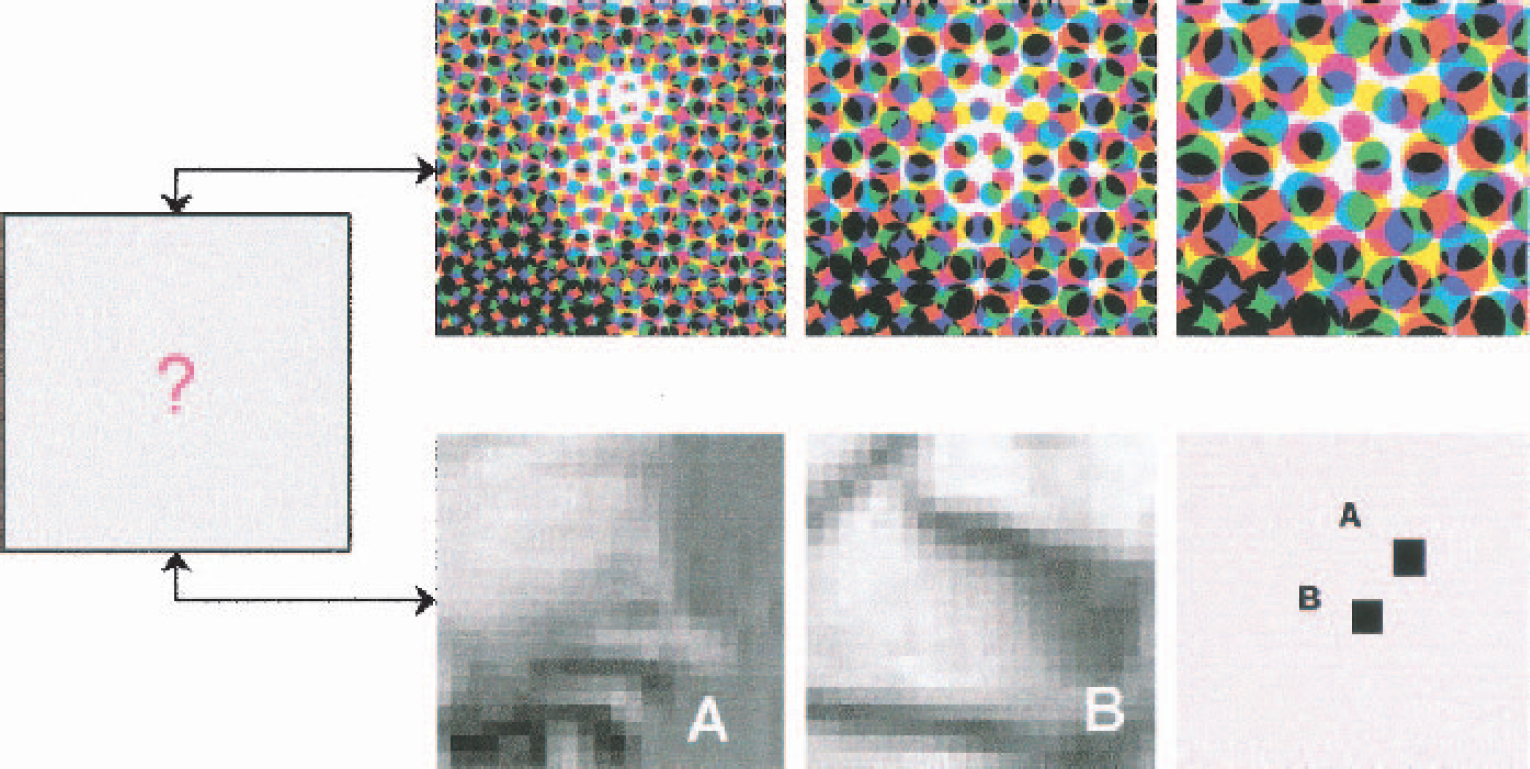
The sketch shows the respective problems of invasive and noninvasive optical approaches. When using noninvasive near-infrared spectroscopy there is no limitation as to the area sampled by the method; the blurring of the image caused by the 1- to 2-cm slab of highly scattering tissue, however, may render recognition of the image difficult. This is illustrated by the upper row, which shows the same image with an increasing blurring produced by a filter. For invasive investigation, only small areas in patients undergoing surgery are exposed to the investigator's sight. The lower row shows an example of two small areas (A and B) that are shown with an optimal spatial resolution. The knowledge of the position of these two regions (lower row right) alone is not enough to be able to recognize the whole image. Whereas the upper row allows the observer to guess that this is a portrait of a person, the lower shows details of eye and nose not helpful unless prior information about the larger image is available. (To find out about the “real” image, please visit www.berlin-neuroimaging-center.de/nirs/)
Twenty-five years ago Jöbsis (1977) pioneered noninvasive optical methods by disregarding the skull as a natural border for light. He was the first to show that spectroscopy of cortical tissue is possible through the intact skull. The part of the spectrum in which absorption by the hemoglobins and water# is low enough to allow for relevant penetration to some depth has been sometimes termed the “biological window” for noninvasive spectroscopy (Cope and Delpy, 1988). The term has some charm but should not obscure the fact that the window we are looking through is covered by a 1- to 2-cm slab of strongly scattering material. Figuratively speaking: put 1 cm of clotted cream on the lens of your camera and try to identify the people in your picture….
We will subsequently show that the results are less disastrous than might be expected. Working in the “Invisible” with light between 650 and 950 nm, this optical technique allows the identification of areas of the cortex that become activated. We will sketch the most frequently used approach to date, based on the Beer-Lambert law, and note its weaknesses. We briefly describe how the image can be constructed and comment on several studies (listed as well in a table), and we give a short and decidedly subjective impression of the “state of the art” concerning imaging studies with NIRS, concluding with personal ideas about the future of the field.
Origin of the signal
The interaction of light and biologic tissue is dominated by absorption and scatter. Changes in either property of the tissue illuminated (Δμatissue, and Δμstissue) will result in changes in the amount of light reaching the detector and will also change the time of flight (TOF) between the light source and the detector. Whereas some of the previously mentioned invasive techniques may differentiate between scatter and absorption changes (e.g., if transparency and reflection are simultaneously monitored in a brain slice), the noninvasive techniques relies on a greater number of—in part, grossly simplifying—assumptions. To date, all NIRS-imaging approaches have used continuous-wave technology and are based on a modified Beer-Lambert approach** (Cope et al., 1989; Reynolds et al., 1988):
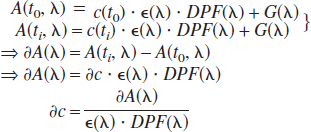
Here A is attenuation; t0, the beginning of the experiment and ti, any time during the measurement; c is the concentration of a chromophore; ∈ is the specific extinction coefficient of this chromophore; DPF is the differential pathlength factor accounting for the increase in pathlength between source and detector for light being scattered; and G is the term accounting for the loss of photons due to scatter. Note that A, ∈, DPF, and G are wavelength dependent. Note also that G is usually not known and, therefore, absolute chromophore concentration cannot be assessed. The simultaneous assessment of several chromophores relies on their differential extinction coefficients, ∈(Λ), and the assessment of changes in attenuation at different wavelengths.
The modification of the Beer-Lambert law on which such an assessment is based makes 3 rather strong assumptions:
Scatter is high but changes negligibly during the measurement. This assumption permits the investigator to disregard the loss of light intensity due to scattering (G) as long as changes in attenuation are assessed. It allows the investigator to assume the pathlength factor (DPF) at a certain wavelength to be constant.†† The assumption is plausible because changes in blood flow will more strongly change, owing to changes in hemoglobin oxygenation and concentration, the absorption coefficient (μa) of the tissue rather than the scatter coefficient (μs) (i.e., changes in scattering particles in the sampling volume and ultrastructural changes in the neuronal tissue).
The medium in which changes are monitored is homogeneous. This assumption is clearly wrong and is one of the reasons for the low spatial resolution of noninvasive NIRS when compared with invasive optical techniques using visible light. (For the invasive studies the sampling volume comprises the outer-most layers of the cerebral cortex and is therefore almost “homogeneous.”)
The change in the volume sampled is homogeneous within the sampling volume. This assumption, related to the second assumption, is also wrong and introduces an additional source of error that stems from the wavelength dependence of the differential pathlength factor.
Assumption 2 and 3, clearly not adequate in studies of focal changes as elicited in the cortex by functional stimulation, will influence the magnitude of the change calculated because of a partial volume effect and potentially produce cross talk (Uludag et al., 2002), that is, the erroneous calculation of a change in one chromophore due to the (real) change in another. The phenomenon is briefly sketched in “Constructing an Image.”
Chromophores are differentiated by their “color,” which is the extinction spectrum of the compound extending from the visible into the near-infrared spectral range. If single wavelengths are used, the number of wavelengths is equal to the number of chromophores potentially differentiated. Most imaging systems use two wavelengths, thereby allowing for the differentiation of the two major compounds (oxy-Hb and deoxy-Hb). The error introduced by disregarding the changes in absorption induced by the changes in redox state of the cytochromes in the respiratory chain has been estimated as not exceeding 10% (Uludag et al., 2002). Apart from the attenuation changes, the light's TOF can be assessed (Sevick et al., 1991). This is as yet not implemented in the NIRS imaging systems, but there are several researchers working on time- or frequency-domain imaging systems. (The IMAGENT-system by ISS [Champaign, IL, U.S.A.] is a multisite frequency-domain monitor; no studies taking advantage of this feature to differentiate between extra- and intracerebral hemodynamic changes have yet been published, however). The additional parameters that are accessible with such systems will allow one to individually assess the DPF at each measurement site and will help to establish a coarse depth resolution, which is of great relevance in differentiating between extra- and intracerebral changes in the parameters measured (Kohl et al., 2002; Steinbrink et al., 2001b). Figure 5 outlines the different approaches to achieve a coarse depth resolution.
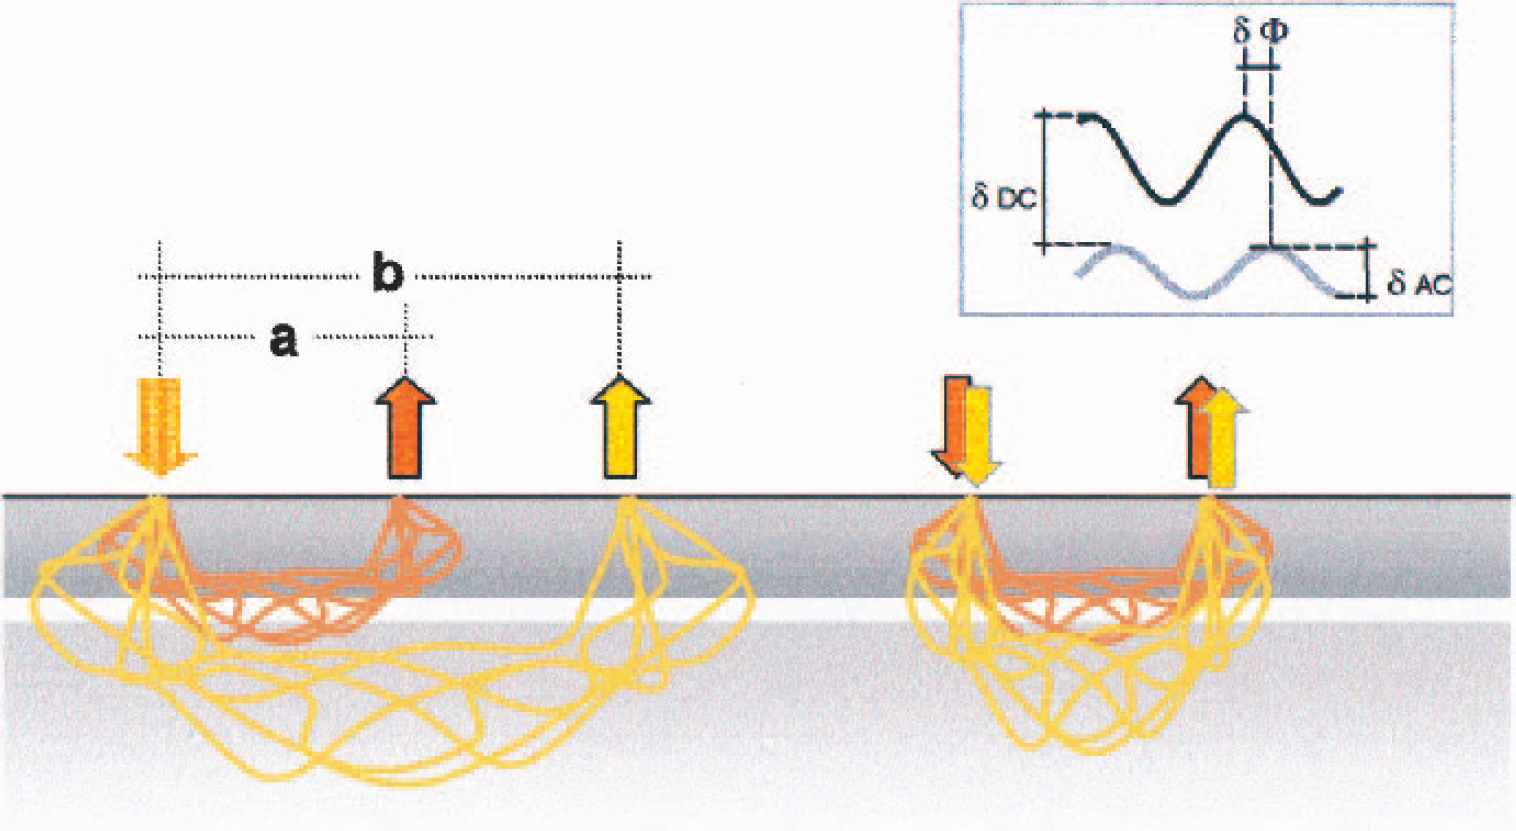
The sketch shows two options for depth resolution. The multidistance approach (left) can be applied to continuous-wave technology (measuring attenuation of the light only). The assumption is that photons reaching a detector at distance b will have traveled into deeper layers with a higher probability than those detected at distance a. The obvious disadvantage is the different signal-to-noise ratio between the two detector sites. Additionally, a focal absorber just below the detector at distance b will erroneously mimic absorption in a deeper layer. The approach on the right relies on additional parameters of the measurement (frequency-domain monitors).
Physiology of the signal
As has been summarized thus far, in the intent to map brain function noninvasively NIRS must proceed from changes in attenuation at several wavelengths. Time- and frequency-domain approaches—as yet not implemented in the imaging systems—supply additional information on the light's (mean) TOF (t>) and will thereby allow for some degree of depth resolution. In the following paragraphs we consider how the basic parameters (δA, t>, δΦ, [i.e., the change in phase of the modulation wave]) translate into the physiologic changes that can be expected over an “activated” area. The first section of this review has outlined the many physiologic processes eliciting changes in optical properties, which can be differentiated when the tissue is exposed. For the noninvasive approaches the one undoubtedly established response to be monitored is the change in hemoglobin concentration and oxygenation (Obrig et al., 2000b). The changes in oxygenation are calculated from changes in attenuation at different wavelengths. This spectroscopic approach can be applied to the intensity and the mean TOF data, which have been shown to be differentially sensitive to changes in deeper layers of the tissue (Steinbrink et al., 2001b). The oxygenation response typically expected over an activated cortical area consists of a
decrease in [deoxy-Hb], accompanied by an
increase in [oxy-Hb] of 2- to 3-fold magnitude, thus resulting in an
increase in total hemoglobin ([tot-Hb]).
The order is not random. When cortical “activation” is defined based on NIRS measurements, a decrease in deoxy-Hb is the most valid parameter. The term activation has been operationally defined by the focal increase in rCBF for all methods based on the vascular response to a stimulus. By analogy, a decrease in rCBF is termed “deactivation.” The term activation is, however, sometimes used in a more general sense, that is, independently of the methodology used. A negativation of the local field potential or the increase in spike rate is thereby similarly considered a sign of “cerebral activation.” The problem of such a very general use of the word is that there is no way to define activation independent of the methodology used. When we use activation and deactivation in the present article, therefore, we are using the operational definition, unless a more general meaning is explicitly stated. The decrease in [deoxy-Hb] corresponds to an increase in BOLD contrast, as has been shown by several studies (Kleinschmidt et al., 1996; Mehagnoul-Schipper et al., 2002). If no change in [deoxy-Hb] is seen (and the concomitant increase in [oxy-Hb] is therefore judged the relevant change, indicating cerebral activation [using the general sense of the word]) the interpretation of the results should at least consider that the alleged activation would not show in a BOLD-contrast fMRI study! If [deoxy-Hb] increases there are several potential explanations. An increase in parallel with [oxy-Hb] may be a simple movement artefact or may reflect a change in systemic or extracerebral hemodynamics (for example, a Valsalva maneuver, which will produce an increase in [oxy-Hb] and [deoxy-Hb] in all compartments of the sampling volume). If [oxy-Hb] decreases simultaneously, the increase in [deoxy-Hb] indicates deactivation (i.e., a decrease in rCBF and a negative BOLD contrast), as has been shown using a model of saccadic suppression of the visual cortex (Wenzel et al., 2000). In sum, deoxy-Hb has proven a highly effective endogeneous “contrast agent” for rCBF changes in BOLD-contrast fMRI. There is no reason why the interpretation of NIRS data should assume a new relation between deoxy-Hb and cortical activation in the rather imprecise general meaning (Yamamoto and Kato, 2002). Response patterns, which differ from this operational definition of cerebral activation as agreed on for all vascular-based methods, need a physiologically based explanation. ‡‡
The concentration of oxygenated hemoglobin is expected to increase in response to functional stimulation. As has been stated previously, this increase should be mirrored by a decrease in [deoxy-Hb] (the inverted response pattern reflecting deactivation). The parameter is—for no good reason—the most favored imaging parameter in the NIRS literature.§§ This is surprising, since there is no MRI or PET parameter that it can be easily related to. In addition, spontaneous oscillations (independent of the functional activation) have been shown to be much larger in this parameter when compared with deoxy-Hb, thereby increasing physiologic noise (Obrig et al., 2000a). An increase in [oxy-Hb] is in line with the operational definition of cerebral activation but may also reflect a change in blood pressure or an increase in skin blood volume, since NIRS cannot easily exclude an extracerebral contribution to the signal changes measured. We consider this parameter helpful in conjunction with deoxy-Hb; taken by itself, there is little use of reporting an increase in its concentration because this may be an unspecific change in different compartments of the human head.
Changes in [tot-Hb] reflect changes in corpuscular blood volume in the sampling volume and may therefore seem the best parameter to report. Its assessment, however, is merely a summation of [oxy-Hb] and [deoxy-Hb] changes, hence it seems necessary to report all three parameters. The [tot-Hb] has been shown to correlate to rCBF changes as monitored by PET in the labeled-water technique (Villringer et al., 1997). Unfortunately, different stimulation paradigms and experimental protocols have yielded differing results. Again, activation, as for PET studies, is defined by an increase in rCBF. This rCBF increase is typically associated with an increase in [tot-Hb]. Several studies have shown such an increase. Depending on the stimulus (and probably also depending on the choice of wavelengths in a monitor), however, [oxy-Hb] increase and [deoxy-Hb] decrease of similar magnitude have been found in several fNIRS studies, thus not producing any relevant change in [tot-Hb] (for review of the integration of the NIRS findings into the model of neurovascular coupling, see also Villringer and Dirnagl [1995]).
Besides these hemodynamic parameters there is some controversy concerning the detectability of changes in cytochrome-oxidase redox state (Cooper et al., 1997; Heekeren et al., 1999; Uludag et al., 2002). We do not include these discussions because spectral resolution is usually too low to differentiate between more than two chromophores. The potential to map changes in a parameter of cellular metabolism, however, may be a potential “exclusive strength” of the methodology.
Finally, another parameter needs mentioning. Gratton and Fabiani (2001) have published several reports that claim to noninvasively detect optical signals in parallel with electrophysiologic changes. As has been described earlier, such signals are well established for invasive approaches (Rector et al., 1997; Stepnoski et al., 1991). The question is whether the much smaller signal-to-noise ratio (SNR) in a noninvasive set-up will allow one to reproducibly trace these signals. We (like others) were not able to reproduce the reported results using an identical experimental set-up. Increasing SNR by an intensity-based approach and extending the filter algorithm to attenuate the heartbeat, we saw signal changes over the somatosensory cortex in selected subjects (Steinbrink et al., 2001a). Since the results could not be obtained over the visual cortex or reproduced as reported by Gratton and Fabiani, we consider a major technical development necessary to enhance SNR, if this signal is to be reproduced.
Constructing an image
Most imaging systems apply a straightforward approach to construct the image. The pixels are defined by all potential source-detector combinations. Assuming that the maximal sensitivity is to the cortical area underlying the midpoint between each source-detector pair, the image is smoothed, relying on more or less refined interpolation algorithms. Since one detector may receive light from several different sources, the sources are either sequentially switched on and off or frequency-encoded by modulating their light-intensities at different frequencies. ∥∥ There are several shortcomings of this straightforward approach. First, the assumption of a semicircular sampling volume is idealized even in a model in which homogeneous optical changes in a homogeneous semi-infinite medium are assumed (Okada et al., 1995; Firbank et al., 1998). The resulting error induces some blurring of the image. More relevant, however, is the fact that the very assumptions of a homogeneous change in a homogeneous medium are clearly wrong for any kind of functional activation study of the adult head (see Origin of the Signal). The inhomogeneity of the medium will alter the geometry of the sampling volume for a specific pair of probes, resulting in additional blurring. Even more grievous is the assumption of a homogeneous change in this medium, an assumption that introduces two types of error: (1) the partial volume effect alters the magnitude of the changes, underestimating the focal change and (2) cross talk may mimic changes in one chromophore that are but an artefact of the changes in another (Uludag et al., 2002). This means that a selective change of, for example, [oxy-Hb], may result in a “pseudo”-change in [deoxy-Hb]. For imaging approaches the issue has been highlighted by Boas et al. (2001). In addition, we have performed some work in the context of the still controversial issue, whether cytochrome-oxidase redox changes can be reliably assessed by noninvasive NIRS (Uludag et al., 2002). To briefly explain the phenomenon: a prerequisite to differentiating between several chromophores is the assessment of attenuation changes at different wavelengths. The DPF's being wavelength dependent will cause slightly different sampling volumes for the respective wavelengths. Now, a linear correction for this wavelength dependence is possible under the assumption of a homogeneous change and is implemented in most algorithms based on the modified Beer-Lambert law. A focal hemodynamic change in a single layer, however, can only be correctly assessed when the partial pathlength in this very layer is known. Since the exact depth and volume of the change are usually unknown, calculating chromophore changes from attenuation changes at different wavelengths essentially results in distorted spectra. In other words, wavelength ΛA will reach more deeply into the volume activated than LDB or vice versa. Although the fact of potential cross talk between chromophores is generally agreed on, there are relevant discrepancies concerning its magnitude with respect to [oxy-Hb] and [deoxy-Hb] changes. Our studies indicate that the cross talk between oxy-Hb and deoxy-Hb will cause an error of about 10% of the change elicited.¶¶ Since the typical response pattern consists of an oxy-Hb increase and a deoxy-Hb decrease, this may distort the ratio of magnitudes between chromophores but will not completely alter the image. For imaging approaches the alternative of “diffuse optical tomography” has been proposed by Boas et al. (2001). It is based on the diffusion equation and Born's approximation and relies on the detection of light emitted from a specific source in more than the next-neighbor detector. This approach may help to attenuate the cross talk error; measurements in adults with a source-detector distance beyond 4 cm, however, result in very low signal-to-noise levels and thereby presently limit the application in adults. Boas et al. (2001) show its feasibility in a neonate in whom an increase in deoxy-Hb is found over the motor cortex activated by passive contralateral arm movement. The diffuse optical tomography approach seems very promising in reducing some of the methodological problems of NIRS imaging, and more extensive validation will hopefully demonstrate its applicability to the human adult.
To summarize, the present imaging approaches share a low spatial resolution. This implies a rather coarse topographical representation with, at present, virtually no depth resolution for the systems applied to the human adult. These shortcomings may be attenuated by introducing time-domain or frequency-domain techniques into NIRS imaging. These will allow for a separation between extra- and intracerebral oxygenation changes. In addition, increasing the number of probes will help to increase the visual acuity, and alternative imaging algorithms may further increase resolution and attenuate the likelihood of cross talk (Boas et al., 2001). Worthwhile as these advances would be, one should nonetheless be aware of some fundamental limits in spatial resolution, an awareness that should result in a more considered study design and some skepticism if results are obtained that are contradictory to the operational definition of cerebral activation as shared by functional imaging techniques based on the vascular response.
Near-infrared spectroscopy imaging studies
Oxy-Hb, oxygenated hemoglobin; deoxy-Hb, deoxygenated hemoglobin; tot-Hb, total hemoglobin; fMRI, functional magnetic resonance imaging; OT, optical topography; BOLD, blood oxygenation level-dependent; NIRS, near-infrared spectroscopy; DPF, differential pathlength factor; TRS, time-resolved spectroscopy; S1, primary somatosensory cortex; rMCA, right middle cerebral artery; SMA; supplementary motor area; SPECT, single-photon emission computed tomography; MEG, magnetoen-cephalography; ICG, indocyanine green; rCBF, regional cerebral blood flow; REM, rapid eye movement; p, c, and cp, patient, children, and child patient, respectively; ▲, increase; ▼, decrease.
REVIEW OF THE STUDIES
The table lists a number of NIRS imaging studies. It seems noteworthy that many studies investigate cognitive paradigms with a special focus on language. Language studies do in fact profit from the NIRS method, which is silent, thereby allowing for a more natural setup, when compared with fMRI. The localizing value is small, however, and most studies confirm or accord with findings that have been previously reported by fMRI or PET. In contrast to this confirmatory nature of the results, several studies fail to report on deoxy-Hb changes, though this is the parameter that links the studies to the fMRI literature. In addition, there are studies using cognitive stimuli that report “variable results”; this does not further our understanding of the NIRS methodology, neither proving the insufficiency of the method nor demonstrating a “variable” underlying physiologic process. Interestingly, one of the most solid cognitive studies, with the largest number of subjects and a statistically sound approach in a single trial design, was done by successive sampling with a 2-channel monitor (Schroeter et al., 2002). This may stress the fact that, besides the quality of the monitor used, study design and a sound statistical approach to the data obtained are equally important.
The primary sensory, motor, and visual systems have mostly been tested in feasibility studies with small subject numbers. Among these studies there is some agreement on a response pattern, although again increases in [oxy-Hb] are usually considered the parameter of choice, but decreases in [deoxy-Hb], consistent with the operational definition of a cerebral activation, are reported in some studies (Maki et al., 1996). There is a remarkable gap between this very basic exploration of motor and visual tasks and the rather complex language and cognitive tasks. Clearly, more studies exploring simple paradigms and well-defined functional-anatomic regions (i.e., primary and secondary sensory areas) are needed, to validate the method's effective potential to differentiate between cortical areas. In this context the study (Miyai et al., 2001) on gait deserves mentioning. The authors explore a well-defined paradigm (gait) that cannot be investigated in the magnet; and by exploring some of the elements of the task (foot movement and gait imagery) additionally using the magnet, they establish a link between the high spatial resolution of the fMRI and the exclusive applicability of NIRS to the study of gait.
Concerning data analysis, the majority of studies apply no or basic statistical approaches to report the imaging results. The general problem—as with the other functional imaging techniques—is the comparison between individual subjects. More specifically, the NIRS imaging problem is an “in between” problem. Previous single-channel studies fully relied on the rough topography of the bony landmarks (i.e., the 10–20 system) (Steinmetz et al., 1989) and simply averaged across all subjects. When partially imaging the head's surface, it is tempting to project the results onto the 3-dimensional surface of the brain. The area imaged and the spatial resolution, however, still do not allow for a more refined normalization (like Tailarach normalization, as used in most fMRI and PET imaging softwares). Hence many publications provide the “representative” single subject, whose fNIRS results are projected onto a high-resolution anatomic MRI scan. This accuracy is of limited value: (1) depth resolution is a mere assumption, and the changes that are projected onto the cortical surface resulting from a segmented MRI can stem from extra- and intracerebral as well as from systemic hemodynamic changes. (2) The actual resolution, defined by a complicated interaction between the probe separation and the blurring induced by scatter and inhomogeneities of the sampling volume, is “enhanced” by some interpolation between the small number of measured “pixels.”## (3) The maps shown do not represent a statistical approach but show the magnitudes of the changes. This is problematic because movement artefacts and single extracerebral or systemic changes can easily exceed the magnitude of the expected cerebral changes by an order of magnitude. Simple averaging, therefore, will not easily allow differentiation between a single artefact at the beginning of a stimulation period and an actual cortical change in response to the stimulus.
To summarize, the studies show the applicability of the methodology to functional mapping of the human brain. Besides methodologic and technical developments, further studies are needed to better define the effective spatial resolution, that is, the question as to at what scale neighboring cortical areas can be reliably differentiated. In addition, preferentially an established statistical analysis tool like statistical parametric mapping (SPM99, Wellcome Dept. of Cognitive Neurology) or some other standard package would greatly help in comparing the results of different groups and studies. (For two examples of the results during stimulation of the visual cortex, see Fig. 6.)
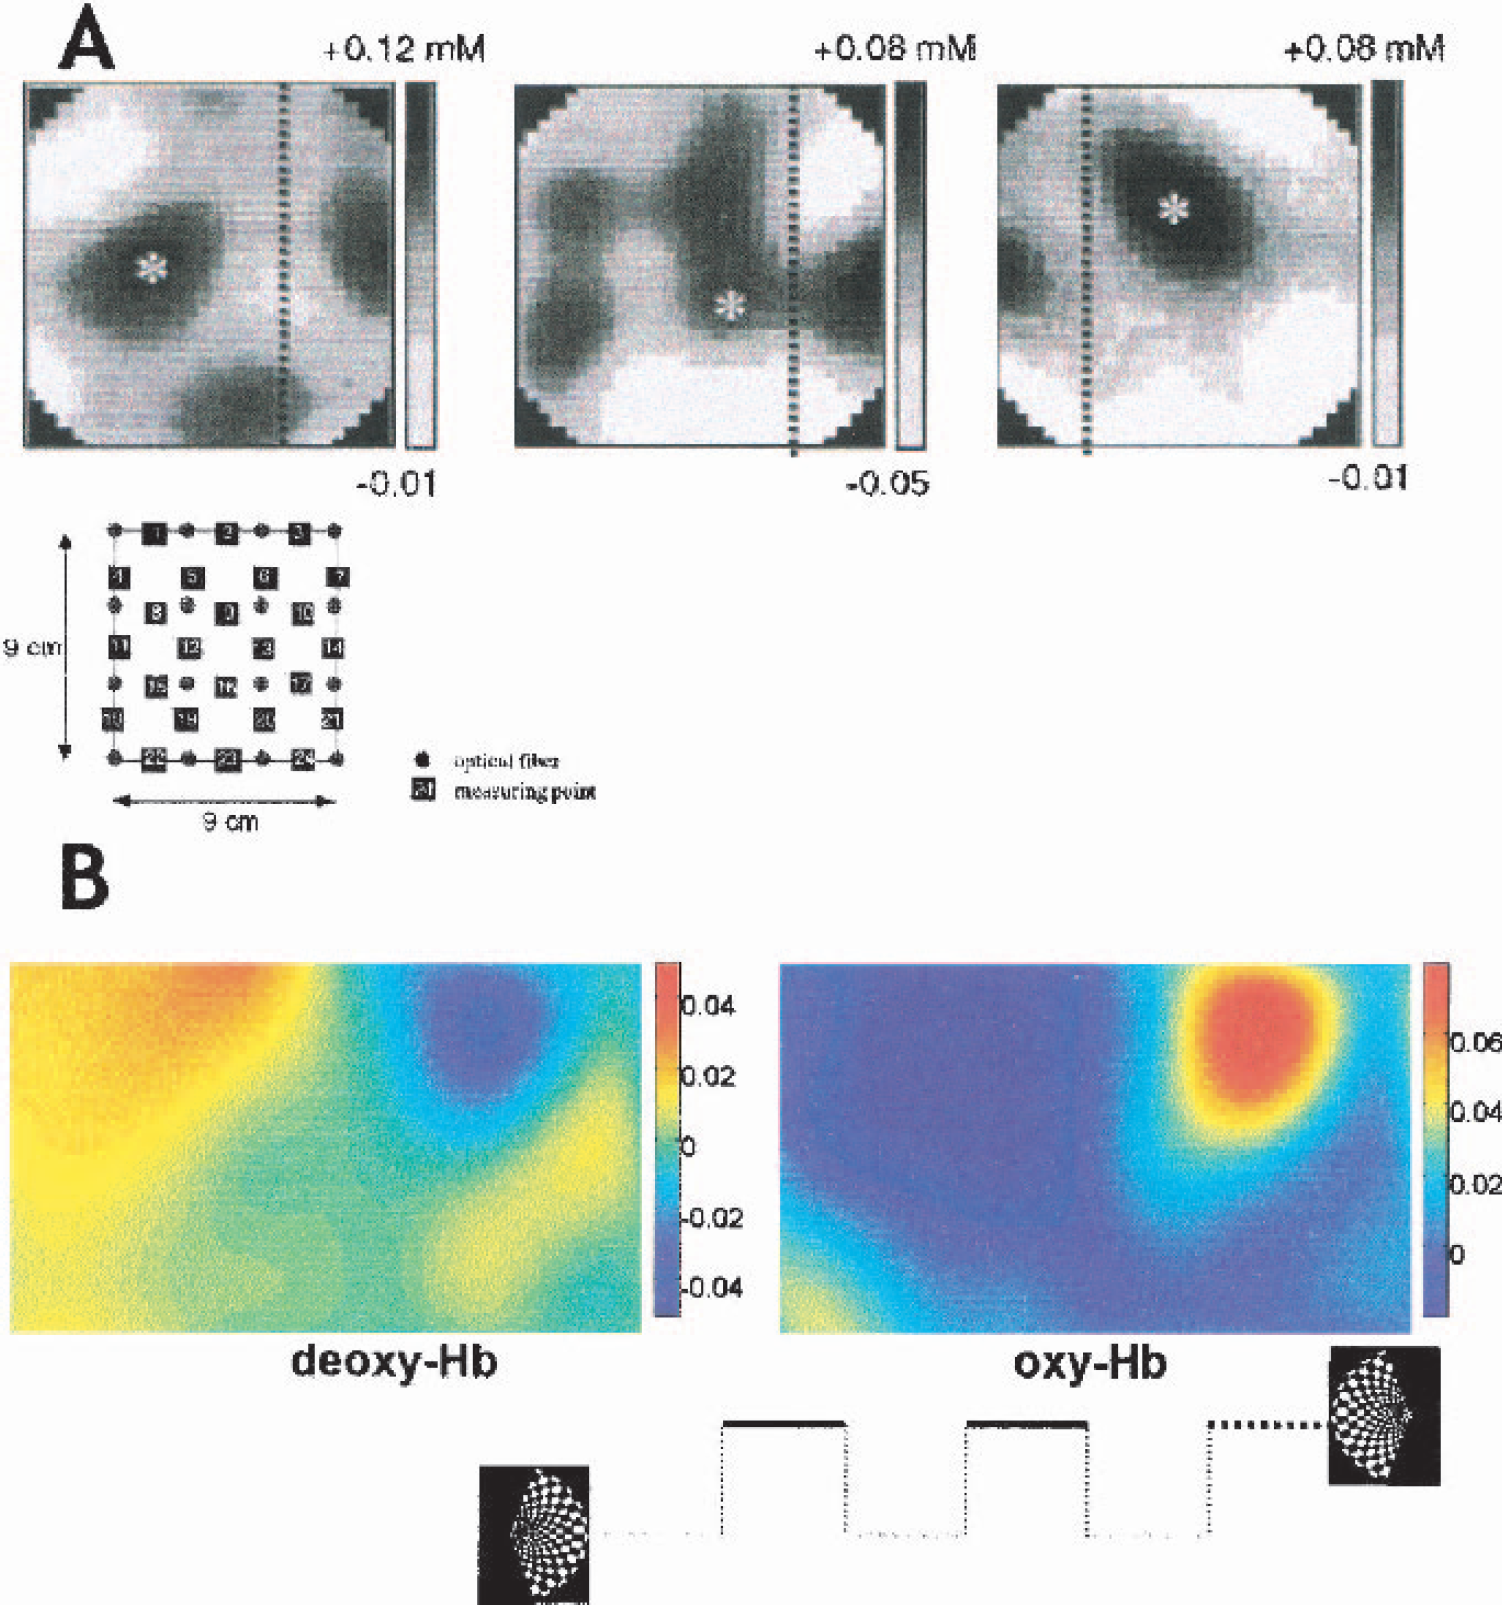
Two noninvasive approaches to mapping the visual cortex by near-infrared spectroscopy.
PERSPECTIVES
The excellent spatial and temporal resolution paired with a high parameter specificity, as has been established for invasive optical imaging techniques, is not reached by noninvasive NIRS imaging approaches. The major obstacle is a rather poor definition of the sampling volume, resulting in a blurry image of the brain's surface. The studies performed in human subjects have nonetheless shown that imaging of changes in hemoglobin oxygenation is feasible even on the basis of grossly simplifying assumptions. The presently used approaches add the information of a number of source-detector pairs and construct the image based on some 20 to 30 thus-defined pixels. With respect to the future development of NIRS imaging, we consider 4 major lines of research to be of prime relevance:
Spatial resolution can be augmented by simply increasing the number of source-detector pairs. A full image of the head's surface does not require any novel technological development. This is the obvious first line of inquiry, being followed by leading researchers.
Spatial resolution may profit from more refined arrangements of the probe arrays. At present evenly distributed source-detector pairs are used for all imaging systems. Arrays respecting regions of interest may focally enhance the number of measured, as opposed to interpolated, pixels by using interleaved measurement arrays (e.g., sequentially probing interleaved probe detector pairs).
Some rough depth resolution is needed to allow for a coarse separation between cerebral and extracerebral changes in [oxy-Hb] and [deoxy-Hb]. This would greatly improve the quality of the images. Time-resolved imaging has been the focus of several technically oriented groups (Hebden et al., 2001; Ntziachristos et al., 2001; Suzuki et al., 1994) focusing on applications on the female breast and the human head. Research along this line will require greater capital, in both money and engineering expertise.
A prerequisite to comparing the results assessed by noninvasive NIRS imaging is a more homogeneous approach to the data analysis. We consider it necessary to (A) routinely report on at least both “basic” parameters (i.e., oxy-Hb and deoxy-Hb) and (B) provide some statistical approach to the imaging data (preferably a package similar or compatible with some of the established imaging software, such as SPM99, FSL, or BrainVoyager). The question of how to normalize data of different subjects requires a novel approach. Although the overlay of fNIRS data on a high-resolution MRI seems an attractive method for visualizing a selected subject's results, an approach with a reference system such as the 10–20 system may be more adequate to the method's effective spatial resolution and should not be overlooked.
Besides these advances in technique and analysis of the data, we believe that researchers should consider the methodology's strengths and weaknesses when designing an NIRS study. Clearly, NIRS imaging will not be the first choice if a fine functional-anatomic segregation of different areas involved in a task is of interest. When, however, the time course of the hemodynamic response or the simultaneous assessment of electrophysiologic data is the intended focus, NIRS imaging has the potential to provide additional insights into the functional physiology of cortical activation. By nature of its portability, too, NIRS imaging's potential for application in “natural” experimental environments recommends its use. Its undemanding combination with methods like EEG, MEG, or fMRI renders NIRS imaging a powerful approach (1) to help understand the physiology of the vascular changes and its coupling to the neuronal excitation, which are the basis of the modern imaging techniques; (2) to be used at the bedside and thereby help to fill the gap between advanced functional imaging techniques applied in the healthy young subject and the sparse knowledge on how these results relate to alterations in the diseased brain; (3) to be applied in children and in subjects or patients not able to undergo an fMRI examination; (4) for tasks which cannot feasibly be investigated in the magnet.
Footnotes
*
… celebrating its 25th birthday on December 23rd (Jöbsis, 1977).
∥
If transmittance and reflectance show a change in the same direction, the underlying process is more likely to stem from absorption changes. A change in transmittance opposite to that in reflection makes scatter changes the more likely candidate for the changes.
†
In several papers intrinsic optical signal is used to refer exclusively to the reflectance change in exposed cortical tissue with a latency of 200 to 300 milliseconds. The fast optical changes, however, occurring at a latency of milliseconds in parallel with the electrophysiologic changes, are in part monitored by a similar set-up (Rector et al., 2001) and are therefore here subsumed under the term.
‡
Thereby the noninvasive approach in humans also is subsumed under the term intrinsic optical signal (IOS). In the literature IOS often refers to the invasive techniques only; by including NIRS, however, we would like to stress that NIRS is the noninvasive extension of IOS.
§
Retardation is the product of birefringence and thickness of the structure illuminated. Birefringence in turn is related to the proportion of refractive indices when illuminating with polarized light parallel and perpendicular to the optical axis.
¶
The temporal resolution of these approaches is limited by the underlying physiologic process. The “early” response (related to the controversial issue of an initial dip, as discussed further on) has a latency of ∼200 milliseconds. In broader usage, however, IOS also comprises the fast scatter changes that have been reported to parallel the electrophysiologic response (Rector et al., 1997; Stepnoski et al, 1991).
**
††
In the adult brain typical values for scatter and absorption at 800 nm are given by the number of respective events per millimeter: [μs' = 2.5/mm for gray, [μs' = 9/mm for white matter, [μa = 0.015 caused by a concentration of total hemoglobin of ∼84 [μmol/L. These numbers support the assumption of high but constant scatter and comparatively low absorption that will change more drastically when changes in regional cerebral blood flow occur.
‡‡
There is some literature on the “inversion” of the BOLD contrast in neonates (Sakatani et al., 1999). Thus patterns in neonates may in fact deviate from this rule. Even here, however, the interpretation of results should follow some principles. The question as to whether and up to which age the vascular response in infants may differ with respect to deoxy-Hb is controversial (Born et al., 2000; Martin and Marcar, 2001), but this does not mean that any change in the parameters may indicate “cerebral activation.” An increase in oxy-Hb, deoxy-Hb, and thus also tot-Hb, starting with and often outlasting some arousing stimulus, must be considered a systemic change in hemodynamics and cannot be taken as the fingerprint of cerebral activation simply because the brain happens to be part of the sampling volume. Owing to the uncertainty as to deoxy-Hb's response direction, these studies must take even more care to make a cerebral origin of their changes plausible!
§§
The simple reason to favor oxy-Hb may be that changes are larger than those in deoxy-Hb. This, however, is irrelevant, especially since magnitude of the changes is less reliable than response direction. In most of our experiments using systems with a spectral resolution higher than that of the imaging systems, the deoxy-Hb decrease showed a greater signal-to-noise ratio with respect to the functionally induced changes when compared with the oxy-Hb changes. The difference in noise level of the different parameters, however, critically depends on the choice of the wavelength pair chosen. Recently (Yamashita et al., 2001), it has nicely been shown that there are favorable and less favorable combinations. These may explain in part the differences between studies.
∥∥
This kind of intensity modulation is different from the one used to assess mean time of flight, in which case the assessment of the phase-shift of the modulation wave is an additional parameter sensitive to changes in the absorption coefficient (δμa) and scatter coefficient (δμs) of the tissue illuminated. The typical modulation frequencies for encoding are 1 to 10 kHz and require lock-in amplification of the signals detected (for comparison the modulation frequency of the commercially available ISS frequency-domain monitor is 110 MHz).
¶¶
For redox changes in cytochrome oxidase we find that cross talk may generate erroneous changes similar in magnitude to the changes assessed in functional stimulation protocols. In a very recent study we examined a stimulation paradigm differentially activating areas of the visual cortex that are known to differ in cytochrome-oxidase content (“blob” and “interblob” regions in V1). Comparing the changes measured with the ones simulated in a Monte Carlo simulation we find that in some subjects the changes in cytochrome-oxidase redox state cannot be explained by cross talk alone.
##
This is a fairly general procedure in most imaging techniques. Positron emission tomography and T2*-weighted images are very often “adjusted” to the much higher resolution of the anatomic image onto which they are projected. The deviation from a “real” map of the changes is, however, strongly enhanced if a rather coarse and small image of the head's surface is projected onto a 3-dimensional data set generated from magnetic resonance tomography slices.
#
The hemoglobins limit the penetration of light below 650 nm, that is, in the visible and the ultraviolet range. Water, known to be transparent to these wavelengths, becomes a strong absorber in the spectral region beyond 950 nm.