
Abstract
Cerebral blood flow (CBF) is known to be low in newborn infants, but this has not been shown to be damaging. The purpose of this study was to investigate the relationships between cerebral haemoglobin flow, blood flow, oxygen delivery, oxygen consumption, venous saturation, and fractional oxygen extraction (OEF) in newborn, preterm infants. Measurements were made by near-infrared spectroscopy in 13 very preterm, extremely low birth weight infants (median gestation 25 weeks) during the first 3 days after birth. There was a negative correlation between cerebral oxygen delivery and OEF (n=13, r=−0.5, P=0.03), which implies that when there is a reduction in cerebral oxygen delivery in sick preterm infants, increased cerebral oxygen extraction may be responsible for maintaining oxygen availability to the brain. During the first 3 days after birth CBF (n=13, r=0.7, P=0.01), oxygen delivery (n=13, r=0.5, P=0.03), and oxygen consumption (n=13, r=0.7, P=0.004) all increased. This increase in oxygen consumption indicates increased cerebral metabolic activity after birth, which is likely to be a normal adaptation to extrauterine life. The increases in blood flow and oxygen delivery may also be normal adaptations that facilitate this increase in metabolic activity. There was a decrease (P=0.04) in mean (±s.d.) cerebral OEF between day 1 (0.37±0.10) and day 2 (0.29±0.09), with no change between day 2 and day 3. Taking into account the negative correlation between OEF and oxygen delivery, this decrease in OEF may be because of increased oxygen delivery during this time.
Keywords
Introduction
Cerebral blood flow (CBF) in preterm infants is normally surprisingly low−4.5 mL/100 g min (Greisen and Pryds, 1989; Pryds and Greisen, 1990) compared with a threshold value for tissue viability of approximately 10 mL/100 g min in adults (Powers et al, 1985). This low CBF probably reflects cerebral metabolic demand, which has been demonstrated to be considerably lower in infants than in adults (Altman et al, 1993). Such low CBF has not been shown to cause ischaemic brain damage. Nevertheless, clinicians put considerable therapeutic effort into maintaining blood pressure within a presumed normal range. This is probably the right thing to do because extreme hypotension is associated with organ failure, but the question remains as to why such low levels of CBF, and consequently low cerebral oxygen delivery (CDO2), are apparently tolerated.
When systemic hypoxia occurs, there are two mechanisms by which the availability of oxygen to the cerebral tissues may be maintained. The first response to reduced cerebral oxygen delivery is likely to be cerebral vasodilatation (Liem et al, 1997). If this response is ineffective or impaired, cerebral oxygen extraction may increase to maintain the availability of oxygen. When oxygen extraction is maximal, if oxygen delivery continues to decrease, oxygen consumption becomes delivery-dependent and must reduce. This is a situation that is likely to be still not damaging, but where function is impaired and permanent damage may result if low oxygen delivery persists or decreases further; it is a situation that puts the infant at risk of hypoxic–ischaemic cerebral injury.
Maintaining an oxygen delivery that is adequate for cerebral metabolic requirements is of key importance in supporting the critically ill patient. A useful and readily measurable variable in this relationship is cerebral oxygen extraction fraction (OEF), which is the ratio of cerebral oxygen consumption to cerebral oxygen delivery (Yoxall and Weindling, 1998). A previous study has shown that preterm infants have a significantly higher cerebral OEF on the first day after birth when compared with day 2 (Kissack et al, 2004). Left ventricular output (LVO) increases during the days after birth (Evans and Kluckow, 1996) and there is a significant correlation between cerebral OEF and LVO on the first day after birth (Kissack et al, 2004). The likely mechanism that links low LVO and increased cerebral OEF is that low LVO causes reduced cerebral oxygen delivery, but this has not previously been established.
The purpose of this study was to investigate the relationships between cardiac output, CBF, CDO2, and cerebral oxygen extraction during the first 3 days after birth in sick, preterm infants. The hypothesis tested was that CBF and cerebral oxygen delivery would increase as cerebral OEF decreased.
Methods
Subjects
Thirteen infants were studied. All infants were delivered at less than 32 weeks of gestation and had birth weights below 1500 g. All infants had an umbilical arterial catheter for continuous blood pressure monitoring and blood sampling, and were receiving conventional mechanical ventilation. Measurements of cerebral venous saturation and cerebral haemoglobin flow (CHbF) were made within the first 12 h after birth (day 1), between 24 and 36 h of age (day 2), and between 48 and 60 h of age (day 3).
Cerebral Venous Oxygen Saturation
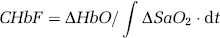
Cerebral venous oxygen saturation (SvO2) was measured with a partial jugular venous occlusion technique using near-infrared spectroscopy (Hamamatsu NIRO 500, Hamamatsu UK Ltd, UK) and pulse oximetry (Datex, Finland). Gentle unilateral pressure on the external jugular vein causes venous pooling within the cerebral circulation without inducing any change in arterial blood flow, and consequently the measured rise in the quantity of oxygenated and deoxygenated haemoglobin (Hb) originates from the cerebral venous system. This induced change in oxygenated and deoxygenated Hb in the cerebral venous vascular bed results in increased absorption of near-infrared photons, which is detected by the spectroscope. This change in absorption is used to calculate change in quantities of the two forms of Hb, and this is then used to calculate a cerebral venous saturation using the following formula:

where SvO2 is the cerebral venous oxygen saturation, ΔHbO is the average change in oxygenated Hb over the 5 secs after partial jugular venous occlusion, ΔHb is the average change in deoxygenated Hb over the 5 secs after partial jugular venous occlusion.
The measurement is repeated a total of five times, and the average of the five measurements is taken as the final value of cerebral SvO2.
This technique has been validated by comparison with direct invasive cooximetry of cerebral venous blood, the gold standard method for measuring this physiological variable, achieved by passing a catheter into the jugular venous bulb of anaesthetised children undergoing cardiac catheterisation (Yoxall et al, 1995). A Bland–Altman analysis showed that the mean difference between the two techniques was 1.5%, with 95% limits of agreement between −12.8% and +15.9%.
The near-infrared optodes were placed in a fronto-temporal arrangement on the head, and the interoptode distance was measured using calipers. All interoptode distances were between 2.5 and 4.0 cm. Near-infrared measurements of SvO2 were considered acceptable only if there was a preceding steady baseline for both Hb and oxyhaemoglobin (HbO), after a rise in both during the partial jugular venous compression, with both returning to the preexisting baseline immediately after the compression. At least five separate partial jugular venous occlusions were performed for each measurement, and the mean value of the five readings was taken.
Cerebral Arterial Oxygen Saturation
To calculate OEF, concurrent values for arterial oxygen saturation (SaO2) were also required. Arterial oxygen saturation was measured, at the same time as the measurement of cerebral SvO2, using the pulse oximeter in beat-to-beat mode, taking a reading every 0.5 secs, with the probe located on the infant's right hand. The mean SaO2 for the 5 secs immediately preceding the partial jugular venous occlusion was taken as the value for SaO2.
Cerebral Haemoglobin Flow
Cerebral haemoglobin flow was measured with near infrared spectroscopy, using a technique in which a bolus of HbO was delivered to the cerebral circulation (Bucher et al, 1993; Edwards et al, 1988; Skov et al, 1991). Measurements of CHbF using near-infrared spectroscopy with oxygen bolus have been validated by comparison with 133Xenon clearance, the gold standard method for measuring this physiological variable (Bucher et al, 1993; Skov et al, 1991). Both studies demonstrated a significant correlation between the near-infrared and 133Xenon clearance measurements (r=0.84, P<0.0001 and r=0.80, P<0.001, respectively). In the latter study, there was a mean difference between the methods of 1.6 mL/100 g min, with 95% limits of agreement between −0.5 and 3.8 mL/100 g min.
In the present study, CHbF measurements were made by briefly increasing the inspired FiO2, the amount of the increase being tailored to the individual infant, depending on the baseline SaO2 and the severity of the lung disease. An increase of 10% to 30% was generally sufficient to induce a change in HbO, while permitting SaO2 to be maintained between 85% and 92% at all times. As total Hb remains constant, there is a corresponding decrease in the concentration of deoxygenated Hb. These changes result in altered absorption of near-infrared photons, which is detected by the spectroscope. This change in absorbance is used to calculate change in the quantity of HbO and this, together with corresponding SaO2 data measured at the right hand, is then used to calculate CHbF using the following formula:
where CHbF is the cerebral haemoglobin flow, ΔHbO is the measured change in oxygenated haemoglobin, and ∫ΔSaO2· dt is the cumulative integral of measured change in SaO2 over time.
Cerebral haemoglobin flow was measured immediately after the measurement of cerebral SvO2 but could only be performed if the FiO2 was between 0.3 and 0.8, because manipulation of the FiO2 was necessary to produce a baseline arterial SaO2 between 85% and 92%. The following criteria were set in advance for a measurement of CHbF to be considered acceptable for analysis: HbO and Hb had to form a steady baseline before a rise in HbO and fall in Hb on arrival of the HbO bolus in the cerebral circulation, and had to return to the baseline before beginning of the next measurement. Total Hb (the sum of HbO and Hb) had to remain steady throughout each measurement. Because the near infrared measurements were made on the cerebral circulation and the SaO2 measurements were made at the right hand, a maximum time lag of up to 2 secs for the detected rise in SaO2 to follow the detected rise in HbO was considered acceptable. Five measurements were made and averaged to produce a value for CHbF.
Cerebral Fractional Oxygen Extraction, Cerebral Blood Flow, Cerebral Oxygen Delivery and Cerebral Oxygen Consumption
Data for CHbF (μmol per 100 mL min), SaO2, SvO2 and arterial Hb concentration (g/dL) were then used to calculate these measures of cerebral haemodynamics and oxygenation. The relevant formulae are shown below, where the measured variables are shown in bold type:
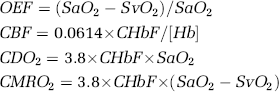
where CHbF is the CHbF, measured by near-infrared spectroscopy, measured in μmol/100 mL min, CBF is the cerebral blood flow. The calculation of CBF involves a constant (0.0614) (Meek et al, 1998), which is necessary to convert raw CHbF data generated by the Hamamatsu NIRO 500 from μmol/100 mL min into mL/100 mg min. This conversion incorporates neonatal brain tissue density (1.05) (Nelson et al, 1971) and the molecular weight of Hb (64,500 Da). CDO2 is the cerebral oxygen delivery, CMRO2 is the cerebral oxygen consumption. The calculation of both CDO2 and CMRO2 involves a constant (3.8), which is necessary to convert raw CHbF data generated by the Hamamatsu NIRO 500 from μmol/100 mL min into μmol/100 mg min of oxygen delivered or consumed. This conversion takes into account the ability of each Hb molecule to carry four molecules of oxygen, and incorporates the tissue density of the neonatal brain, which is 1.05 (Nelson et al, 1971). Hb is the arterial haemoglobin concentration, determined by laboratory analysis, measured in g/dL.
Echocardiographic Measurement of Left Ventricular Output
Left ventricular output was measured by echocardiography (Vingmed CFM 725 ultrasound scanner, Vingmed, Norway) with a 7.5 MHz probe (GE Ultrasound, USA). Aortic diameter was measured in an M-mode parasternal long axis view, using the trailing edge to leading edge method, which has less intraobserver variability than other methods (Hudson et al, 1990). The aortic diameter was taken as the average measurement for three cycles. Aortic pulsed Doppler signals were recorded from either suprasternal or apical sites, whichever permitted the best alignment of the ultrasound beam resulting in the strongest signal. The aortic flow velocity integral, which reflects average aortic red cell velocity, was obtained by measuring the area under the curve of the spectral trace. LVO was calculated from aortic diameter, aortic flow velocity integral, and heart rate. Three measurements were made and averaged to provide a final value for LVO.
Measurement of Other Variables
All infants had an indwelling arterial catheter for continuous blood pressure monitoring. Arterial Hb concentration was measured on each day. Arterial blood samples were taken for blood gas measurement after completion of the near infrared and echocardiographic studies.
Statistics
Data were analysed using SPSS version 10.0.07 (SPSS Inc., USA). Data are summarised as median (interquartile range) or mean±s.d. as appropriate. Normality of data was ascertained using histogram plots and Kolgorov–Smirnov test with a Lilliefors significance correction. Changes in cerebral OEF, LVO, mean arterial blood pressure, and other physiological variables, which were measured on each day, were analysed using Friedman's test, with subsequent differences analysed using paired t-test with Bonferroni correction. Changes in CBF, oxygen delivery, and oxygen consumption were analysed using weighted Pearson correlation coefficients (Bland and Altman, 1995). This method permits the analysis of data that include repeated measures by correlation, giving appropriate weight to data from those infants who have had more than one measurement. Relationships between the measured variables were also analysed using weighted Pearson correlation coefficients.
Results
Measurements
Thirteen infants were studied, and their descriptive details are shown in Table 1.
Descriptive details
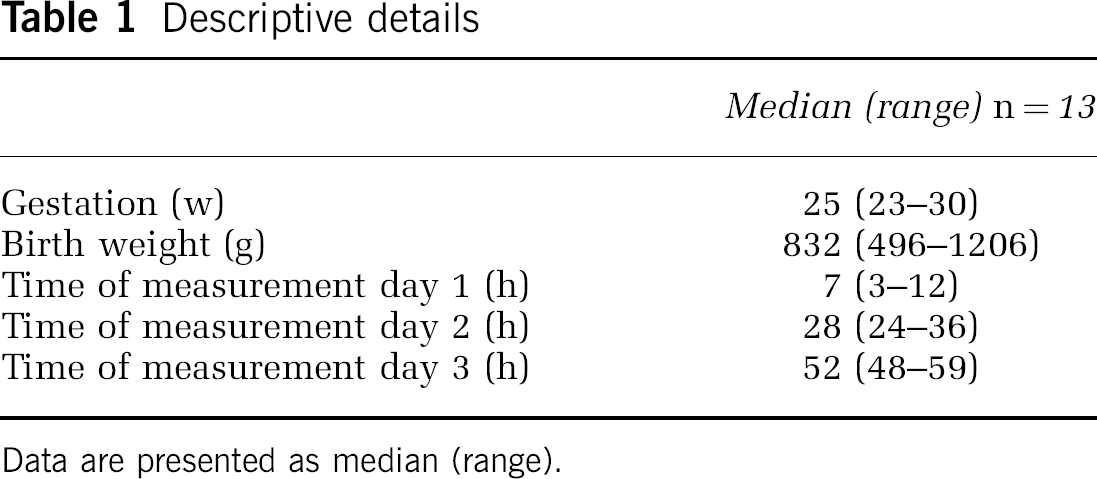
Data are presented as median (range).
There were successful measurements of cerebral SvO2 on all 3 days in 10 infants. Three infants had successful measurements on 2 days. The reasons for failure of the three missing measurements were rejection of recorded data for failure to meet preset standards because of movement artefact. Data for cerebral SvO2, cerebral OEF, and other measured variables are summarised in Table 2.
Cerebral venous saturation (SVO2), fractional oxygen extraction (OEF), left ventricular output (LVO), mean arterial blood pressure (MABP) and other physiological variables on the first 3 days after birth
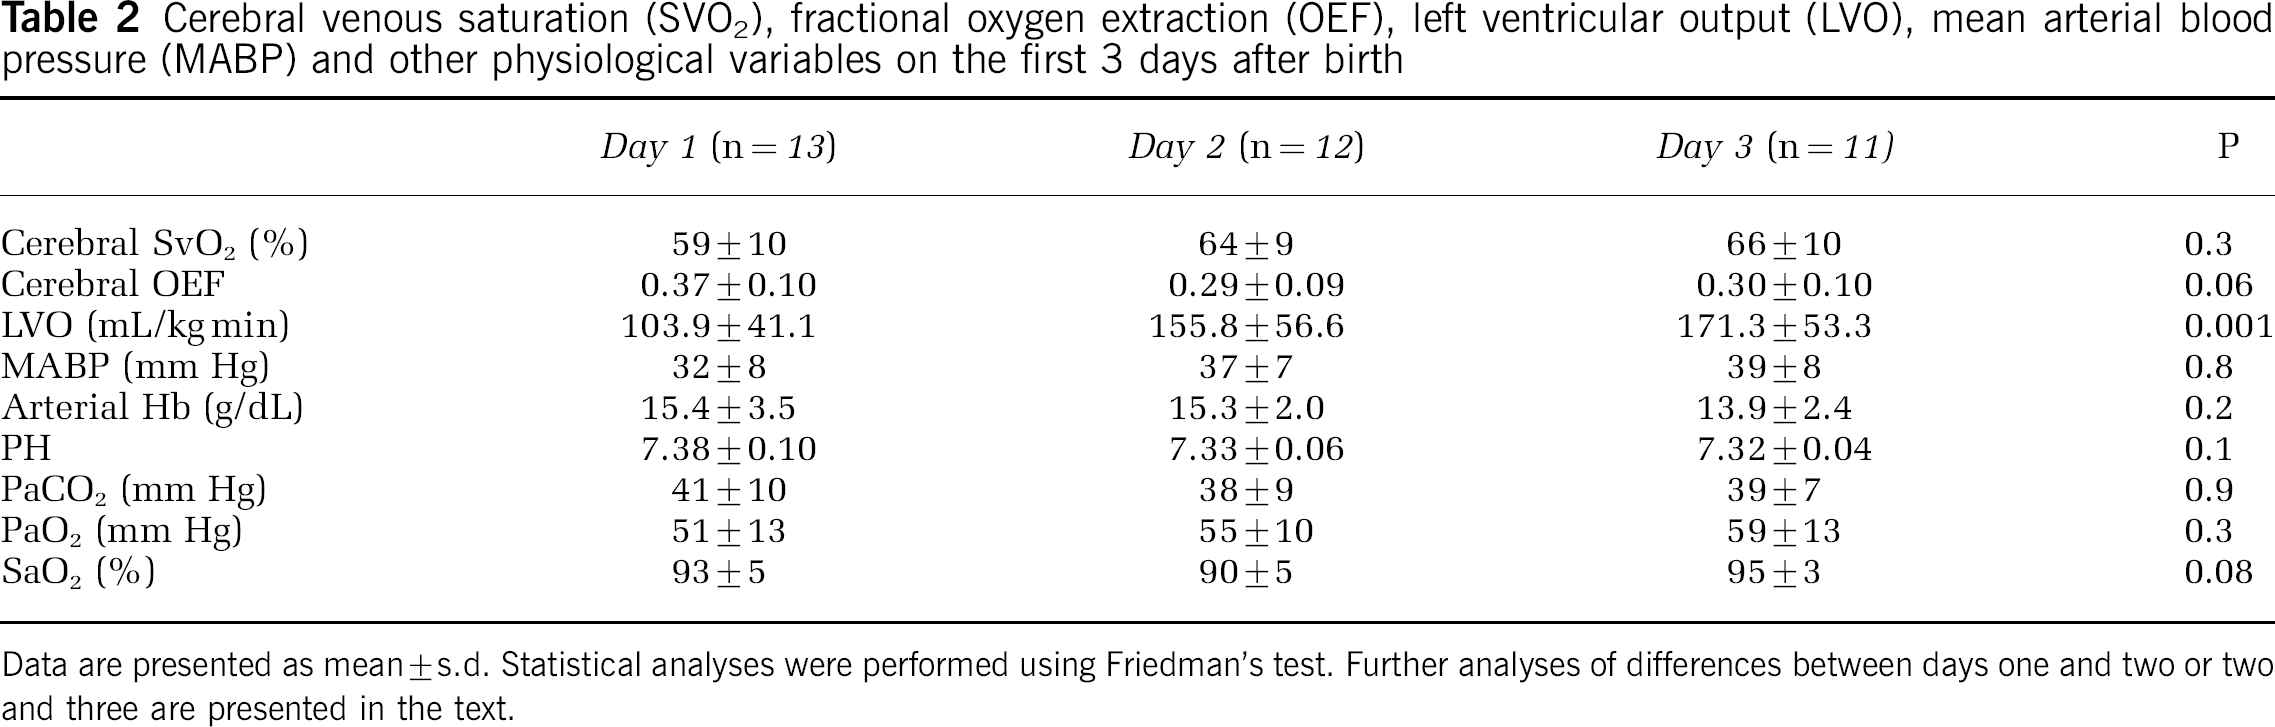
Data are presented as mean±s.d. Statistical analyses were performed using Friedman's test. Further analyses of differences between days one and two or two and three are presented in the text.
Cerebral haemoglobin flow measurements are technically difficult because of the limited range of FiO2 needed to make successful measurements. All infants had successful measurements on at least 1 day, but none of the infants had successful measurements of CHbF on all 3 days. Six infants had two measurements, and seven infants had only one such measurement. In 18 out of 20 failed measurements, the FiO2 was outside the range where the measurement can be made. In the other two cases, data were rejected for failure to meet preset standards because of movement artefact. Data for CHbF and variables derived from it are summarised in Table 3.
Cerebral haemoglobin flow, blood flow, oxygen delivery, and oxygen consumption for the first 3 days after birth
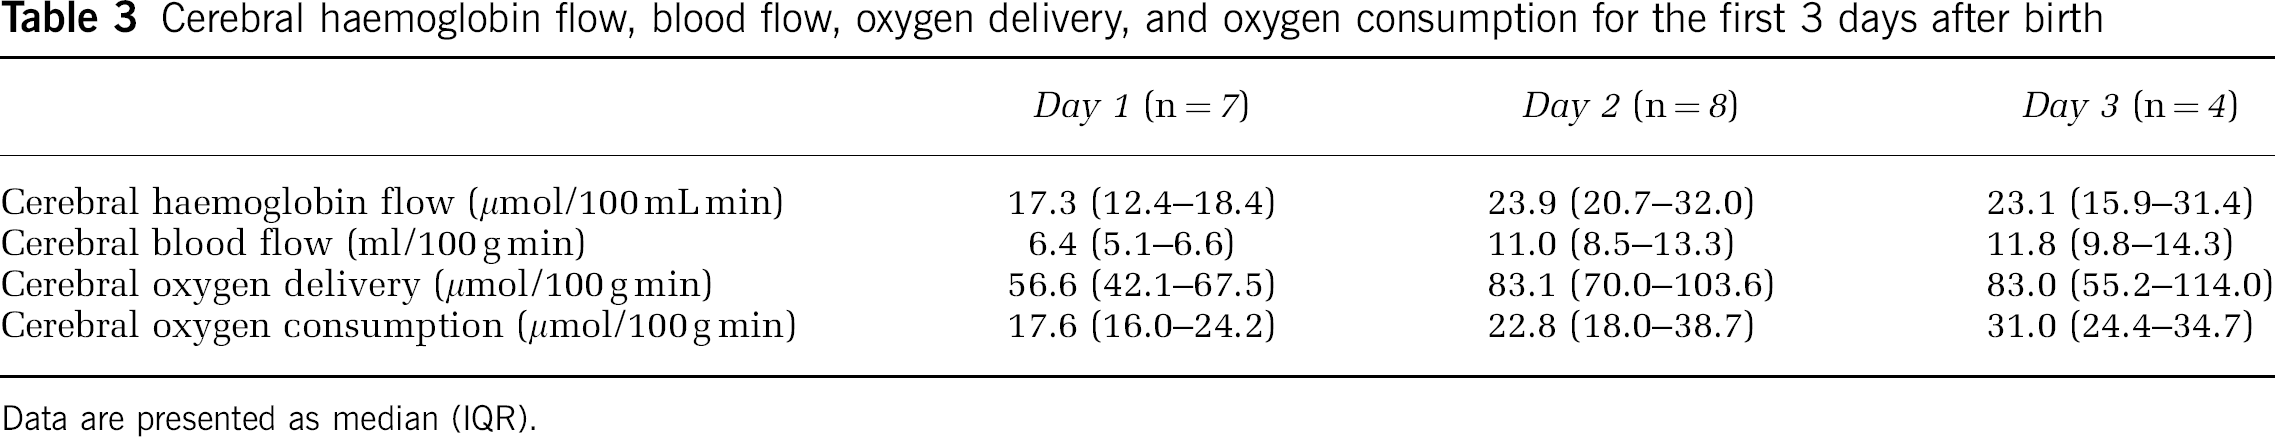
Data are presented as median (IQR).
Relationship of Cerebral Venous Saturation with Haemoglobin Flow and Derived Measures of Cerebral Haemodynamics and Oxygenation
These data were analysed, where appropriate, using weighted Pearson correlation coefficients. The relationship between cerebral SvO2 and CHbF just failed to reach statistical significance (n=13, r=0.5, P=0.06), and is shown in Figure 1. There was no correlation between cerebral SvO2 and CBF. There was a significant positive correlation between cerebral SvO2 and cerebral oxygen delivery (n=13, r=0.5, P=0.04), as shown in Figure 2. Analysis of correlation between SvO2 and cerebral OEF or cerebral oxygen consumption was inappropriate as both OEF and oxygen consumption are calculated variables that depend on cerebral SvO2.
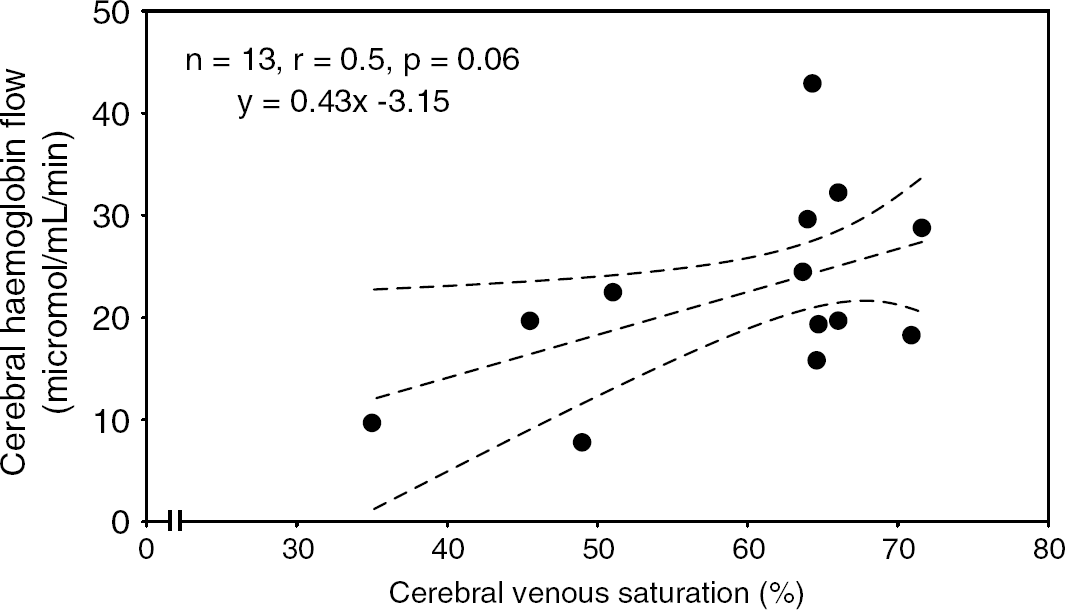
Plot of cerebral haemoglobin flow against cerebral venous saturation. There was no significant correlation between haemoglobin flow and cerebral venous saturation.
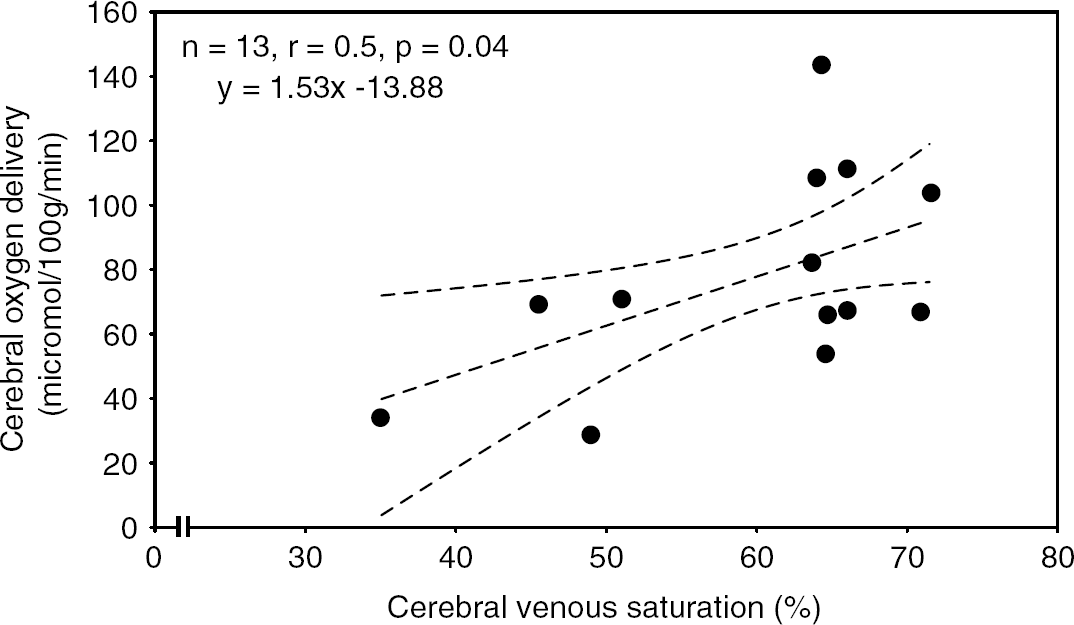
Plot of cerebral oxygen delivery against cerebral venous saturation. There was a significant positive correlation between oxygen delivery and venous saturation, shown using weighted Pearson correlation coefficient.
Relationship of Cerebral Fractional Oxygen with Haemoglobin Flow and Derived Measures of Cerebral Haemodynamics and Oxygenation
These data were analysed, where appropriate, using weighted Pearson correlation coefficients. There was no correlation between cerebral OEF and CHbF or blood flow. There was a significant negative correlation between cerebral OEF and cerebral oxygen delivery (n=13, r=−0.6, P=0.03), as shown in Figure 3. Analysis of correlation between cerebral OEF and cerebral oxygen consumption was inappropriate as both OEF and oxygen consumption are calculated variables dependent on a common variable, cerebral SvO2.
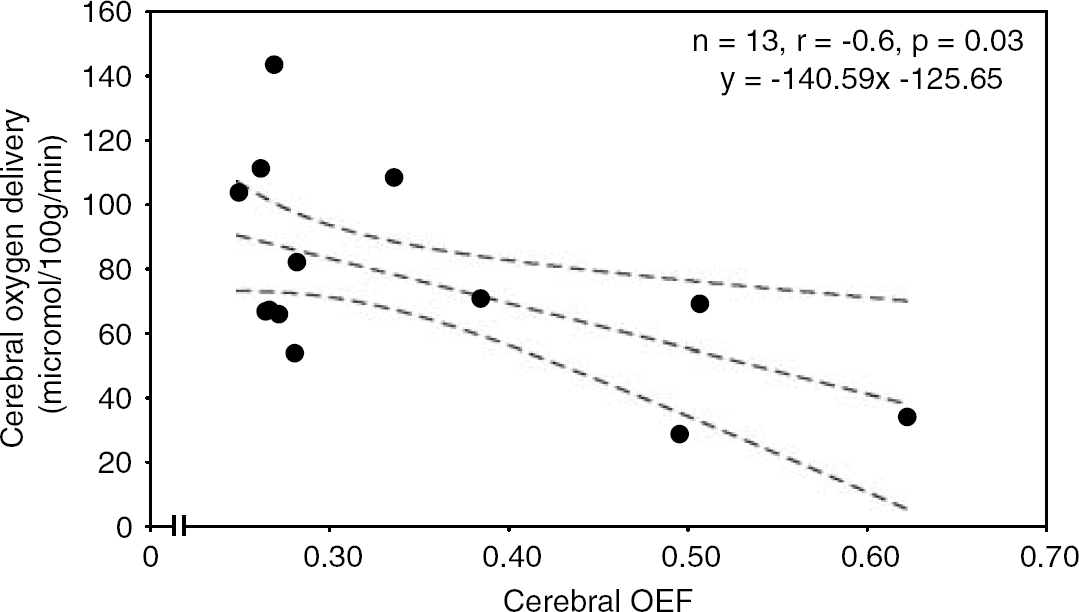
Plot of cerebral oxygen delivery against cerebral fractional oxygen extraction (OEF). There was a significant negative correlation between oxygen delivery and cerebral OEF, demonstrated using weighted Pearson correlation coefficient. This result should be interpreted with caution as both formulae are dependent on arterial oxygen saturation.
Changes in Cerebral Haemodynamics and Oxygenation
Cerebral SvO2 and cerebral OEF data are summarised in Table 2. Mean cerebral SvO2 did not change significantly during the 3 days of measurement. Mean cerebral OEF demonstrated a decrease, which bordered on significant (P=0.06), during the first 3 days after birth. Further analysis following visual inspection of the data revealed a significant decrease in mean cerebral OEF between day 1 and day 2 (P=0.04), with no significant change between day 2 and day 3 (Figure 4).
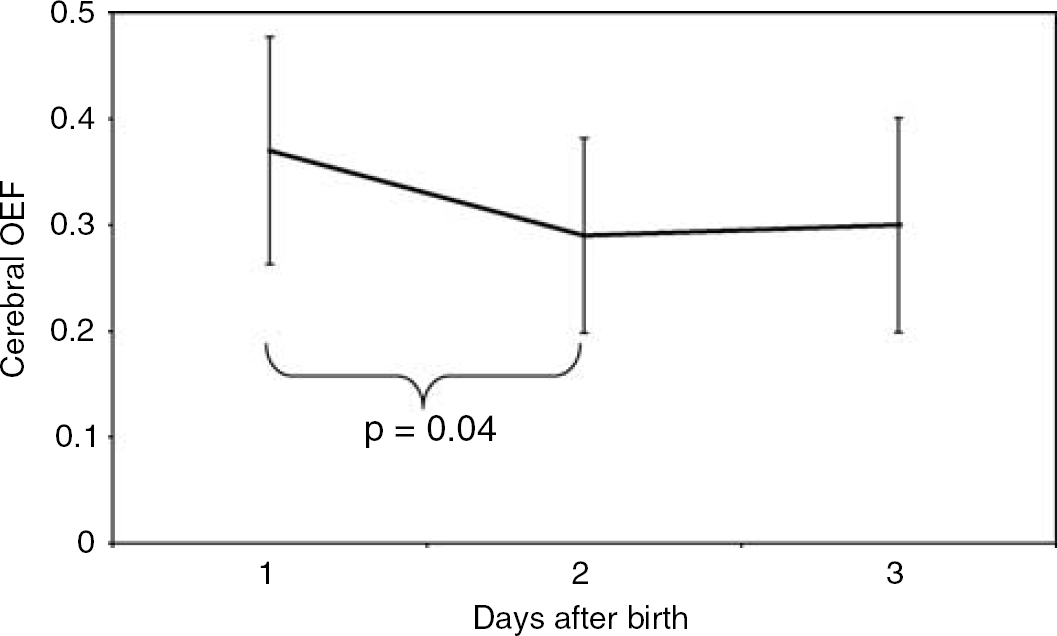
Cerebral fractional oxygen extraction (OEF) during the first 3 days after birth. Data are plotted as means with standard deviations. There was a significant decrease in cerebral OEF between days 1 and 2.
Cerebral haemoglobin flow, blood flow, oxygen delivery, and oxygen consumption data are summarised in Table 3. These variables were analysed using weighted Pearson correlation coefficients. Cerebral blood flow demonstrated a significant increase (n=13, r=0.7, P=0.01) during the first three days after birth (Figure 5). There was also a significant increase (n=13, r=0.5, P=0.03) in cerebral oxygen delivery during the same period (Figure 6). Cerebral oxygen consumption also demonstrated a significant increase (n=13, r=0.7, P=0.004) during the first 3 days after birth (Figure 7).
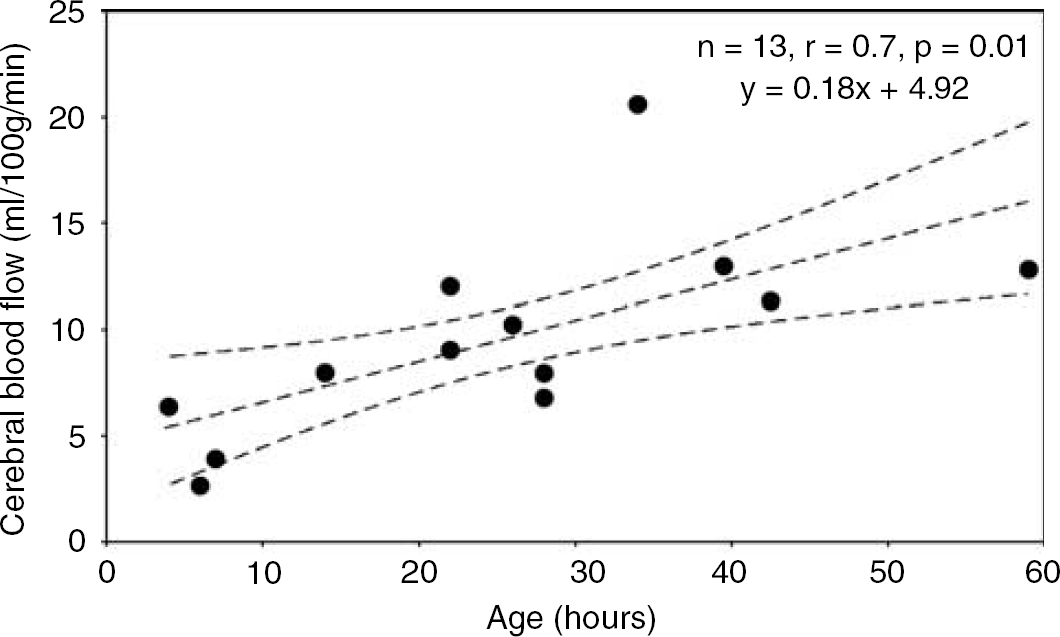
Plot of cerebral blood flow (CBF) against time from birth in hours. There was a significant increase in CBF during the time of measurement, shown using weighted Pearson correlation coefficient.
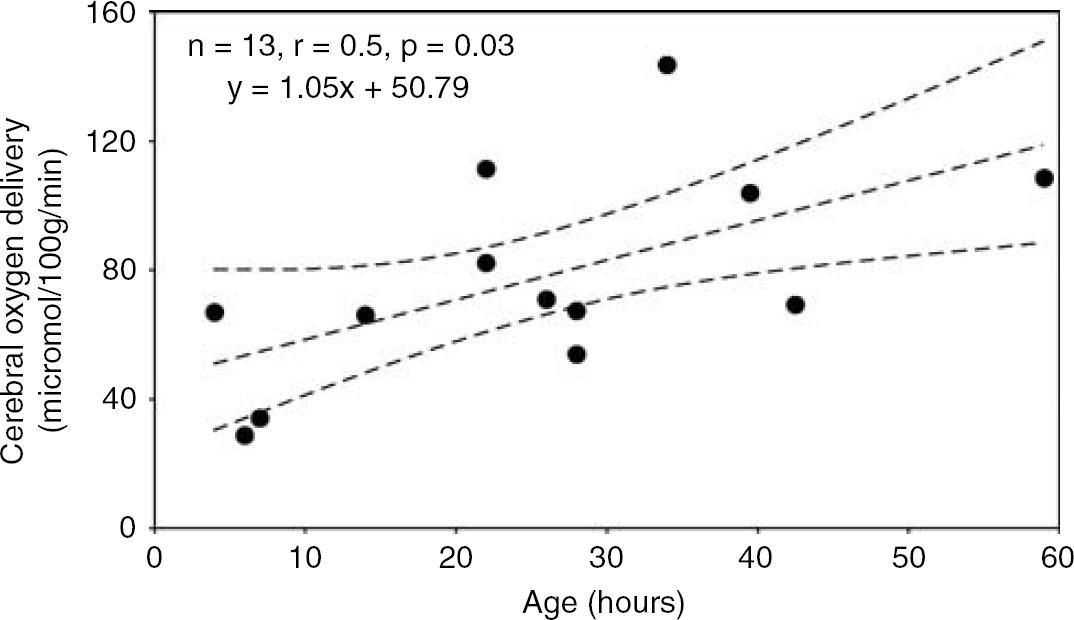
Plot of cerebral oxygen delivery against time from birth in hours. There was a significant increase in cerebral oxygen delivery during the time of measurement, shown using weighted Pearson correlation coefficient.
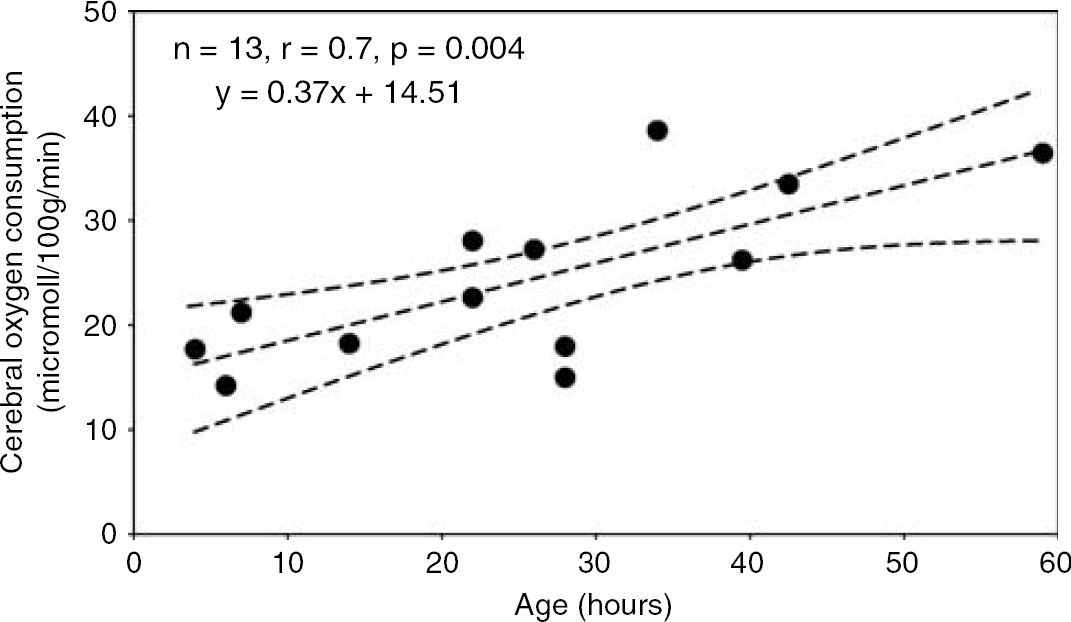
Plot of cerebral oxygen consumption against time from birth in hours. There was a significant increase in cerebral oxygen consumption during the time of measurement, shown using weighted Pearson correlation coefficient.
Variables that Influence Cerebral Blood Flow and Arterial Oxygen Content
These data are summarised in Table 3.
Left ventricular output increased (P=0.001) during the first 3 days after birth (Table 2). The significant increase in LVO occurred between days 1 and 2 (P=0.01), with no significant change between days 2 and 3. There was no significant change in other measured variables that could influence CBF or arterial oxygen content over the 3 days of measurement. These included mean arterial blood pressure, arterial Hb concentration, pH, PaCO2, PaO2, and SaO2. There was no significant correlation between LVO and CBF, nor mean arterial blood pressure and CBF, on days 1, 2 or 3.
Discussion
This study has confirmed the observation that there are notable changes in haemodynamics in very preterm infants shortly after birth (Evans and Kluckow, 1996, 2001; Kissack et al, 2004). In particular, it has suggested that these haemodynamic changes affect cerebral oxygenation as in this cohort of sick, preterm infants, CBF, cerebral oxygen delivery, and cerebral oxygen consumption also increased during the first 3 days after birth. In addition, there was a negative correlation between cerebral oxygen delivery and cerebral OEF.
The range of cerebral OEF described in this study is higher than one previous report of cerebral OEF measured in newborn infants (Altman et al, 1993). This previous study described lower cerebral OEF in a cohort of 11 infants, with two preterm infants having extremely low CMRO2 and cerebral OEF. The values demonstrated in our study, however, are comparable with more recent studies of cerebral OEF in both preterm infants (Wardle et al, 1998) and in older children undergoing cardiopulmonary bypass (Wardle et al, 2000). The discrepancy between our data and that of Altman et al most probably reflects the differences between the two study populations. Of the 11 infants studied by Altman et al, many of whom were term infants with hypoxic–ischemic encephalopathy or required extra-corporeal membranous oxygenation, the majority had abnormal neurological outcome including spastic quadriparesis, seizures, microcephaly, persistent vegetative state, and death. Of the preterm infants in that study group, only one had no brain injury identified on cranial ultrasound. The conclusion is that this was a highly selected cohort of very sick infants many of whom had apparent neurological morbidity. In contrast, our study group was defined by gestation, rather than a particular diagnosis, and so included many infants who, although sick, had no gross neurological disorder. In addition, advances in neonatal intensive care during the elapsed time between the two studies will only further accentuate the differences between the two groups.
Relationship between Cerebral Oxygen Delivery and Cerebral Oxygen Extraction Fraction
On the first day after birth there was low CDO2, which subsequently increased during the first 3 days. This was associated with a significant decrease in cerebral OEF between days 1 and 2, although OEF was not in itself high on day 1, with a mean (±s.d.) value of 0.37 (±0.1). As this study has demonstrated a negative correlation between cerebral OEF and cerebral oxygen delivery, it is likely that these findings are related, and that when cerebral oxygen delivery is reduced, there is increased removal of available oxygen from the blood by the cerebral tissues resulting in increased OEF.
This interpretation should be treated with caution, however, as cerebral oxygen delivery and cerebral OEF were not wholly independent variables in this study, both being calculated values that depended, in part, on SaO2. Nevertheless, SaO2 was fairly constant throughout. Our observations therefore support the view that when cerebral oxygen delivery decreases in these vulnerable babies, oxygen extraction increases. This may be a mechanism for maintaining the provision of oxygen to the cerebral tissues, thus preserving cerebral metabolism, when cerebral oxygen delivery is decreased.
Increased Cerebral Oxygen Delivery and Cerebral Blood Flow During the First 3 Days After Birth
Along with the increase in cerebral oxygen delivery that occurred during the first 3 days after birth, there was a significant increase in CBF (Table 3, Figure 5), a finding that has been previously described in preterm infants (Meek et al, 1998). Cerebral blood flow is one of two important determinants of CDO2, the other being cerebral arterial oxygen content. This study did not demonstrate any significant increase in arterial Hb concentration, SaO2 or PaO2, and thus the observed increase in cerebral oxygen delivery is much more likely to be a result of increased CBF than a change in arterial oxygen content. Using our methodology, however, examination of any relationship between cerebral oxygen delivery and CBF would have been inappropriate as both are calculated variables derived from CHbF.
Cerebral blood flow depends on cerebral perfusion pressure and cerebrovascular resistance, both of which may be influenced by several variables. Cerebral perfusion pressure is directly influenced by mean arterial blood pressure. Arterial blood pressure is determined by LVO and peripheral systemic vascular resistance. There is evidence that in the preterm neonate, blood pressure and cerebral oxygenation index (HbO−Hb), which most probably reflects CBF, have a significant coherence (Tsuji et al, 2000). This finding implies absent cerebral autoregulation in some preterm infants. There were no significant changes in blood pressure during the course of this study, but there was a significant increase in LVO which was initially low, a finding which has been previously described (Evans and Kluckow, 2001). Low LVO may occur in the sick, preterm infant because of a number of reasons, such as hypoxaemia and acidosis (Downing et al, 1966; Fisher, 1986).
In our study, the demonstrated increase in LVO is the only variable that changed significantly and could feasibly be responsible for the increase in CBF. Nevertheless, we did not show a significant correlation between these two variables in this study; however, this may reflect the small population studied, a result of the difficult near-infrared techniques used. In a previous study of 36 preterm infants, however, we have shown a significant negative correlation between cerebral OEF and LVO (Kissack et al, 2004). This finding may indicate that when LVO is low, there is reduced CBF in some areas of the brain, with a consequent reduction in oxygen delivery and an increased OEF as a result. Our previous findings were not confirmed by this study, but again this may reflect the small population studied.
The normal response to a reduced cerebral blood flow would be cerebral vasodilatation, but an increased cerebral OEF implies that this has not occurred, or has been insufficient to prevent the rise in oxygen extraction. This may imply that these sick infants have impaired cerebral autoregulation, which is in agreement with previous studies of preterm infants (Tsuji et al, 2000). Alternatively, there may be vasoconstriction in some areas of the brain, such as the cortex, so that blood flow to other vital areas such as the brainstem is preserved; animal studies have shown preferential perfusion of the brainstem in the presence of hypoxaemia and hypoglycaemia (Anwar and Vannucci, 1988; Odden et al, 1989). It is important to note, however, that there is no evidence for this phenomenon in human infants, and so failure of cerebral vasodilatation is a more likely explanation. It is not possible to show preferential perfusion with the methodologies used for this study, as near infrared photons have limited penetration and the data generated depends on changes in cortical haemodynamics and oxygenation.
Cerebrovascular resistance, another important influence on CBF, is responsive to a number of changes in blood biochemistry, decreasing with a rise in PaCO2 (Greisen and Trojaborg, 1987) and increasing with a rise in PaO2 (Lundstrom et al, 1995). In addition, use of high concentrations of oxygen at delivery may increase cerebrovascular resistance, which may remain high for several hours (Leahy et al, 1980; Lundstrom et al, 1995; Rahilly, 1980a). There were no significant changes in PaCO2 or PaO2 in the course of this study so it is unlikely that the increase in CBF shown was the result of cerebral vasodilatation caused by a change in blood gases over the first 3 days. Nevertheless, infants in our unit are resuscitated at delivery using oxygen at a fractional inspired concentration of 0.6, so this remains a possible explanation for the reduced CBF seen on the first day after birth, an effect that would have disappeared by day 2.
Postnatal Increase in CMRO2
This study has also shown an increase in cerebral oxygen consumption, for which there are two possible interpretations. The most probable explanation concerns the relationship between oxygen consumption and metabolic activity. Cerebral oxygen consumption reflects cerebral metabolic activity (Altman et al, 1993, Greisen et al, 1985; Milligan, 1979; Perlman and Volpe, 1983; Rahilly, 1980b). Thus, the observed increase in oxygen consumption may reflect increased cerebral metabolic activity, which is likely to be a normal adaptation to extrauterine life. This conclusion would be in agreement with animal work, which has demonstrated a change in both white and grey matter blood flow, and grey matter oxygen consumption, when comparing fetal and neonatal lambs (Purves and James, 1969). In addition, work in the preterm human infant has demonstrated very low CMRO2 shortly after birth, with values between 0.06 and 5.4 mL/100 g min (Altman et al, 1993). In that study, two infants with the lowest CMRO2 survived without neurological sequelae, implying that the low CMRO2 was appropriate for the metabolic demands of the cerebral tissues, and it is likely that the same is true for the infants in our study. In this case, the changes in LVO, CBF, and CDO2 would all be appropriate in view of the increased cerebral metabolic activity and CMRO2.
It is notable, however, that although the study group had a normal mean cerebral OEF on day one, some infants had extreme values of CBF and OEF at this time, as low as 2.6 mL/100 g min and as high as 0.62, respectively. The observation of a very high cerebral OEF implies a very low oxygen delivery. As discussed above, this is probably a result of low CBF, possibly because of low LVO, possibly in combination with inappropriate cerebral vasoconstriction for other reasons such as hypocarbia or hyperoxia. The latter is known to reflect resuscitation practices (Leahy et al, 1980; Lundstrom et al, 1995; Rahilly, 1980a), but abnormal blood gases relating to lung disease and ventilatory practices may also play a role. If this interpretation is true then at least this infant, and possibly others, may be in a delivery-dependent state of cerebral oxygen consumption on day 1. On subsequent days, such extreme values of cerebral OEF are not seen, which may reflect the improved haemodynamic and respiratory status of the infants, especially improved LVO, mean arterial blood pressure, and arterial blood gases.
Conclusion
In conclusion, this study has demonstrated a negative correlation between cerebral OEF and cerebral oxygen delivery on the first day after birth in sick, very preterm infants. This suggests that increased cerebral OEF is likely to be a compensatory mechanism indicating that adequate cerebral tissue oxygenation is maintained in the presence of reduced CBF and oxygen delivery. Within the study group, there was at least one infant with very high cerebral OEF on the first day, which was most probably a consequence of low CBF and oxygen delivery secondary to diminished cardiac function, possibly with abnormalities of blood gases, after premature birth. Infants with such high values of cerebral OEF may have delivery-dependent oxygen consumption and are at risk of hypoxic–ischemic cerebral injury.
Nevertheless the majority of these sick, preterm infants displayed normal values of cerebral OEF, and values for CBF and CMRO2 in keeping with previously published data. During the 3 days after birth, there were increases in CBF, oxygen delivery, and oxygen consumption, which most likely reflect increased cerebral metabolic activity, a postnatal adaptation to extrauterine life.