
Abstract
The proinflammatory cytokine, tumor necrosis factor-alpha (TNF-α), has been suggested to mediate septic encephalopathy through an effect on cerebral blood flow (CBF) and metabolism. The effect of an intravenous bolus of endotoxin on global CBF, metabolism, and net flux of cytokines and catecholamines was investigated in eight healthy young volunteers. Cerebral blood flow was measured by the Kety-Schmidt technique at baseline (during normocapnia and voluntary hyperventilation for calculation of subject-specific cerebrovascular CO2 reactivity), and 90 minutes after an intravenous bolus of a reference Escherichia coli endotoxin. Arterial TNF-α peaked at 90 minutes, coinciding with a peak in subjective symptoms. At this time, CBF and Pa
Sepsis is frequently accompanied by systemic vasodilatation and increased cardiac output, with or without a low mean arterial pressure (Wheeler and Bernard, 1999). Cerebral dysfunction, known as septic encephalopathy, is a common manifestation in the early course of sepsis (Bolton et al., 1993). Even so, little is known about the initial events occurring in the brain during human sepsis. The proinflammatory cytokine, tumor necrosis factor-alpha (TNF-α), may be a mediator of septic encephalopathy through an effect on cerebral blood flow (CBF) and metabolism (Papadopoulos et al., 2000). However, data regarding CBF in sepsis are conflicting; clinical studies have shown that CBF is low in patients with sepsis and multiple-organ failure (Bowton et al., 1989; Maekawa et al., 1991), whereas animal studies have reported this parameter to be reduced (Parker and Emerson, 1977; Ekström-Jodal et al., 1982), unaltered (Law and Ferguson, 1987), or increased (Offner et al., 1995) after endotoxin administration. The data regarding cerebral metabolic rates (CMR) are also contradictory, because patients are reported to have low CMR of oxygen (CMR
A human experimental model for sepsis has been developed, using an intravenous bolus injection of purified Escherichia coli endotoxin (Elin et al., 1981). The advantage of this model is a well-defined starting point and a reproducible, highly dynamic course displaying the features of a systemic inflammatory response that is fully reversible within hours. The systemic characteristics and safety of the human endotoxemia model have been amply documented (for review, see Santos and Wilmore, 1996). The initial symptoms, consisting of headaches, chills, and malaise, occur at 60 minutes and peak at 90 minutes after endotoxin injection, followed by a gradual resolution over the next 2 to 3 hours. The temperature peaks at 4 hours after endotoxin and decreases gradually thereafter. The peak in symptoms at 90 minutes coincides with a peak in the arterial concentration of TNF-α, whereas the concentrations of interleukin (IL)-6 and IL-1 β peak at 2 to 3 hours and at 4 hours after endotoxin, respectively (Krabbe et al., 2001).
The present study was performed to measure CBF and oxidative metabolism during endotoxemia in human volunteers. The primary aim was to characterize the cerebral hemodynamic and metabolic events associated with a high intravascular concentration of TNF-α induced by intravenous endotoxin administration; therefore, we measured CBF, oxidative metabolism, and the cerebral flux of cytokines and catecholamines at 90 minutes after endotoxin injection, at the time of the peaking TNF-α concentration.
SUBJECTS AND METHODS
The study was approved by the Scientific-Ethical Committee of Copenhagen and Frederiksberg Municipalities [jr. number (KF) 01-144/98, with amendment (KF) 11-095/00]. Eight healthy human volunteers [median age, 25 (range, 21–28) years; one woman] were included following oral and written informed consent. All subjects had a clinical examination prior to inclusion in the study. Blood tests for electrolytes, hemoglobin, white blood cell and differential counts, renal and hepatic function and coagulation screen tests, as well as an electrocardiogram were carried out; all tests showed normal results. No person entering the study had experienced any signs or symptoms of infection during the 2 weeks preceding endotoxin challenge.
Study design
The study was performed during 24 hours of hospitalization after an overnight fast. Peripheral catheters were inserted into the left antecubital vein for endotoxin injection and isotope infusion, and into the right antecubital vein for fluid administration; isotonic glucose was infused to prevent hypoglycemia. A catheter was placed in a radial artery for blood pressure monitoring and blood sampling, and a jugular bulb catheter was placed in the right internal jugular vein for blood sampling. Rectal temperature, arterial pressure, electrocardiogram, and peripheral oxygen saturation were continuously monitored.
Subjects rested for 1 hour after catheter placement before blood sampling and CBF measurements were begun. With the subjects placed in the supine position, CBF, cerebral metabolic rates, and cerebral fluxes were studied three times in the following sequence: (1) at baseline during normocapnia; (2) at baseline during voluntary hypocapnia, initiated 15 minutes prior to measurements; (3) 11?2 hours after an intravenous bolus injection of endotoxin (Endotoxin E. coli; lot EC-6, United States Pharmacopeia Convention, Rockville, MD, U.S.A.) at a dose of 2 ng/kg body weight. Blood sampling was done at baseline and 1, 1 ½, 2, 3, 4, 8, and 24 hours after endotoxin; paired samples were drawn from the arterial and jugular venous catheter until 4 hours, after which samples were obtained from the arterial catheter at 8 hours and from an antecubital vein at 24 hours.
Measurements
Cerebral blood flow and oxidative metabolism
Global CBF, CMR, and fluxes were measured by the Kety-Schmidt technique (Kety and Schmidt, 1948a) in the desaturation mode (Madsen et al., 1993). 133Xe dissolved in saline was used as the tracer; the effective dose of 133Xe was 0.5 mSv per study. Following a saturating 30-minute infusion, blood samples for measurement of 133Xe activity were drawn into preweighed syringes simultaneously from the arterial and the jugular venous catheters at the times −2, −1, 0, ½, 1, 2, 3, 4, 6, 8, and 10 minutes after cessation of the Xe infusion. The endotoxin injection was given at t = −90 minutes, that is, the CBF measurement was done at exactly 90 minutes after endotoxin injection; in one subject, the endotoxin was given at t = −120 minutes, that is, the CBF measurement was delayed until 120 minutes after endotoxin.
After sampling, the syringes were reweighed and sealed in gas-tight vials. Samples were counted for 10 minutes on a scintillation counter (Cobra II, Packard Instruments, Meriden, CT, U.S.A.) and automatically corrected for background activity and decay.
Arterial and jugular venous blood samples for blood gas analysis and measurement of lactate and glucose content were obtained at −1, 4, and 8 minutes. Gas tensions were immediately measured on an ABL 610 and oxygen saturations on an OSM 3 (both Radiometer, Copenhagen, Denmark). For measurement of glucose and lactate concentrations, samples were drawn into fluoride-containing tubes and centrifuged. Plasma was stored at −20°C until analyzed by an enzymatic method, using a YSI 2700 (Yellow Spring Instruments, Yellow Springs, OH, U.S.A.). Plasma glucose concentration was subsequently recalculated to whole-blood concentration.
Cytokines
Samples were drawn into aprotinin (Trasylol; Bayer A.G., Leverkusen, Germany)-containing tubes, immediately centrifuged, and separated, after which plasma was stored at −80°C until analysis. Plasma concentrations of TNF-α, IL-1β, and IL-6 were measured by the enzyme-linked immunosorbent assay (ELISA) technique; all samples were analyzed in duplicate, and mean concentration was calculated. TNF-α: Plasma concentrations were measured using both a high-sensitivity and a low-sensitivity assay (high sensitivity: Quantikine HS, R&D Systems, Minneapolis, MN, U.S.A.; average recovery, 97%; lower detection limit, 0.12 ng/L; low sensitivity: OptEIA, PharMingen, San Diego, CA, U.S.A.; lower detection limit, 15,6 ng/L). Peak plasma concentrations occurred at identical times after endotoxin with both assays; recovery of the low-sensitivity assay was lower than the high-sensitivity assay. The values of all subjects but one were within the reference capacity of the high-sensitivity assay; all reported values of this last subject were those obtained with the low-sensitivity assay. This substitution did not affect the results of statistical analysis in the group. IL-1β: Plasma concentrations were determined by a high-sensitivity ELISA (Quantikine HS, R&D Systems; lower detection limit, 0.125 ng/L). IL-6: Plasma concentrations were measured by a high-sensitivity assay (Quantikine HS; lower detection limit, 0.094 ng/L).
Catecholamines
Samples were drawn into ice-chilled tubes containing glutathione (1.3 mg/mL blood) and EGTA (1.5 mg/mL blood), immediately centrifuged, and separated. Plasma was stored at −80°C until analysis. Plasma concentrations of norepinephrine and epinephrine were measured by high-performance liquid chromatography (Hewlett-Packard, Wald-bronn, Germany) with electrochemical detection as described by Hallman et al. (1978).
Calculations
Global CBF in mL·100 g−1·min−1 was calculated from the Kety-Schmidt equation (Kety and Schmidt, 1945) as
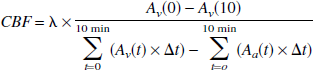
where A v (t) and A a (t) denote decay- and background-corrected activities of 133Xe (in cpm/g blood) of the jugular venous and arterial sample, respectively, at time t. Λ is the brain-blood partition coefficient for Xe in milliliters per gram, which was calculated from the individual Hb (in mmol/L) as (Hoedt-Rasmussen et al., 1966)

We expected from previous studies that subjects would be hypocapnic when the peak in TNF-α occurred. To assess whether any observed change in CBF at this time could be ascribed solely to hypocapnia, we calculated the CO2-corrected value of CBF for comparison with baseline CBF. Therefore, cerebrovascular carbon dioxide reactivity (CO2R) was calculated in each subject from values measured during baseline ventilation and spontaneous hyperventilation as the percent change in CBF per kPa change in Pa
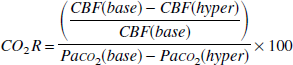
where suffixes base and hyper denote values measured at baseline and during hyperventilation, respectively.
CO2-corrected CBF during endotoxemia (CBFcorr) was then calculated using subject-specific CO2R as
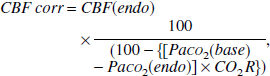
where the suffix endo denotes values measured at 90 minutes after endotoxin injection. In one subject, the CBF measurement during hypocapnia was discarded because of an infusion pump error; in this subject, CBFcorr was calculated using the mean CO2R of the remaining subjects. CBFcorr was used solely for comparison with baseline CBF.
The arterial concentration of oxygen, Ca

where Hb denotes the blood hemoglobin concentration in mmol/L; Sa
The cerebral metabolic rate of oxygen (O2), glucose (glu), lactate (lac) (in μmol/g/min), were calculated by the Fick principle (Fick, 1870), i.e.,
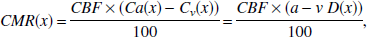
where CMR(x) is the global net flux over the blood-brain barrier; C a (x) and C v (x) denote arterial and jugular venous concentrations in mmol/L, respectively; and a - v D(x) is the arterial-to-jugular concentration difference of substance x.
Correspondingly, the cerebral net flux, J, of cytokines (in picograms per gram per minute) and catecholamines (in picomoles per gram per minute) was calculated as
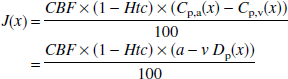
where Htc is the hematocrit, whereas Cp,a, Cp,v, and a - v Dp denote the measured arterial and jugular venous plasma concentration and the arterial-to-jugular plasma concentration difference, respectively, in ng/L (cytokines) or nmol/L (catecholamines) of substance x.
By definition, a positive value of CMR or J indicates consumption (or net influx), and a negative value indicates production (or net efflux), of the substance.
STATISTICAL ANALYSIS
Reported values are medians and ranges. Nonparametric methods were used throughout. P < 0.05 was considered statistically significant. To detect cerebral effects occurring simultaneously with the peak in arterial concentration of TNF-α, which was the primary aim of the study, Wilcoxon's test for paired samples was done separately to compare measurements done at baseline and 1 ½ hours after endotoxin. In addition, within-subject variations occurring during the first 4 hours after endotoxin were detected by Friedman's test, followed by Wilcoxon's test for paired data to identify significant differences. Analysis was performed using SPSS (Chicago, IL, U.S.A.) Base and Advanced Models Version 11.0 for Windows.
RESULTS
Clinical effects of endotoxin
The injection of endotoxin produced a highly uniform inflammatory response, the systemic features of which are displayed in Fig. 1. Clinical symptoms occurred after 1 hour, increased in severity until 1 ½ hours, and gradually subsided thereafter. Primary symptoms were chills and headache, followed by shivering, myalgias, nausea, and (in one subject) vomiting. The temperature, mean arterial pressure (MAP), heart rate, and peripheral oxygen saturation all changed significantly during the first four hours (P < 10−17, < 10−8, < 10−12, and < 10−6, respectively).
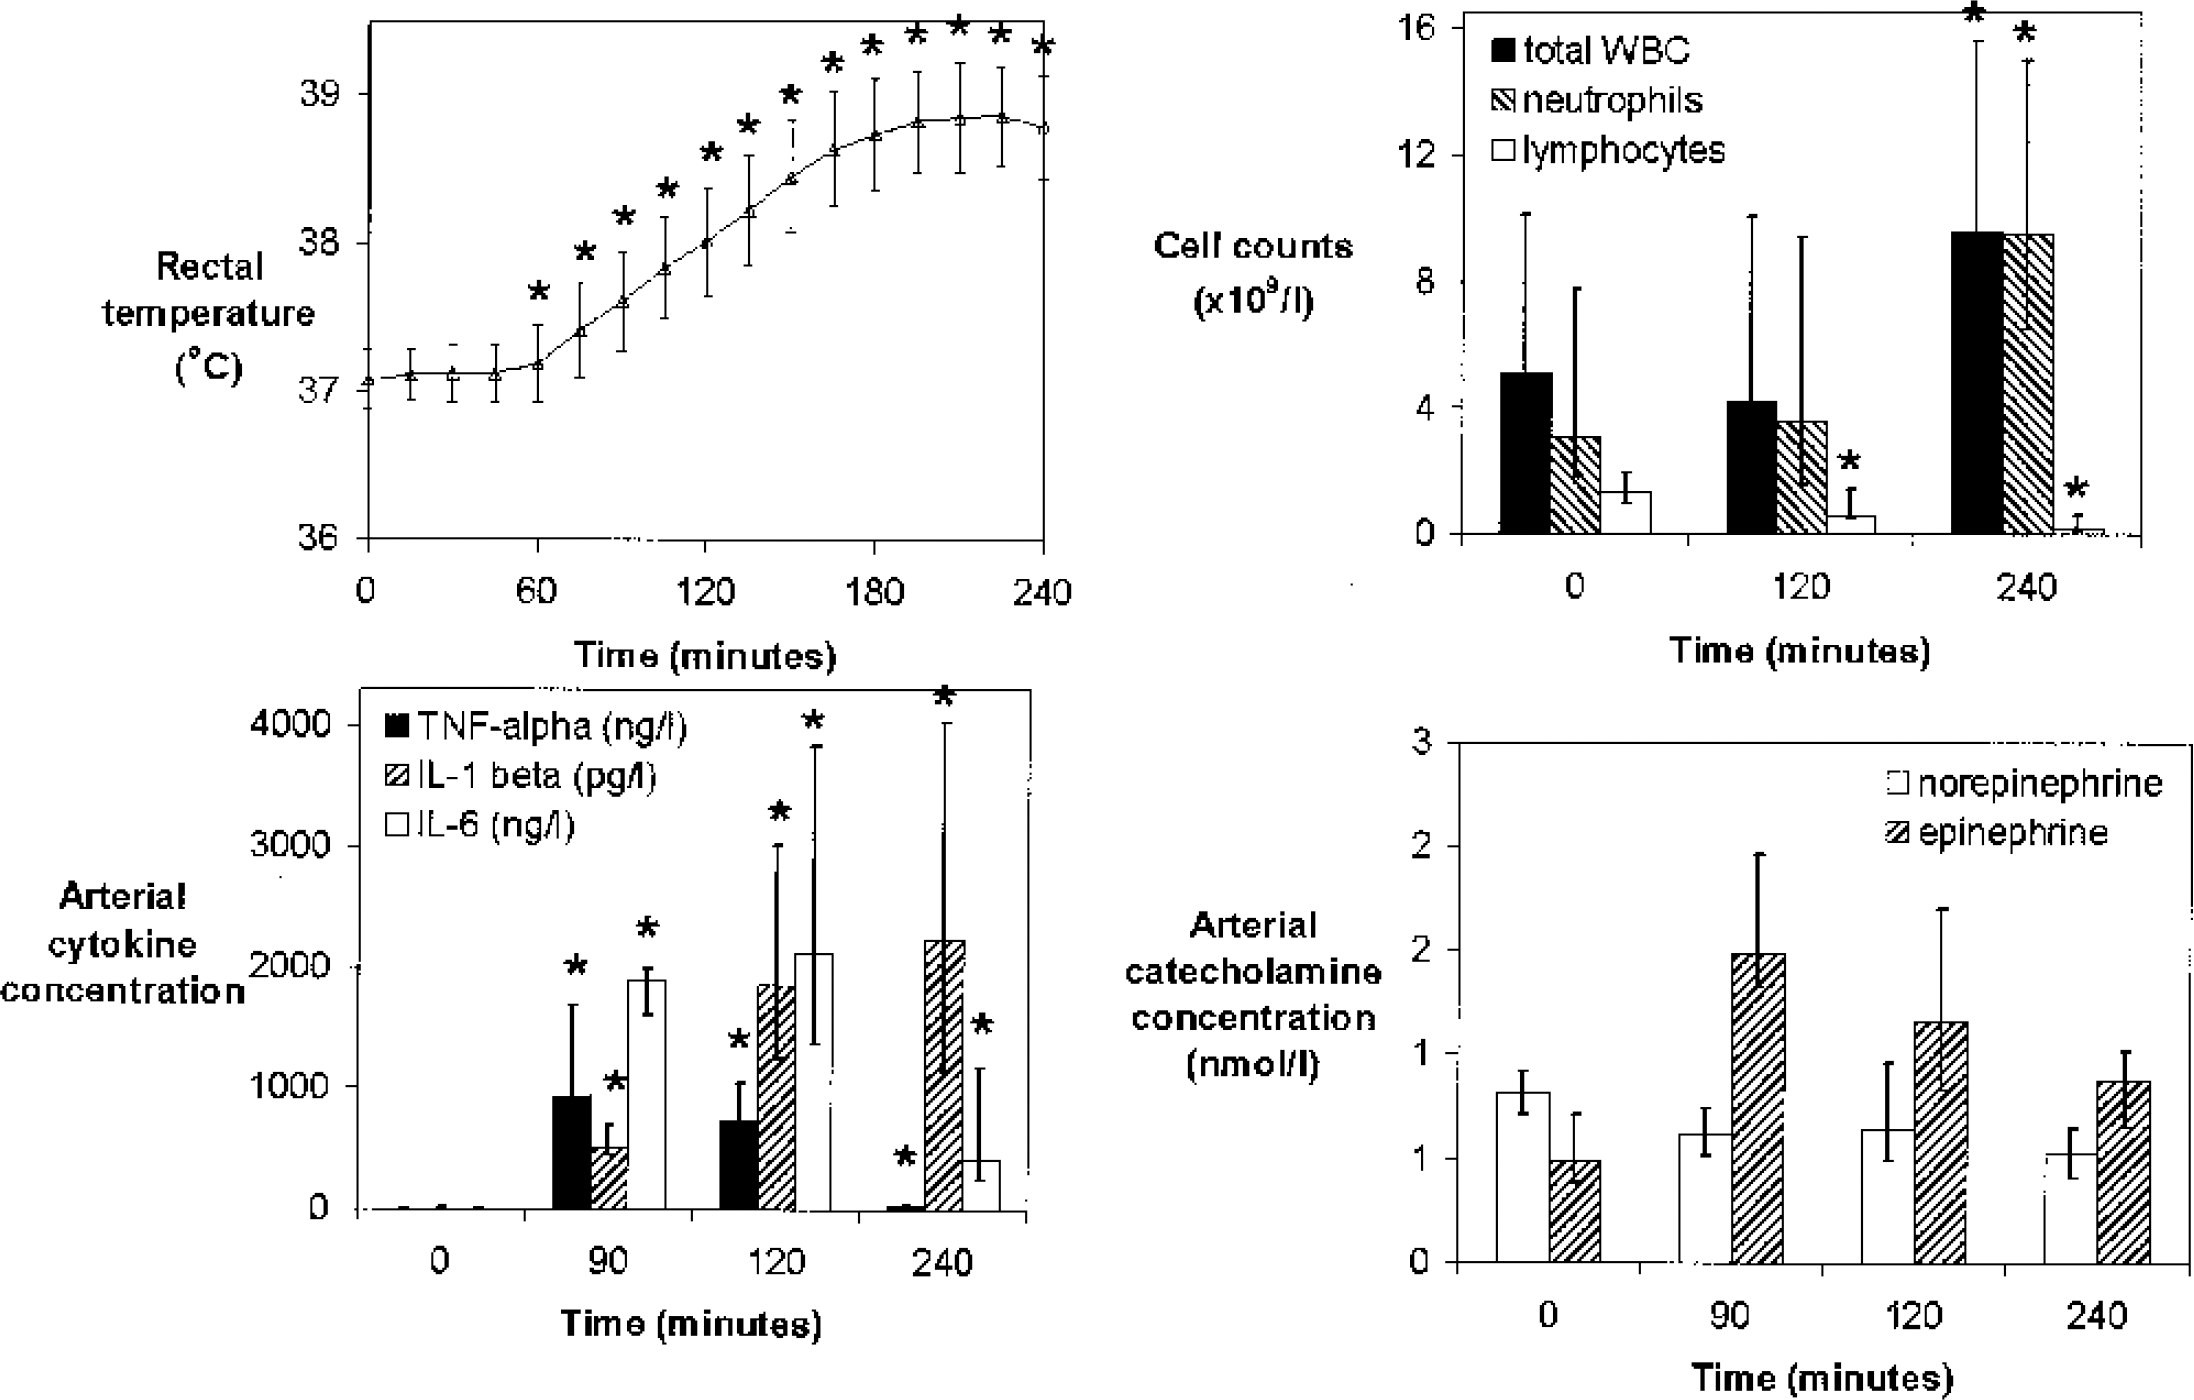
Time course of inflammatory response in 8 healthy volunteers after an intravenous bolus of endotoxin. Values are medians and ranges (rectal temperature, cell counts, and catecholamines) or interquartile ranges (cytokines). TNF-alpha, tumor necrosis factor-α; IL, interleukin; WBC, white blood count.
These clinical observations were associated with significant variations in the arterial concentration of TNF-α (P < 0.001), IL-1β (P < 0.001), IL-6 (P < 0.001), total white blood cell count (P < 0.01), and leukocyte subsets, including neutrophils (P < 0.01) and lymphocytes (P < 0.001) (Fig. 1). Specifically, TNF-α peaked at 90 minutes and IL-6 at 120 minutes; IL-1β peaked at 240 minutes after endotoxin and decreased thereafter (data not shown). In contrast, C-reactive protein (detection limit, 3 ng/L) remained immeasurable during the first 4 hours and only increased thereafter. The arterial plasma concentration of epinephrine and norepinephrine did not change significantly over the first 4 hours; however, only five subjects were included in the repeated-measures test because three subjects had one missing measurement. While the arteriovenous difference of cytokines and of norepinephrine did not change significantly, the a - v difference of epinephrine varied significantly over time (P < 0.05, data not shown); thus, during the first 4 hours after endotoxin injection, the negative a - v difference observed at baseline changed towards an a - v difference not significantly different from zero.
At 90 minutes after endotoxin administration, rectal temperature and heart rate were significantly increased compared to baseline, whereas MAP was borderline increased (Table 1). Pa
Systemic parameters before and 90 minutes after endotoxin injection
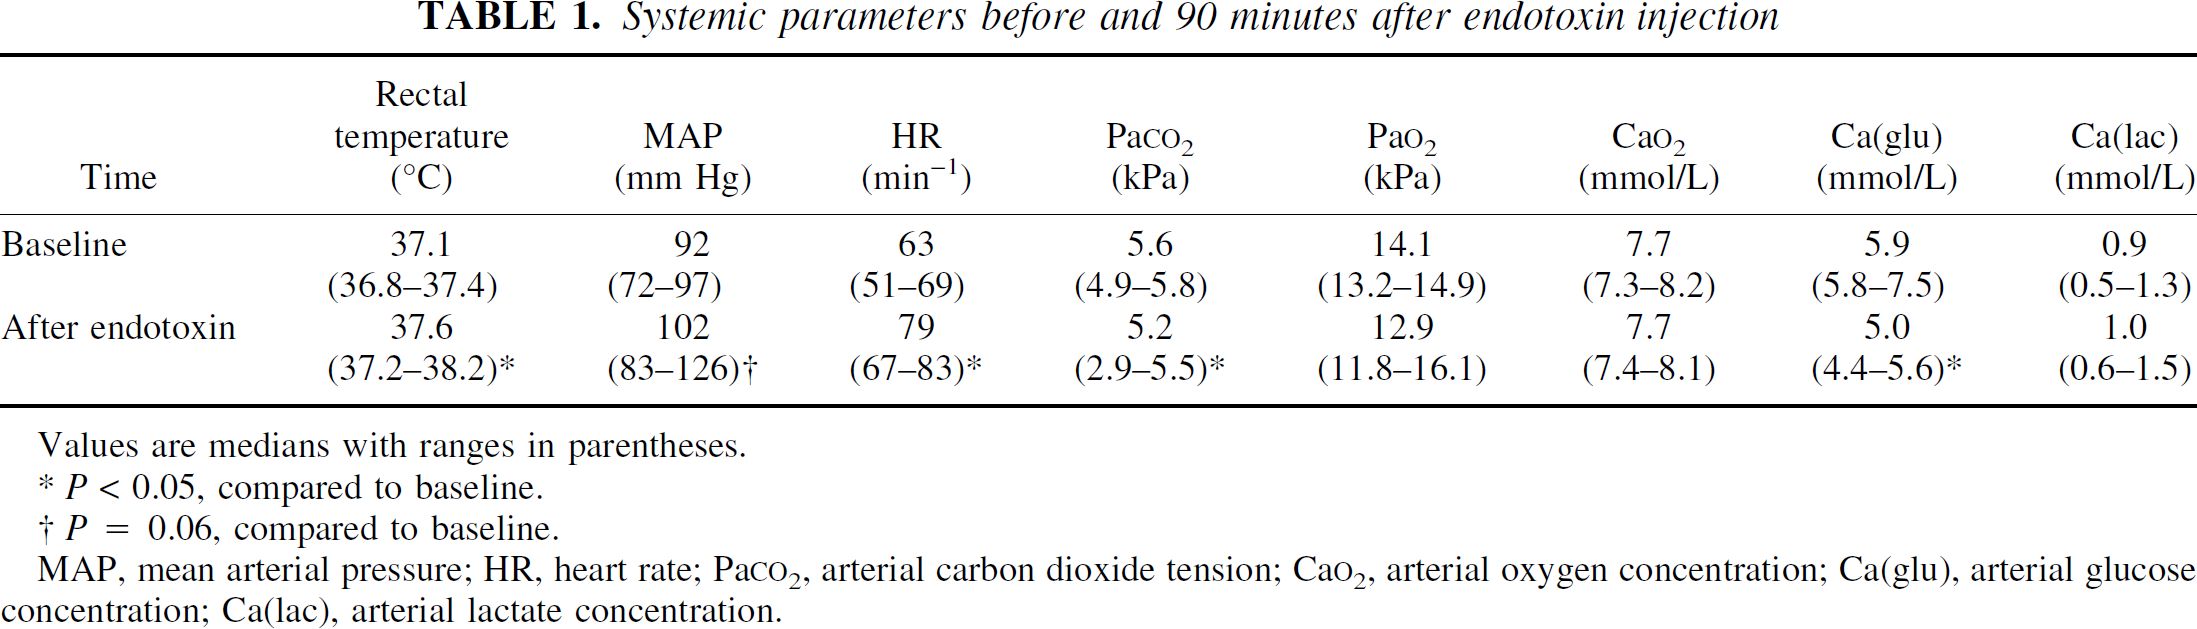
Values are medians with ranges in parentheses.
P < 0.05, compared to baseline.
P = 0.06, compared to baseline.
MAP, mean arterial pressure; HR, heart rate; Pa
Cerebral blood flow after endotoxin was significantly lower than at baseline (Table 3, Fig. 2). However, after correction for the differences in Pa
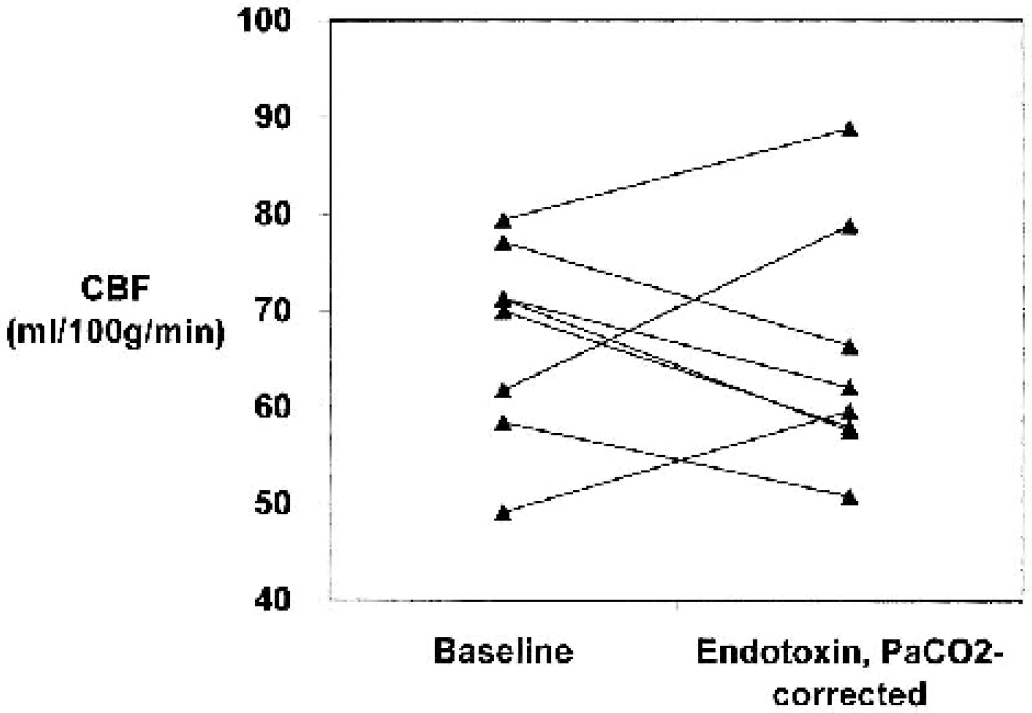
Cerebral blood flow (CBF) after endotoxin injection in healthy volunteers, measured at baseline and 90 minutes after endotoxin. Values after endotoxin are corrected for the change in Pa
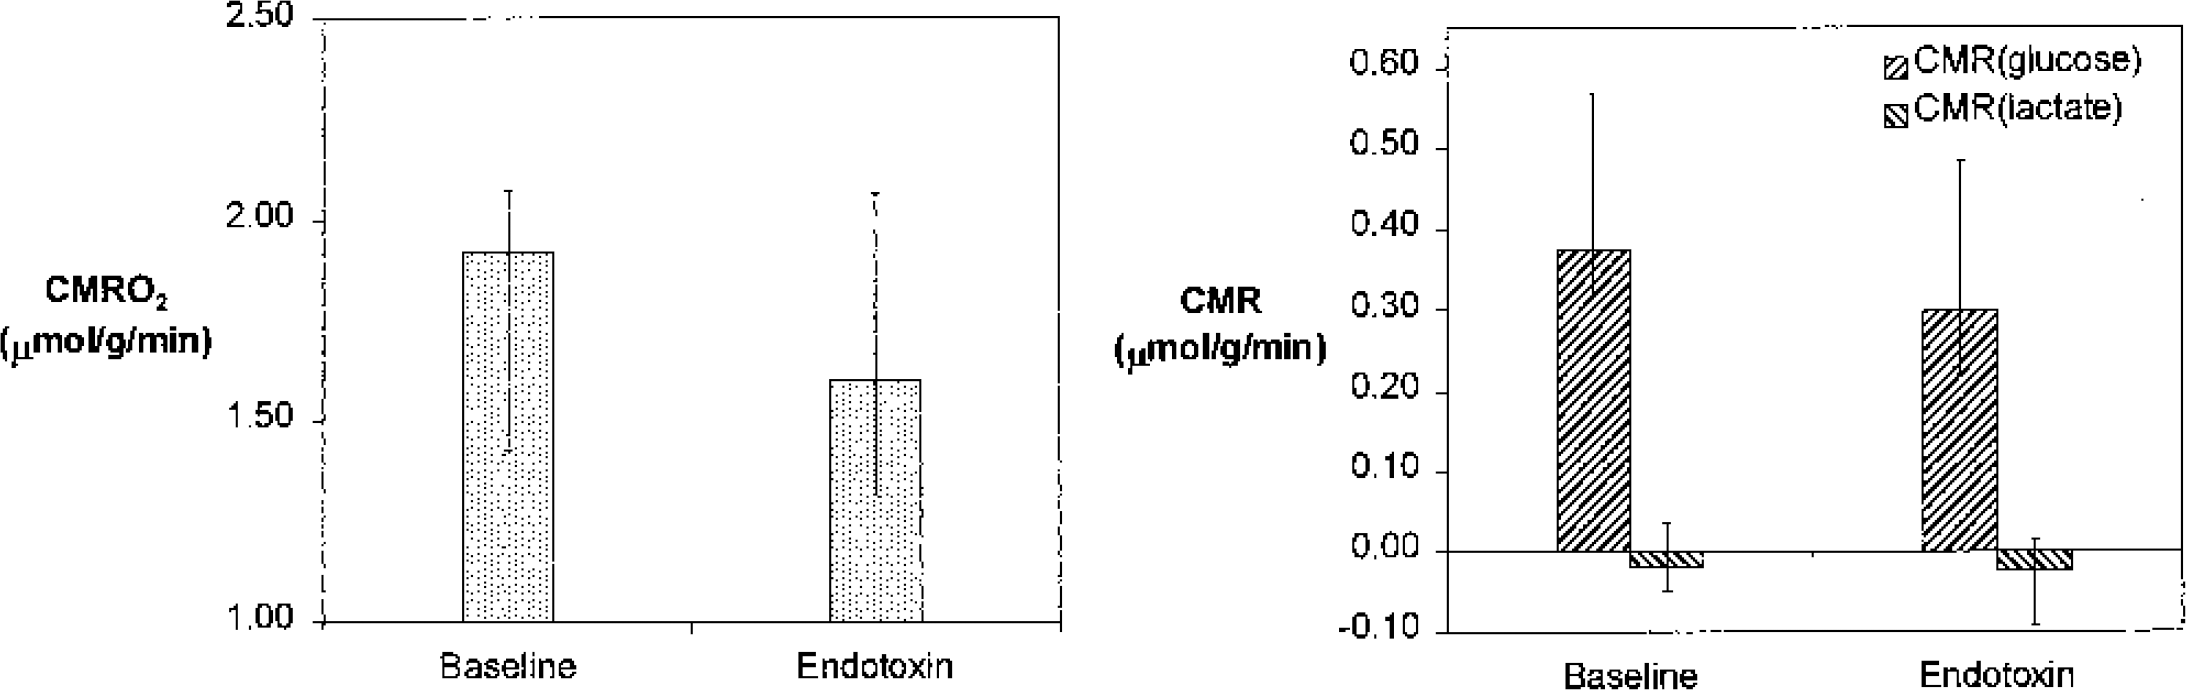
Cerebral metabolic rates (CMR) of oxygen, glucose, and lactate after endotoxin injection in healthy volunteers. Values are medians and ranges. CMR(glucose) was borderline decreased (P = 0.09), whereas CMR
Arterial plasma concentrations of cytokines and catecholamines before and 90 minutes after endotoxin injection
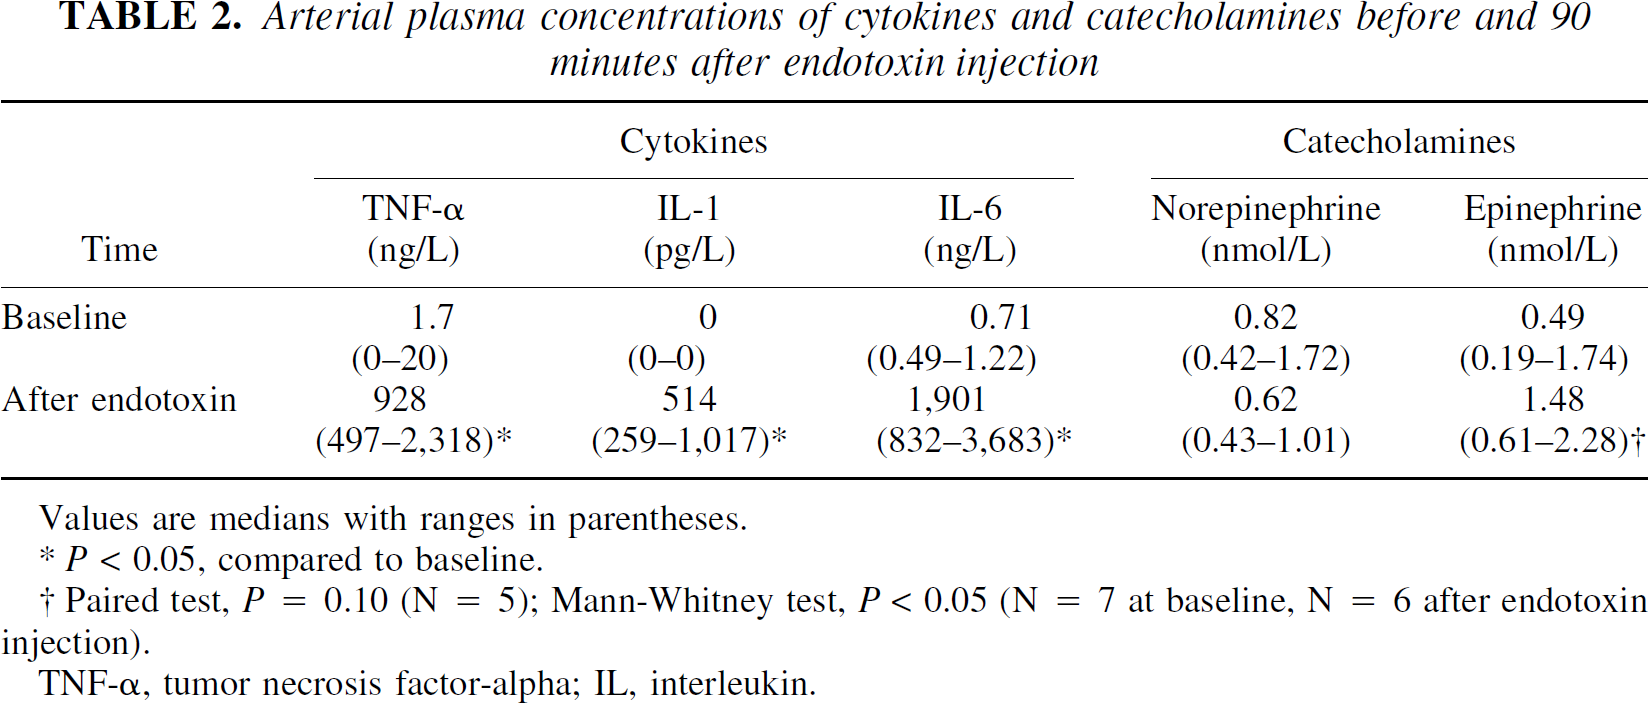
Values are medians with ranges in parentheses.
P < 0.05, compared to baseline.
Paired test, P = 0.10 (N = 5); Mann-Whitney test, P < 0.05 (N = 7 at baseline, N = 6 after endotoxin injection).
TNF-α, tumor necrosis factor-alpha; IL, interleukin.
All subjects remained fully alert and responsive throughout the study.
Cerebral blood flow and cerebral metabolic rates before and 90 minutes after endotoxin injection
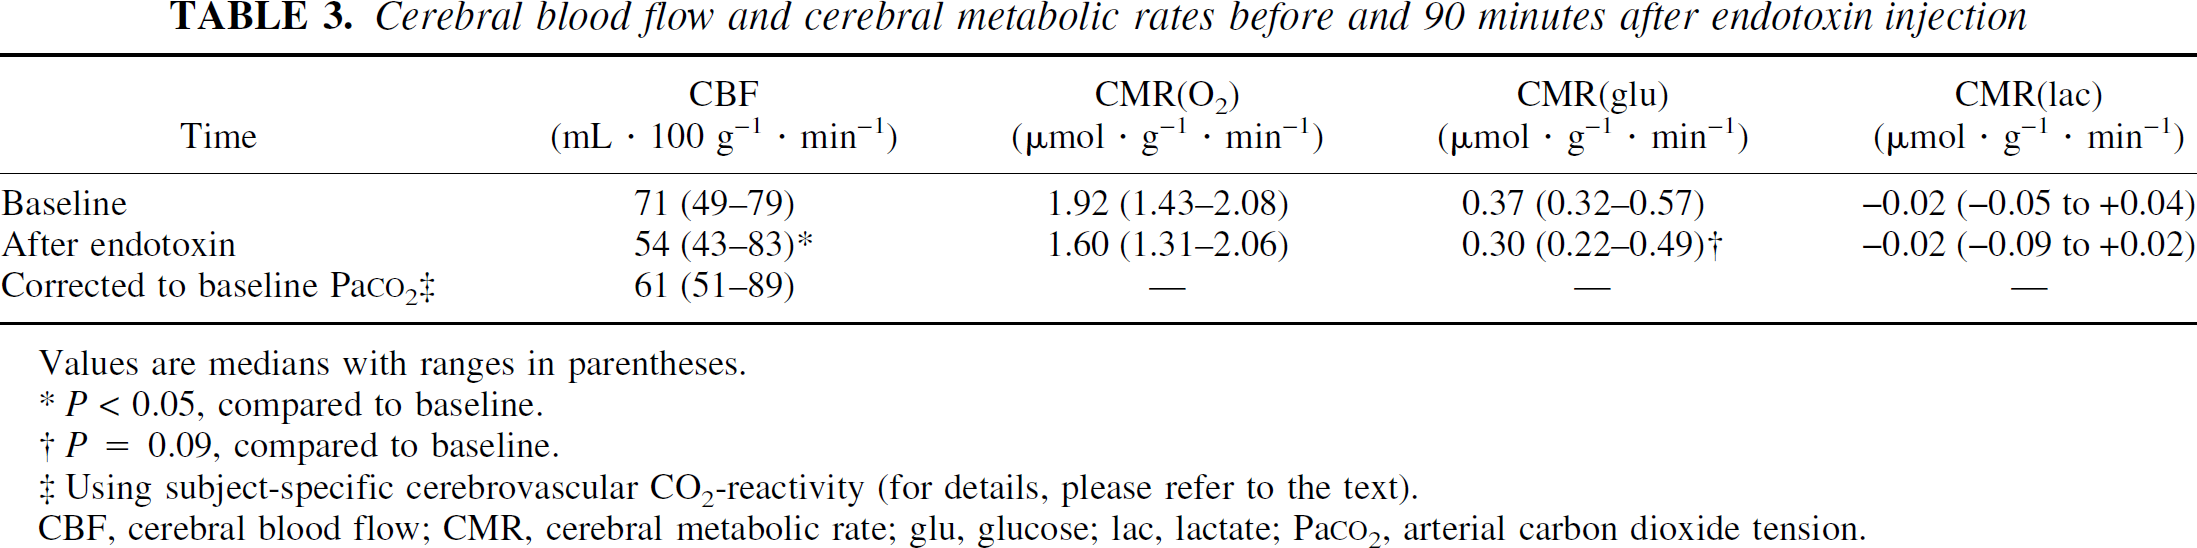
Values are medians with ranges in parentheses.
P < 0.05, compared to baseline.
P = 0.09, compared to baseline.
Using subject-specific cerebrovascular CO2-reactivity (for details, please refer to the text).
CBF, cerebral blood flow; CMR, cerebral metabolic rate; glu, glucose; lac, lactate; Pa
Net cerebral flux of cytokines and catecholamines before and 90 minutes after endotoxin injection
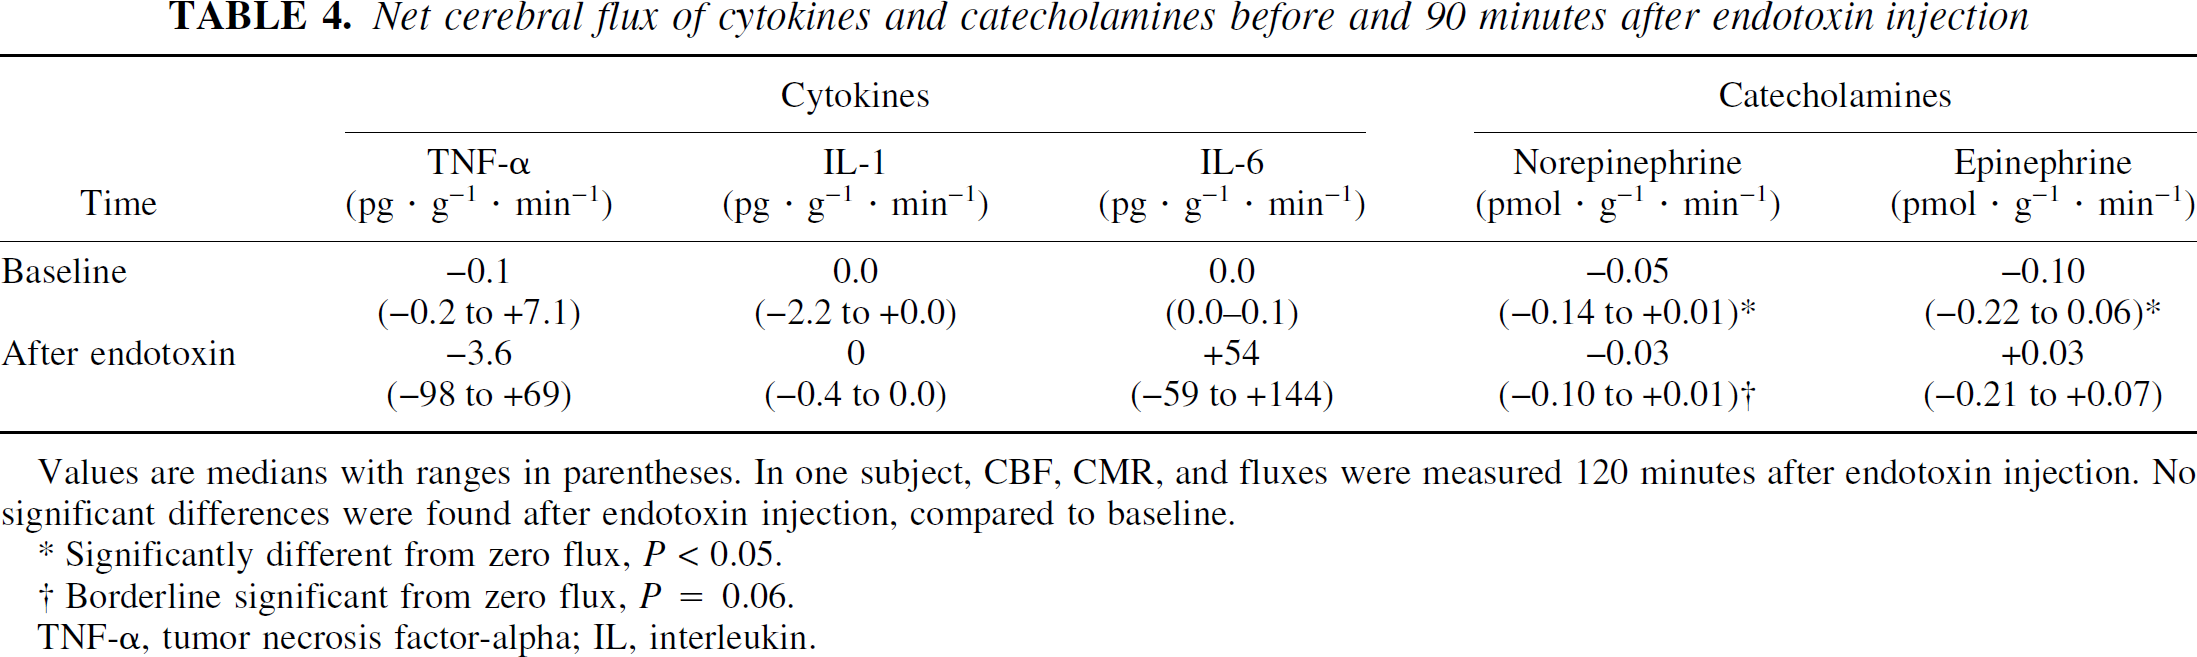
Values are medians with ranges in parentheses. In one subject, CBF, CMR, and fluxes were measured 120 minutes after endotoxin injection. No significant differences were found after endotoxin injection, compared to baseline.
Significantly different from zero flux, P < 0.05.
Borderline significant from zero flux, P = 0.06.
TNF-α tumor necrosis factor-alpha; IL, interleukin.
DISCUSSION
In this human model of early endotoxemia, an intravenous bolus injection of endotoxin to healthy volunteers was associated with a decrease in CBF at the time of maximal intravascular concentration of TNF-α. This CBF reduction was readily explained by acute hypocapnia evoked by general symptoms of malaise. Cerebral oxidative metabolism was unchanged, and no detectable net cerebral flux of TNF-α, IL-1β, and IL-6 into or out of the brain was observed, despite high intravascular concentrations of these cytokines.
The dose of endotoxin used in the present study was 2 ng/kg. This dose produced an inflammatory response resembling an acute bacterial infection, including peak vascular cytokine concentrations similar to those found in patients with severe sepsis (Gårdlund et al., 1995). Thus, the model served as a short-lasting mimicry of sepsis with respect to the cytokine response.
The present study was designed to measure CBF and CMR, but did not aim at measuring cerebral function after endotoxin. It is quite possible that the general malaise experienced by the subjects might have affected cognitive performance, had it been tested thoroughly. However, since all subjects remained alert and responsive during the course of endotoxemia, major cognitive disturbances were unlikely to be present.
The peak in intravascular TNF-α at 90 minutes after endotoxin was associated with subjective symptoms, arterial hypocapnia, and a CBF reduction. The hypocapnia most likely was due to the subjective symptoms. A change in sympathetic drive, even though the change in plasma catecholamine levels was not statistically significant because of lacking data, may also have influenced the pattern of ventilation through stimulation of peripheral receptors. Moreover, we suggest that the CBF reduction was due to the hypocapnia (Kety and Schmidt, 1948b); this implies that the cerebrovascular CO2 reactivity was intact at 90 minutes after endotoxin, compared to baseline. The highly dynamic response to endotoxin did not allow for a reliable determination of CO2 reactivity during endotoxemia, but cerebrovascular CO2 reactivity appears to be preserved (Matta and Stow, 1996; Bowton et al., 1989) in patients with severe sepsis. It is theoretically possible that the CO2 reactivity was reduced in the subjects, and that the CBF decrease was a direct effect of endotoxin and/or cytokines on the central nervous system; however, the results combined with the aforementioned studies are in favor of a hypocapnia-induced CBF reduction.
Considering whether other main regulators of cerebral perfusion caused the CBF reduction after endotoxin, an impairment in CBF autoregulation would not explain the CBF decline after endotoxin, because MAP tended to increase; this would have increased CBF if autoregulation were absent. In addition, the fact that the metabolic rate of oxygen was unchanged does not support the notion that a primary reduction in metabolism caused the reduction in CBF, that is, through metabolic coupling.
Tumor necrosis factor-α is a key mediator of lethal complications in sepsis (Tracey et al., 1987) and has been suggested to be involved in the pathogenesis of cerebral dysfunction in sepsis (Papadopoulos et al., 2000). Nonetheless, inhibition of TNF-α has been shown to confer no or, at best, a modest survival benefit in patients with sepsis (Reinhart and Karzai, 2001). However, previous studies have not addressed whether neurologic recovery after sepsis, with or without septic encephalopathy, is improved after TNF-α inhibition. The present study was designed to test the hypothesis that TNF-α enters the brain from the blood, that is, a net positive flux occurs, during high intravascular concentrations of TNF-α, and that this net positive flux is associated with changes in cerebral metabolism. If this were the case, intravascular inhibition of the cytokine might potentially reduce the prevalence and severity of acute or late neurologic complications in sepsis, and a clinical trial would be justified to test this hypothesis. However, the hypothesis was contradicted by the findings of the study. Thus, the net flux of cytokines, including TNF-α, did not differ from zero, and no significant change in cerebral metabolism was detected.
Although TNF-α induces a disruption of the blood-brain barrier in vitro (de Vries et al., 1996), the observation of zero cytokine flux in the present study is more consistent with the suggestion that the barrier remained intact during the endotoxin challenge. Even so, the passage of TNF-α, IL-1β, or IL-6 from blood to brain, despite the considerable size of these molecules, may not necessitate a leakage in the blood-brain barrier, because receptors have been demonstrated for all these cytokines (Turnbull and Rivier, 1999). It is possible that the high peak concentrations rendered measurements more inaccurate and thereby hindered the detection of a true influx; if this were the case, however, or if TNF-α were produced inside the brain, an effect on cerebral metabolism should be expected, as intracerebroventricular injection of TNF-α decreases cerebral oxygen consumption and CBF (Tureen, 1995).
To our knowledge, high levels of intravascular TNF-α have not been demonstrated to be independently associated with changes in cerebral hemodynamic and/or metabolic changes (e.g., during rheumatic disease), although the literature on this issue is scarce. Thus, we suggest that high circulating levels of TNF-α are not sufficient to trigger such changes, during sepsis as well as in other disease states, but that the presence of other factors is necessary to induce a reduction of CBF and/or metabolism.
Interleukin-1β has also been implicated in septic encephalopathy (Papadopoulos et al., 2000). Although the measurements were not timed to the intravascular peak of IL-1β, the interval of 4 hours after endotoxin injection included this peak; the arterial-to-jugular concentration differences of IL-1β did not change during this interval and were not significantly different from zero, indicating that IL-1β did not enter the brain from the intravascular space or vice versa. The present study, however, was not designed to explore in detail the possible role of IL-1β during endotoxemia.
The origin of the proinflammatory cytokines that are produced after administration of endotoxin is an issue of considerable interest. Although leukocytes in the blood are capable of secreting TNF-α and IL-1 β in response to endotoxin, other cells and tissues may also contribute to the increased circulating levels of primarily TNF-α, such as the hepatic Kupffer cells, the spleen, the kidneys, the heart, and the lungs (Hack et al., 1997). Moreover, most tissues in the body are capable of secreting IL-6 (Akira et al., 1993). The present study adds limited information on this issue, and specifically does not exclude the possibility that endotoxemia induced a limited intracerebral production of cytokines to an extent that was not reflected in a change in global metabolism. However, the results do suggest that the central nervous system is not a source of intravascular TNF-α, IL-1β, or IL-6 during the early phase of human endotoxemia, because no net cerebral efflux of these cytokines was detected.
The methods for the present study included the administration of endotoxin and radiation exposure to healthy young volunteers, as well as the use of invasive catheters. The recruitment of healthy volunteers was considered necessary to examine in more detail the early dynamics of sepsis, especially the possible influence of intravascular cytokines on cerebral metabolism; in contrast, experimental studies as well as studies in patients with sepsis were deemed inadequate to solve this clinical problem, primarily because of cross-species and timing problems. The methods were carefully selected in order to optimize the measurement of global CBF and metabolism, while at the same time conferring maximal safety and minimal radiation exposure to the subjects. First, purified endotoxin, while triggering brief, flu-like symptoms, is generally recognized as safe (Santos and Wilmore, 1996). Second, positron emission tomography would add the potentially interesting features of cerebral imaging and regional measurements of CBF and glucose metabolism, with less need for invasive catheterization. Even so, the simultaneous measurement of cerebral fluxes of, for example, cytokines and catecholamines, necessitates the placement of an arterial and a jugular-bulb catheter. Furthermore, the Kety-Schmidt technique was chosen because of its logistic simplicity. Therefore, the present results pertain to the global cerebral response, rather than the regional responses to endotoxin.
In a previous study in healthy volunteers, Pollard et al. (1997) observed no change in CBF after an intravenous endotoxin dose of 4 ng/kg. In that study, CBF was measured hourly after endotoxin, and the Pa
In two previous studies, patients with sepsis and multiple-organ failure had markedly reduced CBF and cerebral oxygen metabolism. Bowton et al. (1989), using a 133Xe intravenous bolus and subsequent external detection, found a CBF of 29.6 ± 14.8 (mean ± SD) ml·100 g−1 min−1 in nine patients; CMR
Several factors may explain the differing findings in studies of CBF and CMR in septic patients, compared to endotoxemic volunteers. First, in the study of Maekawa et al., CMR
One implication of the present study is the suggestion that during early sepsis, cerebral hemodynamic events differ markedly from systemic events; that is, cardiac output is increased (Wheeler and Bernard, 1999), whereas CBF is unchanged or reduced. This may relate to a different behavior to endotoxin stimulation in the brain vasculature, compared to the systemic circulation. For example, infusion of endotoxin to nonhuman primates stimulates the expression of tissue factor in several extracerebral organs, such as the lungs, the liver, the kidneys, the spleen, and the adrenals; the procoagulant activity of tissue factor may precipitate local fibrin deposition and promote failure of these organs during sepsis (Taylor et al., 1991). In contrast, endotoxin fails to induce vascular expression of this epitope in the brain (Mackman et al., 1993; Erlich et al., 1999). Thus, several events linked to the inflammatory response appear to be markedly dissimilar in the brain, compared to the systemic circulation, during early sepsis.
In conclusion, an intravenous bolus injection of endotoxin in healthy volunteers is associated with a decrease in CBF at the time of maximal intravascular concentration of TNF-α. This CBF reduction is readily explained by acute hypocapnia evoked by general symptoms of malaise. Cerebral oxidative metabolism is unchanged, and no net cerebral flux of TNF-α, IL-1β, and IL-6 into or out of the brain is observed within the first 4 hours after endotoxin, despite high intravascular concentrations. While the present data do not refute the hypothesis that TNF-α is an important mediator of cerebral dysfunction during sepsis, they indicate that the intravascular presence of this cytokine in itself is not sufficient to induce the change in cerebral metabolism and function reported during sepsis and multiple-organ failure. Thus, additional events such as systemic hemodynamic, metabolic, or coagulation disturbances may be required for the development of CNS dysfunction during severe sepsis.
Footnotes
Acknowledgements
The authors thank the Department of Chronic Respiratory Insufficiency, Rigshospitalet, which generously allowed the study to be conducted on their premises. Furthermore, they express their gratitude to laboratory technicians Inge Møller and Gerda Thomsen, Neurobiology Research Unit, Karin Juel, Copenhagen Muscle Research Center, and Hanne Villumsen and Ruth Rovsing, Laboratory of Clinical Inflammation Research, all from Rigshospitalet.