
Abstract
While H215O positron emission tomography (PET) is still the gold standard in the quantitative assessment of cerebral perfusion (rCBF), its technical challenge, limited availability, and radiation exposure are disadvantages of the method. Recent work demonstrated the feasibility of magnetic resonance (MR) for quantitative cerebral perfusion imaging. There remain open questions, however, especially regarding reproducibility. The main purpose of this study was to assess the accuracy and reproducibility of MR-derived flow values to those derived from H215O PET. Positron emission tomography and MR perfusion imaging was performed in 20 healthy male volunteers, who were chronic smokers, on day 1 and day 3 of a 4-day hospitalization. Subjects were randomly assigned to one of two groups, each with 10 subjects. One group was allowed to smoke as usual during the hospitalization, while the other group stopped smoking from day 2. Positron emission tomography and MR images were coregistered and rCBF was determined in two regions of interest, defined over gray matter (gm) and white matter (wm), yielding rCBFPETgm, rCBFMRgm, rCBFPETwm, and rCBFMRwm. Bland-Altman analysis was used to investigate reproducibility by assessing the difference rCBFday3 - rCBFday1 in eight continual-smoker volunteers. The analysis showed a good reproducibility for PET, but not for MR. Mean ± SD of the difference rCBFday3 - rCBFday1 in gray matter was 6.35 ± 21.06 and 0.49 ± 5.27 mL · min−1 · 100 g−1 for MR and PET, respectively; the corresponding values in white matter were 2.60 ± 15.64 and −1.14 ± 4.16 mL · min−1 · 100 g−1. The Bland-Altman analysis was also used to assess MRI and PET agreement comparing rCBF measured on day 1. The analysis demonstrated a reasonably good agreement of MR and PET in white matter (rCBFPETwm - rCBFMRwm; −0.09 ± 7.23 mL · min−1 · 100 g−1), while in gray matter a reasonable agreement was only achieved after removing vascular artifacts in the MR perfusion maps (rCBFPETgm - rCBFMRgm; −11.73 ± 14.52 mL · min−1 · 100 g−1). In line with prior work, these results demonstrate that reproducibility was overall considerably better for PET than for MR. Until reproducibility is improved and vascular artifacts are efficiently removed, MR is not suitable for reliable quantitative perfusion measurements.
The current “gold standard” for the quantitative evaluation of cerebral blood flow (CBF) is H215O positron emission tomography (PET). For clinical purposes, the method has substantial disadvantages, including the need for an arterial catheter to measure the arterial tracer concentration, the application of radioactivity, and the limited availability of PET centers with cyclotron. These problems indicate the need for a rapid, easy-to-use means to assess CBF.
Magnetic resonance (MR) imaging techniques to study cerebral perfusion have been developed and used clinically to detect and assess ischemic stroke prior to treatment. Using tracer kinetic models, perfusion parameters are derived from the signal-intensity changes in the brain following the intravenous injection of a bolus of a gadolinium-based contrast agent. The combination of time-resolved T2- or T2*-weighted images and injection of a paramagnetic contrast agent are used to derive parametric maps of relative cerebral blood flow (relCBF), mean transit time (MTT), and relative cerebral blood volume (relCBV) (Rosen et al., 1990, 1991a,b). In these images of relCBF and relCBV, signal intensity is proportional to flow, but methods to calculate flow in absolute quantitation (mL · min−1 · 100 g−1) are not widely available.
Ostergaard et al. (1996a,b) have recently shown that the best estimation of regional cerebral blood flow (rCBF) using MR methods results from the mathematical deconvolution of the arterial input function (AIF) using singular value decomposition. Wirestam has adapted these ideas and the work by Rempp et al. (1994) to derive a method for producing voxel-by-voxel maps of absolute rCBF (Wirestam et al., 2000a,b).
Perfusion-weighted images may also be acquired without the use of exogenous contrast medium using arterial spin labeling techniques. By applying alternating radio-frequency (rf) inversion pulses to the neck, blood within the carotid artery can be labeled (Edelman et al., 1994) by changing the state of its magnetization. Cerebral blood flow is then mapped by acquiring slices through the head and subtracting images acquired with and without the labeling pulse applied to the blood in the carotid arteries. This technique produces images less affected by large artery artifacts. The induced signal differences, however, are inherently small (∼1%), and substantial signal averaging and relatively long acquisition times are needed.
There is still some question as to whether reproducible quantification of rCBF is possible with MR. In this study, we present results comparing serial measurements of H215O PET and MR perfusion using an intravenous contrast agent in healthy volunteers. Both absolute quantification and reproducibility of MR-rCBF measurements have been assessed.
MATERIALS AND METHODS
Volunteers
Twenty healthy male volunteers (age 44.1 ± 7.6 years, range 35 to 61 years) who were chronic smokers were recruited. The subjects were randomly assigned to group A or B, each with 10 subjects. All subjects were hospitalized for 4 days. In group A, the subjects stopped smoking on days 2 to 4, whereas subjects in group B had free access to cigarettes throughout the study period, but had to move to a special smoking area to smoke.
Reproducibility of H215O PET and MRI measurements of rCBF was assessed by comparing data acquired from group B on day 1 and day 3. Agreement of MR quantification of rCBF with measurement from H215O PET was assessed by comparing data acquired from all subjects on day 1.
The study was approved by the local ethical committee and all subjects gave written informed consent.
Imaging
The PET and MR scanning were performed between 4 and 7 p.m. on days 1 and 3.
Positron emission tomography
The PET studies were performed on a whole body scanner (Advance, GE Medical Systems, Milwaukee, WI, U.S.A.) with a 14.6-cm axial field of view and a 7-mm reconstructed in-plane resolution. Before positioning of the patients in the scanner, catheters were placed in an antecubital vein for tracer injection and the radial artery for blood sampling. Three studies were performed within 45 minutes. Between the perfusion studies, a 10-minute transmission scan was acquired for the correction of photon attenuation. For each perfusion study, 400 to 600 MBq H215O was injected using an automatic injection device, which delivers a predefined amount of activity over 20 seconds. With the arrival of the bolus in the brain, a series of 18 scans of 10 seconds each was initiated in three-dimensional mode. Continuous sampling of arterial blood drawn from the radial artery assessed the time course of the arterial radioactivity.
Transaxial images of the brain were reconstructed using filtered backprojection (128 × 128 matrix, 35 slices, 2.34 × 2.34 × 4.25-mm voxel size). Quantitative parametric maps representing rCBF were calculated using the integration method described by Alpert et al. (1984). This method represents a computationally efficient implementation of the flow calculations based on the time course of the activity concentration in each voxel and arterial blood (input curve). It is based on the solution of the one-tissue compartment model for H2 O. The operational equation is:

where C(t) represents tissue activity, Ca(t) is the measured AIF, and k is rCBF/p (flow/partition coefficient). Essentially, a lookup table r is calculated from the blood data as follows:
where T denotes the acquisition duration, and k is varied in 400 increments between 0 and 200 (mL · min−1 · 100 g−1) to cover the range of k occurring in physiologic conditions. A similar operation is performed with the PET data in each voxel:
From ř the actual k is obtained by a lookup in the r table. The flow is finally calculated by entering k into Eq. 4:
Compared to the true input curve in the brain the measured time course of arterial activity in the radial artery is time-shifted and distorted due to dispersion. Both time shift and dispersion were corrected before calculation of the rCBF by the method described by Meyer (1989). To this end, a flow model including the delay and an exponential dispersion as parameters was fitted to the averaged time-activity curve of all brain pixels with integrated activity above 40% of the maximum. The measured AIF was then shifted by the estimated delay, and deconvolved by the exponentially decaying dispersion using a Fourier transform approach. All computations were performed with the dedicated JAVA-based software PMOD (www.pmod.com) (Mikolajczyk et al., 1998), which allows the easy implementation of the needed models to calculate rCBF, including the corrections of the input curve.
Magnetic resonance imaging
Whole-brain perfusion-weighted MR images were acquired on a standard (1.5 T) MR scanner (Signa Advantage, GE-Medical Systems) in the axial plane with two-dimensional, gradient echo recalled, single-shot EPI (TR/TE/flip = 2000/60/60, field of view = 24 cm, 128 × 64 matrix). Ten to 14 slices 7.0-mm thick were acquired every 2 seconds during a 72-second period. Ten milliliters of gadodiamide (Omniscan, Nycomed-Amersham, Princeton, NJ, U.S.A.) was injected at 2.0 to 4.0 mL/sec followed by a saline flush using a power injector (Spectris, MEDRAD, Indianola, PA, U.S.A.) 13 seconds after scan initiation.
The resulting time series of images (Fig. 1) were postprocessed through deconvolution of an AIF and indicator-dilution techniques (Zierler, 1965). A corresponding set of images with a signal intensity proportional to CBF was produced. Additional images of cerebral blood volume (CBV) and MTT were produced as described by Rosen et al. (1990, 1991b). All MR image-processing software was written in-house and installed on the console of the scanner. The procedure of the MR image postprocessing is described later.
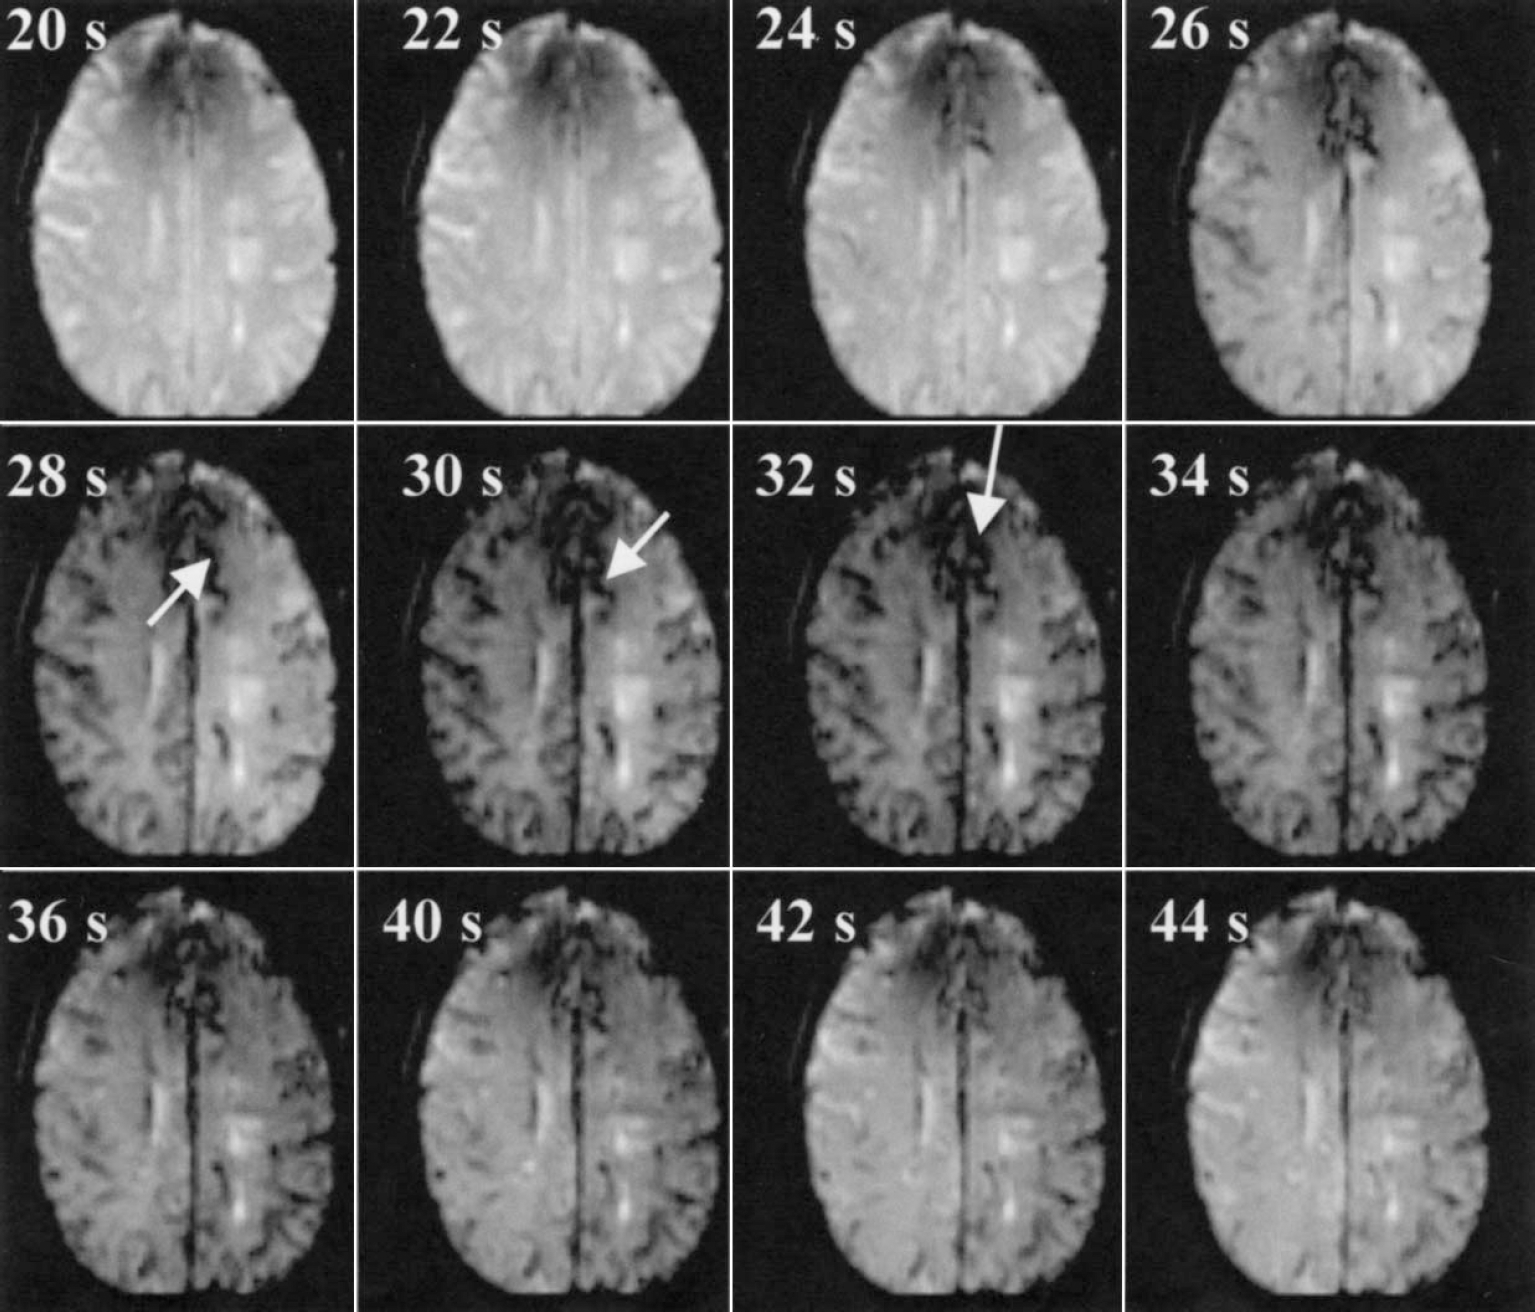
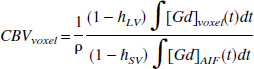
Single slice of a time series of T2*-weighted images showing the signal dephasing that occurs during the passage of a gadolinium-based contrast agent. A total of 36 images sets were acquired at 2-second intervals during the 72-second acquisition period. Each set contained 14 two-dimensional slices, providing near whole-brain coverage (TR/TE/FA = 2,000 msec · 60 msec−1 · 60−1). Shown are slices at 12 time points, out of the 36 volumes acquired. A bolus injection (10 mL at 4 mL/sec) of Gd-DTPA was performed 13 seconds following scan initiation. In the presented examination, the signal loss associated with the passage of the bolus was first observed at 28 seconds. Note the pronounced loss of signal in regions that correspond to large blood vessels (arrows). where [Gd] AIF (t) is the gadolinium concentration per unit time of the voxel chosen to represent the AIF calculated using Eq. 5, and [Gd] voxel (t) is the gadolinium concentration per unit time of the voxel. The constant terms (brain density = 1.04 g/mL, hLV: large vessel hematocrit = 0.45, hSV small vessel hematocrit = 0.25) were proposed by Rempp et al. (1994) to correct for differences in hematocrit and brain density, thereby providing a means of quantifying CBV in milliliters per 100 g. Absolute quantification of CBV was determined and multiplied by a factor of 100 to increase the dynamic range of the displayed images.
Magnetic resonance and arterial input function
An AIF was calculated automatically on completion of the scan. The auto-AIF method interrogates all voxels of the perfusion data set to extract the voxels with a signal-time curve that best represents arterial blood flow. An algorithm has been developed based on adaptive thresholds (Carroll and Rowley, 2001) that rapidly determines an optimal AIF. Optimization with respect to arrival time of the bolus and magnitude of the integrated signal loss associated with its leading edge was performed. The optimization ensures that a voxel representing the highest integrated contrast curve (i.e., the optimal blood volume) is chosen. In this way, partial volume effects where a voxel is only partially occupied by the feeding artery are minimized. An early arrival time requirement is used to eliminate voxels that are occupied by veins. The same analysis determines the arrival time of the first pass and recirculation peak of the bolus of contrast agent. These limits were used to restrict the deconvolution analysis to the first pass of the bolus. All computation was performed immediately upon completion of the perfusion sequence using the host computer of the scanner.
Determination of cerebral blood flow
The CBF was then calculated on a voxel-by-voxel basis from the CBV and MTT, using the central volume principle (CBF = CBV/MTT). In order to calculate hemodynamic parameters, gadolinium concentration (Gd) as a function of time was determined for each voxel, up to a scale factor, based on the following relation (Rosen et al., 1990):
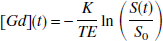
where [Gd](t) is the contrast agent concentration of the voxel at time t, S(t) is the signal intensity of the voxel at time t, S0 is the precontrast signal, TE is echo time, and K is the relaxivity of the contrast agent. The value of K was set to unity, as it appears as a cofactor in both the numerator and denominator in the calculation of CBV and therefore drops out of the calculation. The relative “vascular volume” of each voxel was calculated using the following relation proposed by Rosen et al. (1990):
For the proper calculation of MTT, the contrast agent efflux must be determined through a deconvolution of the following relation (Zierler, 1965):
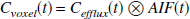
This was performed using singular valued deconvolution (Ostergaard et al., 1996b) algorithm that has been shown to be more accurate over a large range of measured flows than Fourier deconvolution (Ostergaard et al., 1996a; Wirestam et al., 2000a). The ratio of deconvolved area to height yields the MTT of the bolus through the voxel. Then, the MTT may be determined as:
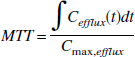
The MTT value is used, along with CBV, to determine CBF. Having determined CBV in milliliters per 100 g and by expressing MTT in minutes, we were able to determine CBF in units of milliliters per 100 g per minute. The calculated flow values were multiplied by a factor of 10 to improve dynamic range and used to produce parametric images of flow that were immediately reinserted to the MR scanners image database, for near real-time display.
Vascular artifact in magnetic resonance perfusion
It is well known that gradient-echo MR perfusion scans result in overestimated flow in highly vascular regions (Rosen et al., 1991a; Wirestam et al., 2000b,c). This is shown in Fig. 2, in which regions of anomaly high flow and blood volume are shown (rCBF >100 mL · min−1 · 100 g−1). Vascular artifacts in the gray matter regions of interest of the MR perfusion maps were removed by applying a threshold based on CBV. A region of interest (ROI) was placed over a representative vessel area on the CBV map and the minimal value in the region was determined. Subsequently, a mask was created which included only voxels with CBV less than the minimal value. White matter voxels were removed from the mask by drawing a region over gray matter. An example of such a gray matter mask is shown in Fig. 2 in the top panel on the right. This mask was then applied to the MR perfusion map and the mean value of rCBF in the mask voxels was calculated.
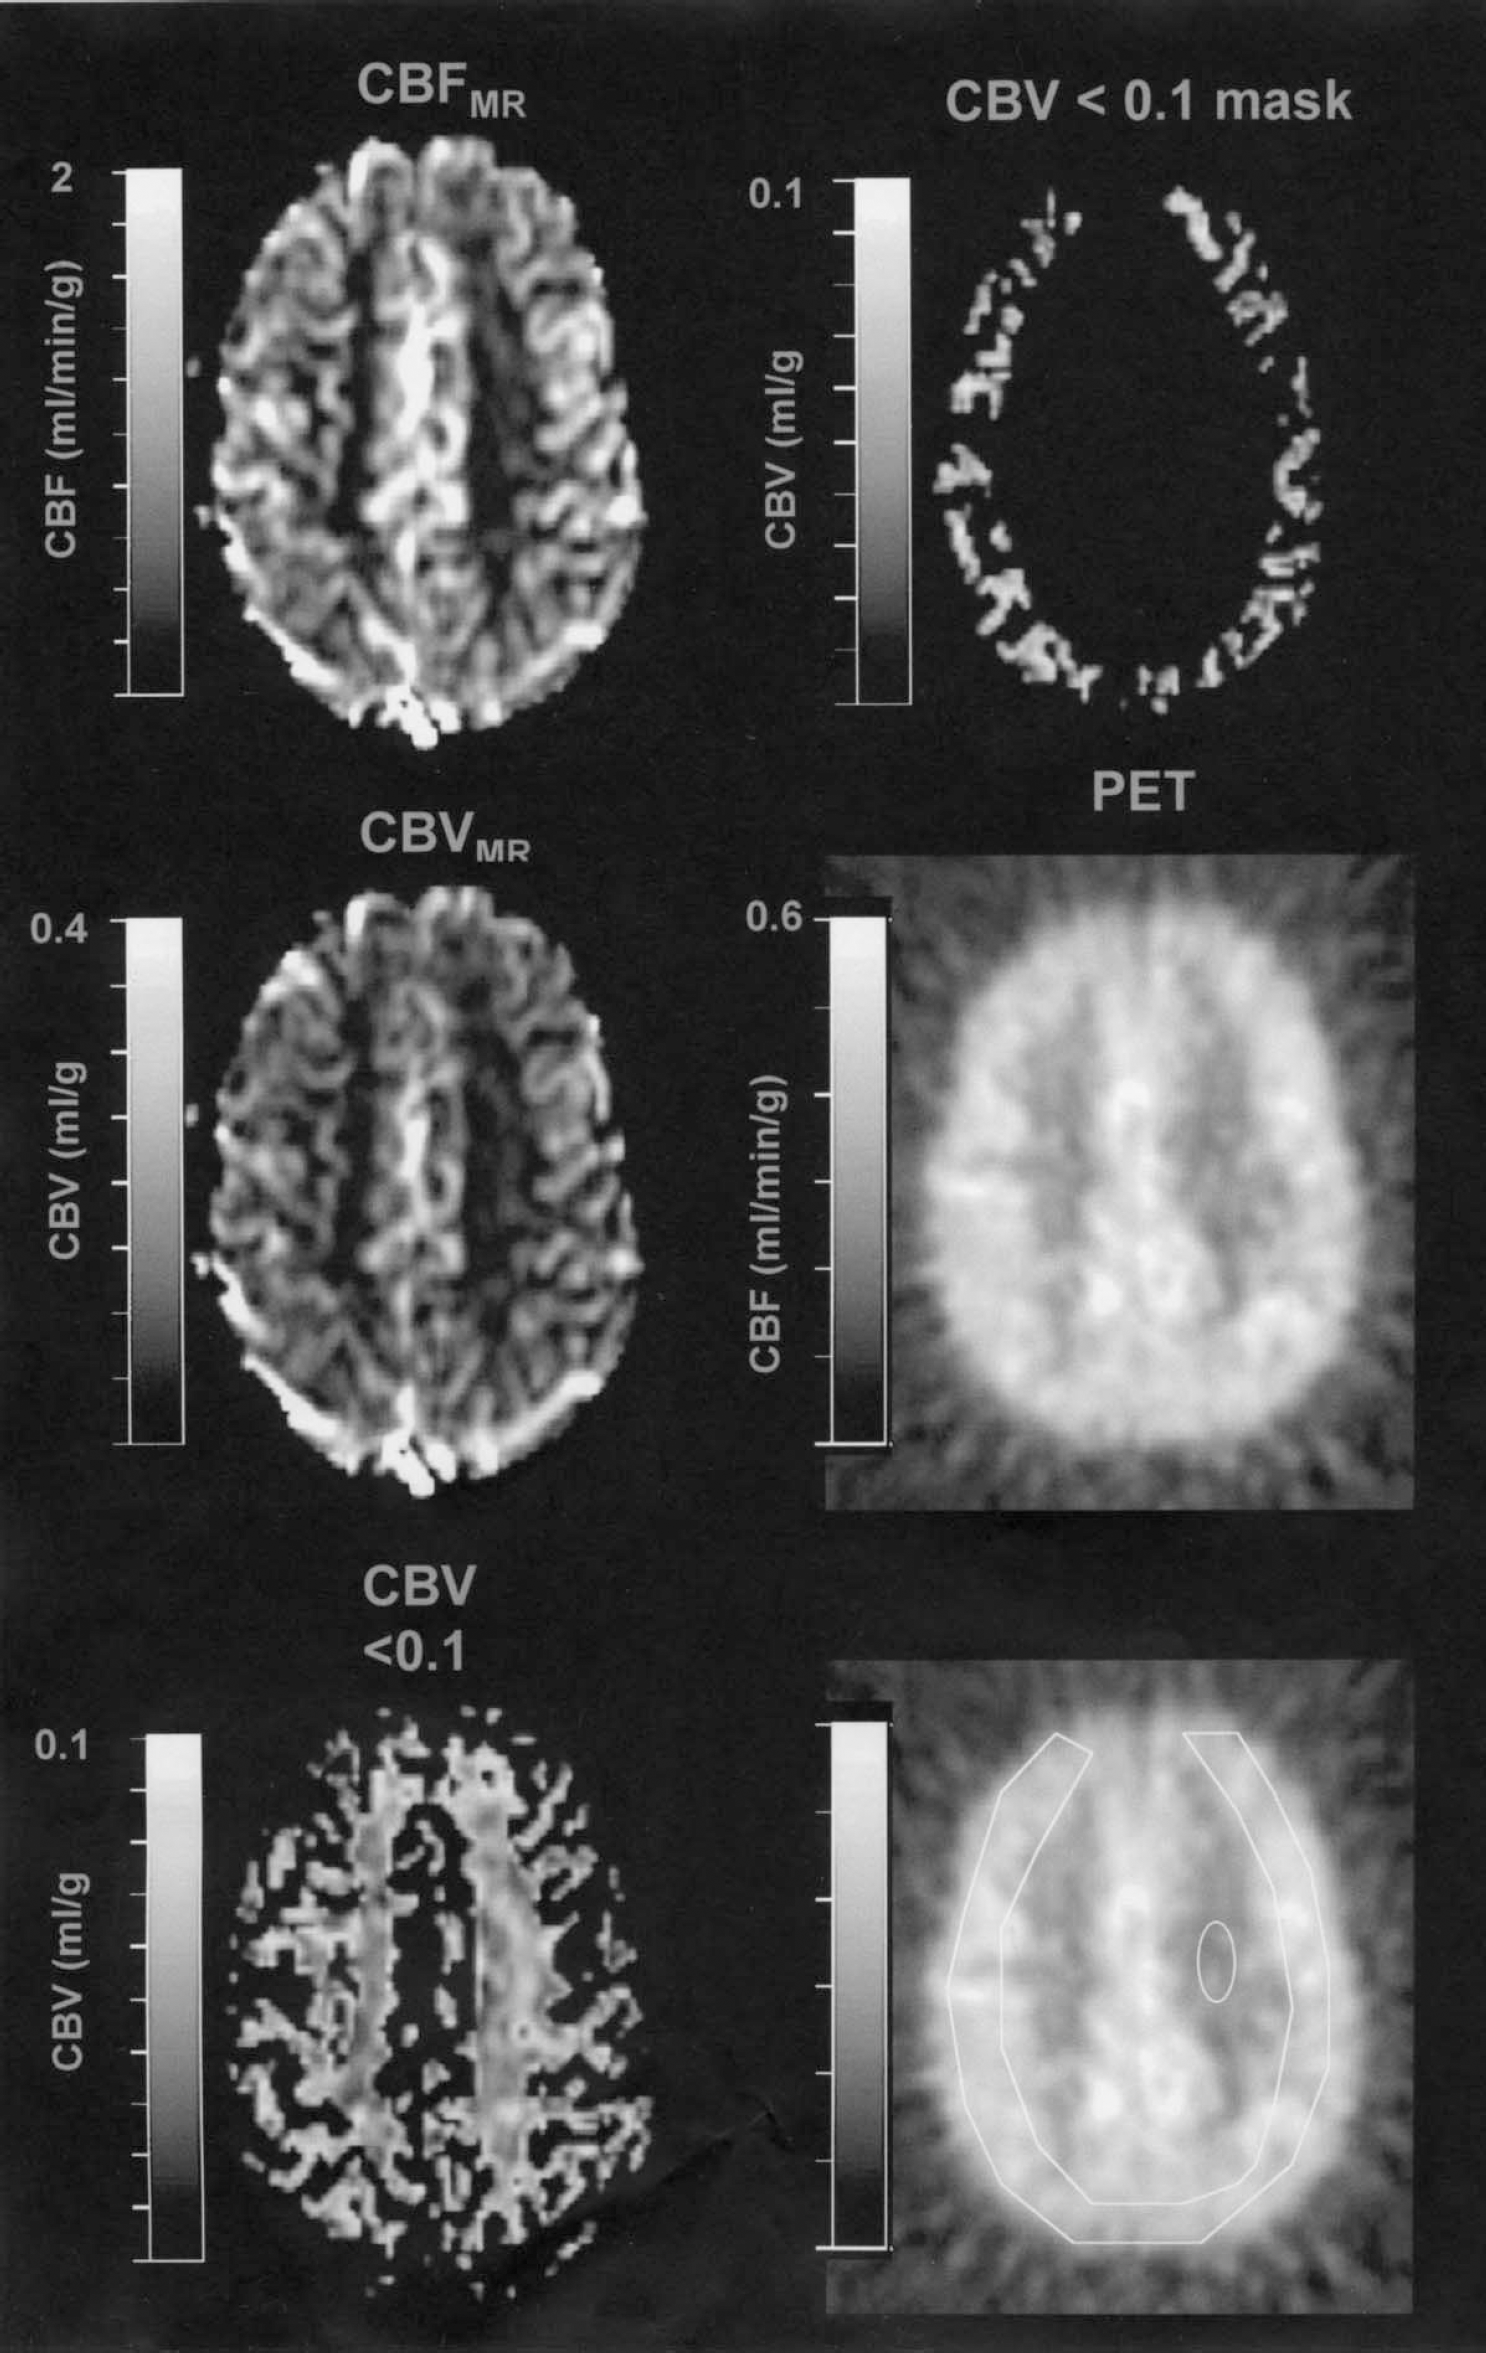
Parametric images of cerebral blood flow (CBF) and cerebral blood volume (CBV). Note that most of the bright structures in the MR CBF and CBV maps (left top and middle panel) correspond to vessels where flow values larger than 200 mL · min−1 · 100 g−1 are measured. These were removed by thresholding the CBV map. In the example on the left, bottom voxels with CBV > 0.1 were removed. This mask still contains gray and white matter voxels. A gray matter mask was then constructed by applying a manually drawn gray matter region of interest, as exemplified in the top right panel. The middle right panel shows the coregistered PET flow map. The bottom right panel shows the regions used in gray and white matter to determine rCBF. MR, magnetic resonance; PET, positron emission tomography.
Positron emission tomography versus magnetic resonance
The MR and PET-CBF maps were converted to ANALYZE format. The three PET scans of each PET session were averaged and the mean image was used for the comparison. The PET-rCBF maps were coregistered with the corresponding MR flow maps using the software PMOD (Mikolajczyk et al., 1998). An ROI was then placed over cortex (ROIgray) and white matter (ROIwhite) as demonstrated in Fig. 2 (bottom panel, right). In PET, the mean value of all ROIgray voxels was used, whereas in MR, voxels in the gray matter region containing vascular artifacts were removed as described previously and then averaged. Bland-Altman methods and plots were applied to investigate both the reproducibility of MR and PET between days 1 and 3, and the agreement between PET and MR on day 1. A measure of repeatability or agreement was calculated as the 95% range for difference, expressed also in percentage value.
RESULTS
A total of 38 of 40 MR scans yielded adequate rCBF maps, which took less than 1 minute to acquire and which were available for review at the MR console within minutes. Two MR examinations were eliminated from further analysis due to technical problems associated with the scanner.
A single slice of a time series of T2*-weighted images is shown in Fig. 1. Spin dephasing resulting from local, transient magnetic susceptibility changes associated with the passage of the bolus of the paramagnetic contrast agent is apparent.
The effect of the AIF on the reproducibility of the MR perfusion is shown in Fig. 3, which compares AIFs from days 1 and 3 in two subjects. The example at the top of Fig. 3 is from a volunteer in whom MR perfusion changed little from day 1 to 3. In the second volunteer, there was a large discrepancy in measured MR perfusion. The observed differences most likely result from differences in the AIFs used in the deconvolution between days 1 and 2. The AIFs from the subject with high reproducibility are nearly identical (Fig. 3, top), whereas in the other subject a large variability is observed (Fig. 3, bottom).
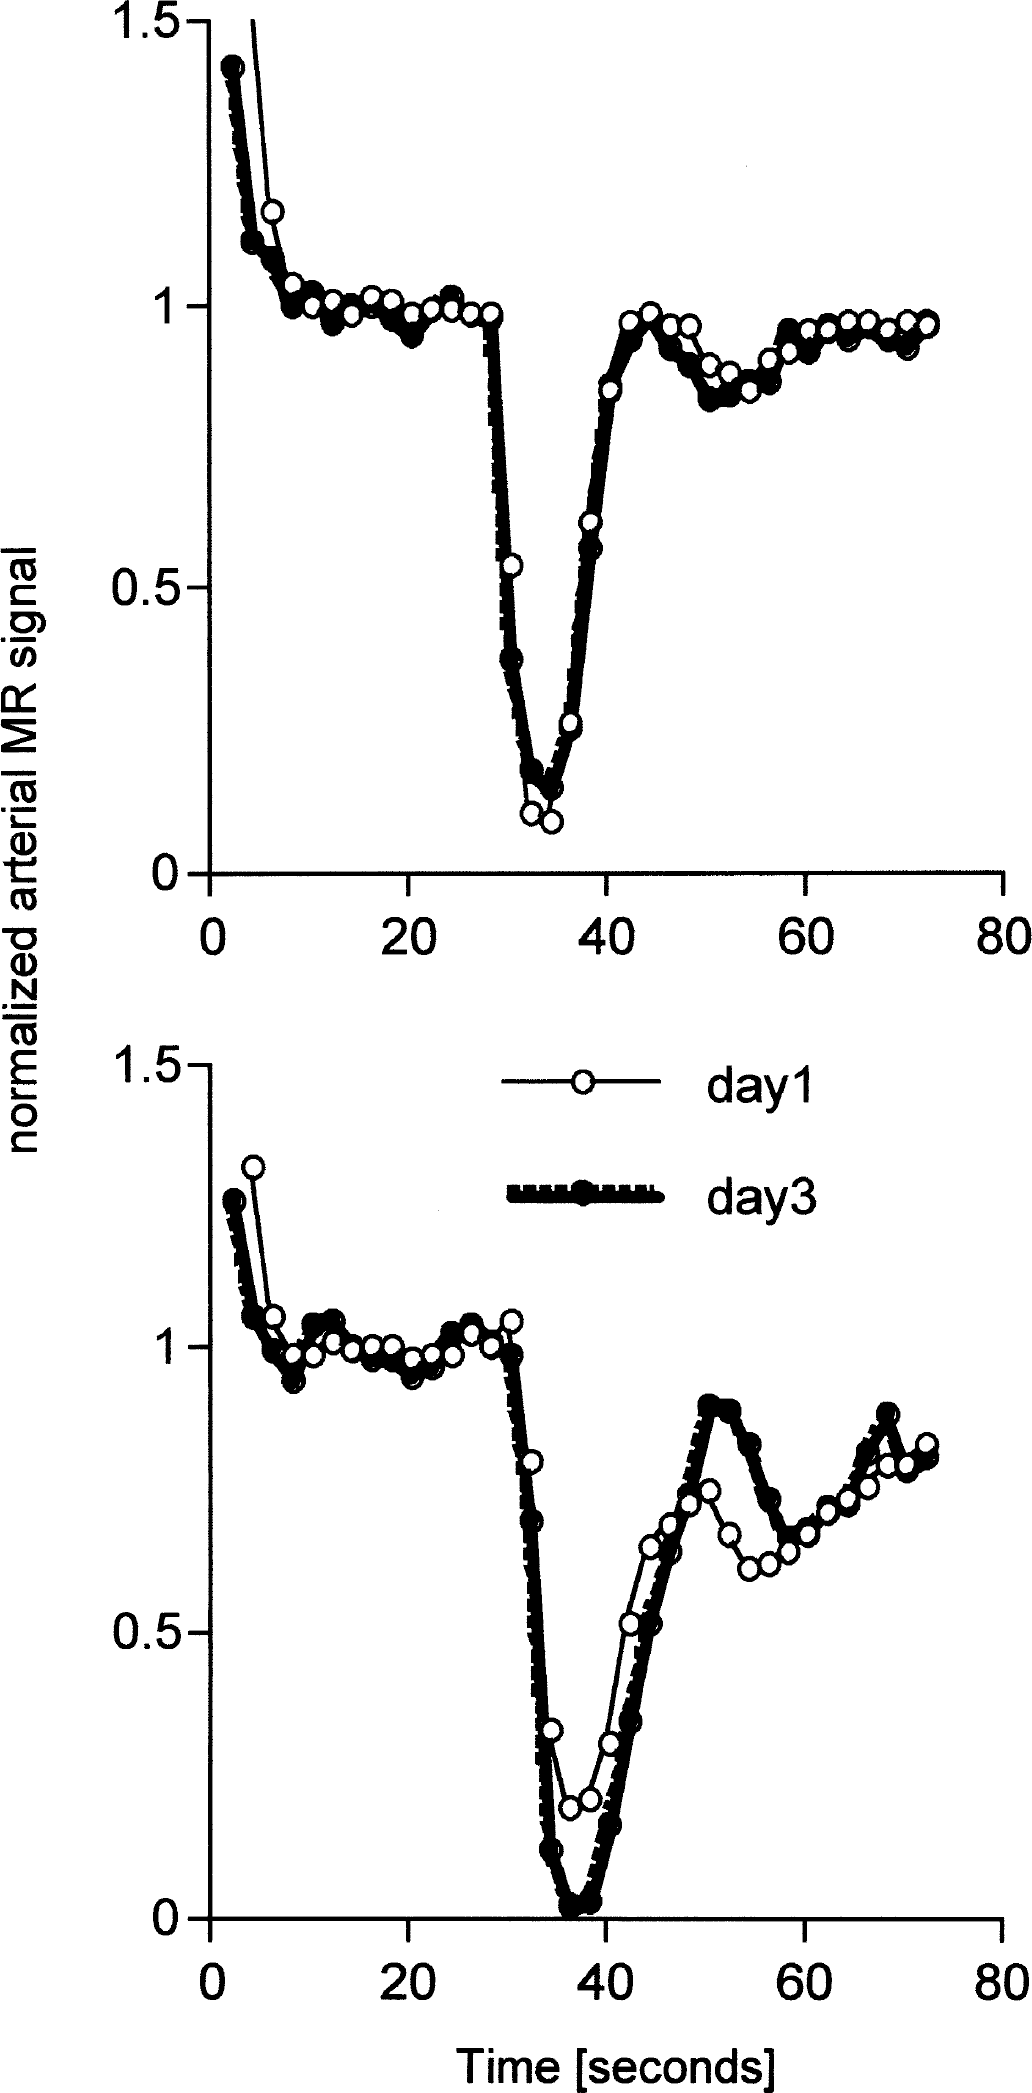
Arterial time course of magnetic resonance signal in two volunteers. The signal was normalized to the mean of 10 data points preceding the dip. Curves from days 1 and 3 are superimposed. The top panel represents data from a volunteer with minimal variation of CBFMR from day 1 to 3 (66.6 and 66.2 mL · min−1 · 100 g−1). The data in the bottom panel is from a volunteer with large variation in CBFMR (58.7 and 33.3 mL · min−1 · 100 g−1).
The reproducibility of PET and MR flow measurements in gray and white matter is shown in the Bland-Altman plots of Fig. 4. In gray matter, PET flow measurements were found to be stable with differences from day 1 to 3 of 0.49 ± 5.27 mL · min−1 · 100 g−1. In contrast, differences for MR flow measurements varied by 6.35 ± 21.06 mL · min−1 · 100 g−1). In white matter, the day 3 versus day 1 difference was 1.14 ± 4.16 and 2.60 ± 15.64 mL · min−1 · 100 g−1 for PET and MRI, respectively.
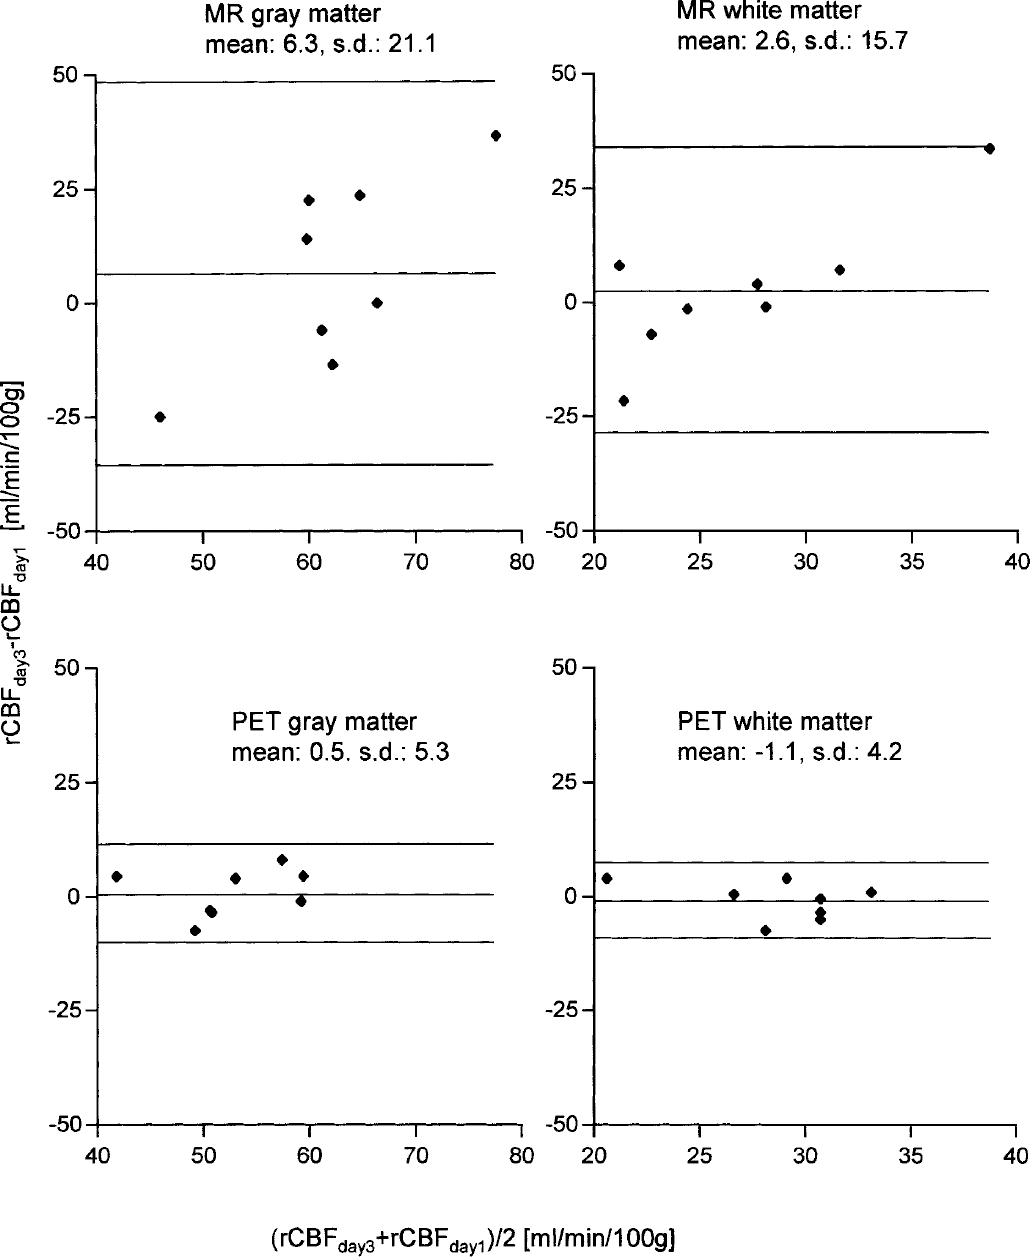
Bland-Altman plot for the reproducibility of positron emission tomography (PET) and magnetic resonance (MR) flow measurements in gray and white matter. The analysis included eight subjects for which serial measurements 2 days apart were available. The important parameter for reproducibility is the standard deviation of the day 3/day 1 difference, which is indicated together with the mean difference in milliliters per minute per 100 g. The middle line represents the mean difference, whereas the top and bottom line represent mean ± 2 SD.
For PET, the 95% range for difference in rCBF in gray and white matter were 12.46 (±24%) and 9.45 (±34%) mL · min−1 · 100 g−1, respectively. For MRI, the 95% range for difference values were 49.79 (±80%) and ±36.98 (±137%) mL · min−1 · 100 g−1 for gray and white matter, respectively.
Bland-Altman comparisons of PET and MR in gray and white matter are shown in Fig. 5. Results indicate that CBFMR values agree with CBFPET to within −0.84 ± 4.76 mL · min−1 · 100 g−1 in white matter and to within −10.58 ± 11.25 mL · min−1 · 100 g−1 in gray matter.
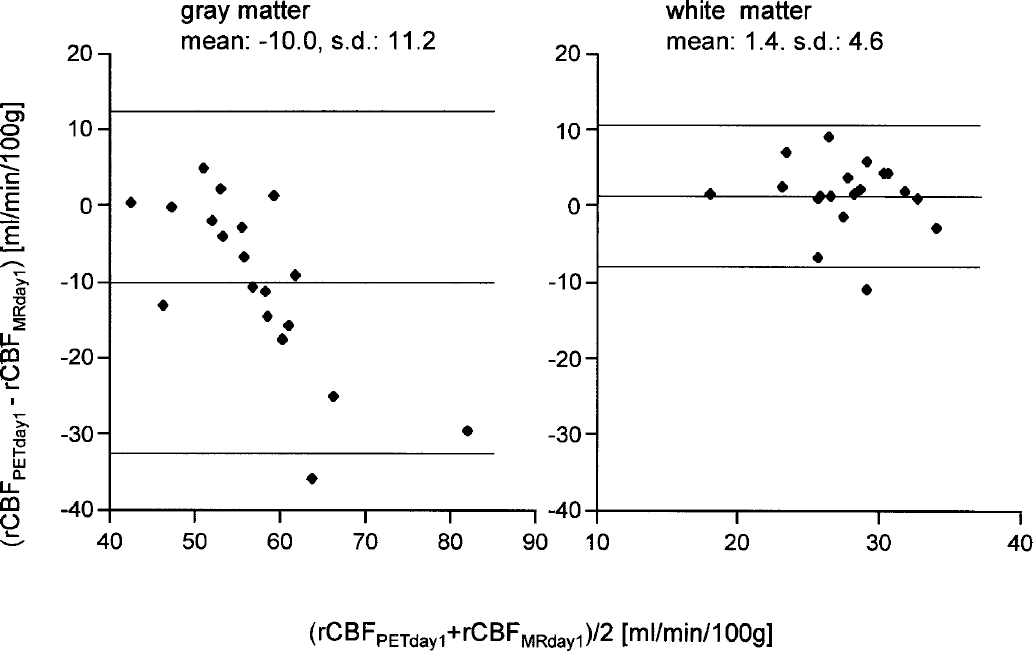
Bland-Altman analysis of positron emission tomography (PET) versus magnetic resonance (MR) flow measurements in gray and white matter. The data were derived from 19 subjects who underwent scanning on day 1 of the hospitalization. The middle line is the mean difference of PET and MR blood flow, whereas the top and bottom line represent mean ± 2 SD.
DISCUSSION
We have developed a fast method of generating parametric maps of CBF using dynamic susceptibility contrast MRI. The method has proven to be very robust in producing qualitative maps of CBV, CBF, and MTT (Carroll and Rowley, 2001). The algorithm has been implemented as a stand-alone computer program and has been installed on standard 1.5-T MR scanners. Image manipulation and calculations are automated and the resulting parametric maps of CBV, CBF, and MTT are available to physicians within minutes. This has proven valuable in the workup of stroke patients where real-time decision is vital to patient management. In this work, the algorithm was modified to yield quantitative maps of CBV and CBF.
The reproducibility of PET in the day 1 versus day 3 difference as shown by the Bland-Altman comparisons (Fig. 4) was good in both gray and white matter. The values are in line with previously published data. Matthew et al. (1993) performed two serial H215O scans in 25 human subjects and reported a reproducibility of whole-brain blood flow measurements of 8.7%. In another study involving seven monkeys, the standard deviation of the difference of two successive measurements was 11% (Iida et al., 2000). In the present study, the standard deviation of the day 3/day 1 difference was 5.3 mL · min−1 · 100 g−1, corresponding to 10%. On the contrary, MR showed very poor reproducibility in both gray and white matter as demonstrated by the high standard deviation of the day 3/day 1 difference. Even after the application of the CBV mask to remove the vascular artifacts, the 95% range for differences of blood flow in gray matter was ± 80% (mL · min−1 · 100 g−1).
The comparison of PET and MR showed that on average, PET and MR measurements of flow agreed reasonably well. The agreement was better in white matter, where differences between PET and MR indicated only a small overestimation (0.84 ± 4.76 mL · min−1 · 100 g−1) of MR relative to PET.
It should be kept in mind that each PET flow measurement was the mean of three individual examinations, and that PET reproducibility would have been worse if only one measurement had been performed. If one assumes a normal distribution, then the standard deviation of one measurement can be expected to be 1.7 times higher (√3), which would still be considerably less than the MR values.
It is not entirely clear whether the MR values are overestimated or whether the PET values are underestimated. It must be mentioned that the chosen method to remove vascular artifacts is unsatisfactory because it would only exclude large vessels and could not eliminate overestimation in voxels that are partial volume averaged with such big vessels.
The perfusion MRI sequence that we used was of lower spatial resolution than that used in some other studies in order to achieve whole-brain coverage. The combination of low spatial resolution of the MR examinations and the use of a nondiffusible tracer and gradient-echo EPI acquisitions resulted in MR perfusion images that suffer from severe partial volume effects. Many MR image voxels were occupied by brain parenchyma and a large blood vessel. The large signal intensity variations in the vicinity of the larger blood vessels resulted in an overestimation of the perfusion in the voxel. The resulting CBF images had the appearance of low spatial resolution angiograms. This was particularly true in gray matter, where CBF values as high as 300 mL · min−1 · 100 g−1 were observed. This finding indicates the need to use algorithms that remove the signal from large vessels while leaving the information from the perfusion bed intact (Carroll et al., 2000).
It has been reported that gradient-echo EPI is sensitive to both large and small vessels, whereas spin-echo EPI is mainly sensitive to the capillaries (Boxerman et al., 1995). It is therefore worth pointing out this is an area of further future investigation.
It is obvious from Fig. 4 that a larger part of the high standard deviation in the day 3/day 1 difference in MR gray matter data is due to the two subjects with the highest and lowest mean. The data of these subjects also appear to add a trend, albeit an accidental one: if only one of these two day 3/day 1 differences had the opposite sign, the trend would disappear. Even without these subjects, the standard deviation of the data would be relatively high (15.4 mL · min−1 · 100 g−1) compared to PET. The poor reproducibility of rCBF measurement by perfusion MR also exists in white matter, albeit to a lesser degree. This finding indicates that the problem is not only related to the vascular artifacts. As we and other authors have described, the quantification of rCBF with MR uses a number of simplified assumptions. For example, the relationship between contrast concentration and signal change in the AIF is known to be nonlinear and the hematocrit assumptions were oversimplified.
In short, there are a number of areas in which the methodology of MR perfusion measurement can be improved. Apart from introducing spin-echo EPI acquisition, it is also possible to improve the reproducibility by averaging the results of multiple serial measurements. For example, a three-injection MR protocol of serial injections of 8 mL MR contrast agent is safe, and the total amount of contrast agent would be less than what is typically administered in angiographic applications.
In a previous study that compared PET and MR in patients with unilateral carotid stenoses (Lin et al., 2001), a large variability in AIFs derived from voxels located in the middle cerebral artery was observed. This variability, which results in variability in MR perfusion measurements, was attributed to partial volume effects, and the authors derived an ad hoc correction factor to address the problem. Although the present results support this conclusion, no such corrections were applied.
Several authors have had success with quantification of rCBF using dynamic contrast MRI using the simultaneous dual FLASH (SD FLASH) pulse sequence (Perman et al., 1992). SD FLASH is used to simultaneously acquire a section at the level of the carotid artery, or other large feeding vessel, along with a section in which perfusion is measured.
Using SD FLASH and Fourier rather than SVD deconvolution, Rempp et al. (1994) reported mean values that agreed well with published data. However, no other determination of flow was available for direct comparison. More recently, Wirestam et al. (2000c) compared SD FLASH-derived CBF gray-to-white matter ratios to SPECT and found good qualitative agreement.
The present work differs from these previous studies in a number of areas. In the cited studies, an AIF was interactively acquired at the level of the carotid artery and determined perfusion in a more proximal region of the brain. The investigators assumed little or no bolus dispersion between the measurement of the AIF in the carotid artery and the perfusion plane. In our approach, the AIF is determined more distally—more within the anatomic region where perfusion is calculated—which minimizes bolus dispersion a potential source of uncertainty in deconvolution analyses.
A current limitation of both MR and PET measurements is the use of a single AIF to determine voxel-by-voxel flow. In cases where compromised flow exists, such as in acute stroke or in the presence of a high grade stenosis, a single AIF may not be sufficient to accurately determine flow in the affected hemisphere. This may ultimately prove to be advantageous for gradient-echo MR perfusion imaging. These acquisitions that include regional information on arterial flow may allow for extraction of more suitable AIF for deconvolution.
CONCLUSIONS
We compared MR perfusion measurements derived from signal changes associated with the passage of a bolus of paramagnetic contrast to H215O PET in a healthy smoker population. Reproducibility was overall considerably better for PET compared to MR. A reasonable agreement of MR perfusion and the corresponding PET results was found in white matter, whereas reasonably reproducible MR perfusion values were obtained in gray matter only after removing vascular artifacts. Until reproducibility is improved and vascular artifacts are efficiently removed, MR as evaluated in this study cannot be used for reliable quantitative perfusion measurements.
Footnotes
Acknowledgements
The authors thank Claudia Gübelin (Pharma Progress, Zürich) and Maria Schlumpf for their assistance in subject management, and Thomas Berthold and his team for acquiring PET data.