
Abstract
Noninvasive imaging of cerebral blood flow provides critical information to understand normal brain physiology as well as to identify and manage patients with neurological disorders. To date, the reference standard for cerebral blood flow measurements is considered to be positron emission tomography using injection of the [15O]-water radiotracer. Although [15O]-water has been used to study brain perfusion under normal and pathological conditions, it is not widely used in clinical settings due to the need for an on-site cyclotron, the invasive nature of arterial blood sampling, and experimental complexity. As an alternative, arterial spin labeling is a promising magnetic resonance imaging technique that magnetically labels arterial blood as it flows into the brain to map cerebral blood flow. As arterial spin labeling becomes more widely adopted in research and clinical settings, efforts have sought to standardize the method and validate its cerebral blood flow values against positron emission tomography-based cerebral blood flow measurements. The purpose of this work is to critically review studies that performed both [15O]-water positron emission tomography and arterial spin labeling to measure brain perfusion, with the aim of better understanding the accuracy and reproducibility of arterial spin labeling relative to the positron emission tomography reference standard.
Keywords
Introduction
The ability to noninvasively image cerebral blood flow (CBF) would enable improved identification and management of patients with many neurological disorders, including cerebrovascular and neurodegenerative diseases. Although various modalities exist to image perfusion, 1 clinicians still lack a robust, efficient method to quantify CBF in patients.
Currently, positron emission tomography (PET) with [15O]-water is considered the reference standard for CBF measurements.2,3 In a typical experiment, [15O]-water is injected into the patient and modeled as a freely diffusible tracer that enters into cerebral tissue but is not metabolized. 4 Equilibrium is achieved within a few minutes, such that the integrated PET signal reflects the perfusion status of the brain. [15O]-water PET imaging usually requires a cyclotron at the imaging site due to the short half-life (∼2 min) of oxygen-15. Patients must also undergo arterial cannulation to determine an arterial input function (AIF). These complexities significantly hinder the measurement of CBF in clinical settings.
Comparison of [15O]-water PET and ASL MRI methods to image brain perfusion.
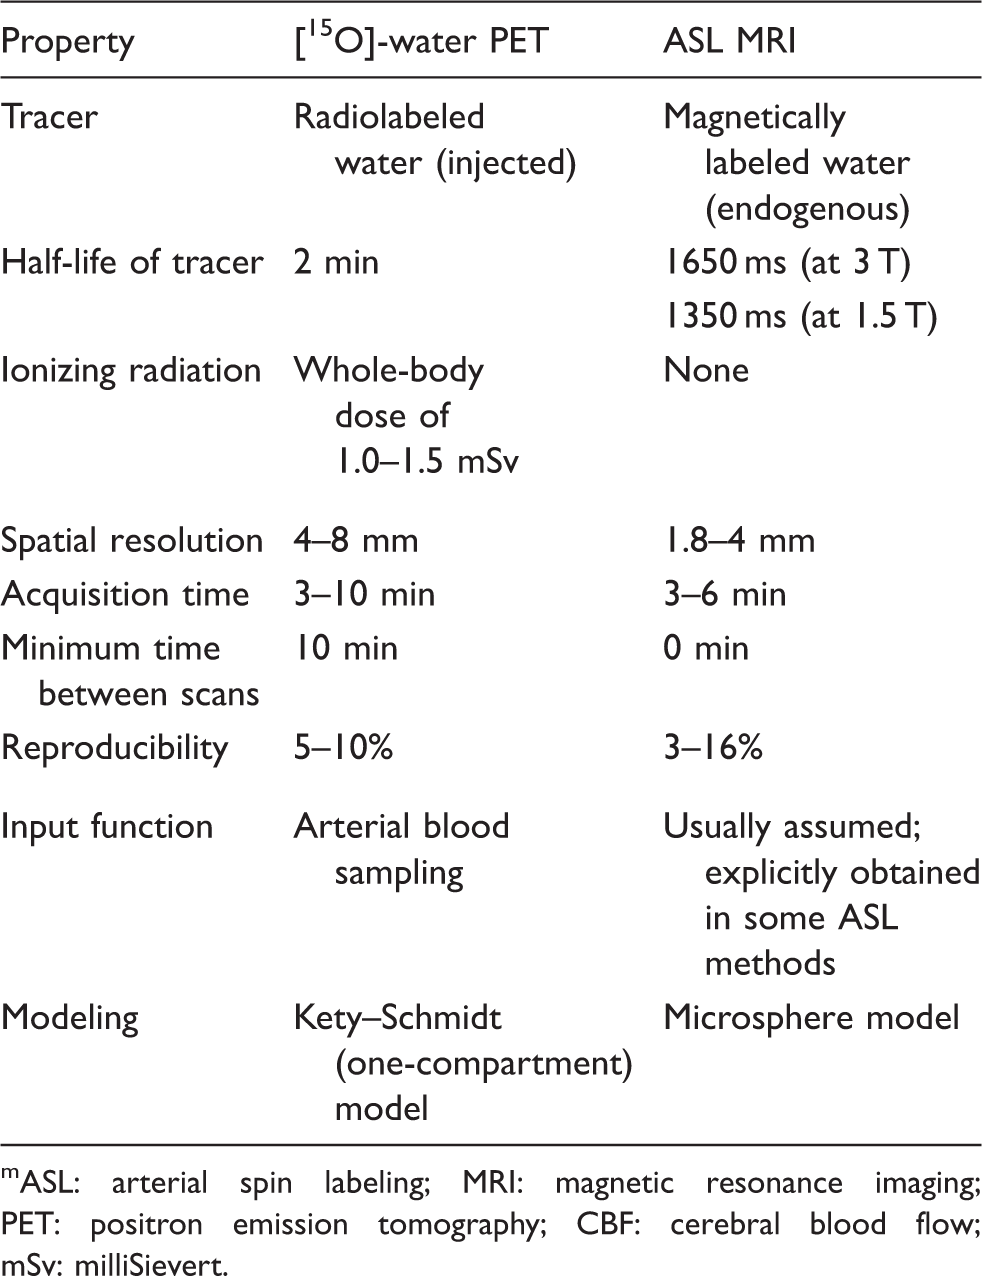
ASL: arterial spin labeling; MRI: magnetic resonance imaging; PET: positron emission tomography; CBF: cerebral blood flow; mSv: milliSievert.
Despite recent efforts to standardize ASL, the method currently lacks validation, especially in patients with abnormal vasculature. Although a number of studies have compared perfusion imaged by PET and MRI in the past 15 years, CBF scans from each modality were usually acquired in separate sessions, making it difficult to control for normal CBF variations with diet, hydration status, and diurnal cycles. Differences in findings may also reflect variability in the study design, including ASL acquisition parameters; availability of an AIF for the [15O]-water tracer; time elapsed between MRI and PET scans; and the study population. This review summarizes studies that have performed both PET and ASL CBF measurements and identifies technical requirements for future comparative studies that would more completely validate ASL for perfusion imaging.
Methodology for perfusion imaging in comparison studies
[15O]-water PET protocol
The [15O]-water PET method to quantify CBF requires the investigator to choose the radiotracer dose, how long to collect PET counts, how to temporally partition the PET counts, and how to determine the AIF. Each study performed a bolus injection of [15O]-water for 5–20 s. The total administered radioactivity primarily ranged between 15 mCi and 21.6 mCi,11–13 although one study relied on a larger dose of 40–46 mCi. 14 Immediately after tracer administration, PET counts were collected over a time window of 3 min 11 up to 10 min.12,13,15 PET images were typically reconstructed with in-plane spatial resolution of 3 to 5 mm after filtering. A relative CBF image was available from these PET images through integration of PET counts from the first 1–2 min after arrival of the tracer bolus.16,17
AIF
For quantitative studies, the AIF was measured by continuous, online sampling of arterial blood. These automated samplers typically draw arterial blood from a radial artery in the arm at a rate of 4–8.3 ml/min and measure the blood radioactivity through portable coincidence detectors (e.g. sodium iodide crystals) at high temporal resolution. A few groups additionally cross-calibrated the automated values against radioactivity in blood samples drawn manually at three time points (e.g. 5.5, 8, and 10 min) from the arm.12,13
Because blood-based AIFs are usually estimated at the arm, the delay and dispersion of the tracer as it travels to the brain must be considered to accurately represent the [15O]-water input function. Time shifts between the blood samples and the PET scanner must also be corrected; some studies estimated this delay by aligning the scanner count rates to the blood data, 15 whereas others assumed a fixed time shift (e.g. 15 s) for each patient. 18 The timing correction procedure for AIF estimation varied frequently across comparison studies. Previous simulation work has found that inaccuracies in the AIF timing can create 4–10% CBF overestimation for 2-s timing error, and up to 24% CBF overestimation for a 5-s timing error. 2
Kinetic modeling and CBF map estimation
The Kety–Schmidt one-compartment model was adopted to quantify absolute CBF from [15O]-water uptake in brain tissue on the PET images and the AIF from blood samples. Three main implementations of this kinetic modeling were used across studies, including: (a) least-squares non-linear regression at each pixel;14,19,20 (b) the autoradiographic method, which creates a dictionary matching a ratio of time integrals (of the PET counts and AIF) to the underlying CBF;11,15 or (c) a basis function approach.12,13,21 The basis function approach assumes a physiologically plausible range of CBF and blood–brain partition coefficient parameters. A set of possible basis functions, i.e. the AIF convolved with an exponential term, are then created based on these parameters to linearize the one-compartment model for CBF estimation. 22 In previous Monte Carlo simulations and human studies, non-linear regression and basis function approaches were consistent and gave accurate CBF estimates within 5% of the true simulated value for CBF settings of 100 ml/100 g/min or lower. 22
ASL MRI protocol
Acquisition and calibration parameters for ASL MRI in comparison studies of healthy volunteers.
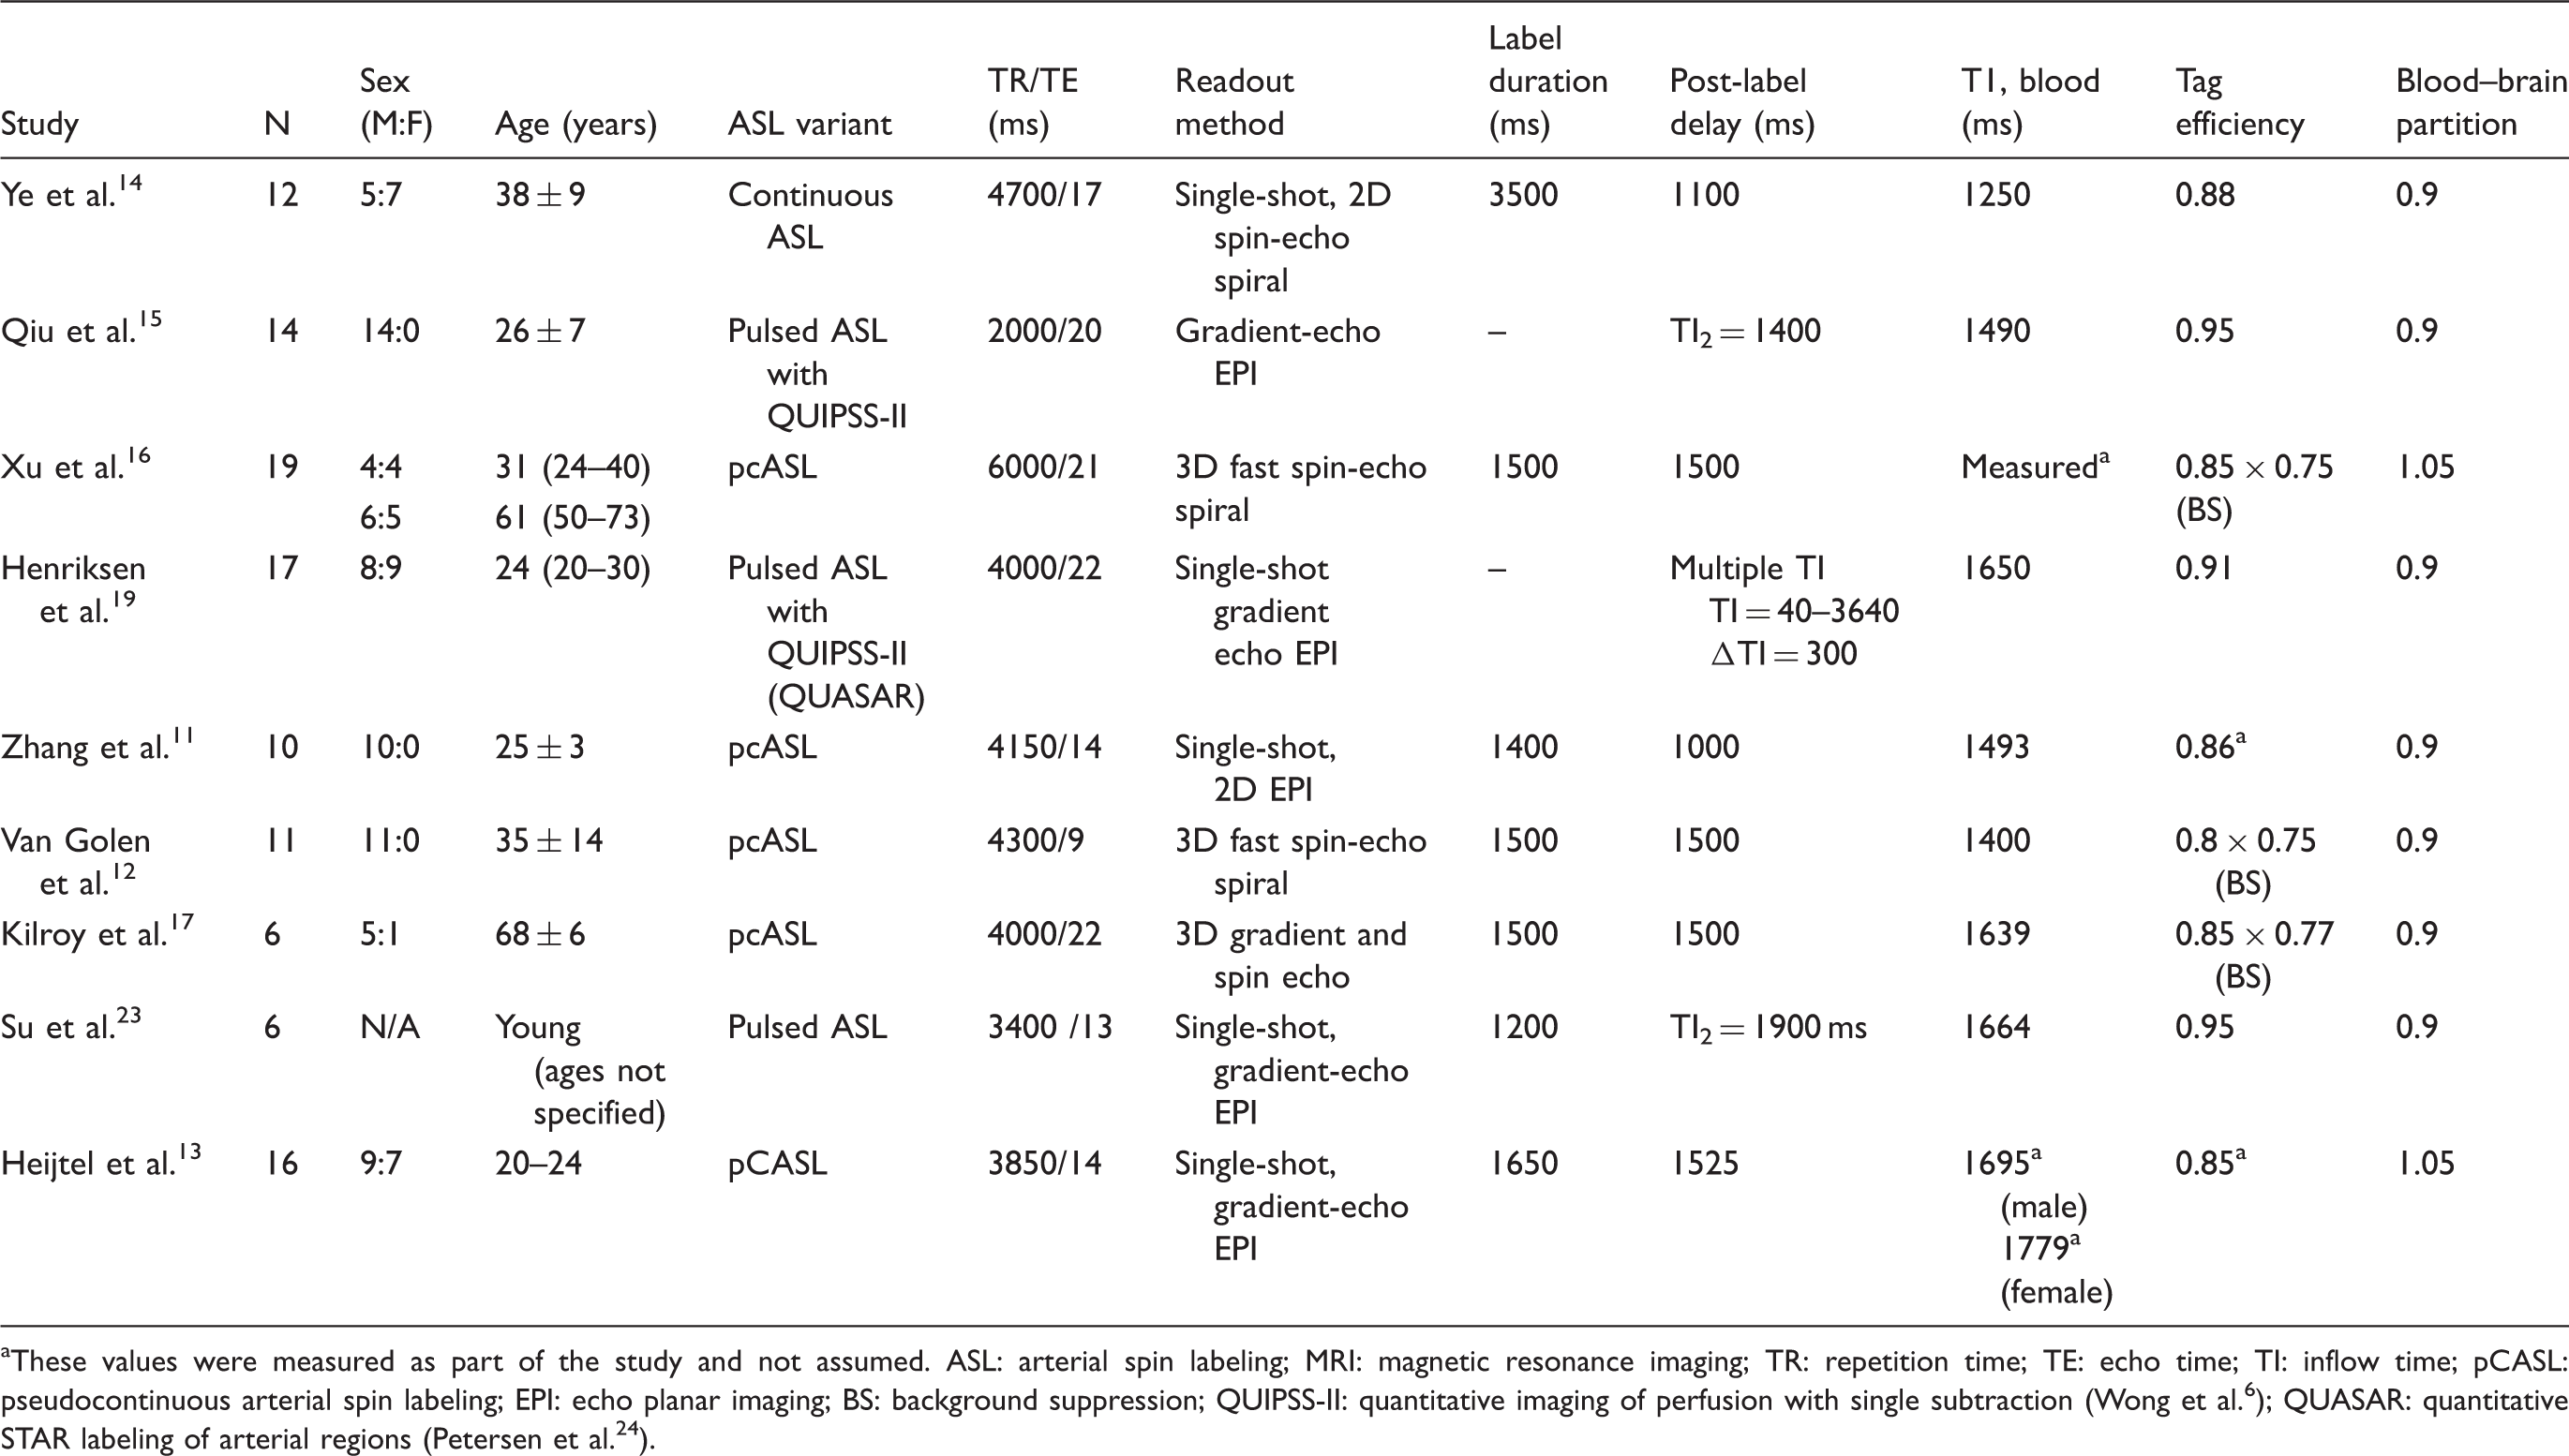
aThese values were measured as part of the study and not assumed.
ASL: arterial spin labeling; MRI: magnetic resonance imaging; TR: repetition time; TE: echo time; TI: inflow time; pCASL: pseudocontinuous arterial spin labeling; EPI: echo planar imaging; BS: background suppression; QUIPSS-II: quantitative imaging of perfusion with single subtraction (Wong et al. 6 ); QUASAR: quantitative STAR labeling of arterial regions (Petersen et al. 24 ).
Acquisition and calibration parameters for ASL MRI in comparison studies of patients with various diseases.
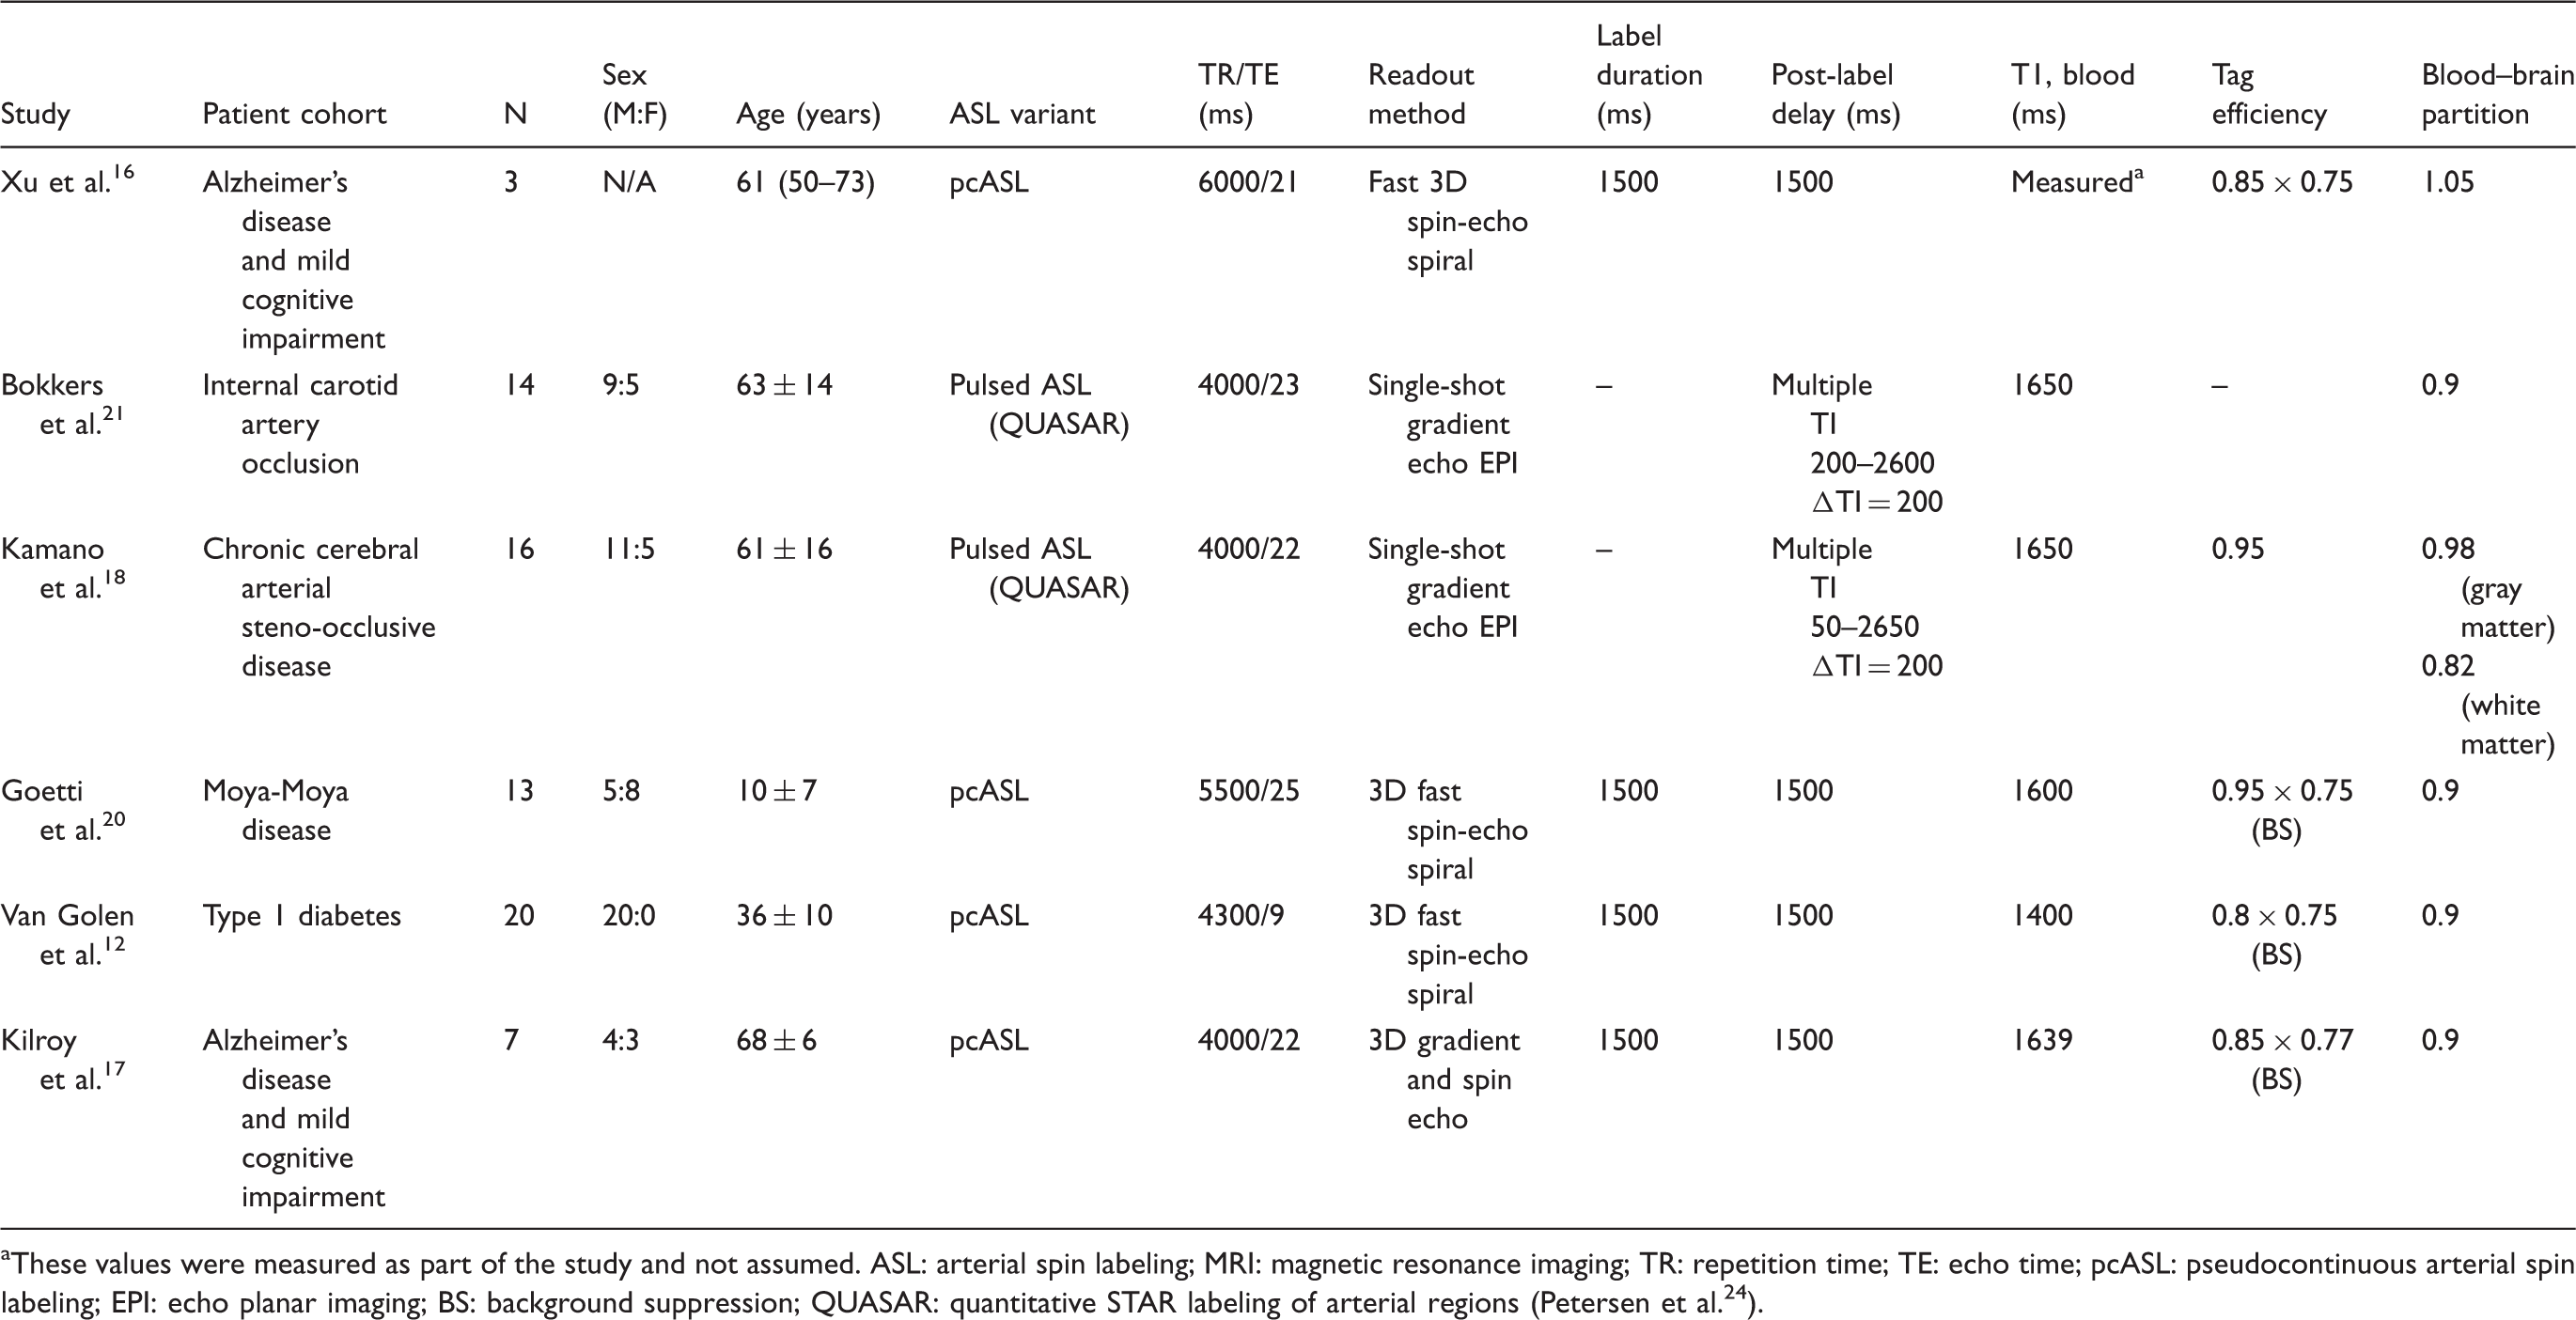
These values were measured as part of the study and not assumed.
ASL: arterial spin labeling; MRI: magnetic resonance imaging; TR: repetition time; TE: echo time; pcASL: pseudocontinuous arterial spin labeling; EPI: echo planar imaging; BS: background suppression; QUASAR: quantitative STAR labeling of arterial regions (Petersen et al. 24 ).
Timing parameters
The ASL scans differed in the time elapsed between the labeling and image acquisition, during which tagged arterial blood travels to the imaging slice. In pulsed ASL, this delay is known as the inflow time (TI), and varied from 1400 ms 15 to 1900 ms 23 across the studies summarized here. The post-label delay (PLD) parameter in pcASL experiments spanned a similar range from 1000 ms 11 to 1525 ms. 13 In normal volunteers, we expect the ASL signal to accurately reflect perfusion into the brain parenchyma if the TI or PLD time is greater than the arterial transit time (ATT). For healthy brains, TI and PLD values greater than ∼1500 ms will allow sufficient time for tagged blood arrive at the imaging slice. The same ASL protocol was typically used in both patients and controls (Table 3). However, use of standard PLD or TI times may be problematic in patients if the ATT is altered due to disease-related abnormalities in the vessels. To avoid potential bias in CBF quantification, two patient studies18,21 adopted QUASAR pulsed ASL to acquire perfusion signals at multiple TI’s, which should be less sensitive to ATT effects than single-TI methods.
The choice of TI and PLD parameters also changes the SNR of the ASL scan, in a complex manner that depends on the repetition time and the transit time of arterial blood. The PLD timing parameter (relative to the arterial arrival time and transit of tag into the tissue) and the chosen ASL labeling duration also lead to different arterial blood volume contributions to the ASL signal. 26 For this reason, the SNR of ASL scans differed across the studies we reviewed, and may influence the available statistical power to detect a relationship between PET and MRI CBF values from small cohorts.
T1 relaxation
The accuracy of absolute CBF from ASL is heavily influenced by T1a, the assumed T1 relaxation value in arterial blood. This T1a value depends on the hematocrit (Hct) level and may fluctuate dramatically with Hct in some populations, including neonates during their first few months of life. 27 Fast T1 mapping techniques are not generally available on commercial MRI systems, and there is range of assumed T1a values reported in the literature (1.4–2 s) that will affect perfusion quantification. For instance, given a true T1a of 1650 ms and CBF of 50 ml/100 g/min, an incorrect assumed T1a of 1400 ms would lead to a calculated CBF of 60 ml/100 g/min, i.e. an overestimation of 20%. One study chose to measure T1a in each volunteer, 13 and found mean values of 1695 ms for male subjects and 1779 ms for female subjects. Notably, other studies have assumed a wide range of T1a values, ranging from 1250 ms 14 to 1650 ms,18,19,21 which contributes to ASL CBF variability.
After the label arrives to the imaging slice, whether the subsequent signal is fit to a one-compartment or two-compartment ASL model affects the CBF quantification. 28 With a one-compartment model, the inverted label (flowing spins) continues to relax with T1a, the value for arterial blood. In contrast, with a two-compartment model, the label transitions into the tissue environment; and decays faster with tissue T1 relaxation of 1026 to 1200 ms in gray matter,29,30 or with an even lower T1 of 600 ms in white matter. 29 As a result of this T1 transition, the same ASL signal modeled by the two-compartment model provides higher quantitative CBF than the one-compartment model for typical values of tissue T1. Of the nine studies in Table 2, five used the one-compartment model, three used the two-compartment model, and one used a “model-free” approach to characterize the multi-delay ASL time course. The more physiologically accurate two-compartment model likely provides CBF values closer to PET than the one-compartment model, although a careful comparison has not been performed.
Additional technical considerations
In ASL, moving labeled spins that remain in large arteries may contribute to a focal CBF overestimation. One approach to address this contamination is to apply flow crusher gradients, e.g. symmetric gradient pulses before and after each RF inversion (labeling) pulse, to dephase moving spins and suppress intravascular flow signal. Among the studies listed in Tables 2 and 3, half of the investigations (6/12) applied crusher gradients in their ASL acquisition. While crusher gradients are important to avoid focal CBF overestimation due to large vessels, they may reduce SNR and are thus ill-suited to low-SNR applications such as multi-delay ASL. It is also important to remember that crusher gradients remove some of the labeled water; if this effect is not accounted for, one would expect a global CBF underestimation.
To a lesser extent, the assumed labeling efficiency (α) of the ASL magnetic tag also affects CBF. This α parameter corrects for incomplete tagging of the arterial blood due to off-resonance or excitation field inhomogeneity at the labeling position,31,32 and differs between ASL labeling types. In the studies we reviewed, α was assumed to be greater than 0.9 for pulsed labeling strategies, whereas α was assumed to be between 0.8 and 0.85 for most pseudo-continuous labeling strategies. Two studies directly measured labeling efficiency in volunteers as part of the pcASL protocol,11,13 through use of reference phase-contrast MRI scans to assess total brain blood flow. Studies that adopted MRI background suppression pulses typically included an additional attenuation factor of 0.75 to the assumed value of α.12,16,17,20
CBF measurements by PET and ASL in healthy volunteers
Quantitative CBF findings by PET and MRI
To evaluate comparisons of quantitative CBF, articles were selected based on a PubMed search of the terms “Arterial spin labeling MRI” and “O-15 PET.” The search was limited to studies in the past 15 years that performed absolute CBF measurements with PET and ASL in healthy volunteers. We identified seven quantitative studies that satisfied the search criteria.11–15,19,23 Some of these studies have also been described in a recent review article from Zhang et al. that focused on ASL comparisons with [15O]-water PET, [ 18 F]-FDG PET, perfusion SPECT, and contrast perfusion MRI in a range of diseases, including Alzheimer’s disease. 33
Figure 2 depicts the mean absolute CBF for the whole brain and in the gray matter imaged by PET and MRI for these studies. In most (6/7) of these reports, global ASL CBF values were within 15% of the PET CBF values. Across the studies, the weighted-average global CBF was 44.2 ± 9 ml/100 g/min by PET and 41.5 ± 9 ml/100 g/min by ASL. As expected, gray matter CBF values were higher than the whole-brain values; gray matter CBF was 53.9 ± 11 ml/100 g/min by PET and 54.1 ± 10 ml/100 g/min by ASL.
Schematic of CBF quantification challenges with ASL MRI. ASL issues related to assumed constants are shown on the left (gray boxes), including the T1 transition of label from blood to tissue, the labeling efficiency α, and the T1 relaxation of arterial blood. ASL issues related to imaging parameters selected by the user are shown on the right (white boxes), including the post-label delay, use of crusher gradients, and labeling duration.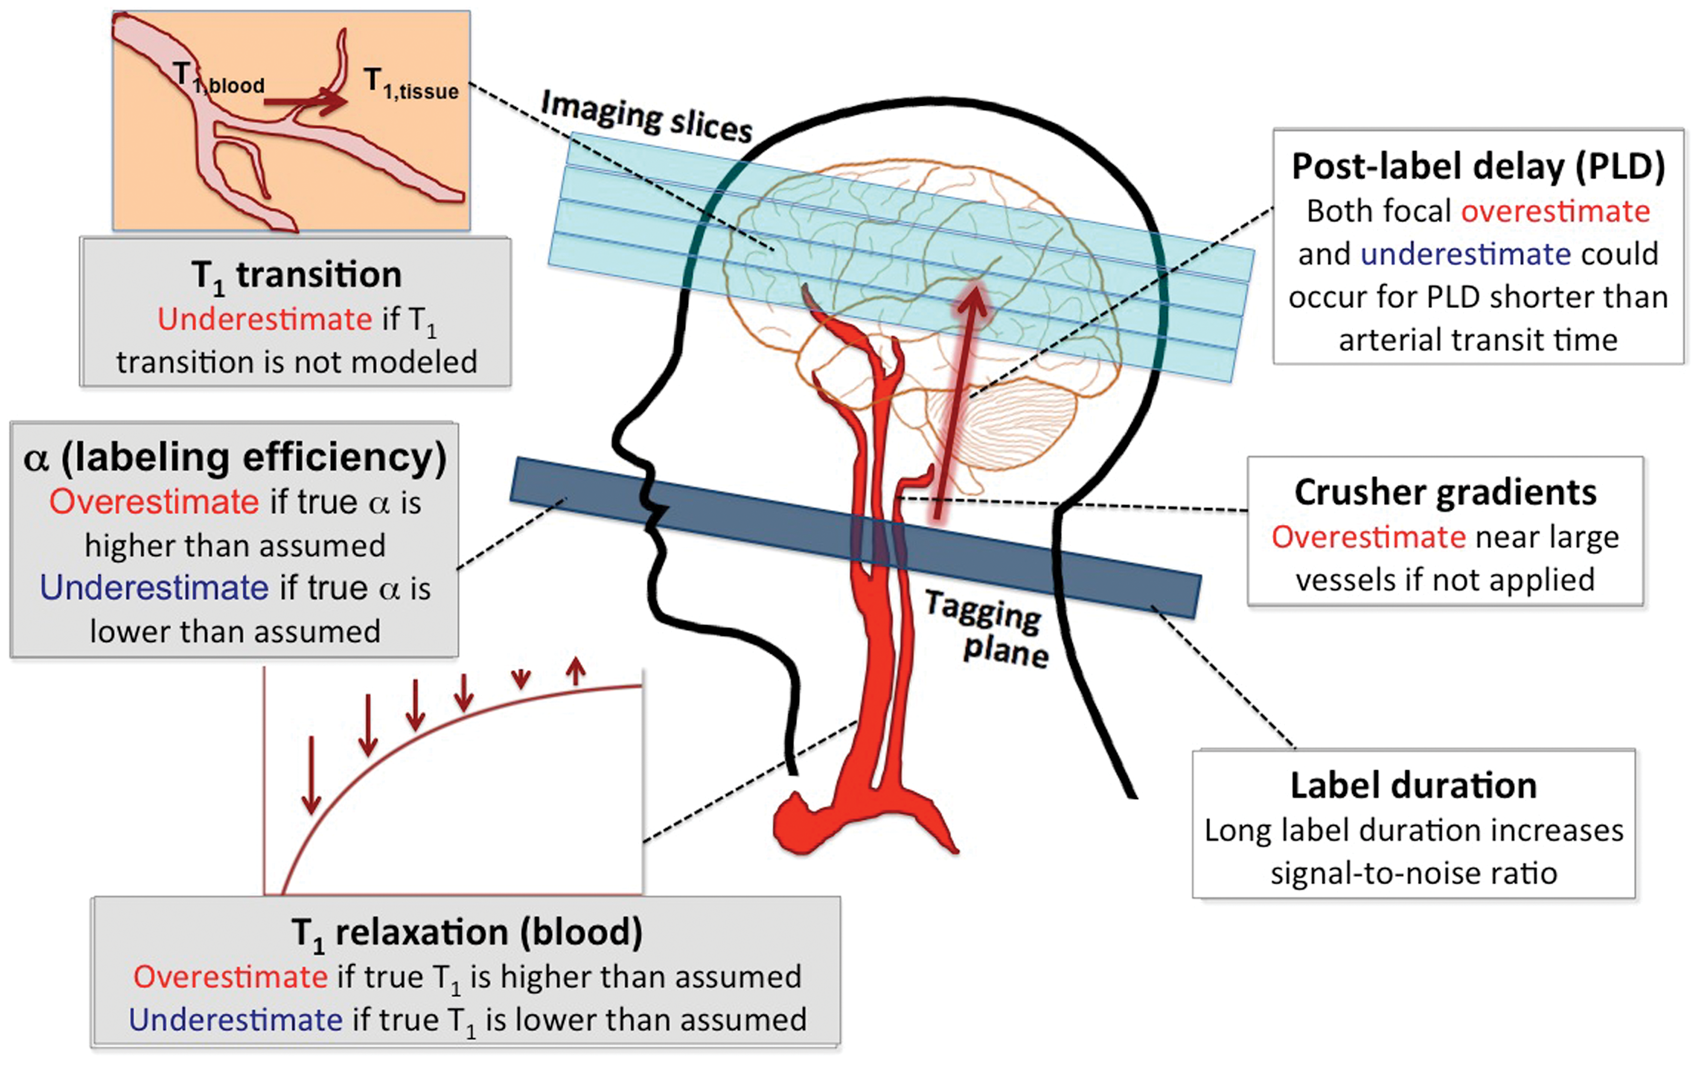
In Figure 2, the studies that used pcASL imaging generally overestimated CBF relative to the PET reference standard. For example, pcASL showed as much as 20% global overestimation of whole-brain CBF
11
; and 7% overestimation of gray matter CBF relative to PET.
13
On the other hand, pulsed ASL tended to underestimate CBF with MRI by approximately 12% compared with PET.19,23,34 The source of these trends is unclear, since other ASL studies directly comparing pulsed to pseudo-continuous ASL did not observe a bias between the labeling strategies.35–37 One contributing factor is that the PLD times used in pcASL studies were generally shorter than TI times adopted in pulsed ASL studies (Table 2). For PLD delay times much shorter than 1500 ms, gray matter CBF values may be overestimated due to contamination from residual labeled blood in arteries that is misattributed to the tissue.
38
This potential overestimation is consistent with the trends seen in Figure 2. To fully understand the impact of different labeling strategies requires additional direct comparisons between pulsed ASL and pcASL in future work.
Mean baseline cerebral blood flow (ml/100 g/min) measured by ASL MRI and [15O]-water PET in comparative studies across the (a) whole brain and (b) the gray matter. Studies are grouped based on the variant of ASL used for comparison against the PET gold standard. Error bars are estimated 95% confidence intervals that account for the sample size of each study. The solid blue line represents the mean PET CBF values and the dotted gray line represents the mean ASL CBF values across the studies. For each study, the MRI values were also normalized (blue crosses) using the one-compartment model with standardized values for assumed ASL constants in Alsop et al.
39
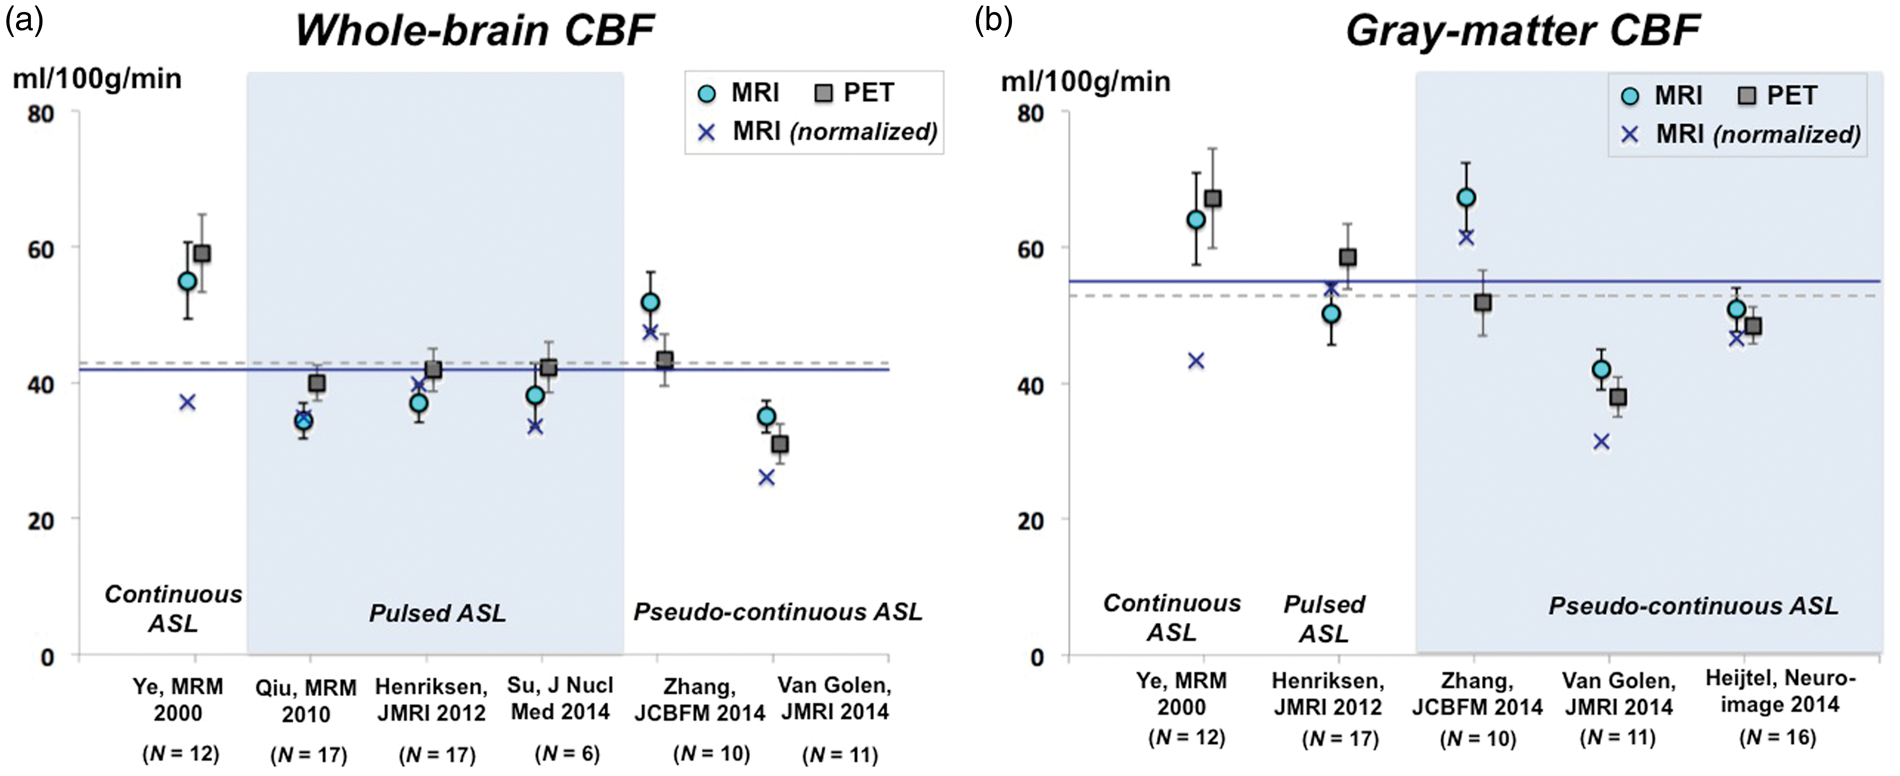
We also corrected ASL measurements to use consensus values of T1a (1650 ms); tag efficiency (0.85 for pcASL, 0.9 for pulsed ASL); and blood–brain partition coefficient (0.9 ml/g). 39 In 2/7 of the quantitative studies, we recalculated the CBF measurement to use the one-compartment instead of two-compartment ASL model. These corrections did not improve the overall consistency of PET and ASL methods (Figure 2, blue crosses). However, the correction lowered the mean ASL CBF values across studies for whole-brain (corrected CBF = 36.5 ml/100/gmin) and gray matter values (corrected CBF = 47.5 ml/100/gmin). We note that the studies by Ye et al. 14 and Van Golen et al. 12 showed dramatically lower ASL CBF after the correction, most likely because the original assumed T1a values (1250 ms and 1400 ms, respectively) were much lower than the consensus value of 1650 ms.
Regional aspects of CBF comparisons
In regional and voxel-wise analyses, the CBF agreement between PET and ASL often varied spatially across the brain. These spatial variations can inform users about technical considerations related to the ASL method. For instance, Ye et al. 14 observed that absolute CBF within a central cortical strip region of interest (ROI) was not different by continuous ASL and by PET; however, MRI underestimated absolute CBF in a central white matter ROI by 30% compared with PET. ASL is difficult to implement in white matter because of its longer transit time, which artificially reduces the achievable ASL signal. 40 In general, ASL in white matter is also known to have poor reliability and SNR because its blood flow is 2–3.6 times lower than that of gray matter. 41 Other studies compared regional CBF within smaller ROIs based on a brain atlas and found differences in specific ROIs due to high measurement variance or intrinsic regional tissue properties that affect the ASL signal.11,12
In recent literature, voxel-based morphometry has been performed to spatially align images into a common stereotactic space, enabling averaging across subjects.
42
With voxel-wise statistical tests, previous groups have detected areas of higher CBF by pcASL (deep cortical tissues including the cingulate cortex); and areas of lower CBF by pcASL (basal ganglia) compared with PET.12,13 These areas of systematic over- or underestimation of CBF may elucidate potential sources of bias in the ASL technique. For instance, underestimation of CBF in the prefrontal areas
13
likely reflects susceptibility-induced distortions near the sinuses that manifest on echo-planar readout ASL images (Figure 3); such a finding would not be expected with newer 3D spin echo readout strategies. This spatial mapping approach also facilitates visualization of the effect of ASL technical improvements, such as the addition of MRI crusher gradients to the pcASL sequence (Figure 3(d) to (e)). Interestingly, the use of crushers reduced the areas of CBF overestimation by ASL (due to contamination from macrovascular compartments and inappropriate choice of PLD), but did not improve areas of CBF underestimation.
Mean CBF maps across 16 healthy volunteers measured by (a) [15O]-water PET, (b) pseudo-continuous ASL (pcASL), and (c) pcASL with MRI crusher gradients. Voxel-wise statistical parametric testing (P < 0.001) reveals areas in which pcASL overestimates (red) or underestimates (blue) quantitative CBF relative to PET (d,e). This analysis revealed systematic overestimation of pcASL CBF in deep cortical tissues and systematic underestimation in the prefrontal area, basal nuclei, and near the sagittal sinus. The difference between rows (d) and (e) reveal that additional crusher gradients in the pcASL MRI sequence reduces the areas of overestimation.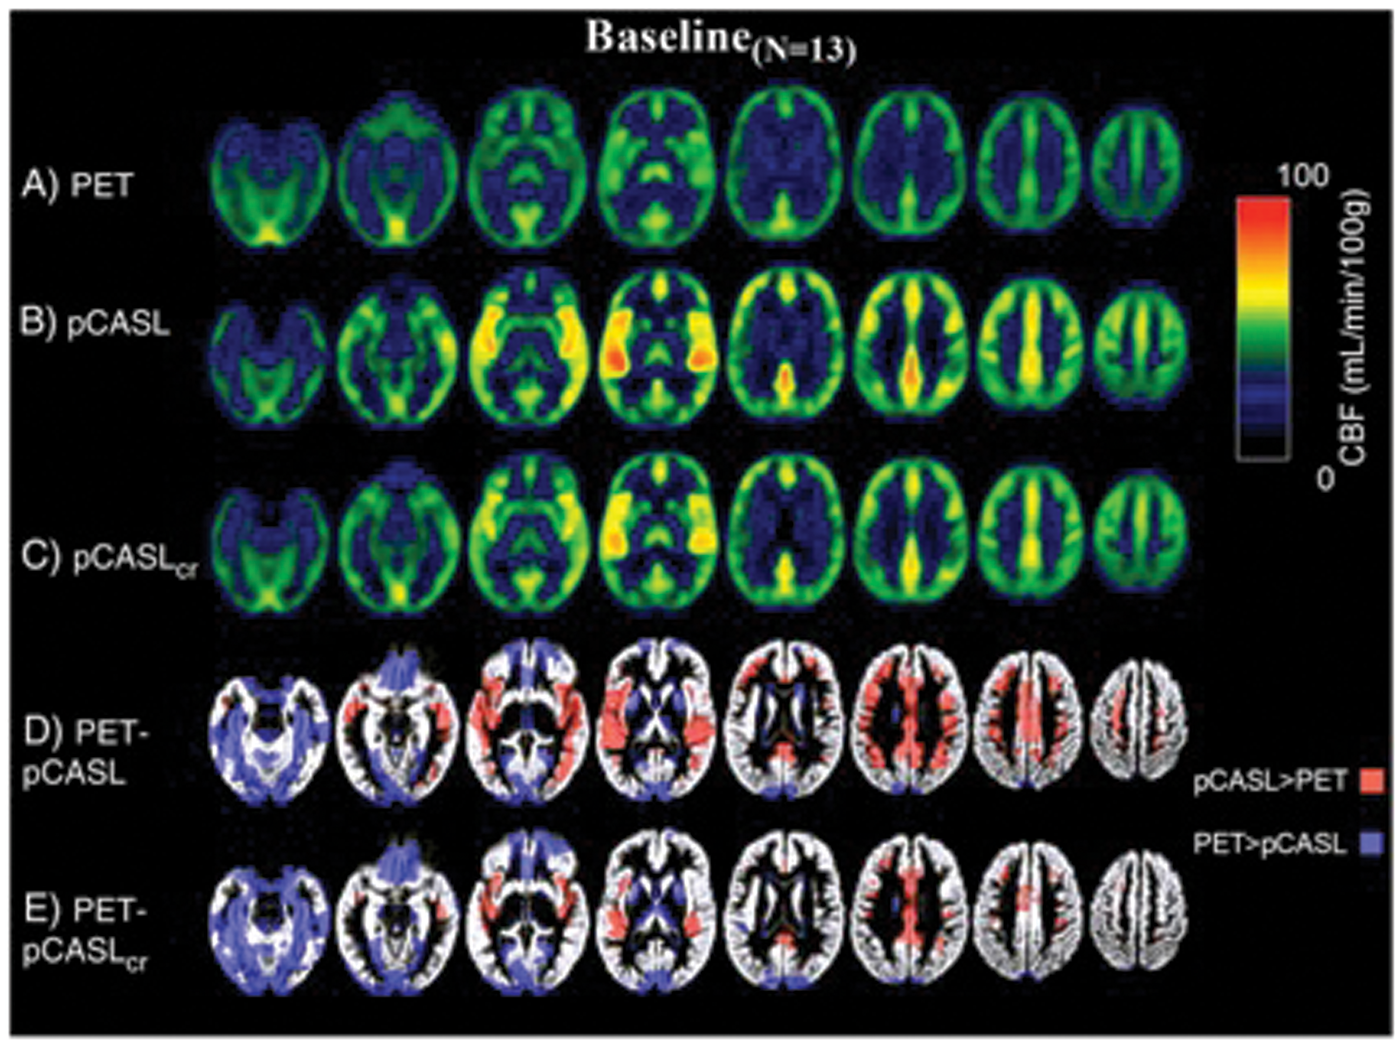
Partial volume effects on PET and MRI
Both ASL and PET experience CBF underestimation in gray matter due to partial volume effects. ASL CBF maps have higher spatial resolution (3–3.4 mm) than PET (6.5–7 mm),13,21 but are still prone to partial voluming within the thin and convoluted cortex (2–3 mm in thickness). Since ASL and PET each have vastly different spatial resolutions, regional CBF biases between techniques may arise due to different effects of partial volume on each modality. Whether the CBF maps are smoothed to the same resolution before comparison, 12 or interpolated to a common space15,16,19 versus the native perfusion space, 21 may also influence quantitative comparisons. These registration procedures varied widely in software and methodology across the studies reviewed here.
In future validation studies, differences in partial volume effects should be considered for CBF assessment in diseases that may result in tissue volume changes. For instance, a PET study of healthy aging found a significant inverse correlation between age and cortical CBF, but this trend was not present after adjusting for partial voluming. 43 Inappropriate treatment of partial volume effects could create different patient CBF results by different techniques. Partial volume corrections that have been proposed for PET44,45 and ASL46,47 often model each voxel’s signal as the weighted contribution of different tissue types, either statically or dynamically within the perfusion kinetic model. These corrections may need to be performed differently for each modality to mitigate CBF biases due to limited spatial resolution.
Time elapsed between PET and MRI measurements of CBF
For the comparison studies summarized in this article, PET and MRI CBF measurements were typically made in separate sessions. The time elapsed between the CBF scans ranged from hours,16,17 a week;13,21 multiple weeks;12,20 or up to 3 months. 19 Because the two scans were performed on separate machines at different times, discrepancies could reflect CBF fluctuations over time, which are hard to disentangle from differences in the underlying methods. Previous scan–rescan tests by [15O]-water PET have found a 10% variation in gray matter and 8% variation in white matter for an interval of 2 days. 48 ASL reproducibility scans revealed similar 14% variation for an interval of a week, and 6% variation even for measurements repeated within an hour. 49
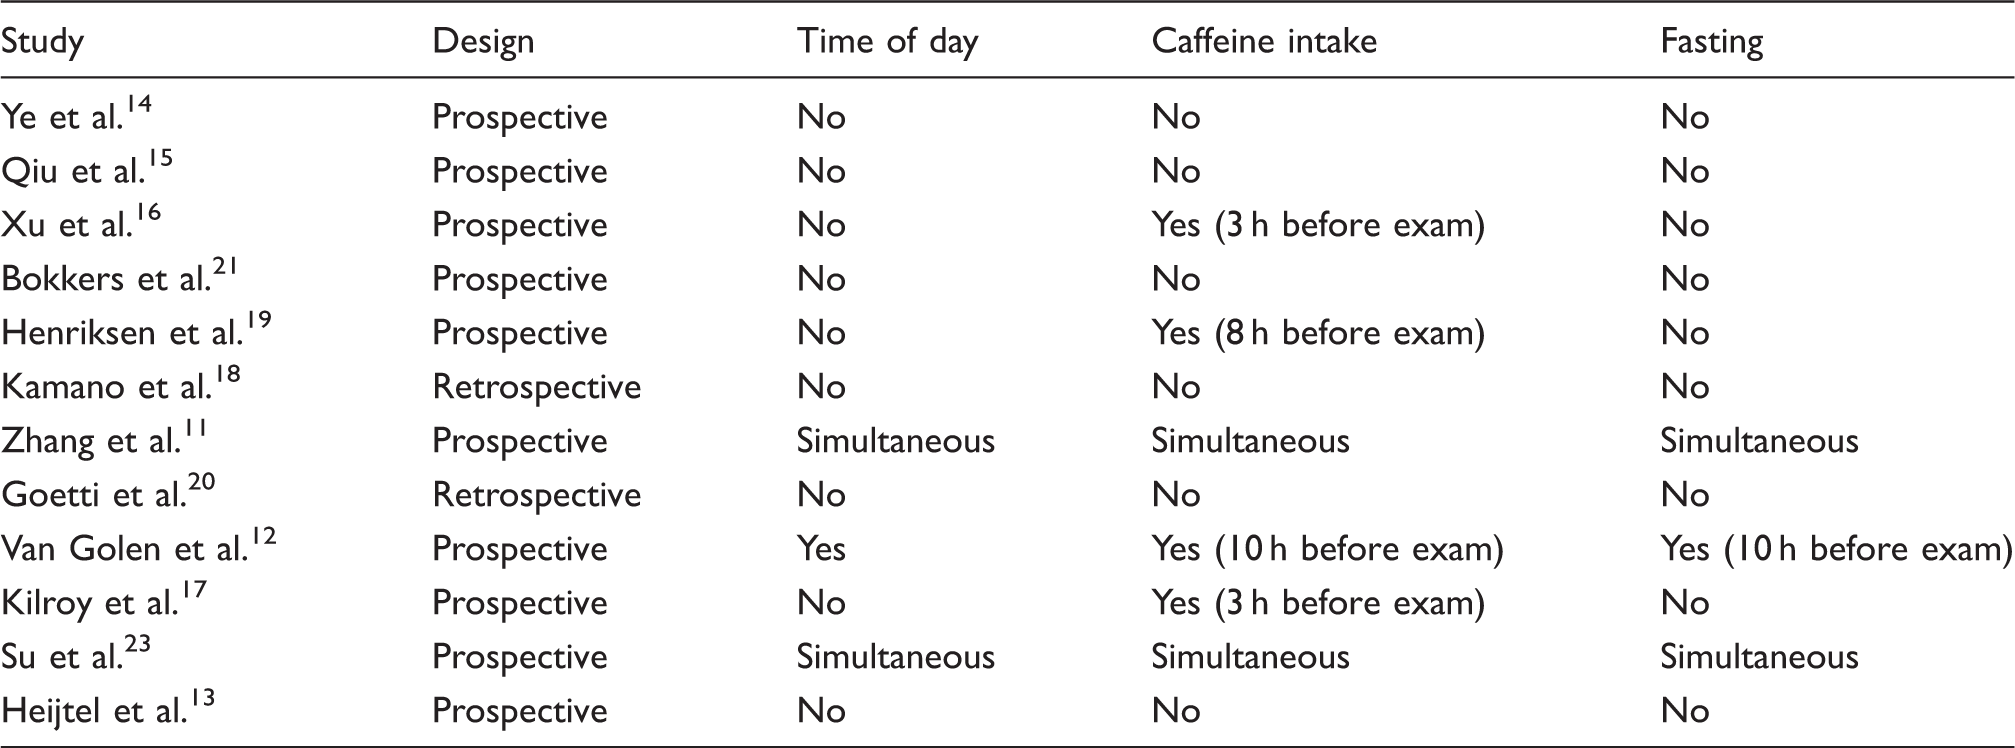
Control of physiological variables in comparison studies of perfusion imaging.
While most of these factors could not be assessed for the studies, we examined whether the agreement between PET and MRI related to the time interval between the scans. Figure 4 plots the Pearson correlation coefficient between PET and MRI for each study, including relative and quantitative studies, against the time elapsed between imaging sessions. Across studies, Spearman rank correlation (ρ = −0.77, P = 0.003) revealed an inverse relationship between the reported R2 values and the elapsed time. Thus, the consistency between PET and MRI CBF tended to be higher for measurements that are closely spaced in time; future comparison studies should aim to reduce this elapsed time as much as possible.
Pearson correlation coefficient (R2) between [15O]-water PET and ASL MRI perfusion measurements reported in comparison studies, plotted against the time elapsed between the PET and MRI scans. Correlations are presented for both absolute and relative CBF metrics, as well as for healthy volunteers (green) and patient populations (gray). Across studies, Spearman rank correlation revealed an inverse relationship between the reported R2 values and the elapsed time (ρ = −0.77, P = 0.003).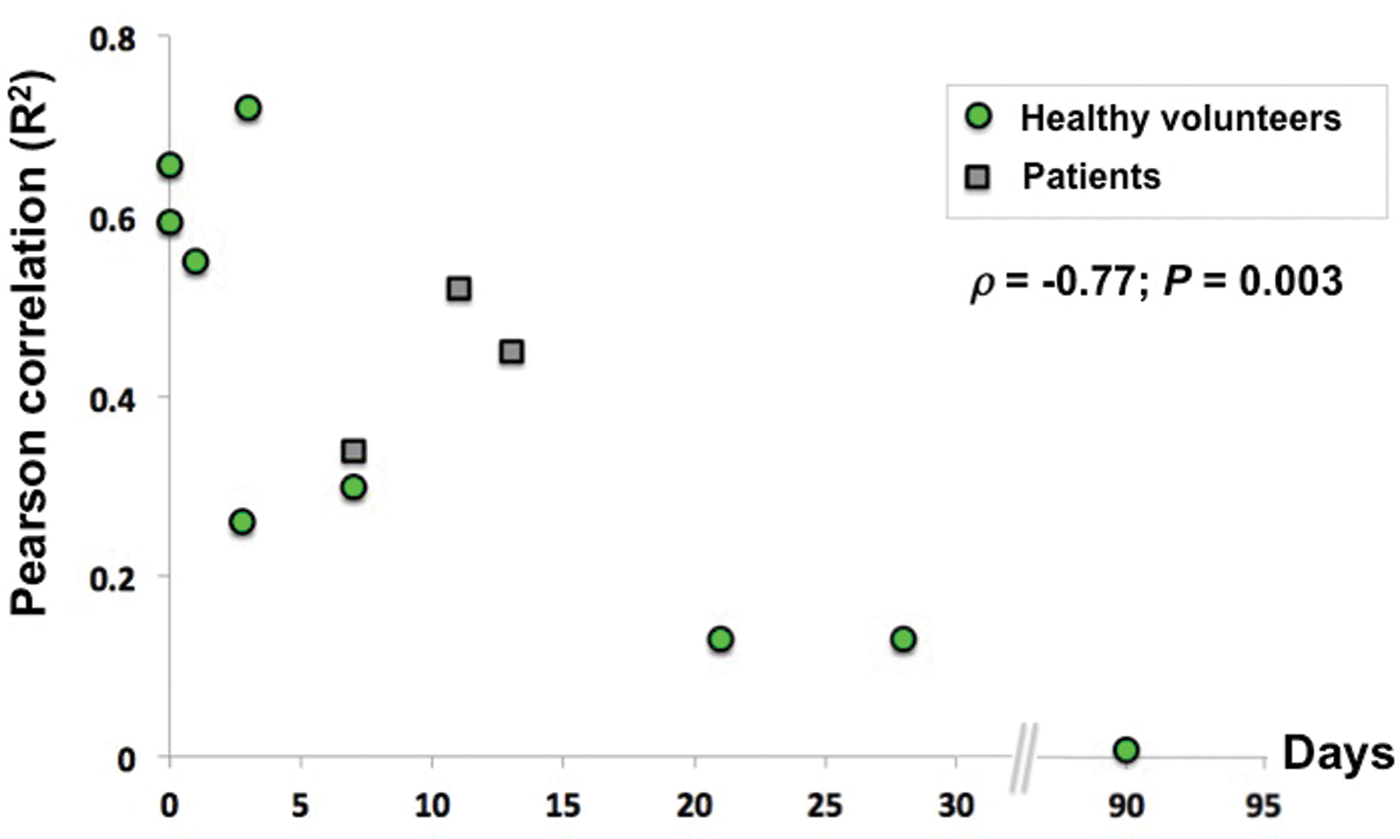
Simultaneous PET-MRI: Blessing or curse for comparing quantitative CBF?
New hybrid PET-MRI systems are an ideal validation tool that allows for simultaneous observations of CBF, thereby ensuring that the same physiologic perfusion state of the brain is imaged by each modality. Although sequential scans with minimal inter-scan delay may be sufficient for validation, the logistical challenge of coordinating multiple exams led to extended delays between the PET and MRI exams in many of the studies we reviewed. Because only one imaging session is required to obtain information by both modalities, the hybrid scanner greatly facilitates the logistics of validation.
Two studies have directly compared ASL to concurrent PET with a hybrid system.11,23 Zhang et al. used a prototype Siemens BrainPET insert, comprised of MRI-compatible PET detectors, to acquire simultaneous PET and MRI. 11 By avoiding physiological variations between different sessions, this work achieved high correlation between PET and pcASL for mean values across the gray matter (R = 0.80) and white matter (R = 0.94). However, regional CBF in the gray matter was still 29% higher by pcASL relative to PET. 11 This finding suggests methodological biases unrelated to CBF physiologic variations that preferentially affects the gray matter in their ASL implementation. While the ASL measurement bias for mean white matter CBF was lower (12%), voxelwise variations and noise in the white matter were still greater. In a separate study, high correlation (R = 0.77) was also observed between simultaneous PET and pulsed ASL scans for whole-brain CBF values. 23
While the PET-MRI offers truly simultaneous imaging of CBF by two modalities, it also brings unique technical challenges. A key concern is the lack of CT data for attenuation correction of PET images. Zhang et al. relied on a template-based attenuation correction based on the MRI structural scan acquired in each volunteer and knowledge of the attenuation properties and position of the imaging coils. These techniques are still under development and may contribute artifacts on the reference PET images. Nonetheless, the meta-analysis in Figure 4 and promising initial studies suggest that upcoming PET-MRI systems can facilitate ASL validation without errors related to different perfusion states at different scan times.
Perfusion measurements by PET and MRI in patients with neurological and metabolic diseases
For perfusion imaging to be clinically useful, reliable CBF measurements must be available in patients with altered cerebrovascular physiology. These patients may exhibit global changes in CBF with age 55 or neurodegenerative disease;56,57 or exhibit local CBF changes as in arterial occlusive disorders.58–60 Even in cases where absolute tissue perfusion is not affected by disease, arterial transit time (ATT) may be prolonged if blood is forced to flow through collateral vessel pathways. 61
Because the [15O]-water PET method relies on an exogenous injected tracer and computes CBF from the time integral of PET counts in local tissue, it is sensitive across multiple CBF levels and is robust to a wide range of ATTs. Thus, the same PET protocol for CBF assessment may be used for healthy persons and patients. On the other hand, ASL endogenously labels arterial blood and waits a pre-determined delay time (1.5 to 4 s) for the tag to arrive at the imaging slice. In patients with cerebrovascular disease, prolonged ATTs may lead to inaccurate CBF values if post-label delay is not adjusted accordingly. For instance, prolonged ATTs could lead to focal underestimation of CBF if the tag has not arrived to the acquisition plane at the time of imaging; or lead to regional CBF inaccuracy if residual labeled blood remains in slow-flowing vessels. ASL sequences thus must be tailored for CBF assessment in certain patient cohorts.
Cerebrovascular disorders
Goetti et al. 20 applied a standard pcASL sequence with a single PLD time of 1500 ms in children and young adults with Moyamoya disease to compare with PET. Visual evaluation by clinicians identified regions of impaired flow (40% of the segmented vascular territories) related to disease; these qualitative findings were largely concordant between the PET and MRI scans. However, in quantitative analysis, measured CBF values were lower on ASL compared with PET, especially in areas that with visibly reduced perfusion. 20 The authors suggested that this was partly due to long transit times through collateral pathways in Moyamoya patients. Because of long ATTs, the labeled blood may not have fully arrived at the imaging plane, leading to signal loss and artificially low CBF values by ASL. While Goetti et al. could have used a longer PLD (i.e. 2 s or longer) to ensure arrival of the label, this would have led to more severe T1 decay of the signal and reduced SNR. With a single PLD time, the tradeoff is as follows: enough time must elapse for the tag to reach the imaging slice including through collateral pathways (i.e. the PLD should be longer than the ATT); however, imaging must also occur before substantial label decay occurs.
To avoid problems due to long ATTs in single-delay ASL, two studies instead used multi-delay time ASL techniques for patients with cerebrovascular disease. With multiple TI’s or PLD’s, multi-delay ASL enables ATT estimation and can correct CBF based on the ATT.
62
Bokkers et al. used TI times between 200 and 2600 ms in patients with symptomatic internal carotid artery occlusion.
21
Kamano et al. used a similar range of TI times between 50 and 2650 ms in patients with chronic cerebral arterial steno-occlusive disease.18,24 The perfusion signal was modeled over the multiple delay times to quantify CBF maps,24,63 and both studies detected strong correlations between PET and MRI CBF values.18,21 As this modeling does not assume a fixed time of tag arrival, it is expected to provide more robust CBF estimates in the presence of long ATTs relative to single PLD methods. This advantage is illustrated in a patient with unilateral Moyamoya disease in Figure 5. On the multi-delay pcASL scans, the symptomatic hemisphere showed preserved perfusion but long ATTs. These elongated ATTs led to artificially low ASL signal at shorter PLD times (e.g. 700 or 1300 ms), which would manifest as CBF underestimation with a single-PLD approach if the selected PLD time is too short relative to the ATTs.
Multi-delay ASL images from a patient with unilateral Moyamoya disease of the right hemisphere. Perfusion images are shown for different PLD times; note that signal decays with increasing PLD, as expected. Arrows indicate areas of low ASL signal on images collected with short PLD times. The multi-delay ASL scans revealed long ATT in these same regions of the occluded hemisphere, suggesting that for PLD = 700 or 1300 ms, not enough time has elapsed for the label to travel through collateral vessels and fully arrive to the imaging volume. If a single-delay ASL technique had been used, inappropriate choice of PLD may have led to CBF underestimation in the symptomatic hemisphere. However, multi-delay ASL imaging indicates that perfusion is preserved in the symptomatic relative to the normal-appearing hemisphere (middle panel).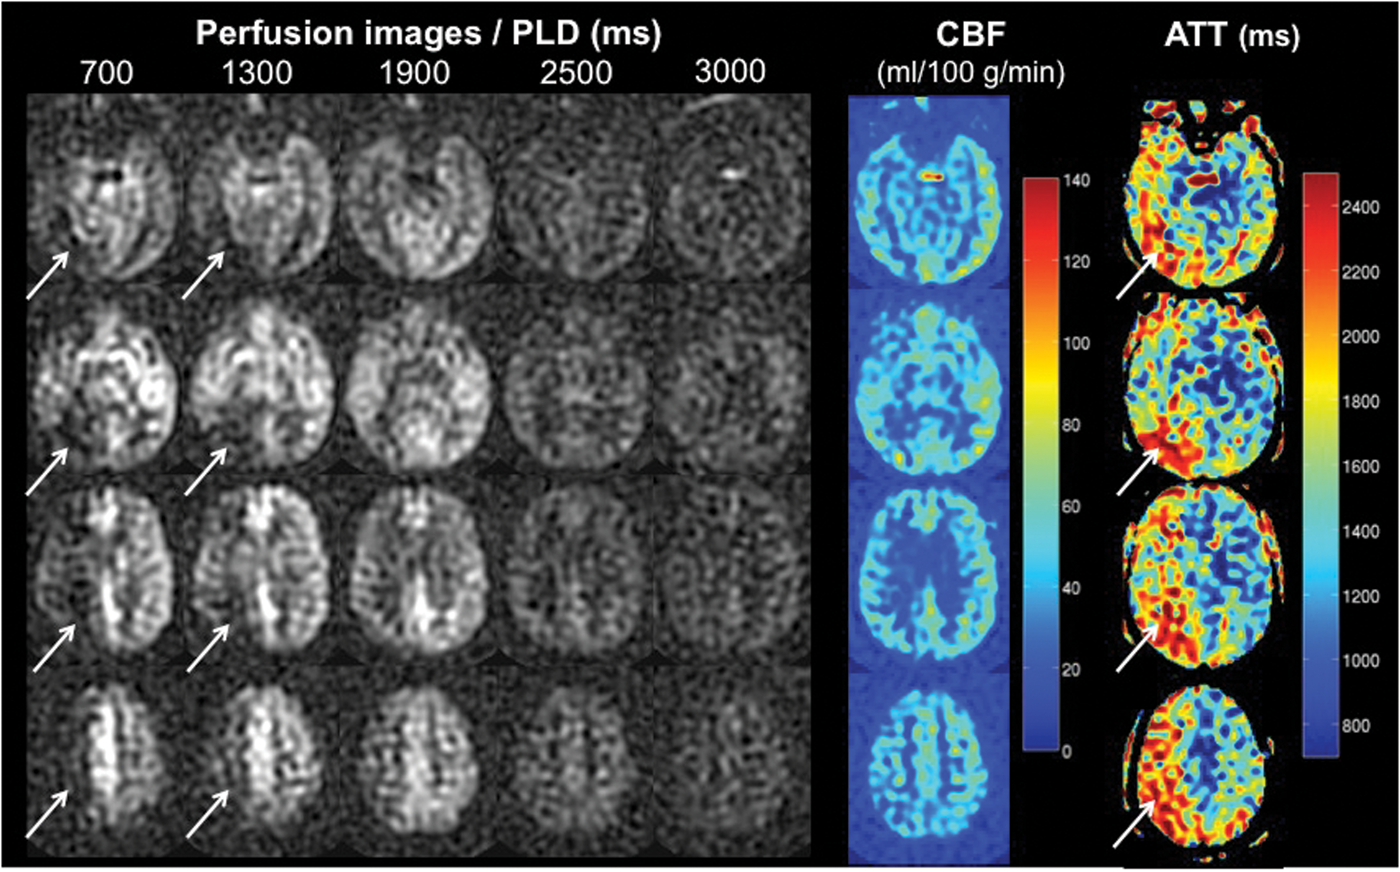
However, even with the use of multi-delay ASL, inconsistencies remained between PET and MRI in patients with cerebrovascular disorders. For instance, Bokkers et al. calculated the ratio between perfusion of the symptomatic hemisphere to the contralateral hemisphere. 21 ASL overestimated the difference between the symptomatic and contralateral hemispheres in the gray matter near the middle cerebral artery, but not in areas near the anterior or posterior cerebral arteries. The authors hypothesized that the particular anatomy of the MCA vasculature led to high residual intravascular ASL signal, which had not yet diffused into the local tissue. This observation motivates future ASL technical development in problematic areas of slow flow in patients.
Healthy aging and neurodegenerative diseases
Perfusion imaging provides insight into physiological changes during healthy aging and neurodegenerative disorders. Some imaging studies have found that gray matter CBF declines with age,64,65 whereas others have not observed strong age-related trends.43,66 Perfusion deficits have also been observed in Alzheimer’s disease (AD) and mild cognitive impairment (MCI),67–69 although typically in studies with small sample sizes. These populations present unique challenges for ASL measurements, due to the reduced image SNR that accompanies lower CBF, and require careful comparison against PET.
To address this need, two studies performed both PET and ASL in elderly subjects and in patients with AD and MCI.16,17 Each study found significant associations between PET and ASL CBF, with Pearson correlations greater than 0.5 across all ROIs. Despite technical challenges with use of ASL in elderly patients, both studies also reported high test–retest intraclass coefficient correlations (ICC) of 0.93 1 6 and 0.78 17 between the two modalities in the gray matter. In fact, Xu et al. observed higher gray matter SNR with ASL (8.86 ± 2) compared with PET (6.4 ± 1) in their elderly cohort. ICC values in the white matter also of good quality, although PET offered better SNR than ASL in the white matter. This work reaffirms the potential of ASL to detect more subtle CBF changes, even in these challenging populations.
Although neither study had sufficient sample size to assess disease-related trends, Xu et al. did see a decrease in the ratio of CBF in gray matter to white matter with age. 16 These findings must be interpreted carefully because they are based on single-delay time ASL scans. If the selected single PLD time is not long enough to allow complete delivery of the label to the tissue, ATT changes related to disease or age may alter the apparent CBF. Since ATT in elderly patients is likely longer than younger people,65,70 the effect of different ATTs could act a potential confounder. Future work in elderly individuals could investigate multiple-delay time ASL scans that are more robust to variable ATTs.
Metabolic disorders
Patients who suffer from metabolic disorders including diabetes may also benefit from imaging of brain perfusion. In these patients, large oscillations in blood glucose and insulin levels may damage the vascular wall 71 and directly affect CBF to the peripheral tissues;72,73 or they may create increases in neuronal metabolic activity that manifest as elevated CBF in glucose-sensing brain networks.74,75 Early [15O]-water PET studies have sought to characterize brain areas of increased CBF in diabetic persons,76,77 but have been limited in scope by the complexity of PET experiments.
Van Golen et al. investigated whether ASL is a suitable replacement for PET to study baseline CBF in healthy adults and patients with type 1 diabetes. 12 ASL overestimated CBF relative to PET in both the gray and white matter, particularly in the anterior and posterior cingulate cortices (P < 0.001). The authors suggested potential biases due to the assumed T1 relaxation value of arterial blood and blood–brain partition coefficient values used in the ASL measurements. Given the small cohort, van Golen et al. did not find any disease-driven difference in resting CBF between patients and controls, but did reveal a consistent overestimation of CBF by ASL, including in the diabetic patients.
Arbeláez et al. instead focused on the CBF response to a metabolic challenge in healthy volunteers. 77 Participants were imaged by PET and MRI during periods of high and low blood glucose levels created by variable infusions of glucose. Both PET and pulsed ASL identified similar focal increases in CBF within the thalamus, medial prefontal cortex, and globus pallidus during hypoglycemia compared with the euglycemia (P < 0.05). This study highlights the potential of ASL to measure CBF changes in various metabolic states, and may be applied in future work to detect disease-driven differences in the CBF response to metabolic challenges.
Relative CBF measurements by PET and MRI: Are relative metrics sufficient?
In some clinical applications, patient evaluation focuses on localized perfusion abnormalities, and internal calibration of the affected (ipsilateral) versus contralateral hemispheres of the brain may be more important than absolute perfusion. In these scenarios, relative CBF provides useful information about symptomatic brain regions compared with normal-appearing tissue16,17,20 and may even outperform current quantitative metrics to predict infarct growth.78,79 For these applications, the reproducibility, sensitivity, and diagnostic ability of relative metrics (e.g. CBF ratios between infarct, penumbra that infarcts, and penumbra that recovers in acute stroke) are also important to consider. 80
Several studies have compared relative perfusion measurements at baseline16–18,20 or during evoked CBF changes with a visual task.81,82 One rationale to use relative metrics for validation is to avoid arterial blood sampling to determine the AIF, which is necessary to quantify absolute CBF maps from the [15O]-water PET experiment. Arterial sampling requires cannulation of an artery and adds discomfort that is undesirable in many situations, particularly in specialized populations such as older adults and young children. PET CBF quantification without arterial sampling is challenging, because the assumed AIF and tracer kinetics may not apply to all individuals.
To avoid arterial sampling, Xu et al. created PET CBF images by first integrating the initial 60 s of tracer uptake and then normalizing to mean whole brain perfusion. 16 Similarly, Kilroy et al. scaled all PET CBF maps to a global mean of 50 ml/100 g/min. 17 Both studies found good correlation between relative CBF by PET and absolute CBF by pcASL MRI, including in older adults over 55 years of age. In contrast, Goetti et al. 20 first calculated absolute PET CBF images via kinetic modeling with a standardized, population-based AIF in children and young adults with Moyamoya disease. Although mean absolute CBF measured by pcASL was only slightly lower than CBF by PET, there was no association between the PET and MRI values across subjects. In further analysis, the authors instead computed relative PET CBF maps by normalizing to the cerebellar CBF. Only the relative CBF maps showed good agreement between the two modalities (R = 0.67, P < 0.001).
Even when blood samples were available, some investigators opted to compare relative CBF metrics. Kamano et al. collected arterial blood samples in patients with chronic cerebral arterial occlusion and found good agreement between absolute CBF by PET and absolute CBF by MRI (R = 0.52, P < 0.0001). 18 Normalization of the values to the mean across ROIs further improved this correlation for relative perfusion (R = 0.69, P < 0.0001). The authors suggested that normalization may have compensated for ASL errors in estimation of the longitudinal magnetization (M0), and thus improved the consistency between ASL and PET. The above studies suggest that ASL provides robust relative CBF measurements compared with the PET reference standard.
While there remains debate over the value of absolute CBF in clinical evaluation, this controversy may underscore the unavailability and complexity of CBF quantification. Some investigations have identified a CBF threshold (12.7 ml/100 g/min) above which tissue does not infarct in stroke patients 80 ; and have identified different CBF thresholds for tissue viability in gray and white matter. 83 On the other hand, a recent meta-analysis found high variability in optimal CBF thresholds reported for stroke, from 14.1 to 35.0 ml/100 g/min for penumbra, and from 4.8 to 8.4 ml/100 g/min for the infarct core. 84 The authors of this meta-analysis highlighted a lack of available quantitative studies, and large heterogeneity between the cohorts and study design. As we gain more experience with ASL, it may be that ASL will generate own reference CBF values that are slightly different from PET. Normalization methods also remove true differences in absolute CBF between populations. This normalization may pose challenges to CBF comparisons between cohorts, especially in neurodegenerative disorders that may present with early global or diffuse reductions in absolute CBF. Future studies that compare absolute CBF between modalities should focus on the clinical impact of each perfusion imaging technique.
Reproducibility of [15O]-water PET and ASL MRI
Knowledge about the reliability of CBF values over time (intra-subject reproducibility) is critical to accurate interpretation of longitudinal studies in normal brain development, neurodegenerative diseases, and therapeutic interventions. We also need to understand the normal CBF range across subjects (inter-subject reproducibility) to see if differences between patient groups reflect true disease-related changes or simply reflect normal population variations. Previous scan–rescan studies have assessed the repeatability of CBF measured by [15O]-water PET within the same session,85–87 or on separate days.48,88 Similar ASL studies investigated CBF reproducibility within the same session37,89,90 or in scans up to several weeks apart.91–95 Because ASL does not require ionizing radiation, repeat ASL scans have also been performed in the same subjects at different time intervals, ranging from the same session to scans a month apart.37,49,96
CBF reproducibility is affected not only by normal physiological and functional fluctuations in perfusion but also by technical aspects of the imaging modality. For instance, tissue magnetization transfer effects contribute signal fluctuations to pulsed ASL measurements; 89 transient magnetic fields such eddy currents also create fluctuations in ASL scans. On the other hand, arterial blood sampling poses a technical source of variability to PET-based CBF maps. To achieve a desired reproducibility of 5% in the AIF, and thus more reliable CBF values, Lebrun-Grandie et al. identified and removed spurious values from the arterial samples that may have reflected timing errors or changes in respiration due to stress from the arterial puncture. 97
The coefficient of variation (COV, %) for scan–rescan reproducibility (Figure 6(a)) and inter-subject variations in CBF (Figure 6(b)) is summarized across several CBF studies. These COV values include studies that performed only ASL, only PET, or both modalities. In Figure 6(a), the reproducibility was typically determined within same imaging session, except for one study in which ASL scans were separated by up to 4 weeks.
17
As expected, CBF variations between subjects (COVASL = 14.6% and COVPET = 13.3%) were larger than the scan–rescan reproducibility of the measurements (COVASL = 8.6% and COVPET = 10.1%). In the four studies that reported scan–rescan COV for both PET and MRI (Figure 6(a)), the scan–rescan reproducibility was consistently better with ASL compared with PET. This observation suggests that ASL may be a suitable replacement for PET in terms of reproducibility.
The COV (%) for (a) scan–rescan reproducibility and (b) and between-subject variations in healthy volunteers across CBF studies. The COV values are shown for studies that performed only ASL, only PET, or both modalities (center). Scan–rescan reproducibility was typically determined from the same imaging session, except in one study in which ASL scans were separated by up to 4 weeks. The solid blue lines represent the mean COV for MRI measurements, whereas the dotted gray lines represent the mean COV for PET measurements across the studies. References for each numbered study are presented in Appendix 1.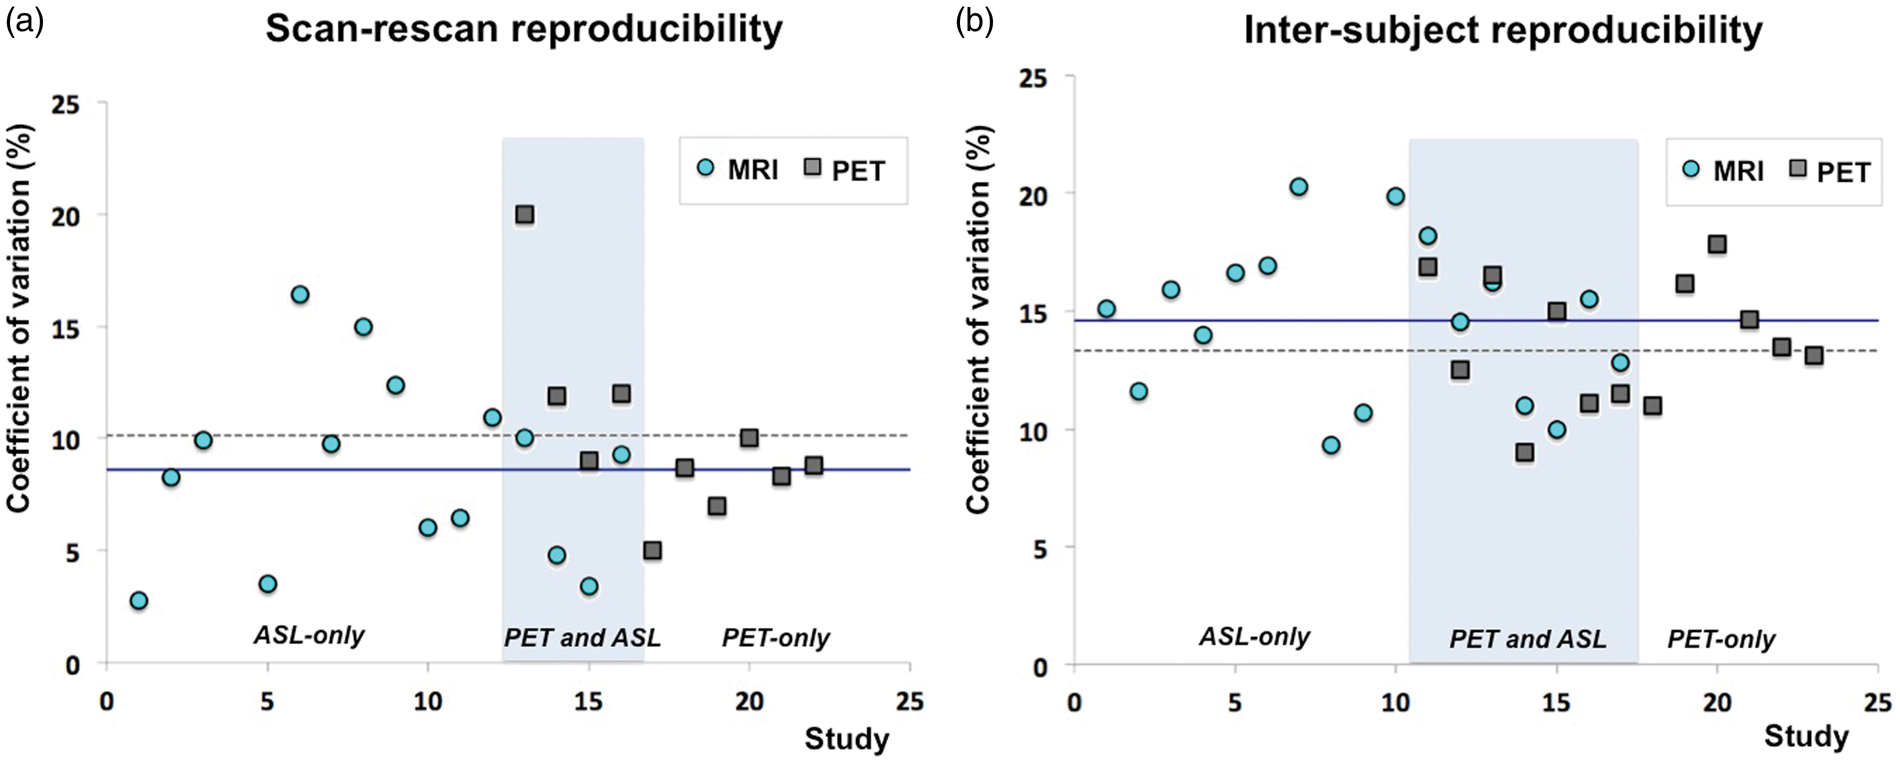
CBF measurements may also vary across imaging centers, as previously evaluated by multi-site studies of ASL35,98,99 and PET. 100 In this review article, the quantitative CBF values in Figure 2 all derive from healthy adults. For the PET reference standard, mean brain CBF values for four of the highlighted studies fell within a tight range of 39–43 ml/100 g/min.11,19,23 However, even within the healthy population, Ye et al. measured a higher PET CBF value of 59 ml/100 g/min 14 and van Golen et al. measured a lower PET CBF value of 31 ml/100 g/min. 12 These variations may reflect differences in acquisition methodology, image reconstruction, and analysis across sites that are only recently being explored.99,101
While Figure 6 depicts CBF reproducibility in healthy volunteers, few studies have assessed reproducibility in patient populations. Perfusion status may be more instable in patients due to physiological fluctuations related to pathology and technical artifacts. However, repeat scans are challenging in patients, and the underlying pathology may lead to rapid CBF changes. Kilroy et al. performed both PET and ASL CBF scans in elderly adults including patients with dementia 17 but repeat scans were only available for ASL, likely because ASL studies are technically less challenging than PET. Understanding the scan–rescan COV in patients is important to tailor imaging parameters to the desired longitudinal follow-up and expected magnitude of disease-related CBF changes.
Considerations for future comparison studies
By summarizing studies that performed both ASL MRI and [15O]-water PET CBF imaging, we identified unmet needs that motivate future comparison studies. In clinical use, ASL is preferred because it does not use ionizing radiation, is relatively simple to set up, and has better scan–rescan reproducibility than PET. ASL also has significant advantages over other MRI techniques such as dynamic susceptibility contrast, which requires injection of a contrast agent and does not provide quantitative CBF values in routine practice. However, in order for ASL to be considered the new standard for CBF imaging, the following shortcomings must be addressed:
A standardized protocol for ASL should be adopted and refined
The acquisition parameters and assumed constants for CBF quantification differed between ASL studies. For instance, a wide range of assumed T1 relaxation values in arterial blood (Table 2), and of PLD times may have contributed to variations in ASL CBF across studies (Figure 2). There has been a recent effort to standardize the method, resulting in a consensus protocol for both pulsed and pseudo-continuous ASL. 39 This consensus protocol recommends different timing parameters to image various populations, with shorter PLD for children (1500 ms) and longer PLD (2000 ms) for elderly persons over 70 years of age and adult patients. However, the protocol also by necessity utilizes several simplifications, such as a one-compartment model that does not account for tissue T1 relaxation, to enable wider use of quantitative ASL. We acknowledge that with vast variations in ATT across populations, it is unlikely that a single standard protocol is optimal for all conditions. Nonetheless, it is critical to have a standardized set of parameters that reflect our current understanding of the ASL technique and may be revised as new ASL developments are tested.
Further evaluation of multi-delay ASL is needed in patient populations
Previous PET and MRI comparisons of CBF have mainly focused on healthy volunteers, and there is a lack of studies in patient populations (e.g. with cerebrovascular disease) where standard ASL strategies may fail. 20 In clinical settings, CBF maps must be acquired efficiently, and it is usually not possible to acquire “pre-scans” that may help optimize the ASL parameters for individual patients. To achieve sufficient SNR, many multi-delay ASL scans approaches require longer duration scans, which can in turn lead to issues with patient motion in challenging populations. Furthermore, there is limited information about the reproducibility of ASL in patients, which may exhibit higher measurement variance in regions of low flow. MRI perfusion quantification is an established need in imaging of acute ischemic stroke patients, and typically must be performed within hours of symptom onset. Improvement of SNR and reproducibility of ASL in acute stroke would represent a key step forward in the stroke community, especially in the context of imaging to select patients for new endovascular treatments. 102
Not only must we better understand clinical situations in which standard ASL fails, advanced multi-delay ASL strategies18,21,34,62 hold promise in patient populations and should be carefully evaluated against PET in these cohorts. Unfortunately, there is currently no recommended protocol for multi-delay ASL and its successful implementation must overcome several technical challenges. These obstacles include lower SNR due to small flip angles in Look-Locker approaches,21,103 the tradeoff between long acquisition time and poor resolution with sequential acquisitions, and lower CBF reproducibility. 104 Sequential multi-delay ASL approaches typically limit the number of averages and/or spatial resolution to maintain reasonable scan time. Furthermore, the SNR of images at longer PLDs are significantly lower than single-delay ASL acquisitions with the same PLD.
More efficient encoding strategies (e.g. Hadamard encoding 104 and time-encoded pcASL 105 ), in which labeling blocks are divided up to avoid idle time in sequential PLDs, may improve the SNR of these scans. If a reliable multi-delay ASL is established, this approach may prove ideal for imaging in patients where the ATT is unknown. Other advanced strategies, such as velocity-selective ASL, which labels arterial blood spins based on their flow velocity rather than spatial location, have also begun to show good voxel-wise correlation with [15O]-water PET and may improve perfusion estimates in challenging patient cases. 106
Multiple CBF observations in different brain states are necessary to map cerebrovascular reserve (CVR)
CVR is the perfusion response of the cerebral vasculature to a “brain stress test” that increases blood flow to the brain (i.e. via a pharmacologic intervention or a breathing challenge). There is increasing interest in clinical CVR measurements, since impaired CVR is a strong predictor of increased risk for ischemic events in patients with steno-occlusive disease independently of baseline CBF values.107,108 Because the calculation of CVR maps requires multiple CBF observations, ASL is an ideal imaging tool because of its noninvasive nature. Only one comparison study to date has directly compared CVR maps by both modalities, 13 and this work found excellent correspondence between PET and ASL for mean CVR values and on a voxel-wise basis. Future studies could further compare CVR by PET and MRI, and evaluate CBF reproducibility across a larger range of different brain states. 109
Hybrid systems can offer simultaneous CBF exams by PET and MRI
Normal physiological CBF fluctuations complicate the agreement between PET and MRI values from separate scan sessions. Not surprisingly, studies in which PET and MRI were closely spaced in time had better agreement (Figure 4). The introduction of PET-MRI systems allows for an ideal validation tool to achieve simultaneous perfusion scans by both modalities and avoid undesired physiological fluctuations.11,23 Concurrent high-resolution MRI also allows clear delineation of major arteries to derive an image-based AIF 23 that may better represent tracer delivery at the brain than AIFs measured from the radial artery in typical PET studies. Although technical challenges such as attenuation correction remain, PET-MRI scanner offers a promising new way to validate ASL against PET in future studies.
Conclusion
The ability to measure CBF in the brain will bring critical benefits in clinical evaluation of cerebrovascular disease, aging and development, and neurodegenerative disorders. Perfusion studies that have compared ASL MRI and [15O]-water PET reveal the promise of ASL for accurate and reproducible CBF measurements, but vary in ASL methodology and lack sufficient testing in patient populations. Future studies could take advantage of PET-MRI systems for simultaneous CBF validation of newly standardized ASL protocols. Once ASL is validated, clinicians will gain a noninvasive, robust and repeatable imaging method with lower coefficient of variation to investigate quantitative perfusion in the brain.
Footnotes
Funding
The author(s) disclosed receipt of the following financial support for the research, authorship, and/or publication of this article: Stanford Neurosciences Institute Interdisciplinary Scholar Award and GE Healthcare
Acknowledgments
We thank Dr. Jarrett Rosenberg for insightful discussion on data analysis, statistics, and presentation.
Declaration of conflicting interests
The author(s) declared the following potential conflicts of interest with respect to the research, authorship, and/or publication of this article: Dr. Fan receives research support from the Stanford Neurosciences Institute Interdisciplinary Scholar Award and GE Healthcare. Dr. Jahanian receives research support from GE Healthcare. Dr. Holdsworth receives research support from GE Healthcare. Dr. Zaharchuk receives research support from GE Healthcare.