
Abstract
The in vivo binding of D2 receptor ligands can be affected by agents that alter the concentration of endogenous dopamine. To define a more explicit relation between dopamine and D2 receptor binding, the conventional compartment model for reversible ligands has been extended to account for a time-varying dopamine pulse. This model was tested with [11C]raclopride positron emission tomography and dopamine microdialysis data that were acquired simultaneously in rhesus monkeys. The microdialysis data were incorporated into the model assuming a proportional relation to synaptic dopamine. Positron emission tomography studies used a bolus-plus-infusion tracer delivery with amphetamine given at 40 minutes to induce dopamine release. The extended model described the entire striatal time–activity curve, including the decrease in radioactivity concentration after an amphetamine-induced dopamine pulse. Based on these results, simulation studies were performed using the extended model. The simulation studies showed that the percent decrease in specific binding after amphetamine measured with the bolus-plus-infusion protocol correlates well with the integral of the postamphetamine dopamine pulse. This suggests that changes in specific binding observed in studies in humans can be interpreted as being linearly proportional to the integral of the amphetamine-induced dopamine pulse.
Positron emission tomography (PET) and single-photon emission computer tomography studies demonstrate that administration of pharmacologic agents known to alter synaptic dopamine can affect the binding of D2 receptor radioligands. It has been shown that substances known to increase synaptic dopamine such as amphetamine (Dewey et al., 1991; Innis et al., 1992), methylphenidate (Volkow et al., 1994), and tetrabenazine (Dewey et al., 1993) lead to a decrease in D2 ligand binding. Alternatively, stimulation of GABAergic (Dewey et al., 1992) or serotonergic neurons (Dewey et al., 1995), both of which inhibit dopamine release, leads to increased D2 binding. In addition, pretreatment with reserpine, which depletes dopamine stores, greatly reduces the amphetamine-induced washout of the single-photon emission computer tomography D2 ligand [123I]iodobenzamide (Innis et al., 1992). Furthermore, it has been shown by analysis of PET studies in primate and microdialysis studies in rat that an induced change in D2 ligand binding corresponds to an opposing change in dopamine level (Dewey et al., 1995). These studies demonstrate that D2 tracers can be used to indirectly observe changes in dopamine. However, this effect has not been described quantitatively; that is, a measured change in specific binding has not been related mathematically to an induced change in dopamine. Understanding this relation would lead to better interpretation of dopamine competition studies in humans.
This report develops a mathematical model that describes the relation between tissue dopamine concentration and the binding of [11C]raclopride. Data used for developing and testing the model came from combined PET and in vivo microdialysis studies in rhesus monkey that provided simultaneous measurement of [11C]raclopride and striatal dopamine (Breier et al., 1997). To better observe changes in tracer binding within a single study, bolus-plus-infusion (B/I) tracer delivery (Carson et al., 1993a) was used to obtain a near constant level of [11C]raclopride in plasma and cerebral tissues. For each study, 40 minutes were allowed for the tracer to reach a stable level, at which time amphetamine was administered to induce dopamine release. To describe the [11C]raclopride striatal time–activity curves (TAC), a two-tissue compartment model (Farde et al., 1989) was extended to include the effects of dopamine using the measured microdialysis data. Using the extended model, simulations were performed to determine what feature of the induced dopamine pulse most strongly influences the PET signal. Further simulations were performed to investigate the effect of an amphetamine-induced blood flow change.
THEORY
[11C]raclopride is a reversible D2 antagonist with kinetics that can be described by a two-tissue compartment model (Farde et al., 1989). This section defines the extended model, which includes the effects of dopamine competition. The compartmental diagram of the model is shown in Fig. 1, and the terminology is defined in Table 1.
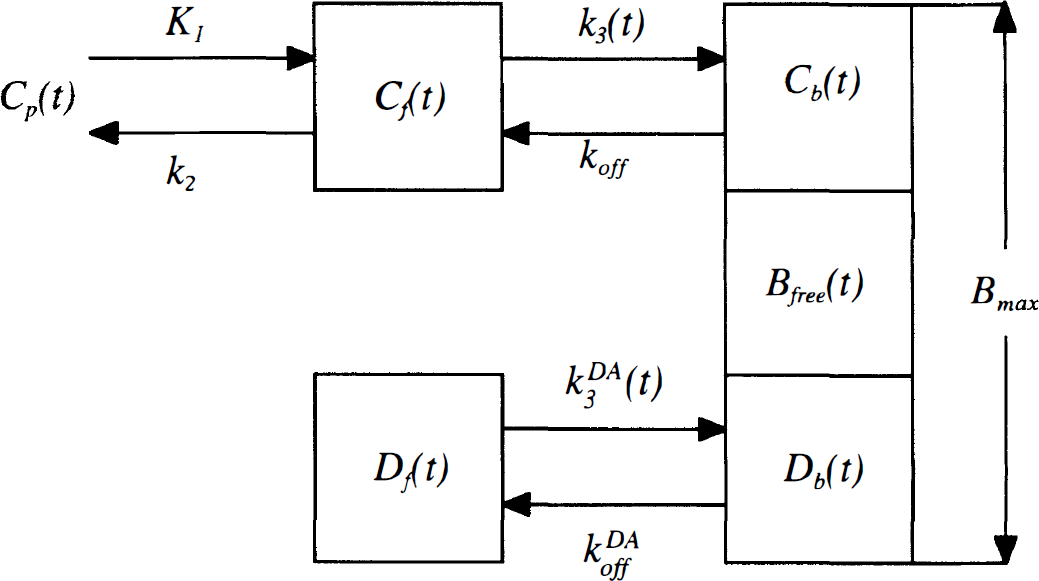
Compartment model for [11C]raclopride that explicitly accounts for dopamine competition. This model has been extended from that presented in Farde et al. (1989) and includes additional compartments for free (Df) and bound (Db) dopamine. The total receptor concentration Bmax is the sum of bound raclopride Cb(t), bound dopamine Db(t), and free receptor Bfree(t). The binding rate of [11C]raclopride, k3(t), which is proportional to Bfree(t), thus depends on the level of bound dopamine. In these studies, the binding rate is time-dependent because of the time-varying dopamine concentration after amphetamine. See Table 1 for definition of terms.
Definitions
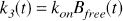
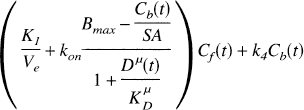
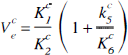
The conventional model for [11C]raclopride includes compartments for free (Cf) and specifically bound (Cb) tracer in tissue. The plasma–tissue exchange constants across the blood-brain barrier are K1 and k2, and Ve is the free volume of distribution (K1/k2). The exchange between free and bound tracer is described by the binding rate k3 and the dissociation rate k4. The general form of the model differential equation is
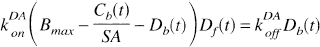
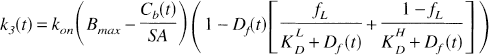
The binding rate is proportional to the free receptor concentration,
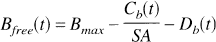
where kon is the bimolecular association rate constant for raclopride, and Bfree is the free receptor concentration. The total D2 receptor concentration Bmax is equal to the sum of bound raclopride, bound dopamine (Db), and free receptor. The free receptor pool can thus be expressed as follows:
where SA is specific activity of [11C]raclopride.
For high-specific activity studies, the receptor occupancy of raclopride is negligible. Therefore, the free receptor concentration and the binding rate of raclopride are assumed to be constant. However, in these experiments, amphetamine causes both the free and bound dopamine concentrations to change; therefore, the free receptor concentration and the binding rate are time-dependent. To account for the time-dependent binding rate, dopamine must be included in the model.
We extend the conventional model by including additional compartments for free (Df) and bound (Db) dopamine. We ignore the binding of amphetamine to D2 receptors, which has been found to be negligible (Innis et al., 1992). The following assumptions regarding dopamine D2 receptor binding were made: (1) dopamine receptor binding kinetics are sufficiently fast that bound dopamine is always in equilibrium with free synaptic dopamine, regardless of how rapidly free dopamine changes; thus, we do not add an additional differential equation to account for the binding of dopamine; and (2) high- and low-affinity binding sites for dopamine are not included; that is, dopamine is assumed to bind to D2 receptors with a single affinity. The effects of violations of these assumptions are presented in the discussion.
With these assumptions, an equilibrium equation can be derived to relate free and bound dopamine,
where
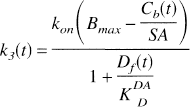
where
To apply the model, the ratio
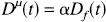
In Eq. 6, α is a constant scale factor. We define a new parameter

When α is equal to 1, which corresponds to perfect measurement of Df(t), then
Upon substitution of Eqs. 5–7, the model equations (Eq. 1) can be expressed in terms of the microdialysis data Dμ(t) as follows:
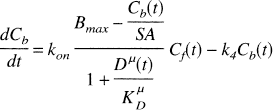
There is no analytical solution to Eqs. 8 and 9 in the presence of an arbitrary time-varying dopamine concentration; therefore, we used a fourth-order Runge-Kutta routine to solve the differential equations. The final tissue model also included a term for intravascular radioactivity,
METHODS
Animal studies
A complete description of the PET methodology used here is given by Carson et al. (1997). Adult male rhesus monkeys (n = 3, 7 to 11 kg) were initially sedated with ketamine (10 mg/kg intramuscularly) then anesthetized for the remainder of the study with isoflurane (1% to 2%, to effect). Each animal was studied twice on the same day with approximately 3 hours separating the start of each study. Bolus-plus-infusion delivery of [11C]raclopride was used with a specific activity of 161 to 710 mCi/μmol and injected dose of 2.0 to 6.0 mCi. The bolus volume was equal to 60 minutes of constant infusion; therefore, 40% of the total volume was delivered as a bolus for a 90-minute study. The bolus volume was given over 1 minute. Amphetamine was given as an intravenous bolus, usually at 40 minutes, with doses of 0.2 mg/kg (study 1) and 0.4 mg/kg (study 2), respectively.
The PET studies were acquired using a Scanditronix PC2048-15B scanner (Uppsala, Sweden), which acquires 15 slices separated by 6.5 mm with reconstructed resolution of 6 to 7 mm full width at half maximum. A stereotactic head holder was used that positioned the head so as to obtain coronal slices. Scan frames acquired were 6 × 30 seconds, 3 × 60 seconds, 2 × 120 seconds, 4 × 300 seconds, 8 × 150 seconds, and 8 × 300 seconds for a total study duration of 90 minutes. Arterial blood samples (0.5 to 1.0 mL) were collected throughout the study, and plasma was counted on a sodium iodide gamma counter calibrated so that counts per minute were converted to nanocuries per cubic centimeter. Blood samples collected at 5, 12, 25, 40, 60, and 90 minutes were analyzed for radioactive metabolites (de Bartolomeis, 1996). The unmetabolized fractions were fit to a model (Carson et al., 1997) based on the method of Huang et al. (1991) to estimate the continuous plasma raclopride time course.
Irregular regions of interest were drawn on three adjacent slices for both the left and right striatum, and on two adjacent slices for the cerebellum. Regions of interest were applied to all scan frames to generate TAC. Final striatum and cerebellum TAC were derived from an area-weighted mean of the individual TAC. Variance in the TAC was estimated (Carson et al., 1993b) and provided weights for the model fits.
Microdialysis
Rhesus monkeys were prepared for in vivo microdialysis at least 3 months before PET scanning, as previously described (Kolachana et al., 1994). The surgical procedure involved a small cranial opening and stereotactic positioning of probe guide holders that were then fixed to the skull using bone cement. Each guide holder features a 4 × 15 array of holes (<1 mm diameter, 1 mm center-to-center distance) that was positioned over an area (6 to 8 mm × 15 to 20 mm) of removed skull through which dialysis probes could be inserted. To determine which holes were most accurately aligned with the left and right caudate, vitamin E–filled silica barrels were placed through individual guide holes, but not into the brain, during magnetic resonance scanning.
On the day of the experiment, microdialysis probes were positioned in the left and right caudate at least 30 minutes before the PET study. The microdialysis outlet tubing was sufficiently long (20 cm) that the dialysate collection vials were outside of the scanner's field of view. Probes were perfused by means of a microinfusion pump (Harvard Apparatus, Model 2400-006, South Natick, MA, U.S.A.) at a flow rate of 1.5 μL/min with artificial cerebrospinal fluid (147 mmol/L Na+, 3 mmol/L K+, 1.3 mmol/L Ca2+, 1.0 mmol/L Mg2+, 155 mmol/L Cl−; buffered with 1.0 mmol/L phosphate, pH 7.3 to 7.4). Microdialysate samples were collected over 10-minute intervals for a total sample volume of 15 μL, and immediately frozen on dry ice. Samples were thawed, and 13 μL of each sample were analyzed for dopamine content using high-performance liquid chromatography with electrochemical detection (Saunders et al., 1994). External dopamine standards (10−8 mol/L) also were analyzed (n = 3, for each study) to generate a calibration factor that was used to convert the high-performance liquid chromatography measurements to units of dopamine concentration (nmol/L).
Utilization of microdialysis data
A microdialysis data set consisted of three to four preamphetamine baseline samples, one dialysate sample that overlapped the amphetamine injection, and three or more additional postamphetamine samples. The amphetamine injection was not aligned in time with the microdialysis samples because of the time delay (∼13 minutes) needed for the dialysate to flow from the probe through the outlet tubing to the collection vial. The long time delay resulted from the length of outlet tubing (∼20 cm) necessary to keep the dialysate collection apparatus outside of the PET scanner's field of view.
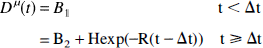
Because the microdialysis samples were collected over 10-minute intervals, the transient peak of the dopamine pulse was not adequately characterized by the data. To derive a continuous curve Dμ(t) from the data, the pulse was modeled as a monoexponential curve (Fig. 2). The microdialysis data were fit to a model with five parameters: the initial baseline B1, the pulse height H, the clearance rate of the pulse R, the start time of the dopamine pulse Δt, and the postamphetamine baseline B2, that is,
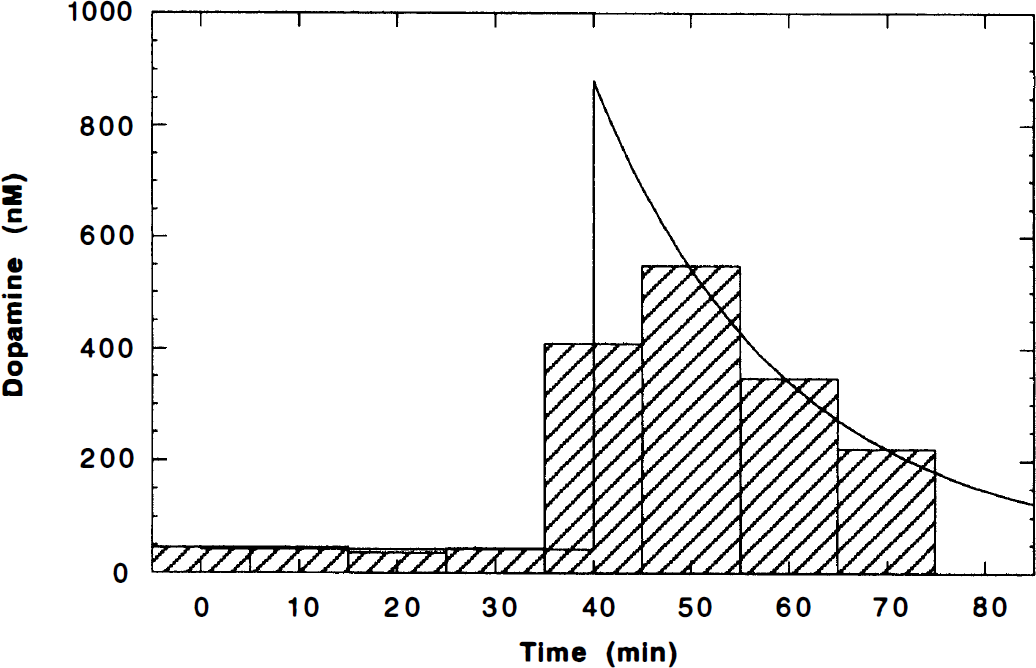
Dopamine microdialysis data. The microdialysis samples were collected over 10-minute intervals and are shown as a bar graph. A continuous dopamine curve was fit to the data by modeling the dopamine pulse as a monoexponential curve Dμ(t) (Eq. 10, solid line). The peak of the curve begins at the time of the amphetamine bolus, usually 40 minutes.
B1 is the endogenous dopamine level in the absence of a stimulus and provides a reference to evaluate the size of the pulse. In measurements taken more than 2 hours after amphetamine, the dopamine concentration did not return to the initial baseline, so the curve was modeled with a second baseline (B2). For the second study of each study pair, B2, was set equal to B1 because there were insufficient postamphetamine data to reliably detect a change in baseline. Since each dialysate sample is an integral over 10 minutes, these data were fit to the integral of the model curve (Eq. 10). This ensured that the fitted curve would conserve the dopamine content measured by microdialysis. For use in modeling the PET data, the fitted curve Dμ(t) was shifted in time so that the dopamine pulse began at the time of amphetamine delivery, typically 40 minutes. Shifting Dμ(t) to begin 1 minute after amphetamine delivery produced little effect on the modeling results.
The microdialysis data underestimate the dopamine concentration in vivo and ideally should be corrected by the in vivo recovery, that is, the ratio of the concentration of dopamine in the collected dialysate to the tissue concentration in vivo. This value is difficult to measure, however, so to approximate this correction, the microdialysis data were corrected by the in vitro recovery. To measure the in vitro recovery, the dialysis probe is placed in a stirred dopamine solution with a known concentration. The in vitro recovery equals the ratio of the dopamine concentration in the collected dialysate to the known concentration and will be greater than the in vivo recovery (see Discussion). The probes used in these experiments have a measured in vitro recovery of 30% to 40%. Here, the microdialysis data Dμ(t) were scaled assuming a fixed in vitro recovery of 30%. Since the microdialysis data enter the model equations (Eqs. 8 and 9) as the ratio
Tracer kinetic modeling
To achieve sufficient statistics over the course of a 90-minute study, we gave large doses of [11C]raclopride: 0.57 ± 0.21 mCi/kg. Given the specific activity at time of injection (200 to 800 Ci/mmol), there was sufficient mass in these doses that specific binding of raclopride could not be ignored, thus the term Cb/SA was not discarded from model Eqs. 8 and 9. As a result, instead of having a single parameter equal to the product of kon and Bmax, these terms must be treated separately. In initial attempts to simultaneously fit both parameters, large coefficients of variation (exceeding 100% in three of six cases) were found. Thus, the model was constrained by fixing kon to 0.015 min−1 (see Discussion).
Six parameters (K1, Ve, Bmax,
The free volume of distribution for the striatum Ve was set equal to
Two studies were performed in each animal on a single day. If there were no physiologic changes between studies, it would ideally be possible to model the data from both studies with a single set of floated parameters. This was tested in combined fits using the five-parameter model. For the two studies in each animal, Ve for each study was fixed to its corresponding
Simulation studies
The study design used here—B/I delivery of [11C]raclopride with amphetamine displacement—has been used to investigate the response to dopamine challenge in schizophrenic patients (Breier et al., 1997). This B/I paradigm allows changes in specific binding to be determined within a single study without blood sampling (Carson et al., 1997). These patient studies were analyzed by calculating the percent change in specific binding. Briefly, the B/I protocol achieves near-equilibrium conditions before amphetamine delivery; the control level of specific binding (SB1) is calculated from SB1 = (CBG − CCER)/CCER, where CBG and CCER are the radioactivity concentrations averaged for basal ganglia and cerebellum, respectively. After amphetamine, the striatal activity clears and a new level of specific binding (SB2) is then estimated from CBG and CCER. The percent reduction in specific binding from preamphetamine to postamphetamine (ΔSB) then is calculated, where ΔSB = 100(SB1 − SB2)/SB1.
Through simulations, we applied the extended model to characterize the relation between changes in specific binding measured in this manner and the underlying dopamine pulse. In particular, the dopamine pulse (Fig. 2) is characterized by its pulse height and clearance rate. Dopamine pulses (Dμ(t)) were simulated with six different pulse heights (167, 333, 500, 667, 833, 1000 nmol/L), and five different clearance rates (0.03, 0.06, 0.09, 0.12, 0.15 min−1). These parameters correspond to the range of dopamine pulses found in these experiments (peak: 74 to 839 nmol/L, rate: 0.03 to 0.13 min−1). Each pulse was used to simulate a [11C]raclopride TAC using a measured plasma input function and the fitted model parameters from one of the PET studies. Specific binding was computed preamphetamine and postamphetamine using scan frames from 20 to 40 minutes and 60 to 90 minutes, respectively. For each time activity curve, ΔSB was calculated, and these values then were correlated with the dopamine pulse height, its clearance rate, or the integral of the dopamine pulse. The integral of each pulse above baseline was computed over 40 minutes.
In addition to increasing synaptic dopamine, amphetamine may induce a change in blood flow that could affect [11C]raclopride TAC (Detre et al., 1990; Daniel et al., 1991; Russo et al., 1991). Using the measured plasma input function and the fitted model parameters from one of the PET studies, a change in blood flow was simulated as a step change in K1 at 40 minutes. Since Ve was held constant, k2 effectively changed as well. The effect of a transient blood flow change also was tested by simulating a step change in flow followed by exponential return to the initial flow rate with a halftime of 14 minutes (mean of DA pulse halftimes). Time–activity curves were generated for K1 changes up to ±25%, and the effects on ΔSB were calculated.
RESULTS
Microdialysis
For five of six amphetamine injections, the microdialysis data were well described by the exponential model (Fig. 2). In one study (with 0.2 mg/kg of amphetamine), the dopamine pulse had a poorly defined peak and was modeled as a polynomial curve. Based on these fitted curves, baseline dopamine was 17 ± 4 nmol/L and 43 ± 14 nmol/L before 0.2 mg/kg and 0.4 mg/kg of amphetamine, respectively. The estimate of baseline dopamine is consistent with a previously reported value of 31 nmol/L in rhesus monkey (Moghaddam et al., 1993). In the three animals, baseline dopamine measured before the 0.4 mg/kg study was 92%, 267%, and 108% larger than baseline dopamine measured before the 0.2 mg/kg study, possibly because of residual amphetamine effects. Dopamine pulses described by an exponential curve had a peak height of 489 ± 302 nmol/L and a clearance rate of 0.06 ± 0.04 min−1 (halftime 14 ± 6 min). To compare the magnitude of dopamine release for different amphetamine doses, the average dopamine concentration was computed over the first 40 minutes after amphetamine, then expressed as a percent of the baseline dopamine concentration in the first study of each pair. For the three animals, dopamine increased by 620%, 1100%, and 96%, respectively, over baseline after 0.2 mg/kg of amphetamine. After 0.4 mg/kg of amphetamine, dopamine increased 1600%, 2500%, and 260%, respectively. Dopamine release after 0.4 mg/kg of amphetamine more than doubled over that after 0.2 mg/kg of amphetamine.
PET Data and modeling
Figure 3 shows typical TAC data for striatum and cerebellum with model fits. Radioactivity in cerebral tissues became nearly constant by 20 to 30 minutes by using a B/I protocol. After amphetamine, activity cleared from the striatum with no change in cerebellum. There was no apparent late increase in striatal activity within the 50-minute period postamphetamine.
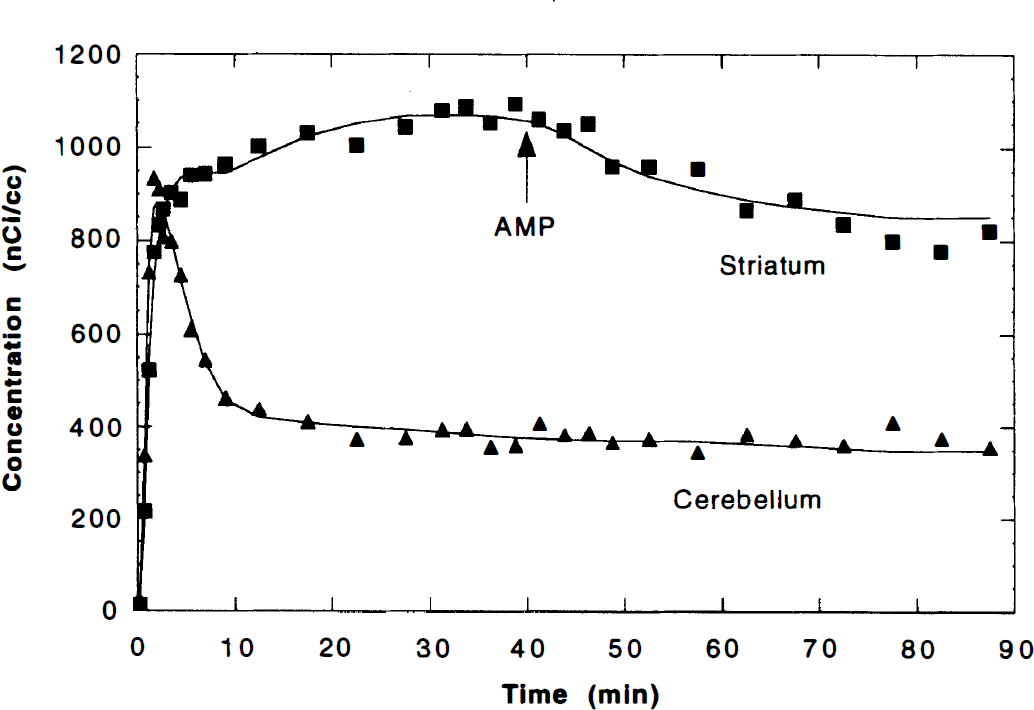
The positron emission tomography data with model fits after bolus-plus-infusion injection of 5.4 mCi of [11C]raclopride. First, the cerebellum time–activity curve (TAC) (▴) was fit to a two compartment, five-parameter model, and the volume of distribution
The striatum data were fit to the six- and five-parameter model, and a typical fitted curve for the five-parameter model is shown in Fig. 3. Parameter values are shown in Table 2. The values obtained using both models were similar; however, the five-parameter model, with Ve fixed from a cerebellar fit, gave smaller standard errors for all parameters, particularly Bmax. In four of six studies, the five-parameter model had a lower Akaike information criterion (Akaike, 1976) than the six-parameter model. Therefore, we chose the five-parameter model for further testing and performance of simulations.
Fitted parameter values
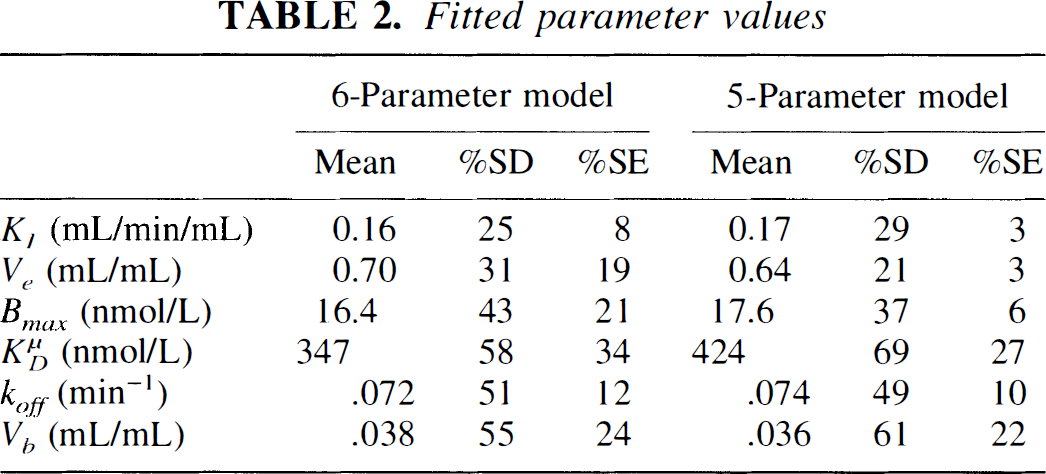
Parameter values obtained from fitting striatal [11C]raclopride TAC to the extended model Eqs. 8 and 9 (see Table 1 for definitions). The 6-parameter model estimated all parameters from a fit of the striatal TAC. For the 5-parameter model, the free volume of distribution in striatum Ve was set equal to that of the cerebellum, as determined from a fit of the cerebellar TAC to a two-compartment model. With Ve fixed, the remaining 5 striatal parameters were then estimated in fits to the extended model. Shown here are the mean values (n = 6) with percent standard deviations (%SD). The column %SE is the average uncertainty (standard error) of each parameter as predicted by the fit. Ve values for the 5-parameter model are obtained from the cerebellum fit.
The new parameter
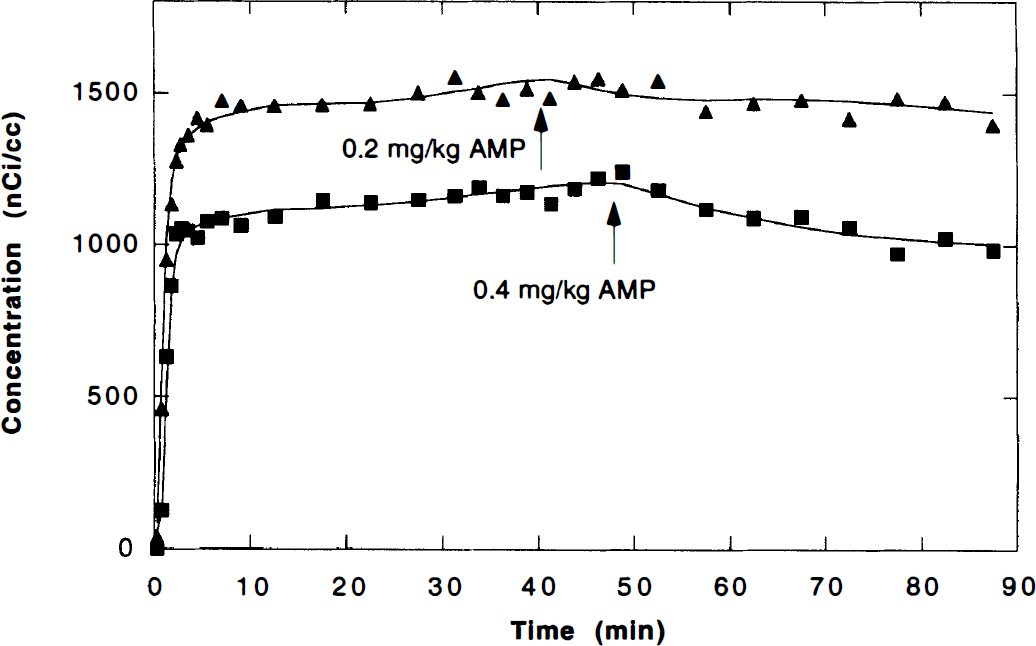
Simultaneous fit of striatal time–activity curves (TAC) from consecutive studies (with 6.0 and 5.6 mCi of [11C]raclopride, respectively) in the same animal. A single set of five parameters was sufficient to model both studies for two of the three animals studied. For the striatal TAC shown in the figure (animal 3), a statistically better fit (F test, P < .001) was achieved by allowing both studies to have their own blood to tissue influx rates (
Simulation studies
In Fig. 5, simulated values of the percent reduction in specific binding ΔSB (calculated from preamphetamine and postamphetamine radioactivity levels) are plotted versus three features of the dopamine pulse: pulse height (5A), clearance rate (5B), and integral (5C). It is found that ΔSB does correlate with both the pulse height (r = 0.63) and the clearance rate (r = 0.69) (plots A and B), but there is considerable scatter. For example, in Fig. 5A, at a given dopamine pulse height there is considerable variation in ΔSB, with the largest ΔSB value corresponding to the smallest dopamine clearance rate. Clearly, the best correlation (r = 0.99) is found between ΔSB and the integral of the dopamine pulse (Fig. 5C). This suggests that changes in specific binding measured in patient studies can be interpreted as linearly proportional to the integral of the dopamine pulse. Notice that
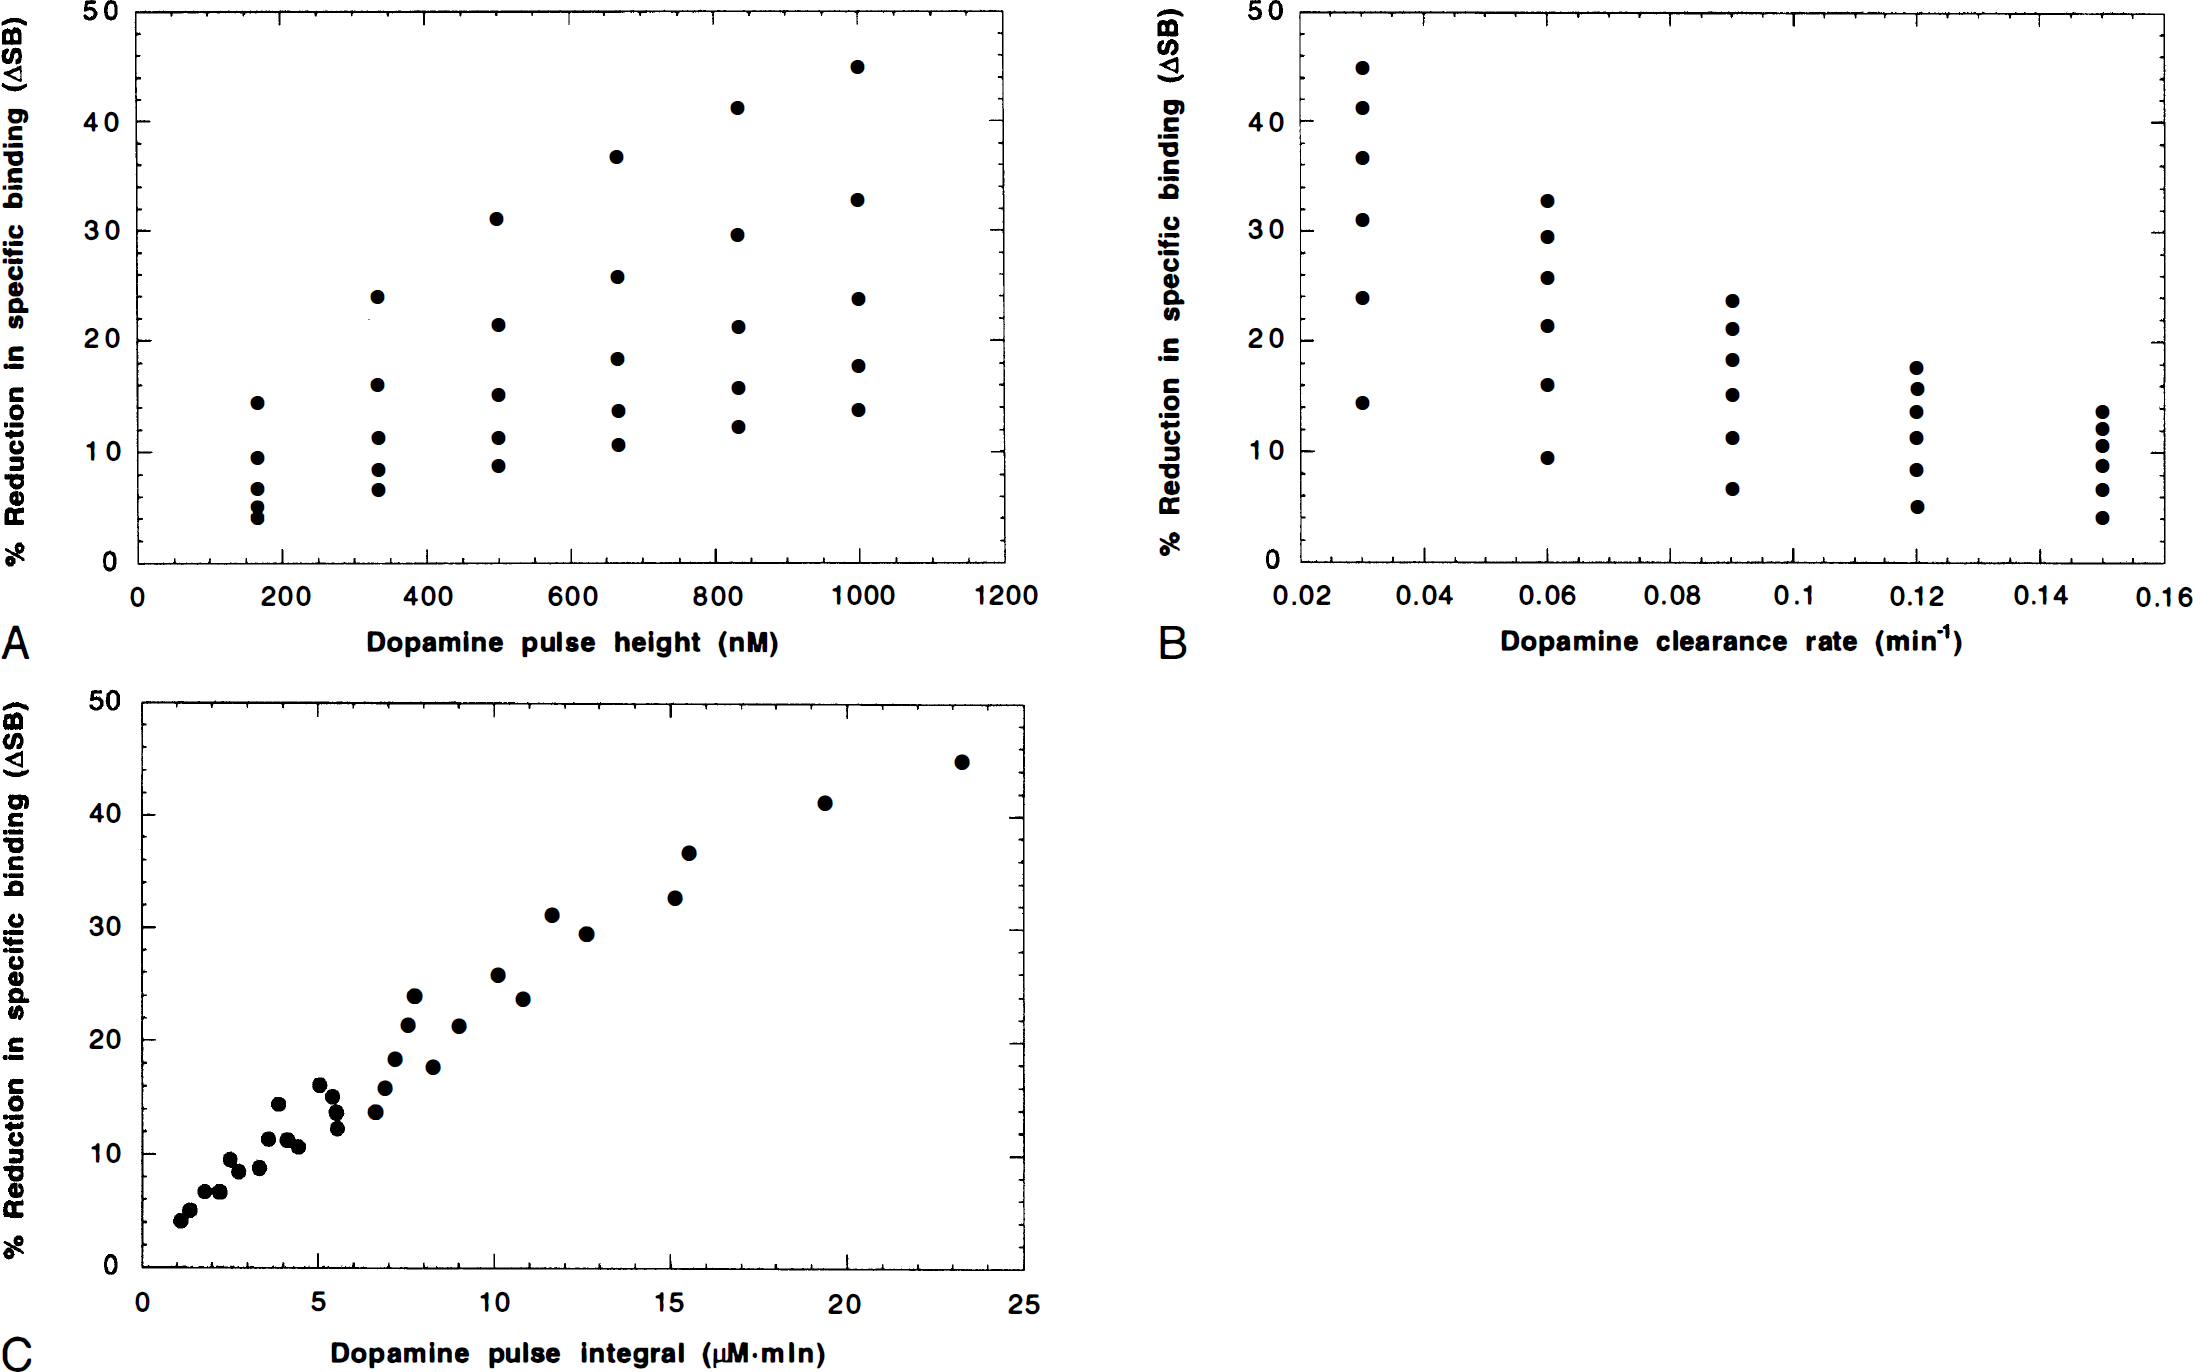
Simulation study results. Correlation of the percent reduction in specific binding (ΔSB) measured in bolus-plus-infusion studies with parameters of the dopamine pulse. A variety of dopamine pulses were simulated (pulse heights 167, 333, 500, 667, 833, 1000; clearance rates 0.03, 0.06, 0.09, 0.12, 0.15 min−1), then using the blood data and fitted parameter values from a positron emission tomography study, striatal time–activity curves were generated and ΔSB was computed. Here, ΔSB is plotted versus three features of the dopamine pulse:
Simulations of changes in blood flow showed a minor effect on specific binding changes. Adding a 25% step increase (decrease) in K1 and k2 at the time of amphetamine administration altered ΔSB by +5.5% (−7.2%). If blood flow exponentially returns to the initial flow rate, a smaller change in ΔSB is observed.
DISCUSSION
We have extended the conventional compartment model for [11C]raclopride (Farde et al., 1989) to include dopamine competition. With a single additional parameter
The parameter
Microdialysis measurements
Extracellular dopamine measured with microdialysis was used in these studies to estimate Df(t), the concentration of dopamine in the vicinity of D2 receptor sites. Since there are both synaptic and extrasynaptic D2 receptor sites (Levey et al., 1993; Sesack et al., 1994; Yung et al., 1995), it is not clear if sampling from the extracellular space provides a good measure of Df(t). In particular, we need to consider the relation between synaptic and extrasynaptic dopamine. Garris et al. (1994) suggests that dopamine uptake by the presynaptic transporter could produce a dopamine concentration gradient between the synapse and extracellular fluid. However, based on a model of the efflux of dopamine from the synapse, they predicted that extracellular dopamine rapidly equilibrates with synaptic dopamine. Thus, even if there is a concentration gradient, it is reasonable to assume that the concentrations of synaptic and extracellular dopamine are linearly proportional. Thus, we approximated the microdialysis data Dμ(t) as being linearly proportional to Df(t).
To accurately estimate the extracellular dopamine concentration, the microdialysis data Dμ(t) should be corrected for the in vivo recovery. To obtain an approximate estimate, Dμ(t) was scaled by the in vitro recovery (see Methods). However, the in vivo recovery is less than the in vitro recovery, because the in vivo recovery is affected by tissue clearance mechanisms such as reuptake and metabolism (Bungay et al., 1990; Morrison et al., 1991). Therefore, even after scaling by the in vitro recovery, Dμ(t) underestimates extracellular dopamine and
An additional concern is that the in vivo recovery may not be constant throughout an experiment. In particular, amphetamine has been found to reduce the in vivo recovery of dopamine by up to 37% (Olson and Justice, 1993), perhaps because of inhibition of the presynaptic dopamine transporter. Cocaine also has been found to lower the in vivo recovery of dopamine (Smith and Justice, 1994). The in vivo recovery depends on the rate that the surrounding tissue replenishes molecules that have been depleted by the dialysis probe. Molecules with a fast turnover rate are replaced more quickly than molecules with a slow turnover rate. Therefore, faster turnover corresponds to higher in vivo recovery (Bungay et al., 1990; Morrison et al., 1991). Blocking presynaptic uptake slows dopamine turnover and reduces in vivo recovery. As a consequence, the microdialysis measurement before amphetamine may have a higher in vivo recovery compared with the postamphetamine measurement, which would result in an underestimation of the size of the dopamine pulse relative to baseline dopamine. This would violate the assumption that Dμ(t) and Df(t) are linearly proportional (Eq. 6). To test the effect of violating this assumption, we simulated a change in the in vivo recovery and determined its effect on the fitted parameter values. For this simulation, a noise-free TAC from the five-parameter model fit was used as data, and fit to the model with a modified dopamine pulse. A 33% decrease in postamphetamine in vivo recovery (which is mathematically equivalent to a 50% increase in the postamphetamine dopamine pulse), produced a 51% increase in
Even if we could accurately correct for in vivo recovery, quantification of the dopamine pulse still may be problematic. Consider that after 0.4 mg/kg of amphetamine, the peak dopamine concentration in the three animals was 74, 672, and 839 nmol/L, respectively. This large range most likely results from differences in probe positioning, that is, a larger dopamine signal may-indicate that the dialysis probe was more optimally located among dopamine releasing sites during the experiment.
Model assumptions
Equation 12 replaces Eq. 5 and was used to derive differential equations analogous to Eqs. 8 and 9.
Simulations were performed to determine how the presence of two affinity states affects parameter values. A wide range of values have been determined experimentally for
Inferences from the model
Further simulations were performed to test if the values of koff, Bmax, or the baseline dopamine level also could affect ΔSB. A 20% increase (decrease) in koff changed ΔSB by +6.6% (−12.1%). A faster koff causes raclopride to clear more rapidly in response to a dopamine pulse, and therefore leads to a greater change in specific binding. A ±20% change in Bmax had a negligible effect on ΔSB; thus, dopamine displaces a similar fraction of specifically bound raclopride, regardless of changes in Bmax. The baseline dopamine level also had little effect on ΔSB unless some of the receptors were in the high-affinity state. In the case of two affinity states with
The peak occupancy of D2 receptors by dopamine after amphetamine can be similarly estimated based on the peak of the dopamine curve (B2 + H; Eq. 10), and is given by
To estimate when the radioactivity concentration after amphetamine would approach the preamphetamine equilibrium value, TAC were simulated using an input function that remained constant beyond 40 minutes. With no dopamine pulse, the simulated striatal radioactivity value at 40 minutes was within 0.5% of the true equilibrium value. Time–activity curves were then simulated with a range of dopamine pulses (pulse height: 333 to 1000 nmol/L; clearance rate: 0.025 to 0.1 min−1). All of these TAC reached their minimum value at about 70 minutes, and from the minimum had returned less than 20% to the equilibrium value by 90 minutes. This is consistent with not observing an increase in striatal activity toward the end of these studies because of noise. On average, the TAC returned halfway (50%) to the equilibrium value by 110 minutes, with slower clearance rates of dopamine corresponding to longer return times (the magnitude of the dopamine pulse had no effect on return time). A doubling of baseline dopamine postamphetamine, as was typically found in these studies, further delayed the 50% return time to 120 minutes. Thus, if these studies were extended to 120 minutes, the model predicts that the striatal TAC would return partially to the original equilibrium level.
CONCLUSION
Recently, there has been great interest in in vivo imaging studies of receptor systems using the competition of radioligands with endogenous neurotransmitter. However, interpretation of these studies is complex because of the combined effects of tracer and neurotransmitter kinetics. Thus, it is helpful in interpreting patient studies to have a model that can predict how various physiologic parameters can affect a given measurement. Here, we have extended the [11C]raclopride model to include dopamine competition. The extended model was able to describe the striatal TAC in B/I studies with amphetamine challenge. It also permitted a useful interpretation of changes in specific binding measured with the B/I protocol (ΔSB). In particular, the model predicts that ΔSB is proportional to the integral of the amphetamine-induced dopamine pulse. Similar modeling studies are required for other neurotransmitter systems to determine if this result is generally applicable. Use of these modeling approaches also can be helpful in elucidating in vivo neurotransmitter information (