
Abstract
Oxidative stress and excitotoxicity have been implicated in selective striatal vulnerability caused by the mitochondrial toxin, 3-nitropropionic acid (3-NP), which may simulate Huntington's disease in animals and humans. The detailed mechanism of the role of superoxide in striatal vulnerability induced by 3-NP is still unknown. The authors investigated oxidative cellular injury and DNA fragmentation after systemic 3-NP injection in wild-type (Wt) mice and mutant mice with a deficiency in manganese superoxide dismutase (MnSOD; Sod2 −/+). Furthermore, they investigated the effects of decortication after 3-NP treatment in Sod2 −/+ mice, and copper/zinc SOD (CuZnSOD) treatment in recently developed Sod2 −/+ mice that overexpress CuZnSOD (SOD1 +/− / Sod2 −/+ mice). Oxidized hydroethidine, 8-hydroxyguanosine immunoreactivity, and nitrotyrosine immunoreactivity were increased in the Sod2 −/+ mice compared with the Wt mice after 3-NP treatment (P < 0.001). Decortication completely abolished oxidative striatal damage after 3-NP treatment in the Sod2 −/+ mice. Increased CuZnSOD attenuated DNA fragmentation and striatal lesion volume after 3-NP treatment in the Sod2 −/+ mice (P < 0.001). These data suggest that production of superoxide may be a critical step to excitotoxicity and subsequent DNA fragmentation in selective striatal vulnerability after 3-NP treatment.
Mitochondrial dysfunction, excitotoxicity, and oxidative stress are interacting processes in the pathogenesis of neurodegenerative diseases such as Huntington's disease (HD), Parkinson's disease, amyotrophic lateral sclerosis, and Alzheimer's disease (Albin and Greenamyre, 1992; Beal, 1992, 2000). There is evidence of a close relation between oxidative stress (superoxide anion, in particular) and excitotoxicity in neuronal cell death induced by NMDA or kainic acid, which was attenuated by CuZnSOD (Schulz et al., 1995; Kondo et al., 1997). It has also been reported that NMDA-receptor activation leads to superoxide production in cultured cerebellar neurons (Dykens, 1994).
3-Nitropropionic acid, an irreversible inhibitor of mitochondrial complex II (succinate dehydrogenase), is known to produce selective striatal damage and clinical features of HD in humans and animals (Coles et al., 1979; Ludolph et al., 1991; Brouillet et al., 1995). Previous reports show that selective striatal lesions induced by 3-NP could be produced by secondary excitotoxicity (Beal et al., 1993; Schulz et al., 1996; Lee et al., 2000), and that oxidative stress plays a substantial role in the neurotoxicity caused by 3-NP (Beal et al., 1995; Schulz et al., 1996; Kim et al., 2000a), suggesting that cooperative pathways of excitotoxicity and oxidative stress may be involved in selective striatal vulnerability caused by 3-NP. Moreover, other reports suggest that the form of excitotoxic neuronal cell death induced by 3-NP or HD involves both apoptosis and necrosis (Pang and Geddes, 1997; Sato et al., 1997; Keller et al., 1998a).
Overexpression of the cytosolic antioxidant, CuZnSOD (or SOD1), plays a protective role in oxidative striatal lesions after 3-NP treatment (Beal et al., 1995). A deficiency in another mitochondrial antioxidant, manganese SOD (MnSOD or SOD2), increases striatal lesions after 3-NP treatment (Andreassen et al., 2001). Our studies using mutant mice with an MnSOD deficiency (Sod2 −/+) showed that reduced MnSOD activity exacerbates glutamate toxicity in cortical cell cultures (Li et al., 1998), and that overproduction of superoxide anion radical (O2•−) increases infarction volume and triggers an apoptotic pathway after permanent focal cerebral ischemia (Murakami et al., 1998; Fujimura et al., 1999) or transient cerebral ischemia (Kim et al., 2002), suggesting that O2•− overproduced from mitochondria may induce excitotoxic cell death. The detailed mechanism of O2•−, however, has not been clearly determined in the selective striatal vulnerability after 3-NP treatment. To clarify this issue, we investigated O2•− production, oxidative cellular injury, DNA fragmentation, and subsequent striatal damage after 3-NP treatment in both wild-type (Wt) and Sod2 −/+ mice, and the interaction between excitotoxicity and O2•− production using decorticated Sod2 −/+ mice, which removed the corticostriatal glutamate input (Kim et al., 2000a). We further confirmed the involvement of O2•− in the preferential striatal damage induced by 3-NP using recently developed Sod2 −/+ mice that overexpress CuZnSOD (SOD1 +/− / Sod2 −/+) (Copin et al., 2000).
MATERIALS AND METHODS
Preparation of 3-nitropropionic acid and animals
3-Nitropropionic acid (Aldrich Chemical Co., Milwaukee, WI, U.S.A.) was dissolved in saline to a concentration of 25 mg/mL (pH 7.4) and passed through a 0.2-μ filter to remove any bacterial contamination. This solution was administered by intraperitoneal injection twice daily for 5 days at a dose of 50 mg/kg. Twenty-four hours after the last injection, the animals were anesthetized with xylazine (4 mg/kg) and chloral hydrate (350 mg/kg) and decapitated. The Sod2 gene knockout mutants (heterozygous) with a CD1 background were backcrossed with CD1 mice for at least 10 generations, and littermate Wt mice with the identical genetic background (3-month-old males, 35 to 40 g) were subjected to each experiment (Li et al., 1998). Sod2 genotypes were determined on tail DNA obtained by proteinase K digestion followed by polymerase chain reaction amplification of mutant and normal fragments of exon 3 of the MnSOD gene using three primers, one shared (5′-CGAGGGGCATCTAGTGGAGAAG-3′), one for the mutant allele (5′-CACACATCGGGAAAATGGTTTG-3′), and one for the normal allele (5′-TTAGGGCTCAGGTTTGTCCAGAA-3′) as previously described (Li et al., 1998). There were no differences in morphologic, physiologic, or biochemical changes, including anatomy of the cerebral vasculature, and cytochrome c oxidase, succinate dehydrogenase, or aconitase activity between the Sod2 −/+ mice and the Wt littermates. There were no compensatory increases in CuZnSOD activity in the Sod2 heterozygous mice despite the fact that only a 50% level of MnSOD activity was observed in various organs (Chan, 1996; Chan et al., 1996). MnSOD heterozygous knockout mice with overexpressed CuZnSOD (SOD1 +/−/Sod2 −/+ mice) were obtained by backcrossing between Sod2 heterozygous female mutant mice and Sod1 heterozygous transgenic male mice (Copin et al., 2000). Heterozygous Sod1 transgenic mice carrying human Sod1 genes with a threefold increase in CuZnSOD were derived from the founder stock as previously described (Epstein et al., 1987). CuZnSOD genotypes were determined by nondenaturing gel electrophoresis of blood samples to reveal the presence of human CuZnSOD as previously described (Chan et al., 1998). In a preevaluating study of the Sod2 −/+ mice with overexpressed CuZnSOD, phenotype and enzyme activity were determined to be compatible with the data known for each genotype (Copin et al., 2000). To remove the corticostriatal glutamate input from the striatum, decortication was performed in the Sod2 −/+ mice using a previously described method (Kim et al., 2000a). The mice were anesthetized with chloral hydrate (350 mg/kg) and xylazine (4 mg/kg) and were fixed in a stereotaxic frame. The scalp was incised on the midline and the skull was exposed and carefully removed with a dental drill under surgical microscopy. The dorsolateral aspects of the left frontoparietal lobe were removed by suction down to the white matter. The decorticated mice were kept for 1 month before being used in further experiments, to allow the extracellular glutamate pool to decrease. All procedures were in accordance with the National Institutes of Health Guide for the Care and Use of Laboratory Animals and were approved by Stanford University's Administrative Panel on Laboratory Animal Care.
In situ detection of O2•− production
Production of O2•− in the striatum after injection of 3-NP was investigated using a previously reported method with modification (Chan et al., 1998; Murakami et al., 1998; Bruce-Keller et al., 1999; Fujimura et al., 1999; Kim et al., 2000a, b, 2001a, b, 2002; Kim and Chan, 2001). Previous reports provide evidence of hydroethidine-specific oxidation by O2•−, where hydroethidine was oxidized to fluorescent red ethidium by O2•− (Rothe and Valet, 1989), or where hydroethidine was selectively oxidized to ethidium by O2•−, but not by O2, H2O2, or peroxynitrite (Bindokas et al., 1996), or where hydroethidine was rapidly oxidized to ethidium by O2•−, whereas oxidation by O2 or H2O2 was much slower (Benov et al., 1998). After treatment with 3-NP for 2 days, the animals were anesthetized as described herein, and then hydroethidine (200 μ stock solution of hydroethidine [Molecular Probes, Eugene, OR, U.S.A.], 100 mg/mL in dimethyl sulfoxide, diluted to 1 mg/mL with phosphate-buffered saline [PBS] and sonicated in a water bath) was administered intravenously through the jugular vein using a surgical microscope. Two hours after the hydroethidine injection, the animals were killed by transcardial perfusion with 200 mL of 10 U/mL heparin in saline and 200 mL of 3.7% formaldehyde in PBS. After postfixation overnight, the brains were sectioned 50 μ thick on a vibratome at the level of the midstriatum and were placed on a glass slide. The brain sections were incubated with 2.5 × 10⁻³ mg/mL Hoechst 33258 (Molecular Probes) in PBS for 15 minutes in a dark chamber, and then they were rinsed in distilled H2O and mounted with Aquamount (Shandon, Pittsburgh, PA, U.S.A.). These sections were observed with a fluorescent light microscope (HBO; Zeiss, Thornwood, NY, U.S.A.). Photomicrographs of the fluorescent microscopy were taken with a digital camera system (AxioVision; Zeiss) and with single and double exposure to oxidized hydroethidine and Hoechst 33258 in the striatum of each group. The intensity and expression patterns of the oxidized hydroethidine were observed and compared in the striatum between the groups. To quantify O2•− production, cells with oxidized hydroethidine that extended to the perinuclear area (before treatment) or the cytosol (after 3-NP treatment) were counted and averaged in the entire field after randomly taking them from four different sites under high magnification (×400) using an image analysis program (AxioVision; Zeiss), and the percentage of these cells to the total cells stained with Hoechst nuclear staining was calculated.
Detection of oxidative DNA damage
To further confirm the involvement of oxidative stress in the lesioned striatum after 3-NP treatment, we evaluated DNA oxidation using a monoclonal antibody against 8-hydroxyguanosine as previously reported, with modification (Kim et al., 2001a). The frozen sections, cut to 20 μ, were mounted on slides and dried overnight at 45°C on a slide warmer. Samples were immersed for 10 minutes in 70% ethanol at −20°C and then washed in PBS. In optional steps, some samples were treated with DNase-free RNase in buffer (50 mmol/L Tris-HCl, 10 mmol/L MgCl2), or with RNase-free DNase in buffer, or DNase and RNase in buffer, or buffer only, for 1 hour at 37°C. Samples were denatured in 4N HCl for 7 minutes and neutralized by soaking in 50 mmol/L Tris-base. After washing, the primary antibody was applied. Samples were incubated with mouse monoclonal antibody for 8-hydroxyguanosine (1:300; QED Bioscience, San Diego, CA, U.S.A.) after biotinylation and a blocking procedure, which followed the manufacturer's protocol, to avoid cross-reaction between the secondary antibody and mouse immunoglobulin G in the tissue (DAKO ARK; Dako, Carpinteria, CA, U.S.A.). After development with diaminobenzidine (DAB), the sections were mounted on slides and counterstained with methyl green solution. For comparison of 8-hydroxyguanosine density on the RNase-or DNase-treated samples or both, counterstaining was omitted and they were expressed as a positive number of cells per 5 × 5-mm grid under a ×400 magnification field.
Immunohistochemistry of nitrotyrosine
After 3-NP treatment for 5 days, the anesthetized animals were killed by transcardial perfusion with 200 mL of 10 U/mL heparin in saline and 200 mL of 3.7% formaldehyde in PBS. After postfixation in 3.7% formaldehyde, the brains were sectioned at 50 μ on a vibratome and processed for immunohistochemistry for nitrotyrosine using a previously reported procedure with modification (Ayata et al., 1997). The sections were incubated with mouse monoclonal antibody for nitrotyrosine (1:100; Upstate Biotechnology, Lake Placid, NY, U.S.A.) after biotinylation and a blocking procedure, which followed the manufacturer's protocol, to avoid cross-reaction between the secondary antibody and mouse immunoglobulin G in the tissue (DAKO ARK). After development with DAB, the sections were mounted on slides and counterstained with methyl green solution. As a negative control, the sections were incubated without the primary antibody or preabsorption process using nitrotyrosine-blocking peptides to confirm the specificity of the antibodies, following a previously reported method (Estevez et al., 1998). To evaluate the relation between nitrotyrosine formation and superoxide anion, we performed double staining of oxidized hydroethidine and nitrotyrosine immunohistochemistry after 3-NP treatment for 5 days using a previously reported method with modification (Kim and Chan, 2001). Oxidized hydroethidine in situ was performed as described earlier and nitrotyrosine immunohistochemistry was also performed as described earlier until primary antibody incubation; then the samples were washed with PBS with 0.3% Triton X-100, and fluorescent avidin DCS (50 mg/mL; Vector Laboratories, Burlingame, CA, U.S.A.) was applied. The sections were rinsed in distilled H2O and mounted with Aquamount (Shandon). These sections were observed with a fluorescent light microscope (HBO, Zeiss), and photomicrographs of the fluorescent microscopy were taken in the striatum with double exposure to oxidized hydroethidine and fluorescent staining of nitrotyrosine.
Histologic evaluation and in situ detection of DNA-fragmented cells
After euthanasia, the brains were removed and sectioned at 20-μ intervals on a cryostat. To measure the lesion volume, frozen brain sections were taken at intervals of 500 μ and stained with cresyl violet. The striatum and the unstained area were measured in each section using Multi-Analyst software (Bio-Rad, Hercules, CA, U.S.A.) after scanning a sample slide with a GS-700 imaging densitometer (Bio-Rad). The striatum and lesion volumes were calculated by multiplying each measured area by the distance. Adjacent sections from the middle of the striatum were identified and used for the TUNEL method to detect DNA fragmentation in situ. The procedure was carried out by a previously described method (Kim et al., 2000a). The sections were air dried and fixed for 30 minutes in 3.7% formaldehyde in 0.1 mol/L PBS. The slides were incubated in 0.3% Triton X-100 in PBS for 30 minutes. After rinsing the sections in PBS, they were equilibrated for 15 minutes in TdT buffer containing 2.5 mmol/L cobalt chloride and 200 mmol/L potassium cacodylate (Roche Diagnostics, Indianapolis, IN, U.S.A.). The labeling reaction was performed at 37°C for 1 hour with TdT (300 U/mL; Gibco BRL, Gaithersburg, MD, U.S.A.) and 40 μmol/L of biotinylated 14-deoxyadenosine triphosphate (Gibco BRL) in TdT buffer. The sections were washed twice for 15 minutes in a PBS solution containing 150 mmol/L sodium chloride, 15 mmol/L sodium citrate, and 2% bovine serum albumin (pH 7.4). Thereafter, the sections were incubated with a complex of avidin and biotinylated horseradish peroxidase (Vectastain Elite ABC Kit, Vector) for 30 minutes. The samples were then washed with 0.175 mol/L sodium acetate, and TUNEL labeling was visualized using diaminobenzidine (0.25 g/L) and nickel chloride (10 g/L). The sections were dehydrated in an ascending ethanol series, immersed in xylene and coverslipped with Permount (Fisher Scientific, Pittsburgh, PA, U.S.A.). Slides were observed with either bright-field or dark-field phase-contrast microscopy (Diaphot-TMD; Nikon, Tokyo, Japan). In the latter, a yellow filter was used for detection of fluorescent isothiocyanate, without excitation following previous methods (Kim et al., 2000a).
DNA extraction and gel electrophoresis
Thirty milligrams wet weight of the lesioned or control striatum were taken 24 hours after treatment with 3-NP or normal saline for 5 days, and samples were incubated overnight in 0.6 mL of lysis buffer (0.5% sodium dodecyl sulfate, 10 mmol/L Tris-HCl, and 0.1 mol/L EDTA) with 0.6 mg of proteinase K (Roche Diagnostics) at 55°C. The DNA was extracted with equal volumes of phenol and phenol-chloroform-isoamyl alcohol (25:24:1) and precipitated overnight in 0.2 mol/L sodium chloride in 100% ethanol at 80°C. The DNA was washed twice with 75% ethanol, air dried, and resuspended in DNase-free water (Sigma, St. Louis, MO, U.S.A.). The DNA concentration was measured using TO-PRO-1 dye (Molecular Probes). Gel electrophoresis for detecting DNA laddering was performed according to the manufacturer's instructions (Trevigen, Gaithersburg, MD, U.S.A.). Before electrophoresis, 1 μ of DNA was incubated with 50 μ/mL DNase-free RNase (Roche Diagnostics) for 30 minutes at 37°C. Then the samples were reacted with Klenow enzyme (Trevigen) and dNTP (Trevigen) in 1× Klenow buffer (Trevigen) for 10 minutes at room temperature. Samples were mixed with a loading buffer and subjected to electrophoresis on a 1.5% agarose gel. Then the gel was washed with 0.25 mol/L HCl, 0.4 mol/L NaOH, or 0.8 mol/L NaCl, and 0.5 mol/L Tris buffer, pH 7.5. DNA was transferred to a nylon membrane overnight in 10× saline—sodium citrate. The membrane was first blocked by 5% powdered milk (Bio-Rad) in PBS for 30 minutes and incubated with streptavidin-horseradish peroxidase conjugate (Trevigen) for 30 minutes. Finally, the bands were visualized by the chemiluminescence method using PeroxyGlow (Trevigen), and the films were exposed to x-ray film. The bands of both genomic DNA and 200 bp ladder were scanned by a GS-700 imaging densitometer (Bio-Rad) and were analyzed using Multi-Analyst software (Bio-Rad).
Quantitation and statistical analysis
A blinded observer counted the number of TUNEL-positive cells in ×400 magnification of a light-field microgram. The positive cells were carefully determined using previously reported criteria (Kim et al., 2000a; Kim and Chan, 2001). TUNEL-labeled cells were quantified with a light microscope. They were counted in the middle and lateral parts of both midstriatum with high-powered magnification (×400) and averaged with each counted number in four parts. The number of TUNEL-labeled cells was expressed as per millimeter squared in each experiment. The lesion volume percent was calculated by lesion volume to striatal volume ×100 to remove any edematous effects. 8-Hydroxyguanosine- or nitrotyrosine-positive cells were counted and quantified and were expressed as a percentage of 8-hydroxyguanosine—positive cells per total cells. Data are expressed as mean ± SD. Statistical comparisons among multiple groups were made using analysis of variance followed by Fisher's post hoc protected least-significant difference test, whereas comparisons between two groups were performed using the unpaired t test (StatView 4.5; SAS Institute, Cary, NC, U.S.A.).
RESULTS
Detection of O2•− in the striatum using hydroethidine oxidation
Production of O2•− was determined using hydroethidine in situ detection before or after 3-NP treatment for 2 days. Oxidized hydroethidine signals, as an indication of mitochondrial production of O2•−, were visible as small red particles. Before 3-NP treatment, oxidized hydroethidine signals, as a basal level of O2•−, were barely detected in the Wt mice (Fig. 1A), and normal intact cells without oxidized hydroethidine signals were shown under a high magnification field (Fig. 1A, inset). Under low magnification, slightly oxidized hydroethidine signals were diffusely distributed in the striatum of the Sod2 −/+ mice (Fig. 1B) and were expressed in the perinuclear area using Hoechst and ethidium double exposure (Fig. 1B, inset). After 3-NP treatment for 2 days, oxidized hydroethidine signals were widely detected in the striatum, particularly in the lateral part (Figs. 1C and 1D, arrowheads), and were more intense and frequently identified in the Sod2 −/+ mice compared with the Wt mice, under low magnification. Overproduced oxidized hydroethidine extended into the cytosol and was detected more in the Sod2 −/+ mice than in the Wt mice using double exposure in both oxidized hydroethidine and Hoechst staining (Figs. 1E and 1F). Oxidized hydroethidine signals extended into the cytosol and were clearly seen under high magnification (Fig. 1F, inset). Next, we quantified and compared the basal level of O2•− before 3-NP treatment and overproduction of O2•− after 3-NP treatment in the Wt and Sod2 −/+ mice. Before the treatment, cells with perinuclear oxidized hydroethidine signals were detected significantly more often in the Sod2 −/+ mice than in the Wt mice (Fig. 1G). After treatment, the cells with oxidized hydroethidine signals that extended into the cytosol were significantly increased in the Sod2 −/+ mice compared with the Wt mice (Fig. 1H).
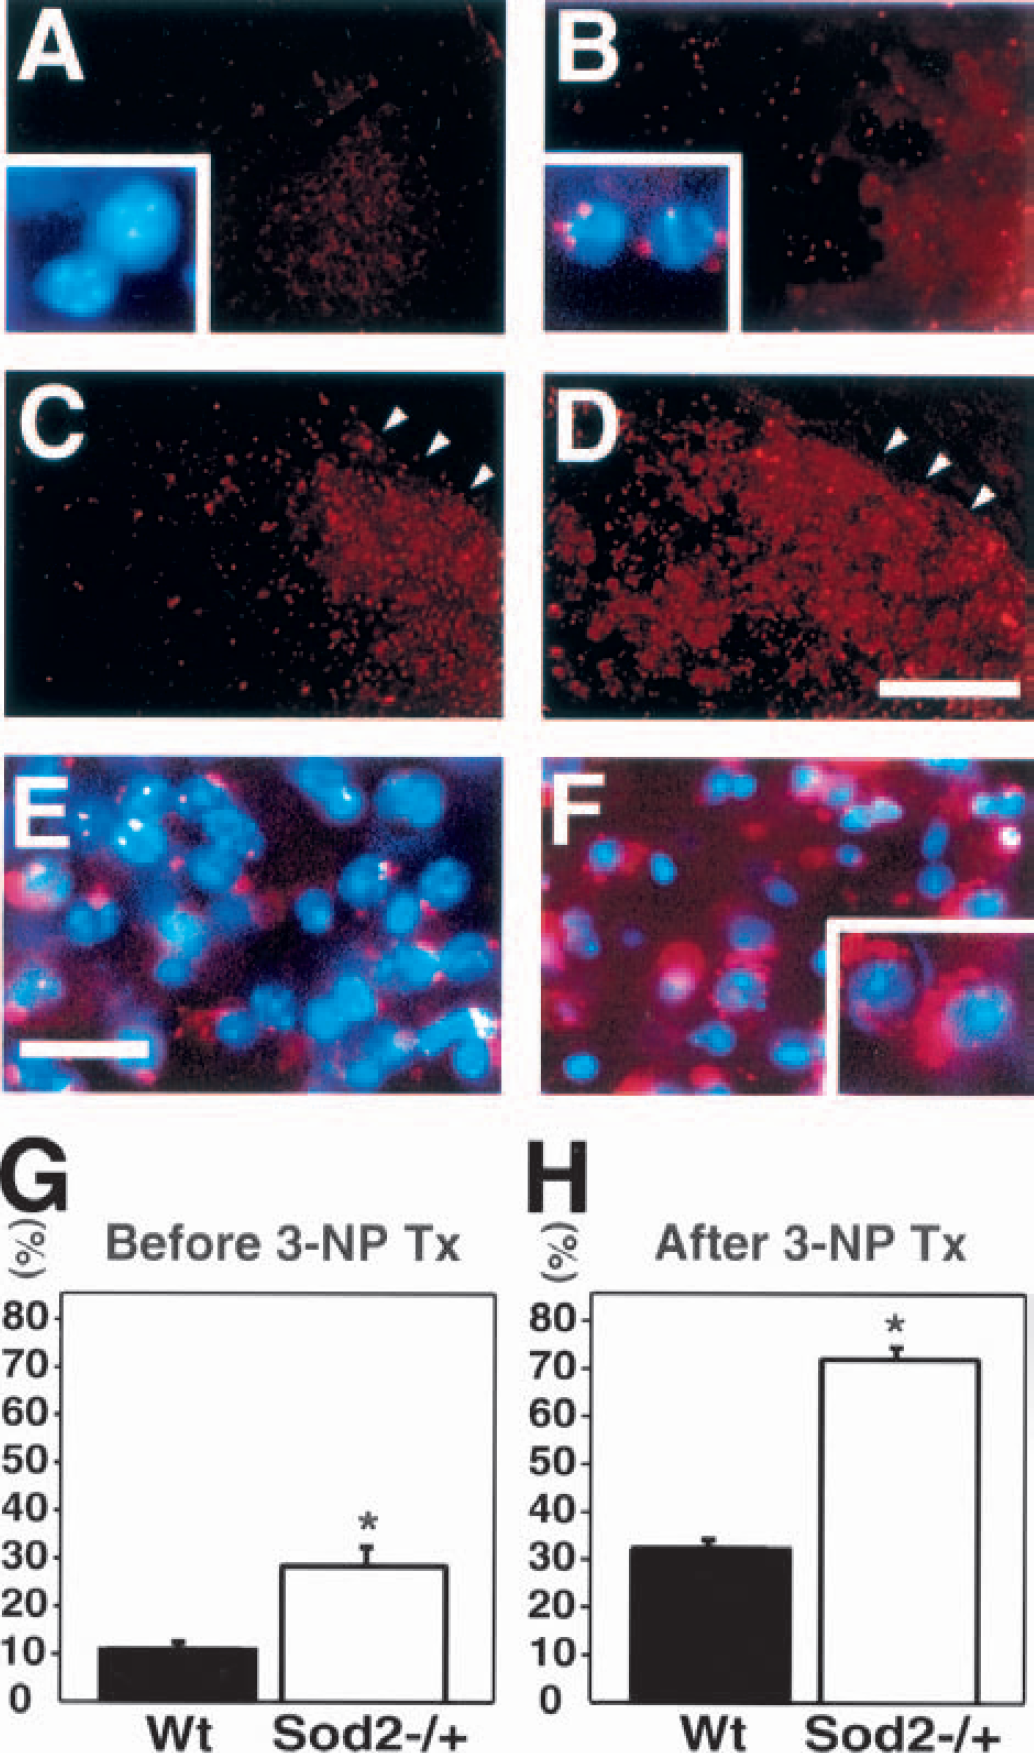
Representative findings showing increased production of O2•− by the expression of oxidized hydroethidine in Sod2 −/+ mice. The expression of oxidized hydroethidine signals (small red particles) before 3-NP treatment (A and B) and after 3-NP treatment for 2 days (C to F). Oxidized hydroethidine signals at the basal level were barely detected in the striatum of wild-type (Wt) mice
Oxidative DNA injury was increased in Sod2 −/+ mice
To evaluate whether oxidative DNA injury occurred after 3-NP treatment, we performed 8-hydroxyguanosine immunohistochemistry in Wt and Sod2 −/+ mice. 8-Hydroxyguanosine-positive cells, seen as a granular pattern in the nucleus and cytosol, were more extensively detected in the lesioned striatum of the Sod2 −/+ mice after 3-NP treatment for 5 days than in the Wt mice (Figs. 2A and 2B). The nonlesioned area had no 8-hydroxyguanosine immunoreactivity in either the Wt or Sod2 −/+ mice (Figs. 2C and 2D). Because the 8-hydroxyguanosine antibody recognized both hydroxyl radical—modified DNA and RNA, we treated the sections with RNase, DNase, RNase and DNase, or buffer, respectively, 24 hours after induction of ischemia in the Wt mice, and performed 8-hydroxyguanosine immunohistochemistry. As illustrated in Fig. 2E, the RNase-treated samples showed increased density of 8-hydroxyguanosine immunoreactivity. Treatment with DNase resulted in almost abolished immunostaining (Fig. 2E). Samples treated with both RNase and DNase resulted in no 8-hydroxyguanosine immunoreactivity (Fig. 2E), and buffer-treated samples showed an intense density of 8-hydroxyguanosine immunoreactivity (Fig. 2E) (RNase, 18.25 ± 0.58; DNase, 2.18 ± 0.23; RNase + DNase, not detected; buffer, 21.32 ± 0.54; mean ± SD of 8-hydroxyguanosine-positive cells per 5 × 5-mm grid). These data confirm that 8-hydroxyguanosine immunoreactivity mainly resulted from DNA oxidation. To quantify oxidative cellular damage, we counted the 8-hydroxyguanosine—positive cells to total cells. As illustrated in Fig. 2F, the Sod2 −/+ mice had a more significantly increased percentage of 8-hydroxyguanosine-positive cells in the lesioned striatum 24 hours after treatment than the Wt mice.
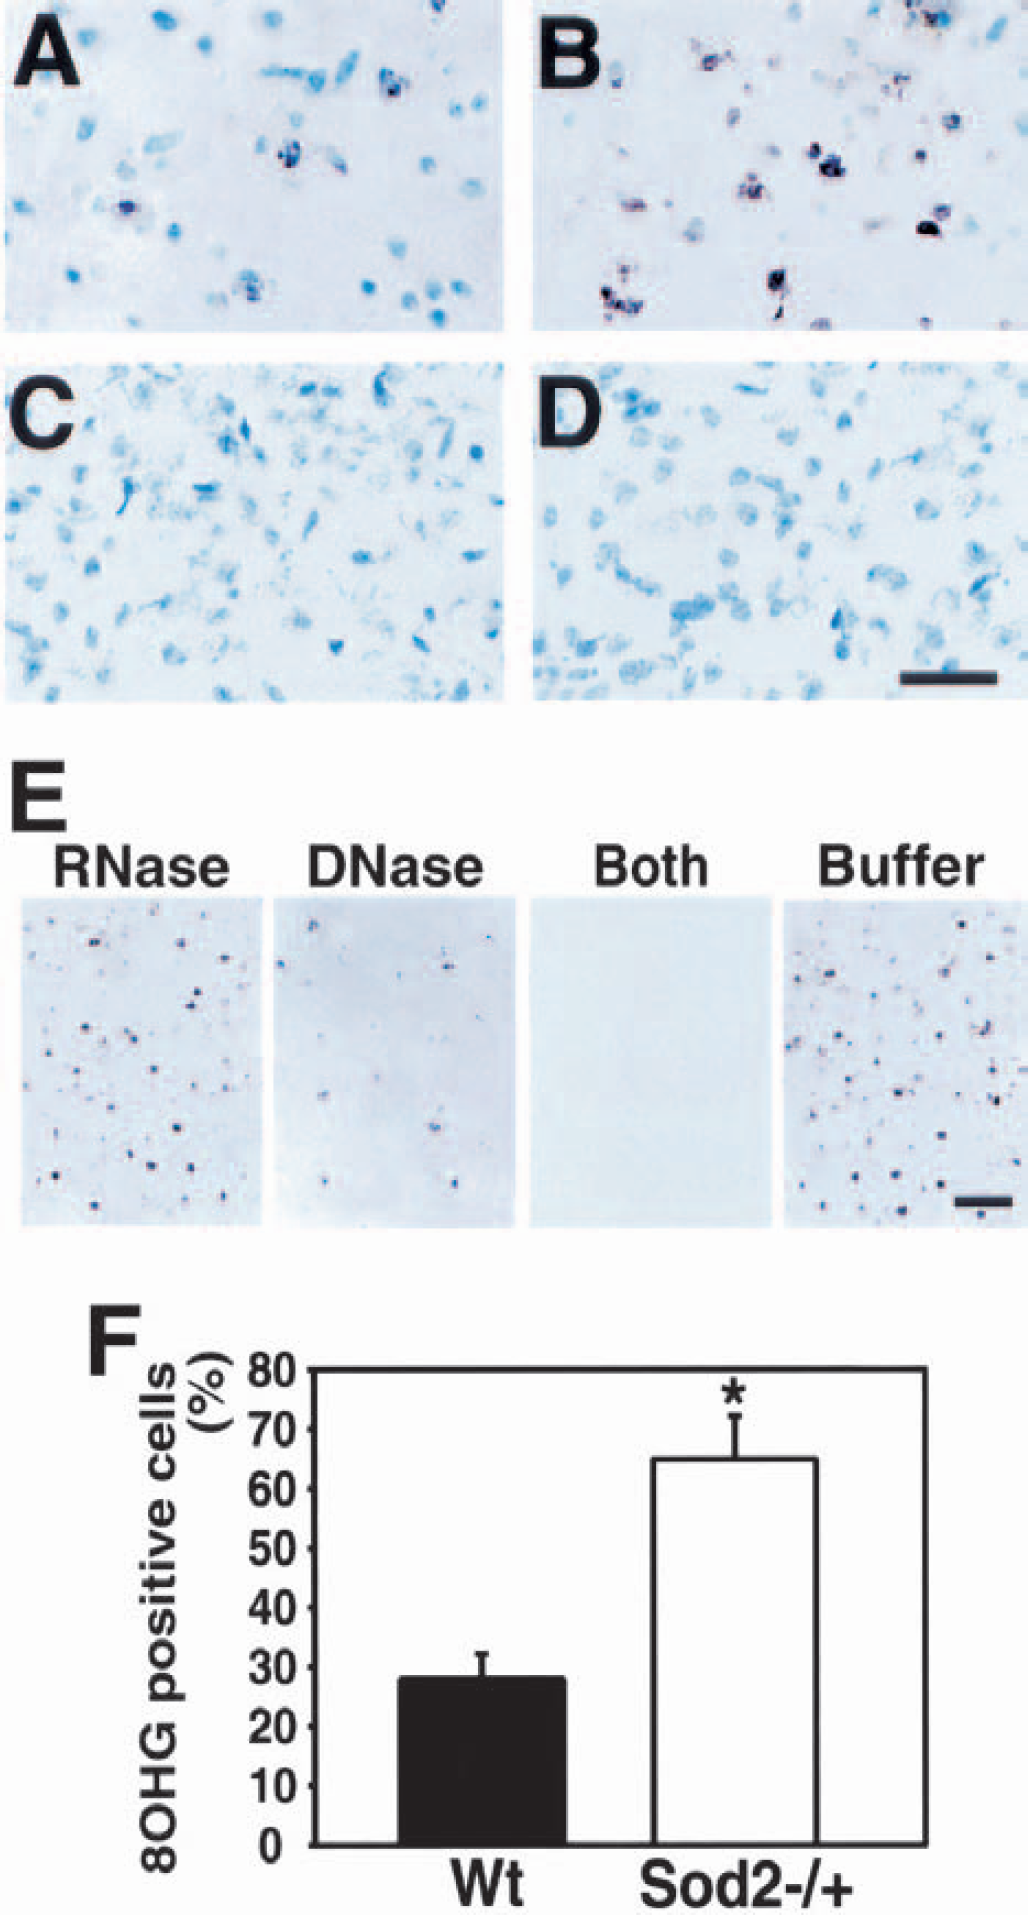
Increased oxidative DNA injury after 3-NP treatment in Sod2 −/+ mice. 8-Hydroxyguanosine (8OHG) immunohistochemistry after 3-NP treatment for 5 days is shown in (A to D). 8-Hydroxyguanosine—positive cells were darkly labeled as granular particles in the nucleus and cytosol in the wild-type (Wt) mice
Nitrotyrosine immunoreactivity was increased in Sod2 −/+ mice after 3-nitropropionic acid treatment
To assess the production of nitrotyrosine after 3-NP treatment, nitrotyrosine immunohistochemistry was performed in both the Wt and Sod2 −/+ mice. After 3-NP treatment for 5 days, there was a marked increased in immunohistochemical expression of nitrotyrosine within the lesioned striatum of the Sod2 −/+ mice compared with the Wt mice (Figs. 3A and 3B). Nitrotyrosine immunoreactivity was not observed in the nonlesioned striatum in either group (Figs. 3C and 3D). After the preabsorption procedure the sections showed no nitrotyrosine immunoreactivity. To evaluate the spatial relation between O2•− production and nitrotyrosine formation, double staining using nitrotyrosine immunohistochemistry and hydroethidine in situ was performed after 3-NP treatment for 5 days. With fluorescent avidin staining, nitrotyrosine immunolabeled cells (Fig. 3E, green) had oxidized hydroethidine signals that were red (Fig. 3F), and the overlapping section was yellow (Fig. 3G). This confirmed that O2•− might be related to the formation of nitrotyrosine in oxidative damaged cells. To compare nitrotyrosine formation between the Wt and Sod2 −/+ mice, we counted 8-hydroxyguanosine-positive cells to total cells in both groups. After the treatment, cells with nitrotyrosine immunoreactivity were significantly increased in the Sod2 −/+ mice compared with the Wt mice (Fig. 3H).
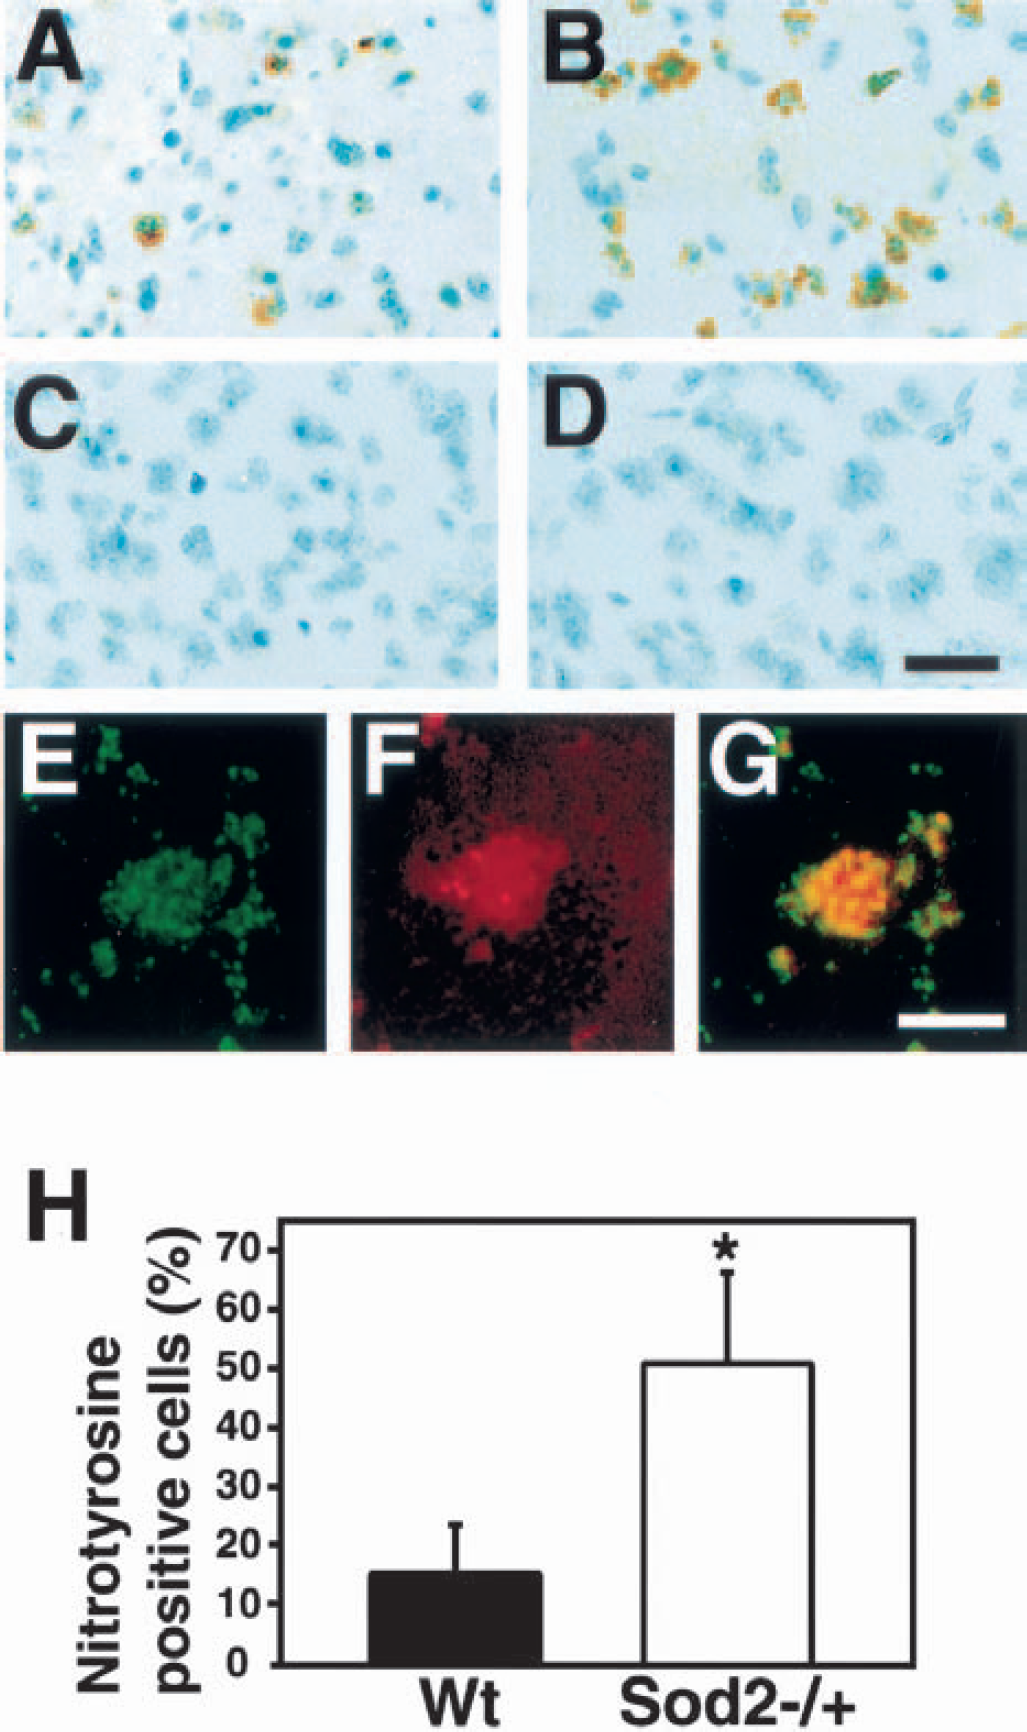
Immunohistochemistry of nitrotyrosine after 3-NP treatment for 5 days. Nitrotyrosine-positive cells are detected in the striatum of the wild-type (Wt) mice
Increased DNA laddering in Sod2 −/+ mice after 3-NP treatment
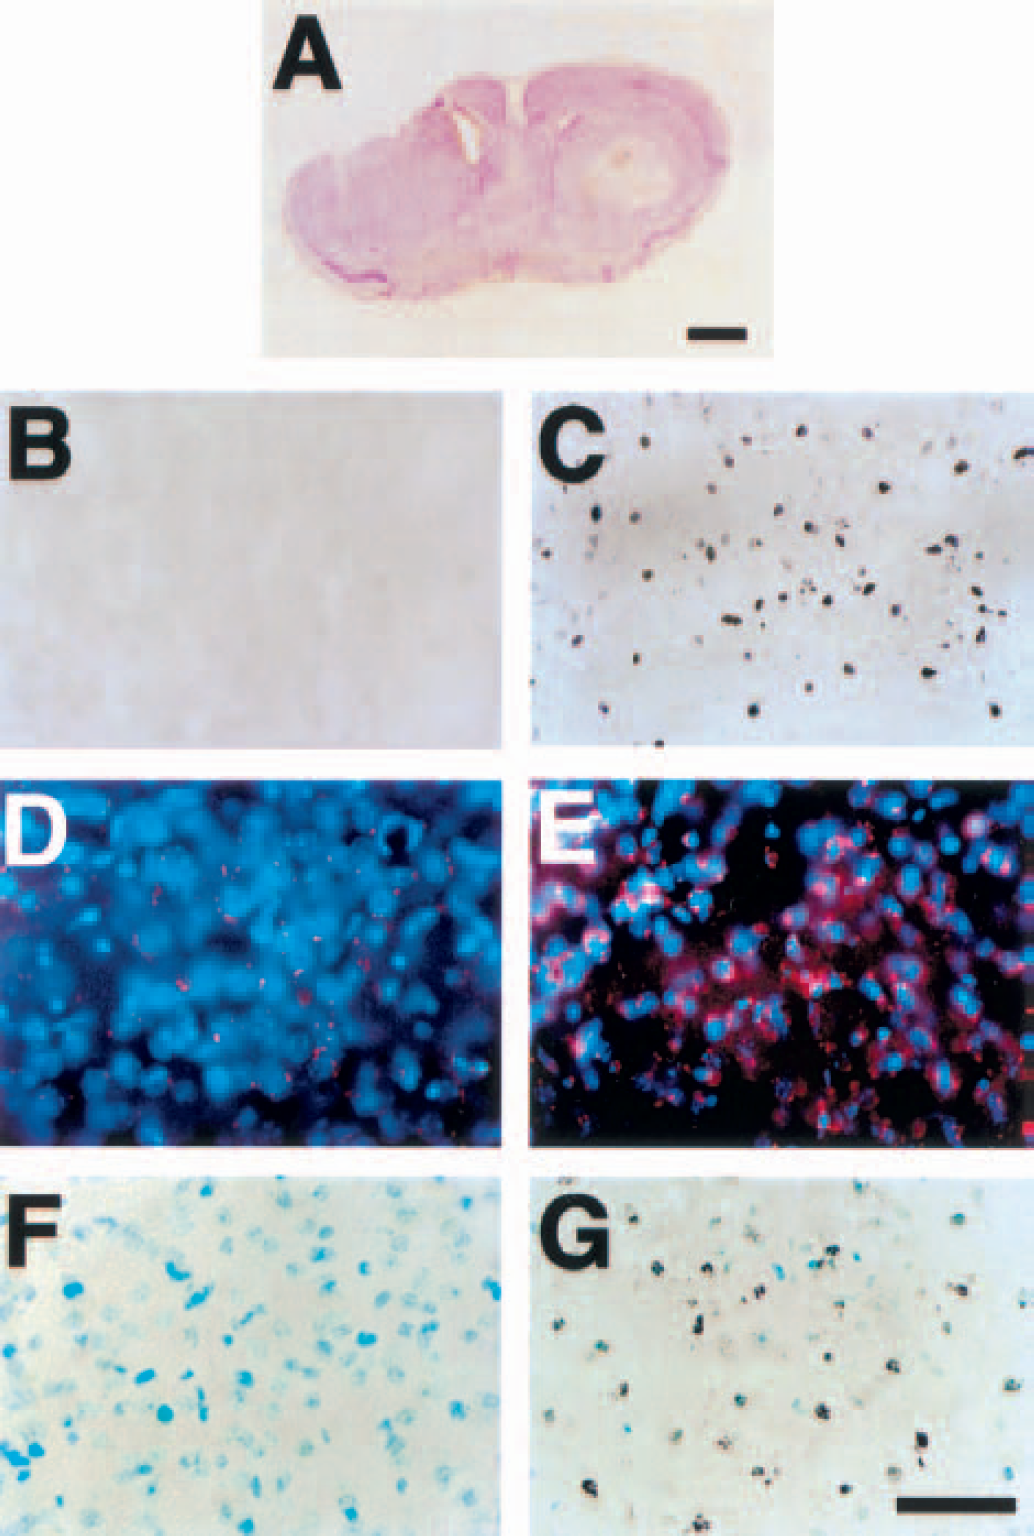
To confirm apoptotic cell death after 3-NP treatment, we analyzed the DNA isolated from both the lesioned and control striatum after 3-NP treatment for 5 days. As illustrated in Fig. 4A, DNA gel electrophoresis showed signs of internucleosomal fragmentation, evident by a laddering pattern caused by cleavage into segments that were multiples of approximately 200 bp in length, which is consistent with apoptosis. Some random fragmentation was also accompanied by laddering, evident by an overlying continuous smear of DNA, which is consistent with necrosis. The amount of DNA laddering was markedly increased in the Sod2 −/+ mice (Fig. 4A, lane 3) compared with the Wt mice (Fig. 4A, lane 4). Similar results were obtained in 10 independent studies. Correspondingly, there were strongly TUNEL-labeled cells accompanied by small particles around the nuclei that resembled apoptotic bodies (Fig. 4B). Using cresyl violet staining, these neuronal cells showed fragmented nuclei (Fig. 4D), and cellular shrinkage and chromatin condensation in the nuclei using hematoxylin and eosin staining (Fig. 4G), whereas some necrotic cells had light, diffuse TUNEL-labeled nuclei without apoptotic bodies (Fig. 4C). These cells showed cellular swelling and nuclear lysis by hematoxylin and eosin staining (Fig. 4F). These results are consistent with those of previous reports, in which the coexistence of cells with either necrotic or apoptotic features were observed in the lesioned striatum after 3-NP treatment (Kim et al., 2000a) and in which necrotic neurons were slightly labeled using TUNEL staining (Kondo et al., 1997).
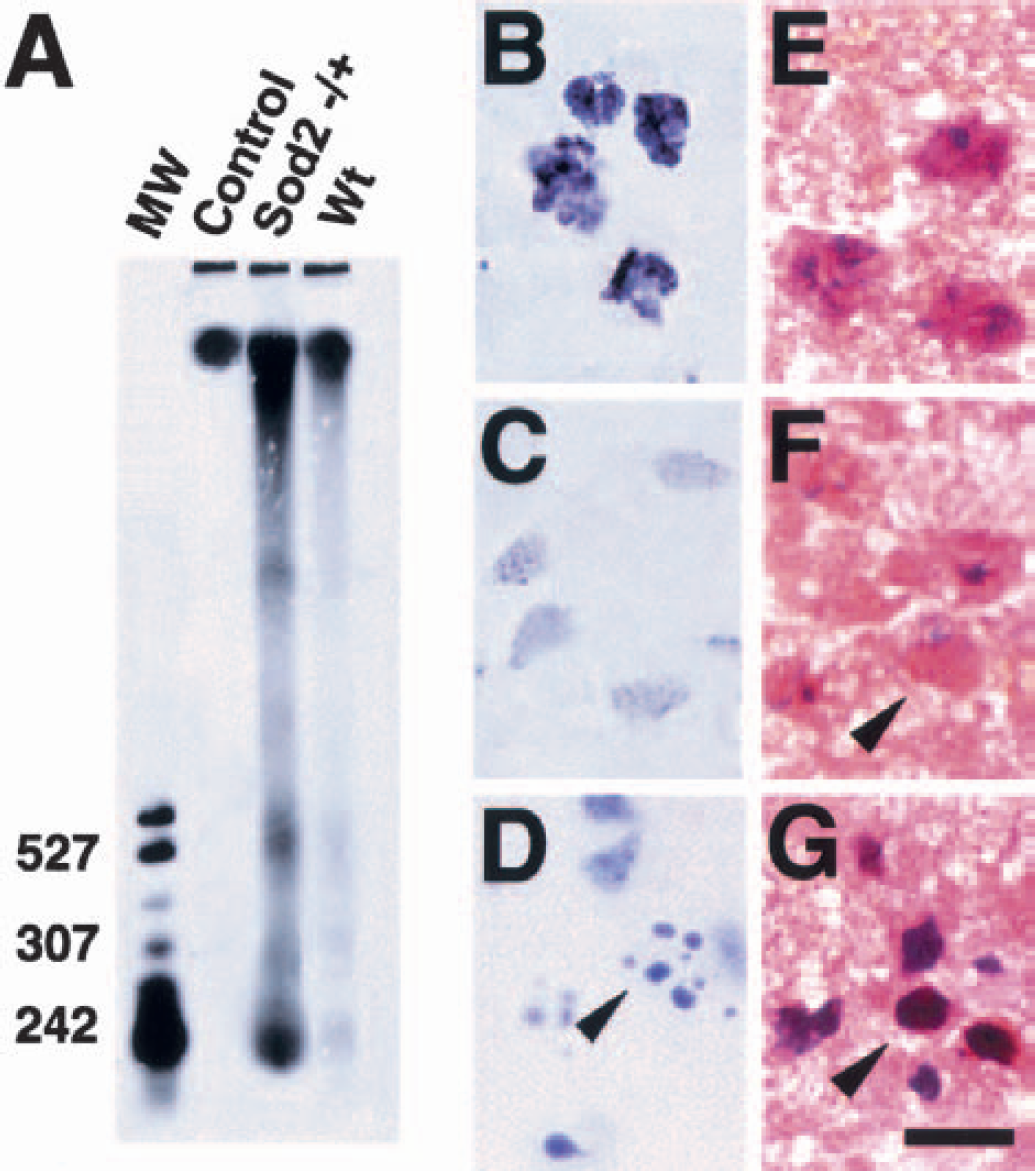
Representative findings showing increased DNA laddering in the striatum of the Sod2 −/+ mice after 3-NP treatment. DNA gel electrophoresis after 3-NP treatment for 5 days
Decortication prevented the production of O2•− and DNA and striatal injury in Sod2 −/+ mice
After cresyl violet staining, the lateral portion of the intact striatum in the decorticated Sod2 −/+ mice was pale after 3-NP treatment for 5 days (Fig. 5A). To determine the relation between excitotoxicity and the induction of apoptosis after 3-NP treatment in the Sod2 −/+ mice, we evaluated DNA fragmentation by TUNEL staining in the decorticated Sod2 −/+ mice (n = 20). TUNEL-labeled cells (1,690 + 209/mm2, mean ± SD) were markedly detected in the intact striatum, but not in the denervated striatum (Figs. 5B and 5C). To determine the relation between the induction of O2•− and excitotoxicity after 3-NP treatment in the Sod2 −/+ mice, we evaluated O2•− production using in situ detection with hydroethidine after 3-NP treatment in the striatum. In the intact striatum, oxidized hydroethidine signals were markedly detected, but not in the denervated striatum (Figs. 5D and 5E). The data on oxidized hydroethidine in the intact striatum of the decorticated Sod2 −/+ mice were not different from the results in the striatum of the Sod2 −/+ mice after 3-NP treatment. For determining oxidative DNA injury during excitotoxicity, we evaluated 8-hydroxyguanosine immunoreactivity in 3-NP—treated decorticated Sod2 −/+ mice. The immunohistochemistry of 8-hydroxyguanosine in the intact striatum detected densely labeled nuclei and/or coarse granular immunodeposits in the cytoplasm of neuronal cells and in the nuclei of shrunken cells. Immunoreactivity of 8-hydroxyguanosine was completely unlabeled in the denervated lesioned striatum (Figs. 5F and 5G). The data on 8-hydroxyguanosine in the intact striatum of the decorticated Sod2 −/+ mice were not different from the results in the striatum of the Sod2 −/+ mice after 3-NP treatment.
Representative photomicrographs showing that decortication prevented oxidative stress and subsequent striatal injury in the Sod2 −/+ mice. Using cresyl violet staining, the lateral section of the intact striatum in the decorticated mice was pale after 3-NP treatment for 5 days
Striatal lesion volume and DNA fragmentation were advanced in the Sod2 −/+ mice, but attenuated by overexpression of copper/zinc superoxide dismutase
To determine whether oxidative stress, particularly caused by O2•−, is involved in striatal vulnerability after 3-NP treatment, the lesion volume and DNA fragmentation were evaluated in the Wt and Sod2 −/+ mice using TUNEL staining. Furthermore, to clarify the involvement of O2•− in selective striatal vulnerability in the Sod2 −/+ mice after 3-NP treatment, SOD1 +/− / Sod2 −/+ mice were treated with 3-NP. After 3-NP treatment for 5 days, the Wt mice had striatal lesions, particularly in the lateral portion, by cresyl violet staining (Fig. 6A). The Sod2 −/+ mice had increased lesions in the striatum compared with the Wt mice (Fig. 6B). The SOD1 +/− / Sod2 −/+ mice had very small lesions in the lateral part of the striatum (Fig. 6C). No lesions were seen in the hippocampus or other brain area (data not shown). TUNEL staining was visualized with dark-field phase-contrast microscopy to evaluate the distribution of apoptotic and necrotic neurons in the lesioned striatum. Apoptosis and necrosis could be morphologically distinguished, although whether TUNEL-labeled cells are exactly apoptotic cells is still a controversial issue. A bright yellow represented TUNEL-positive apoptotic neurons and a faint yellow represented necrotic neurons, using a yellow filter with dark-field phase-contrast microscopy (Kondo et al., 1997). In the Wt mice, TUNEL-positive apoptotic neurons were observed in the lesioned striatum (Fig. 6D). In the Sod2 −/+ mice, TUNEL-positive cells were more prominent and widely distributed in the lesioned striatum (Fig. 6E). In the SOD1 +/− / Sod2 −/+ mice, bright yellow, TUNEL-positive cells were barely detected in a small striatal lesion (Fig. 6F). As illustrated in Figs. 6G and 6H, we quantified and compared the lesion volume percentage and TUNEL-positive cells in three groups under bright-field microscopy. The percentage of lesion volume was significantly increased in the Sod2 −/+ mice compared with the Wt mice, but CuZnSOD overexpression significantly attenuated the lesion volume percentage in the SOD1 +/− / Sod2 −/+ mice compared with the other groups (Fig. 6G). In the Sod2 −/+ mice, there was a significantly increased number of TUNEL-positive cells/mm2 compared with the Wt mice, whereas CuZnSOD overexpression significantly attenuated TUNEL-positive cells in the SOD1 +/− / Sod2 −/+ mice compared with the other groups (Fig. 6H).
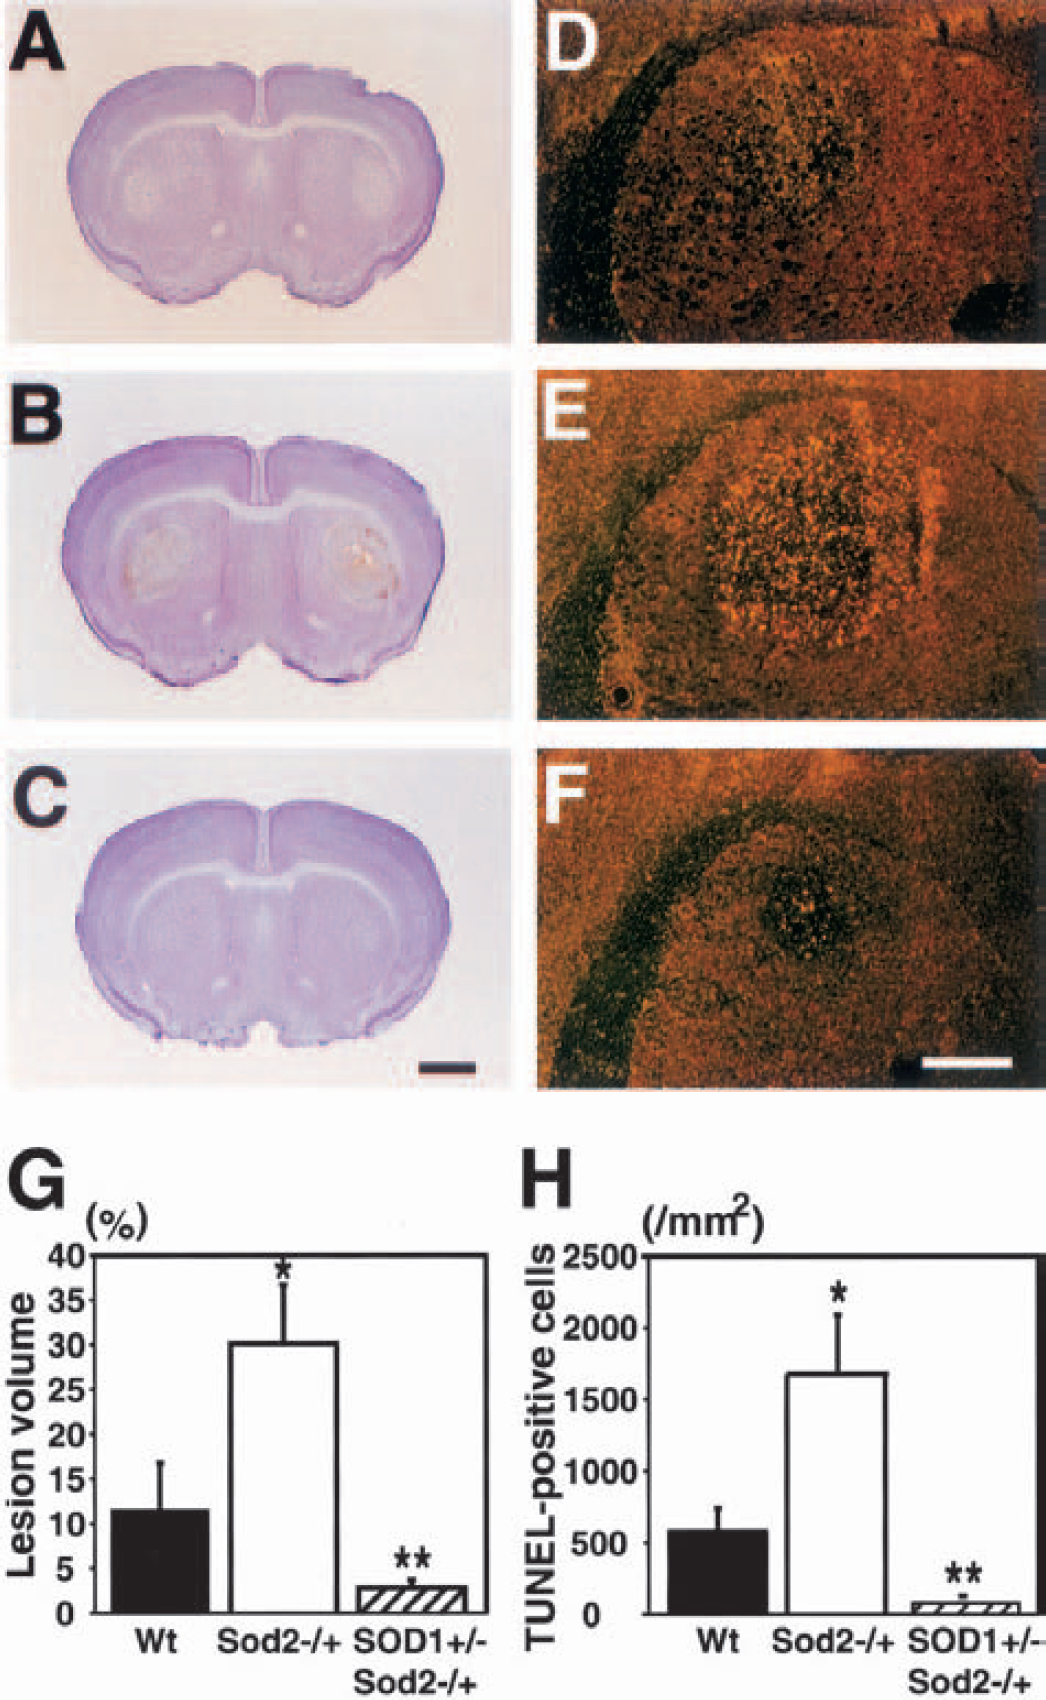
Striatal lesion volume and DNA fragmentation in Sod2 −/+ mice or SOD1 +/− / Sod2 −/+ mice after 3-NP treatment. Cresyl violet staining after 3-NP treatment for 5 days (A to C). The striatum in the Wt mice had a pale lesion laterally
DISCUSSION
We demonstrated that oxidative cellular injury and subsequent DNA fragmentation through the overproduction of reactive oxygen species (ROS), in particular O2•−, were exacerbated after 3-NP treatment in Sod2 −/+ mice, whereas decortication completely abolished the production of O2•−, and subsequent DNA fragmentation and oxidative striatal damage. We also showed that increased CuZnSOD attenuated 3-NP—induced DNA fragmentation and striatal damage in Sod2 −/+ mice that overexpress CuZnSOD. Our findings suggest that MnSOD may play a role in defending against 3-NP—induced oxidative DNA and cellular injury, thereby lessening subsequent cell demise by the decrease in O2•− production. Moreover, O2•− may be involved in the signaling mechanism of selective striatal vulnerability through the interacting excitotoxic cascade after 3-NP treatment. These findings are consistent with previous results in vitro that showed that use of cell cultures from transgenic mice that overexpress MnSOD attenuated 3-NP—induced apoptosis or necrosis by the decrease in superoxide formation and subsequent calcium release from mitochondria (Bruce-Keller et al., 1999), or that overexpression of MnSOD prevented apoptosis induced by free-radical generating agents through the suppression of peroxynitrite and lipid peroxidation (Keller et al., 1998b), or results in vivo that showed that increased ROS were detected in 3-NP—induced striatal lesions (Beal et al., 1995; Schulz et al., 1996; Bogdanov et al., 1999), and that decortication reduced striatal lesions after systemic 3-NP injection in rats or mice (Beal et al., 1993; Fu et al., 1995).
In fact, recent studies have linked excitotoxicity and ROS production to mitochondrial dysfunction. A failure of energy production caused by mitochondrial dysfunction may lead to membrane depolarization, removal of the voltage-dependent Mg2+ block of the NMDA receptor, and subsequent activation of the NMDA receptor. During these episodes, increased intracellular calcium levels can initiate a number of deteriorative processes such as proteinase activation and free radical generation (Novelli et al., 1988; Beal et al., 1993; Coyle and Puttfarcken, 1993). Moreover, ROS produced by NMDA-receptor activation mediate further enhancing excitotoxicity and subsequent cell death (Schulz et al., 1995). In the present study, the effects of MnSOD deficiency on the increase in O2•− production in the striatum and subsequent striatal lesion volume after 3-NP treatment, and decortication in the Sod2 −/+ mice to prevent O2•− production in the striatum and oxidative striatal damage, suggest that the production of O2•− and the excitotoxic cascade may interact to produce selective striatal vulnerability after 3-NP treatment. Our recent report showed that decortication prevented O2•− production in the striatum and subsequent DNA fragmentation and striatal vulnerability after 3-NP treatment in Wt mice (Kim et al., 2000a). Thus, the present results showing that the decorticated Sod2 −/+ mice may be more susceptible to O2•− production after 3-NP treatment than the Wt mice, suggest that O2•− associated with excitotoxicity may produce DNA fragmentation and selective striatal damage after 3-NP treatment. Furthermore, a low dose of 3-NP (50 mg/kg twice a day) was used according to our previous data, which confirmed that a low-dose 3-NP treatment (60 mg/kg twice a day) produced typical features of NMDA-receptor—mediated excitotoxic striatal lesions, such as the sparing of NADPH diaphorase neurons and attenuation by the NMDA-receptor antagonist or decortication (Kim et al., 2000a). It has been reported that formation of O2•− is an obligatory step for excitotoxic cell death in rat cortical cell cultures (Patel et al., 1996), and that reduced MnSOD exacerbates glutamate-induced neuronal death in cultured mouse cortical neurons (Li et al., 1998). Thus, it is conceivable that ROS, particularly O2•−, overproduced against the scavenging capability of MnSOD by activation of the NMDA receptor after 3-NP treatment, could produce selective striatal damage. A previous report showing that partial inhibition of brain succinate dehydrogenase (SDH) by systemic low-dose but repetitive 3-NP treatment may be enough to produce selective striatal lesions in rats and that the inhibition of SDH occurred in other brain regions in the same manner as in the striatum (Brouillet et al., 1998). This suggests that selective striatal vulnerability after 3-NP treatment may be related to other provocative factors such as preferential occurrence of excitotoxicity or oxidative stress in the striatum rather than selective SDH inhibition by 3-NP in the striatum. Our present study showed that increased O2•− production and oxidative DNA or cellular damage, which are associated with excitotoxicity, selectively occurred in the striatum, supporting this hypothesis.
Although the gene defect as an expansion in unstable trinucleotide repeats on chromosome 4 and has been identified in HD, which is a main target disease of the 3-NP animal model, the exact pathogenetic mechanisms of abnormal gene expression are not clear (The Huntington's Disease Collaborative Research Group, 1993). The failure of mitochondrial energy metabolism linked to oxidative stress has been drawing more attention regarding the mechanism of selective basal ganglia vulnerability in HD (Gu et al., 1996; Petersé et al., 1999; Beal, 2000). The present data showing that MnSOD deficiency increases oxidative DNA damage and fragmentation suggest that apoptotic cell death may be provoked by oxidative stress, in particular by O2•− production, after 3-NP treatment in the striatum of Sod2 −/+ mice. Recent evidence of apoptotic cell death in 3-NP experiments or HD postmortem studies suggests that both necrosis and apoptosis may be involved in the pathogenesis of HD, whereas excitotoxic neuronal cell death has been traditionally considered to be necrotic (Portera-Cailliau et al., 1995; Pang and Geddes, 1997; Sato et al., 1997; Kim et al., 2000a; Kim and Chan, 2001). Mitochondrial function plays a pivotal role in the development of apoptosis or necrosis according to the severity of the mitochondrial energy failure during excitotoxic neuronal cell death (Ankarcrona et al., 1995; Bonfoco et al., 1995; Chan, 2001). Our present data are consistent with previous studies using Sod2 −/+ mice in which O2•− production may have mediated early cytochrome c release from mitochondria or oxidative mitochondrial damage and subsequent infarct after focal cerebral ischemia (Murakami et al., 1998; Fujimura et al., 1999). Moreover, our previous reports showed that the systemic 3-NP treatment model in mice or rats may produce initial apoptotic cell death and subsequently both apoptosis and necrosis in the striatum after repetitive treatment (Sato et al., 1997; Kim et al., 2000a; Kim and Chan, 2001). As seen in the present study, increased nitrotyrosine immunoreactivity in Sod2 −/+ mice after 3-NP treatment, and nitrotyrosine-positive cells showing O2•− production in the cytosol confirm that oxidative cellular injury after 3-NP treatment might contribute to the mechanism of selective striatal vulnerability along with the production of O2•−, because the nitration of tyrosines of cellular proteins is formed by peroxynitrite as a result of the reaction with O2•− and nitric oxide radical (Chan, 1996). Our findings agree with those in previous reports showing that intrastriatal NMDA injection produced nitrotyrosine formation and DNA fragmentation in the lesioned striatum of mice (Ayata et al., 1997) or that nitrotyrosine immunoreactivity increased in the infarcted tissue after focal cerebral ischemia in mice (Eliasson et al., 1999). An attractive feature of the hypothesis of oxidative stress as a mechanism of chronic neurodegeneration is that it can account for the cumulative damage associated with the delayed onset and progressive nature of HD or other neurodegenerative disorders (Coyle and Puttfarcken, 1993; Kim and Chan, 2001). In addition, apoptosis has characteristics of slow and delayed cell death compared with necrosis (Choi, 1988; Meldrum, 1993). Thus, oxidative stress-related apoptotic neuronal death in the striatum induced by 3-NP should provide useful information to better our understanding of chronic neurodegenerative disorders.
In this study, to our surprise, overexpressed CuZnSOD significantly attenuated DNA fragmentation and lesion volume after 3-NP treatment in SOD1 +/− / Sod2 −/+ mice compared with pure Sod2−/+ mice or even Wt mice. Recent studies using confocal and electron microscopy, proposed the compartmentalization of MnSOD, which is located only in mitochondria, and CuZnSOD, which is located uniformly throughout the nuclear and cytoplasmic matrix (Slot et al., 1986; Crapo et al., 1992; Lindenau et al., 2000). Thus, the present data suggest that the main effects of O2•− overproduced from mitochondria after 3-NP treatment may be related to cytosolic events such as NMDA activation rather than direct mitochondrial collapse in this experimental system. A previous report using SOD1 transgenic mice, the same strain used in the present study, clearly showed that CuZnSOD attenuates 3-NP neurotoxicity by reduction of ROS (100 mg·kg−1/d for 5 days) (Beal et al., 1995). In addition, this protective effect of overexpressed CuZnSOD in SOD1 +/− / Sod2 −/+ mice may occur because of the discrepancy in increased or decreased levels between CuZnSOD in the cytosol (3× increase) (Epstein et al., 1987) and MnSOD in mitochondria (50% decrease) (Chan et al., 1996). Furthermore, mitochondria are a main source of O2•−, which is freely transported into the cytosol, in the process of excitotoxicity (Dugan et al., 1995; Chan, 1996). Thus, we can speculate that the excitotoxic cascade activated by mitochondrial dysfunction after 3-NP treatment may produce O2•− against the scavenging activity of MnSOD in the mitochondria, and then O2•− may further enhance the excitotoxic process, which subsequently produces more O2•−, and finally, the integrated oxidative-excitotoxicity process may produce selective striatal damage. In our present study, oxidized hydroethidine signals were remarkably detected in the lateral striatum, which is a main lesioned striatum, after 3-NP treatment. This is in agreement with the current hypothesis that ROS, in particular O2•−, linked to excitotoxicity may mediate striatal vulnerability after 3-NP treatment.
In conclusion, our study demonstrated that production of O2•− linked to the excitotoxic cascade may be a critical step in selective striatal vulnerability, promoted by oxidative DNA injury and DNA fragmentation after 3-NP treatment.
Footnotes
Acknowledgments
We thank Dr. Charles J. Epstein for providing the breeding pairs of SOD1 +/− mice, Dr. Jean-Christophe Copin for developing the SOD1 +/− / Sod2 −/+ mice, Dr. Anders Lewén for technical assistance, Cheryl Christensen for editorial assistance, and Beth Hoyte for preparation of the figures.