
Abstract
Oxygen-15 positron emission tomography (15O PET) can provide important data regarding patients with head injury. We provide reference data on intersubject variability and reproducibility of cerebral blood flow (CBF), cerebral blood volume (CBV), cerebral metabolism (CMRO2) and oxygen extraction fraction (OEF) in patients and healthy controls, and explored alternative ways of assessing reproducibility within the context of a single PET study. In addition, we used independent measurements of CBF and CMRO2 to investigate the effect of mathematical correlation on the relationship between flow and metabolism. In patients, intersubject coefficients of variation (CoV) for CBF, CMRO2 and OEF were larger than in controls (32.9% ± 2.2%, 23.2% ± 2.0% and 22.5% ± 3.4% versus 13.5% ± 1.4%, 12.8% ± 1.1% and 7.3% ± 1.2%), while CoV for CBV were lower (15.2% ± 2.1% versus 22.5%±2.8%) (P>0.001). The CoV for the test—retest reproducibility of CBF, CBV, CMRO2 and OEF in patients were 2.1% ± 1.5%, 3.8% ± 3.0%, 3.7% ± 3.0% and 4.6% ± 3.5%, respectively. These were much lower than the intersubject CoV figures, and were similar to alternative measures of reproducibility obtained by fractionating data from a single study. The physiological relationship between flow and metabolism was preserved even when mathematically independent measures were used for analysis. These data provide a context for the design and interpretation of interventional PET studies. While ideally each centre should develop its own bank of such data, the figures provided will allow initial generic approximations of sample size for such studies.
Introduction
Oxygen-15 positron emission tomography (15O PET) has the potential to elucidate cerebrovascular physiology and quantify important intermediate physiological end points in the assessment of therapies in patients with acute brain injury. Previous human studies using 15O PET have provided invaluable reference data regarding normal values (Frackowiak et al, 1980; Lebrun-Grandie et al, 1983; Leenders et al, 1990), and reproducibility of the technique for measuring cerebral blood flow (CBF) (Carroll et al, 2002; Frackowiak et al, 1980; Lebrun-Grandie et al, 1983; Leenders et al, 1990; Matthew et al, 1993). However, the reproducibility of 15O PET studies of CBF, cerebral metabolism (CMRO2), cerebral blood volume (CBV) and oxygen extraction fraction (OEF) has not been clearly established, particularly after head injury. In addition, although the relationship between blood flow and metabolism is clearly strong in healthy volunteers, it is likely to be severely disturbed in the injured brain (Czosnyka et al, 2001; Overgaard and Tweed, 1974).
The rational design and interpretation of interventional 15O PET studies in head injury is hampered by a lack of knowledge regarding the reproducibility of the technique in this patient group. In such studies, consecutive measurements are performed on each subject during the same imaging session under resting and experimental conditions, and changes are compared with resting measurements in the same subject. In this way, problems associated with variation between subjects due to individual differences (intersubject variability) can be limited. However, resting physiology may vary within an individual patient (intrasubject variability) and limit the ability to detect significant changes between baseline and postintervention conditions. Further, although 15O PET studies of head injury would clearly be useful to examine the nature of disordered relationships between oxygen supply and metabolic demand, such investigations might be confounded by the effect of mathematical correlation between the calculated PET parameters (Frackowiak et al, 1980). Without such data, it is difficult to accurately determine the clinical significance of pathophysiological changes, as they evolve after head injury.
The first aim of these studies was to provide reference data on intersubject variability and reproducibility of CBF, CBV, CMRO2 and OEF measurements, so as to inform the design of future interventional studies. Since such repeated measurement of PET variables is not easy as a part of an interventional study, we explored alternative ways of assessing reproducibility within the context of a single steady-state 15O PET study. Secondly, we used independent emission data to document the effect of mathematical correlation on important physiological relationships between oxygen supply and metabolic demand.
Methods
We obtained 15O PET CBF, CBV, CMRO2 and OEF images from 10 healthy volunteers (8 men, 2 women) with a mean (range) age of 30 (18 to 60) years, and 24 patients (18 men, 6 women) aged 34 (16 to 65) years within 10 days of head injury. Patients had a median (range) postresuscitation Glasgow Coma Score (Teasdale and Jennett, 1974) of 7 (3 to 13), and developed intracranial pressure (ICP) elevations sufficient to require sedation and artificial ventilation as a part of protocol-driven management (Menon, 1999). All volunteers provided informed consent for studies, and assent was obtained from the next of kin for all patient studies. All studies were approved by the Local Research Ethics Committee at Addenbrooke's Hospital, Cambridge, UK, and by the Administration of Radioactive Substances Advisory Committee of the UK.
Clinical Protocols
Patients were managed with protocol-driven therapy aimed at maintaining ICP below 20mm Hg and cerebral perfusion pressure (CPP) greater than 70mm Hg, as described previously (Menon, 1999). Interventions included sedation (propofol up to 6mg/kg h and fentanyl 1 to 2 μg/kgh) and neuromuscular blockade, surgery for space-occupying lesions, drainage of cerebral spinal fluid (CSF), volume supplementation and vasoactive agents (dopamine and/or norepinephrine) for CPP augmentation, osmotic diuretics (boluses of 0.5g/kg of mannitol), and mild hyperventilation (to ∼ 35 mm Hg). Hyperthermia was treated vigorously, and mild hypothermia (∼36°C) was commonly employed to assist ICP control. While haemo-dynamic stability was ensured during PET studies by titrating fluids and vasoactive agents, sedative infusions were left unchanged. No other material changes in management occurred on the day of the PET study in any of the patients, thus ensuring stable physiology during imaging. Healthy volunteers were unsedated and had heart rate, mean arterial pressure, pulse oximetry and arterial blood gases monitored to ensure physiological stability during PET imaging.
Positron Emission Tomography
Positron emission tomography studies were undertaken on a General Electric Advance scanner (GE Medical Systems, Milwaukee, USA). Emission data were acquired in 3D mode during a 20-min steady-state infusion of 800 MBq of H215O (two 5-min frames at the end of the administration), after a 60-secs inhalation of 300 MBq of C15O (single 5-min frame), and in 2D mode during a 20-min steady-state inhalation of 7200 MBq of 15O2 (two 5-min frames at the end of the administration). Wherever possible, 3D scanning was used to reduce the radiation exposure to the patient in accordance with ALARP (as low as reasonably practicable) as defined within the Ionising Radiations Regulations 1999 of the United Kingdom. However, previous attempts at 3D 15O2 scanning at our centre resulted in very significant artefacts from the Gaussian fitting scatter correction implemented on the scanner (Stearns, 1995), due to high radioactivity levels in the gas delivery system and sinuses/airways. Consequently, the 15O2 scans reported in this paper were acquired in 2D mode and scatter corrected using the integral transformation method of Bergstrom et al (1983). Just before emission data acquisition, a 10-min transmission scan was performed using rotating germanium-68 rods (2 × 300 MBq). These data, in combination with that from a 60-min blank scan acquired on the same day, were used to correct the emission data for photon attenuation. Images were reconstructed into 2.34 × 2.34 × 4.25 mm3 voxels using the PROMIS 3D filtered back-projection algorithm (Kinahan and Rogers, 1989), with corrections applied for attenuation, scatter, randoms, dead time, normalisation and sensitivity. During reconstruction, a Hanning filter cutoff at the Nyquist frequency was used transaxially, but no apodisation was applied axially. This resulted in images with essentially isotropic resolution (6.7 mm full-width at half-maximum (FWHM)) at the centre of the field of view. Emission images were then smoothed using an isotropic 4 mm Gaussian filter, and, assuming that such smoothing affects the resolution in a quadratic manner, the resulting final spatial resolution was ∼7 to 8mm FWHM. During both steady-state emission scans, two arterial blood samples were taken for each 5-min frame, with one sample at the start and the second sample at the end of the frame. In all instances, a volume ∼1.5 times the dead space was aspirated, before taking a 2mL blood sample. Parametric maps of CBF, CBV, CMRO2 and OEF were calculated by inputting simultaneous PET and averaged arterial tracer activity measurements into standard models (Frackowiak et al, 1980; Lammertsma et al, 1987, 1988). We used a blood—brain partition coefficient for H215O (ρ) of 0.95, based on the previous in vitro data (Herscovitch and Raichle, 1985) and a small- to large-vessel haematocrit ratio (r) of 0.85 (Lammertsma et al, 1983; Phelps et al, 1979). Metabolic maps were coregistered to anatomy using magnetic resonance (MR) imaging in volunteers or X-ray computed tomography (CT) in patients.
Analysis Strategy
We used data from 18 patients and the 10 volunteer subjects to calculate intersubject variability in the two populations. The reproducibility of 15O PET was calculated from two consecutive PET studies performed under conditions of stable physiology in a separate cohort of six head-injured patients (test—retest reproducibility). While these data are extremely useful, and will inform the design of subsequent interventional studies, we realised that it would be useful to have a measure of variability within each individual subject who participated in an interventional study. However, such an assessment would ideally demand two full 15O PET studies both before and after the intervention, which would be very difficult to accomplish, both on grounds of radiation burden and logistics. The acquisition of 15O PET data in two frames provided the opportunity of using individual frames to calculate two independent sets of metabolic images, which could be used to assess reproducibility within the context of a single preintervention baseline PET study (within-session reproducibility). We used the first 5-min frame from both the H215O and 15O2 emission data, and an average of two arterial tracer activity measurements during this time period to construct one set of parametric images. The second pair of 5-min frames and appropriate arterial data were used to construct a second set of images. In this way, we were able to obtain repeated PET measurements of CBF, CMRO2 and OEF, but not CBV, within the same study session in control subjects and patients under unchanged physiological conditions. As these data were not acquired using separate radioisotope administrations, but used independent frames obtained during the steady-state phase of the 15O emission data, it is important to quantify the potential error of such a technique. We therefore compared assessments of reproducibility obtained using these two approaches: the test—retest reproducibility (obtained from two independent studies) and the within-session reproducibility (acquired using the two independent frames within a single study). To generate data sets that examined flow—metabolism coupling and its modulation by mathematical correlation between PET variables, we took advantage of the fact that our H215O and 15O2 emission data were collected in two separate frames. We used independent H215O and 15O2 emission and arterial data to calculate mathematically independent CBF and CMRO2 parametric maps. We subsequently examined the relationships between these variables and compared our results to those previously published.
Image Analysis
Images were analysed using custom-designed automated software (PETAN (Smielewski et al, 2002)), incorporating elements of Statistical Parametric Mapping (SPM99, Wellcome Department of Cognitive Neurology, London, UK; http://www.fil.ion.bpmf.ac.uk/spm/), Matlab 5.2 (MathWorks, Inc., Natick, MD, USA), Analyze 4.0 (Analy-zeDirect, Inc., Lenexa, KS, USA) and registration by multiresolution optimisation of mutual information (mpr, Department of Radiological Sciences, Guys Hospital, London, UK (Studholme et al, 1996, 1997)). Individual anatomical images were edited to extract a template that identified brain tissue voxels and excluded extracranial tissue, CSF and extraaxial haematomas. This brain template was applied to the spatially coregistered, metabolic PET images, and used to generate corrected maps of CBF, CBV, CMRO2 and OEF. We utilised a region of interest (ROI) map specifying 15 ROIs based on vascular territories and anatomical structure of relevance in the interpretation of pathological disease states of the brain. This was drawn within normalised (Talairach) space (Talairach and Tournoux, 1998) on a reference MR image (Figure 1), and was corrected for individual anatomy and the presence of the major cerebral vessels (based on normalised CT or MR brain templates), and applied to the normalised parametric images. To determine the spatial normalisation parameters used to warp the emission images into normalised space, the average H215O image for each subject was warped to the PET template in SPM99 (Wellcome Department of Cognitive Neurology, London, UK; http://www.fil.ion.bpmf.ac.uk/spm/). This spatial normalisation algorithm uses a 12-parameter affine transform followed by nonlinear deformation, using a linear combination of basis functions (the lowest frequencies of the 3D discrete cosine transform) (Ashburner and Friston, 1999). Metabolic parameters were expressed as an average for all brain tissue within each ROI.
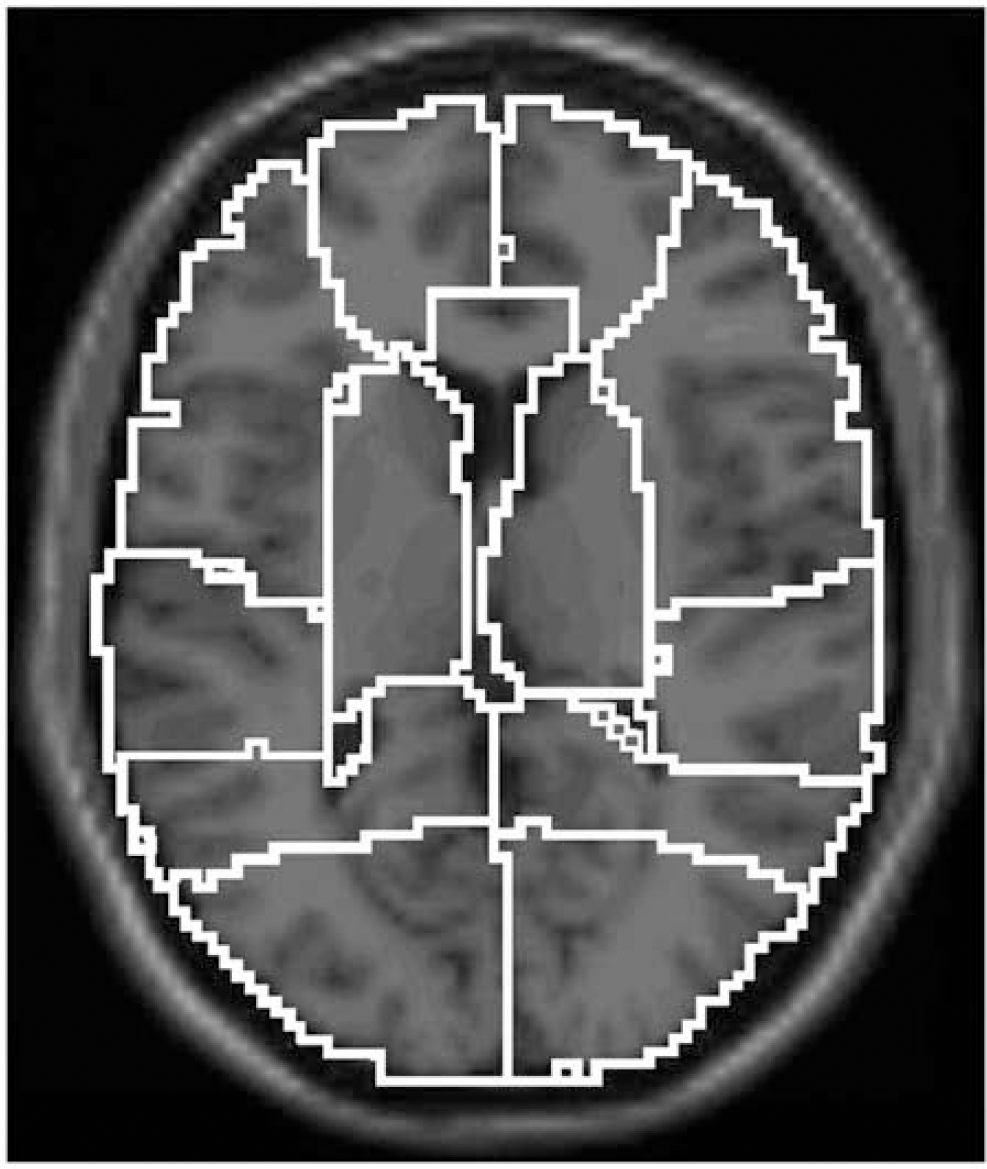
Region of interest map covering the whole brain. T1 weighted image of reference brain, normalised to Talairach space, indicating the 15 ROIs defined in the cerebral hemispheres on the basis of anatomical divisions and vascular territories: right and left medial frontal, lateral frontal, temporal, parietal, occipital, deep grey matter, cerebellum and the brain stem.
Statistical Analysis
Statistical analysis was undertaken using Statview©(Version 5, 1998, SAS Institute Inc., Cary, NC, USA). All data are expressed and displayed as mean ± standard deviation (s.d.), unless otherwise stated. After statistical advice, individual ROIs were treated independently, since they represented a clinically relevant method of segmenting the brain, with specific location being irrelevant to this analysis. Relationships between PET-derived variables were explored using linear regression. To compare the intersubject variability and reproducibility of PET measurements, we calculated the s.d. and coefficients of variation (CoV (s.d./mean)) of ROI measurements within the subject groups. Intersubject variability of PET measurements was calculated for each of the designated 15 ROIs to take account of local physiological variations that may arise from different proportions of grey and white matter within individual ROIs. Test—retest and within-session reproducibility was calculated across the same 15 ROIs in a similar fashion. Using the s.d. and CoV of the two separate measurements of the PET parameters, we compared the variability between repeated measurements within each ROI and each individual. Results were compared using paired and unpaired ‘t’-tests as appropriate. All P-values are quoted after Bonferroni corrections (where appropriate), and corrected P-values > 0.05 were considered significant.
Results
Intersubject Variability of Positron Emission Tomography Region of Interest Measurements
The intersubject variation of PET measurements in 10 controls and 18 patients are displayed in Table 1 . The intersubject variability was high in both groups of subjects (with CoV ranging from 7.3% to 32.9%). In patients, CBF, CMRO2 and OEF CoV were higher, while CBV CoV was lower than in controls (P>0.001 for all comparisons, unpaired ‘t’-test with Bonferroni correction).
Intersubject variability and within-session reproducibility obtained using an ROI map composed of 15 regions covering the whole brain from a single PET study in 10 controls (C) and 18 patients (P)
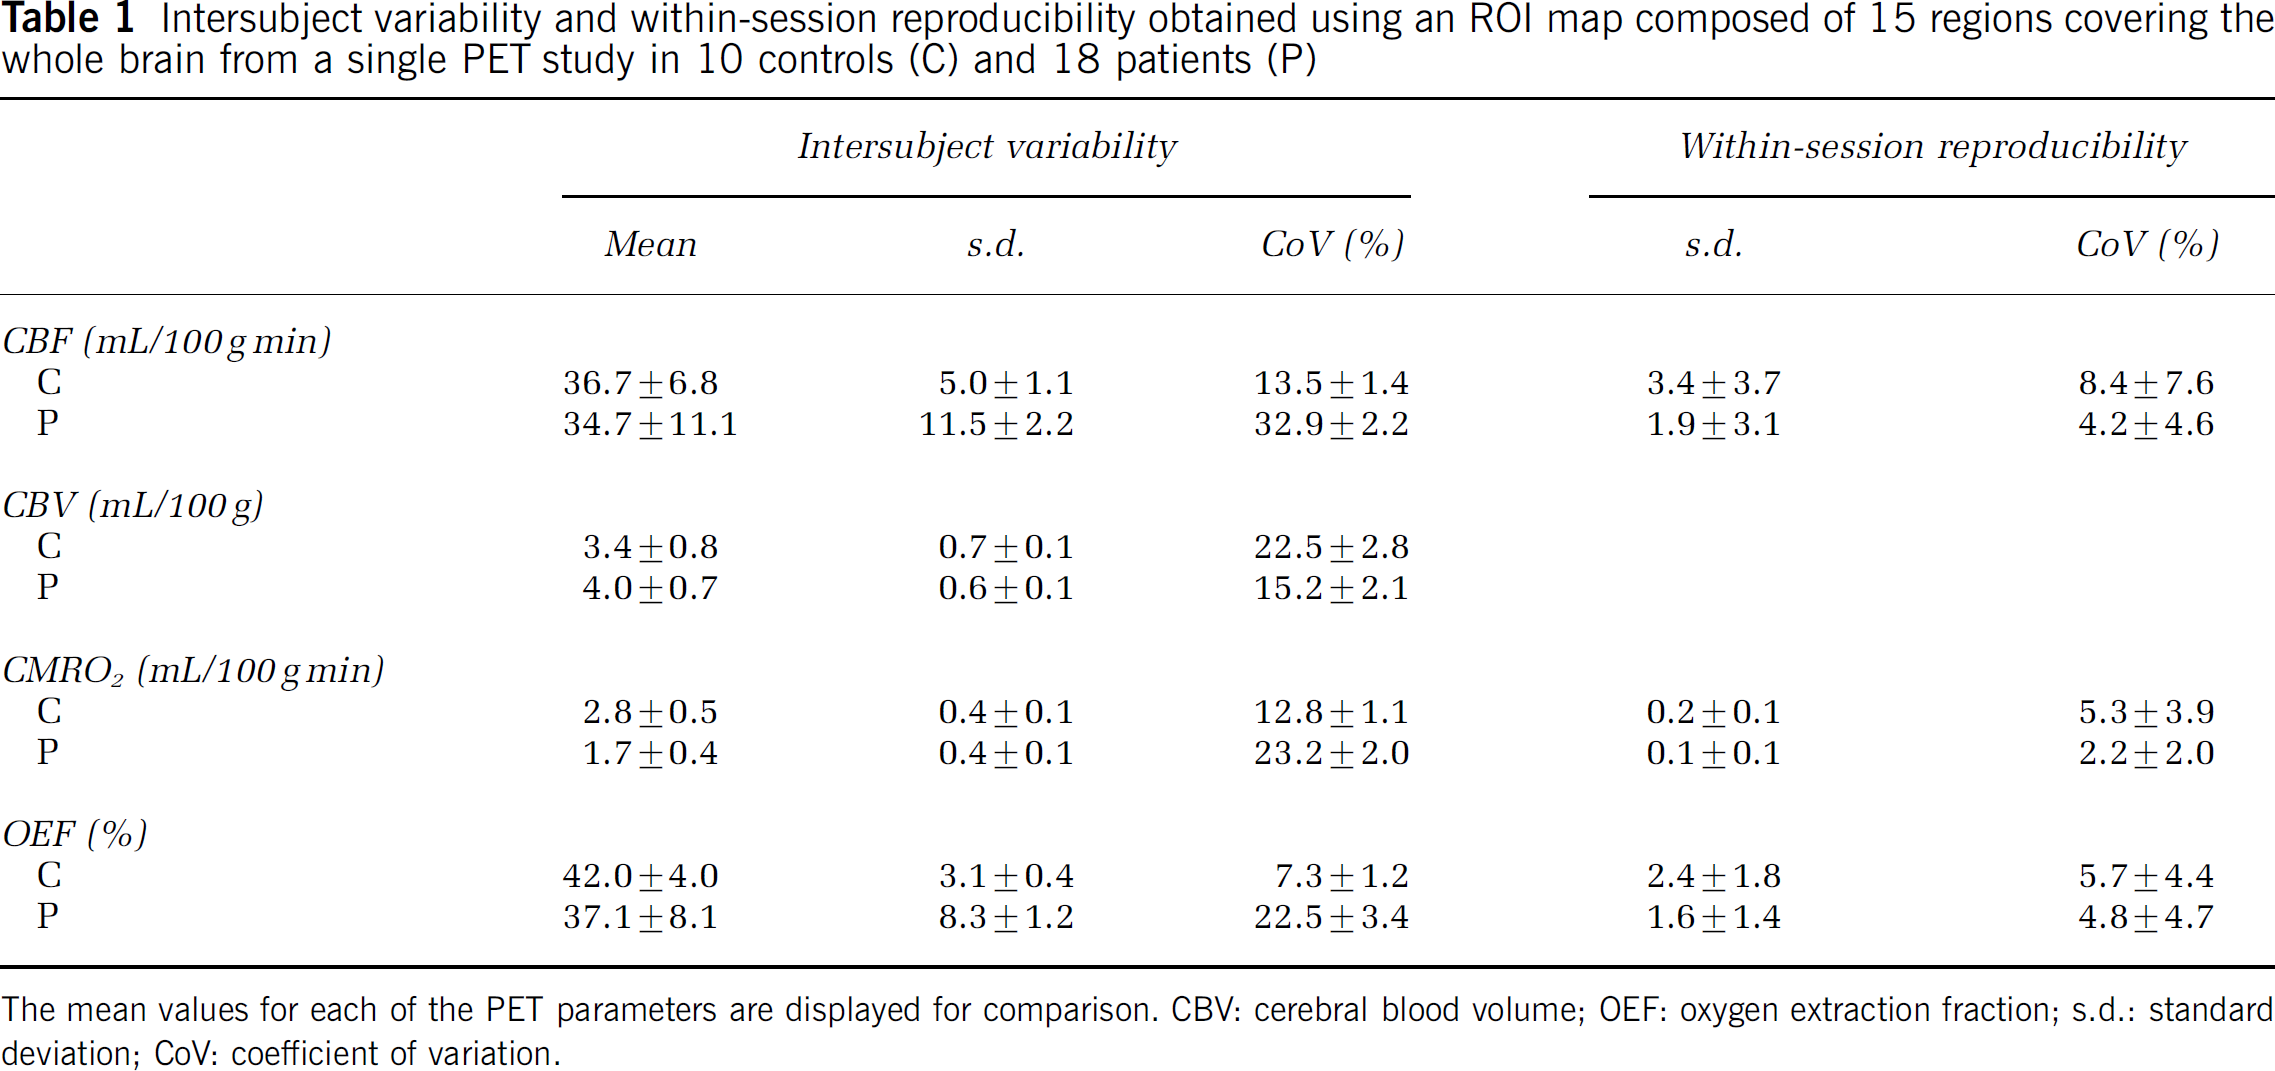
The mean values for each of the PET parameters are displayed for comparison. CBV: cerebral blood volume; OEF: oxygen extraction fraction; s.d.: standard deviation; CoV: coefficient of variation.
Test—Retest and Within-Session Reproducibility of Positron Emission Tomography Region of Interest Measurements
The within-session reproducibility measurements of the 18 patients and 10 controls are shown in Table 1 . The within-session reproducibility was substantially better in both patients and controls when compared with the intersubject variability measurements. However, unlike the situation for intersubject variability, within-session CoV were lower in the patients rather than controls (P0.001 for all comparisons, unpaired ‘t’-test with Bonferroni correction). The comparisons of the test—retest and within-session reproducibility measurements for the cohort of six patients are shown in Table 2 . The within-session CoV for CBF were higher than the test—retest values (P>0.01, paired ‘t’-test with Bonferroni correction), while the measurements for CMRO2 and OEF were similar. Further, the within-session CoV for these six patients were similar to those for the 18 patients shown in Table 1 (all within 5%). In addition, the CoV for CBV test—retest reproducibility measurements are much lower than the intersubject variability (3.8% versus 15.2%).
Test—retest reproducibility of PET data calculated using two sets of parametric images separated by a 10-min interval, and the within-session reproducibility obtained from the first set of parametric images in six patients with head injury using an ROI map composed of 15 regions covering the whole brain
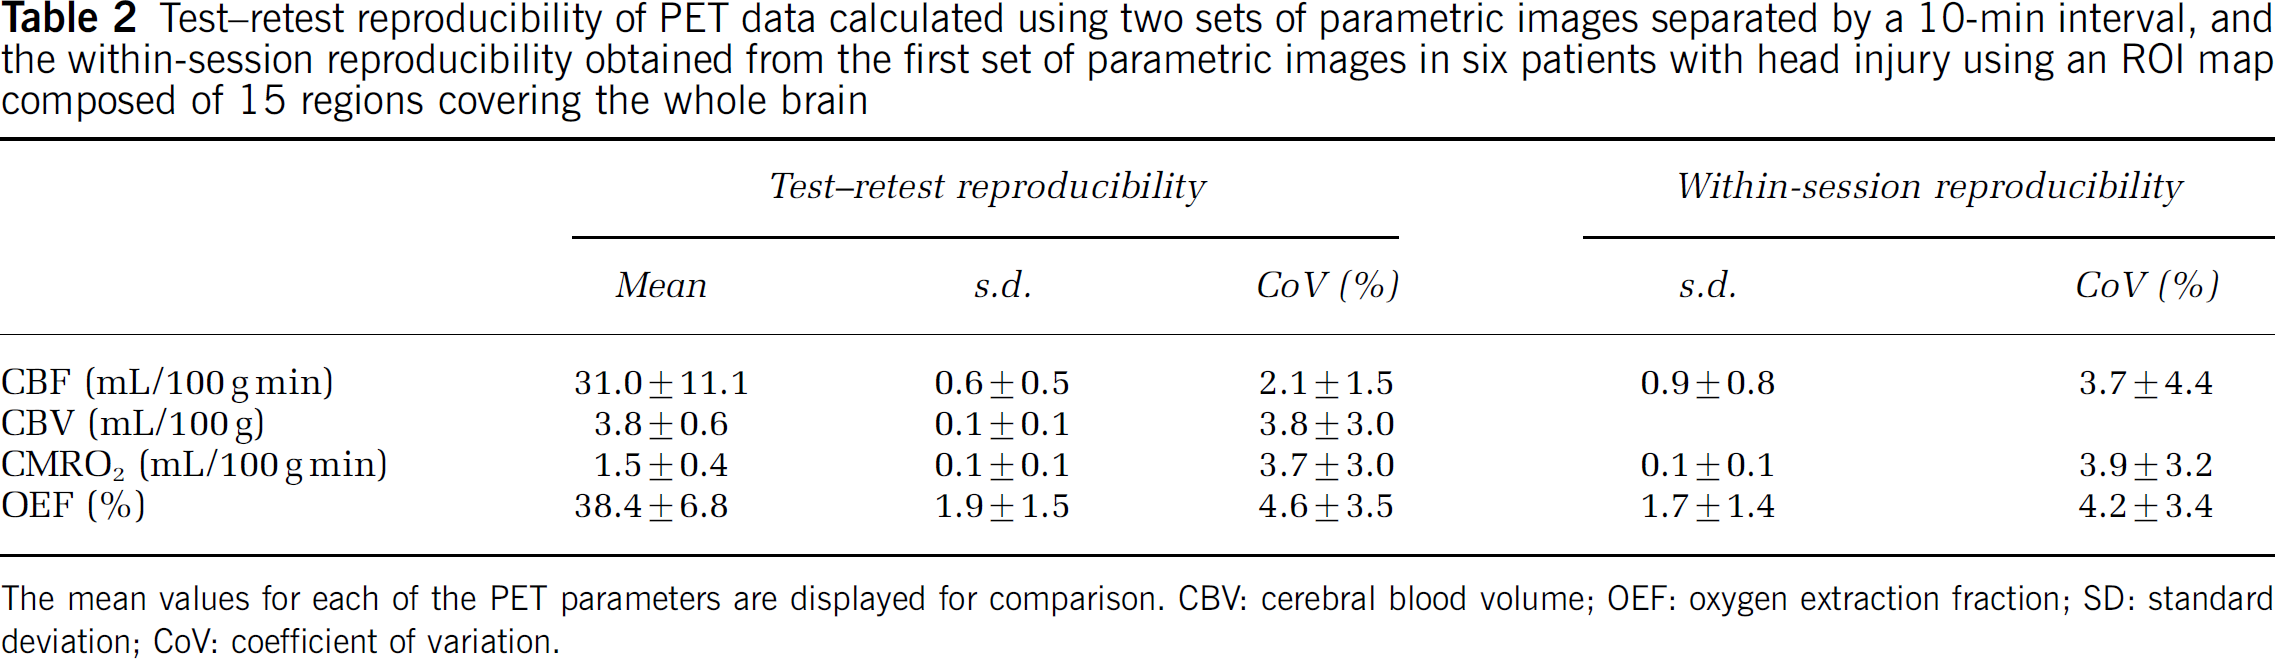
The mean values for each of the PET parameters are displayed for comparison. CBV: cerebral blood volume; OEF: oxygen extraction fraction; SD: standard deviation; CoV: coefficient of variation.
Flow—Metabolism Coupling
The relationships between CBF and CMRO2 using the whole brain data composed of 15 ROIs for each subject in controls and patients are shown in Figures 2A and 3A, respectively. The expected linear relationship was observed across the entire control data set (r=0.72; P>0.0001), and was generally stronger within individual control subjects, with a median (range) correlation coefficient (r) of 0.89 (0.68 to 0.96) and P>0.0001 (0.005 to >0.0001). There was still a significant relationship in patients overall (r= 0.58; P>0.0001), but it was highly variable within individual subjects, with an r value of 0.56 (0.08 to 0.81) and P value of 0.14 (0.0003 to 0.78). The slopes of the regression plots were significantly greater in controls than patients (3.1 versus 1.3, P>0.0001 unpaired ‘t’-test) (Figure 4).
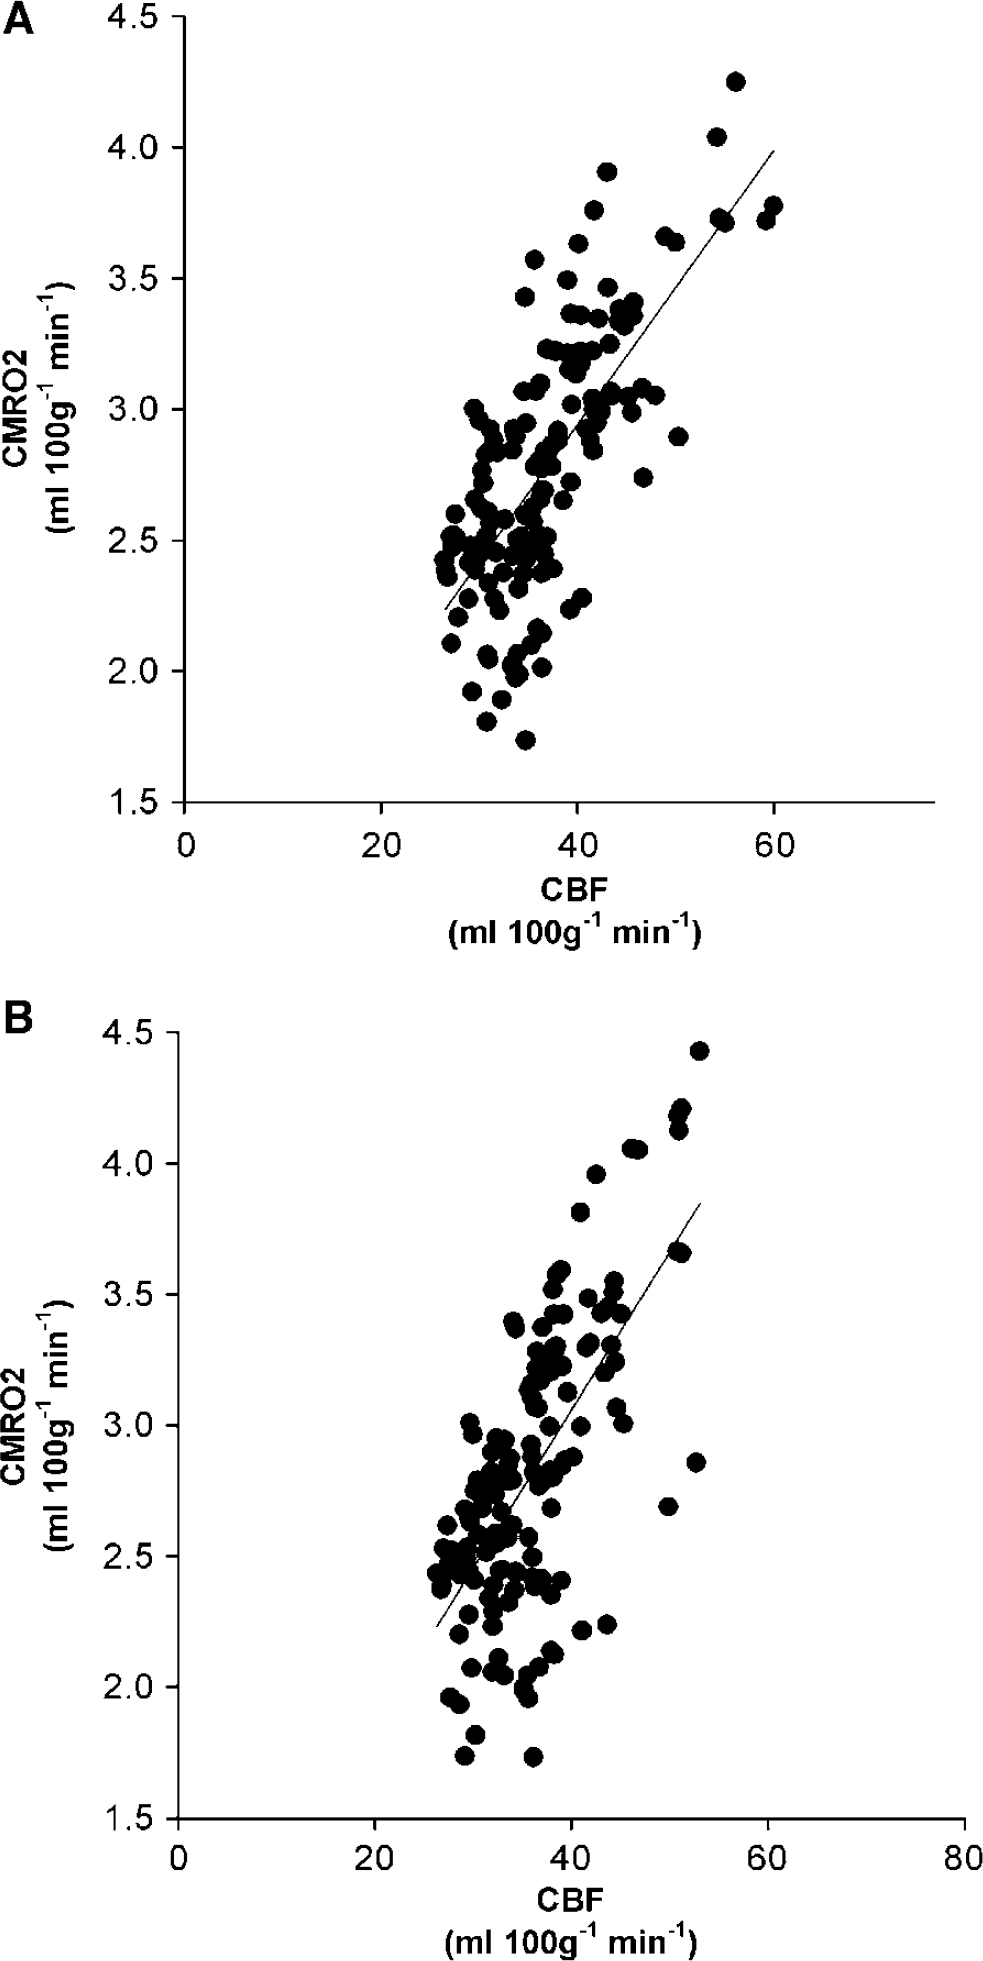
Physiological relationship between blood flow and metabolism in controls. Linear regression plots of the relationship between CBF and CMRO2. (A) Constructed from all the emission and arterial activity data (r=0.72, P>0.0001). (B) Constructed from independent emission and arterial activity data (r=0.67, P>0.0001).
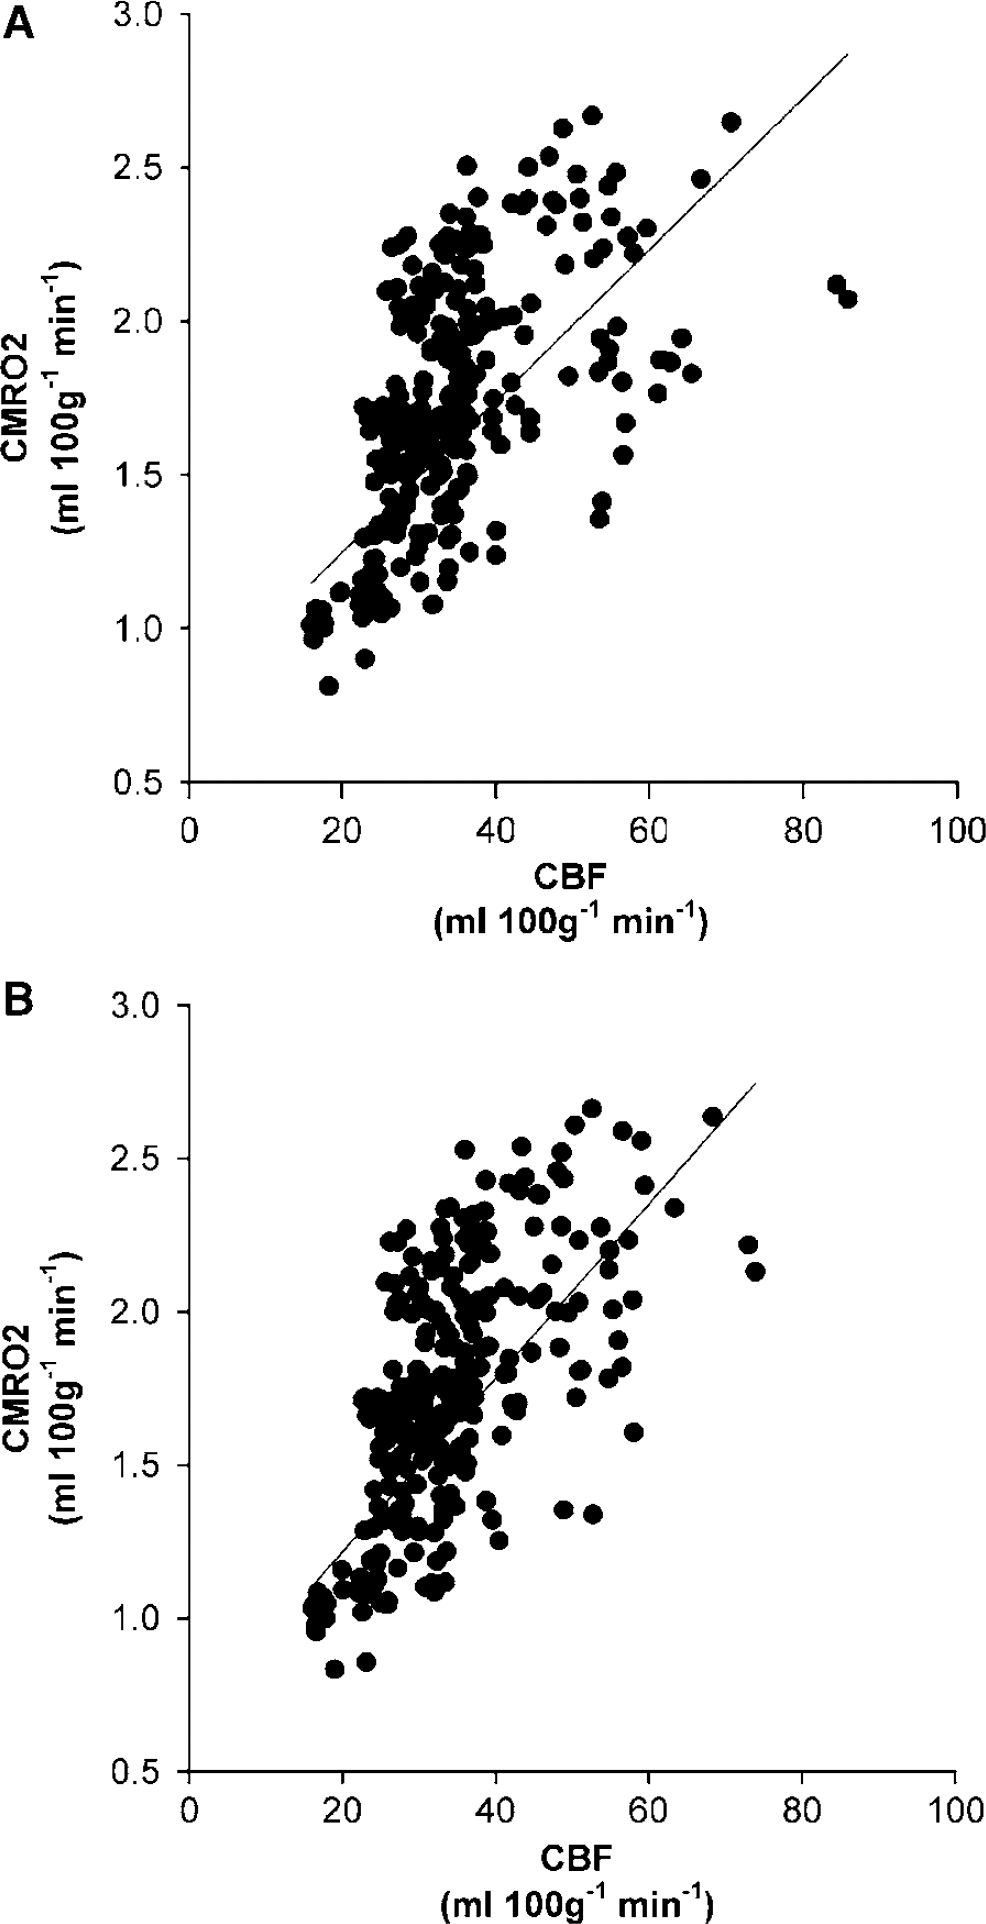
Physiological relationship between blood flow and metabolism in patients. Linear regression plots of the relationship between CBF and CMRO2. (A) Constructed from all the emission and arterial activity data (r=0.58, P>0.0001). (B) Constructed from independent emission and arterial activity data (r= 0.62, P>0.0001).
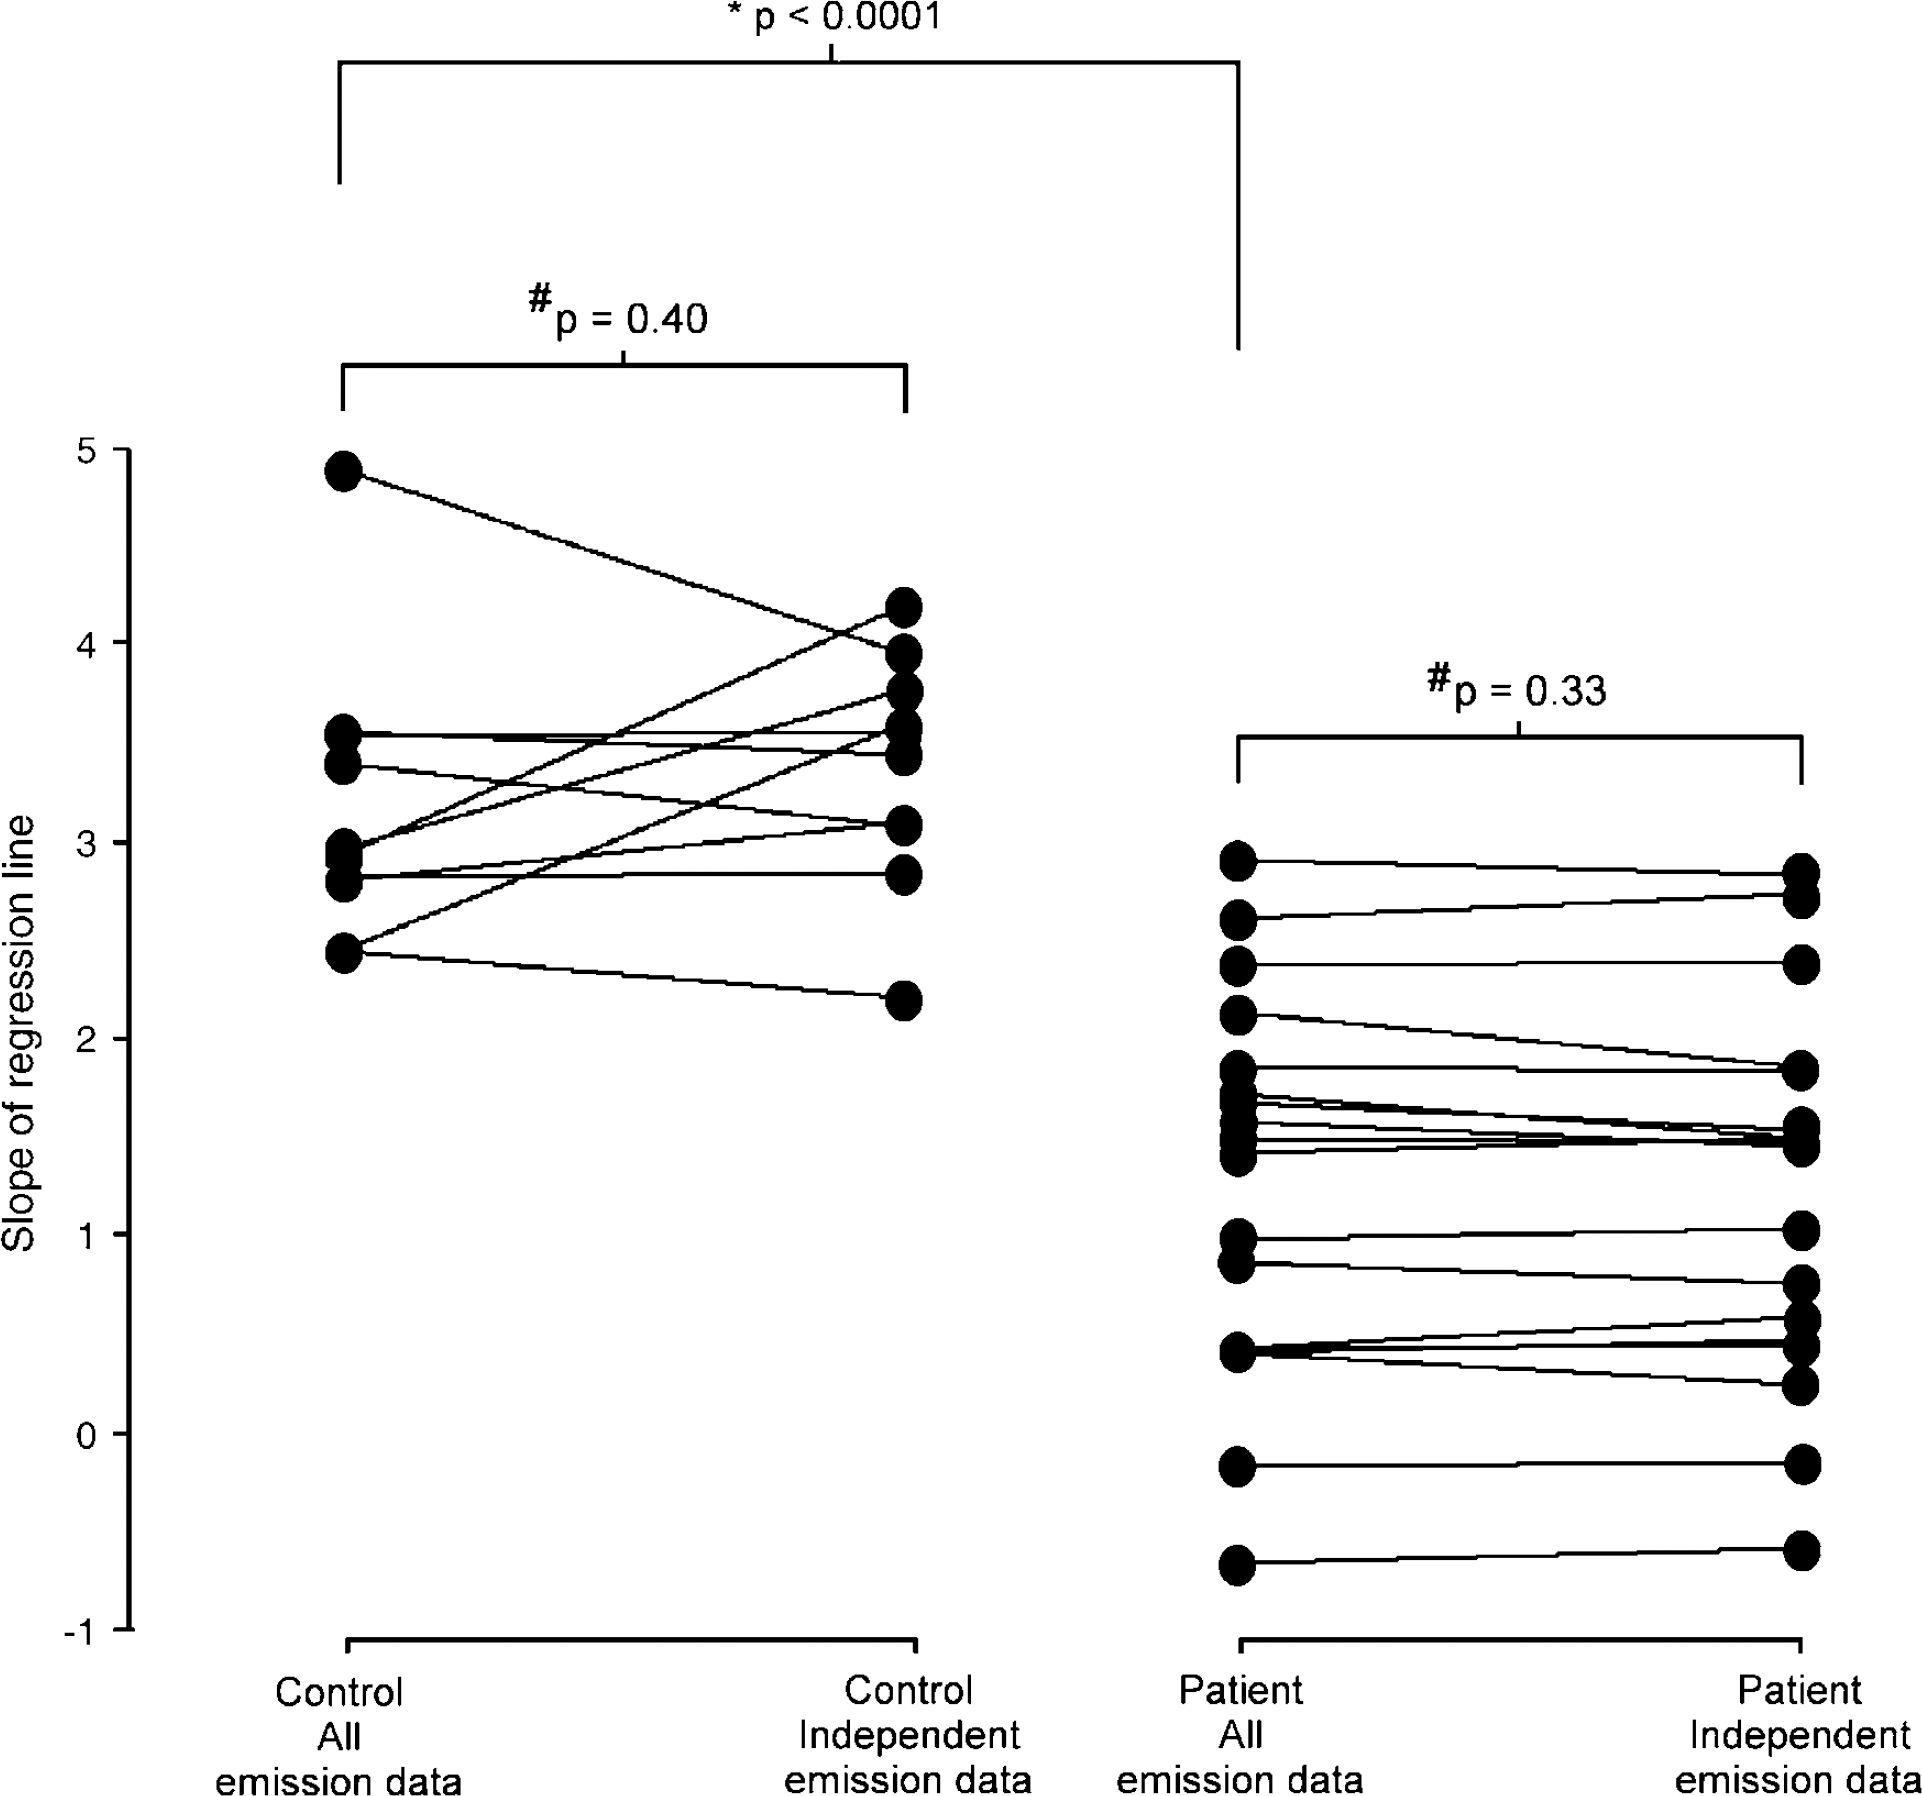
Comparison of slope of linear regression plots of relationship between blood flow and metabolism. Change in slope of the linear regression plots for controls (left panel) and patients (right panel) when CBF and CMRO2 are constructed from all the emission and arterial data, and using truly independent emission and arterial data. *Unpaired ‘t’-test for comparison between patients and controls. #Paired ‘t’-test for comparison within patient and control groups.
Effect of Mathematical Correlation on Flow—Metabolism Coupling
The relationship between CBF and CMRO2 when independent emission data are used is shown in Figures 2B and 3B. There was still a linear relationship across the entire control group (r=0.67, P>0.0001), which, once again, was stronger within individual subjects (median (range) r=0.89 (0.68 to 0.97) and P>0.0001 (0.006 to >0.0001)). For patients, the linear relationship was significant (r=0.62, P>0.0001), but was highly variable within individual subjects (r=0.54 (0.07 to 0.83) and P=0.15 (0.0001 to 0.82)). In both controls and patients the slopes of the regression plots were similar when the PET parameters were constructed from all the emission and arterial data, and independent-emission frames and arterial data (3.1 versus 3.3, P=0.40, and 1.3 versus 1.2, P=0.33, respectively, using paired ‘t’-tests) (Figure 4).
Discussion
This study provides additional reference data on the use of the steady-state 15O PET technique in controls and patients with head injury. Such data should allow meaningful interpretation of disordered physiology in head injury and other pathological disease states. We provide data on the reproducibility of repeated 15O PET measurements under stable physiological conditions. The CoV that we describe might be of clinical use in future 15O PET studies of therapeutic interventions in clinical head injury. In addition, we confirm the physiological relationship between blood flow and metabolism. Importantly, this relationship was similar when using parametric maps constructed from truly independent emission data.
Methodological Issues
In the construction of the parametric maps, we used a small- to large-vessel haematocrit ratio (r) of 0.85 and blood—brain partition coefficient (p) for H215O of 0.95. More recent data on the value of r, using carbon-11 albumin PET, have suggested a global value of 0.69 in health, which would result in an increase in the calculated value of CBV of approximately 20% (Lammertsma et al, 1984). Since there are no data on the effects of pathology, such as acute stroke or head injury, it is difficult to apply such data with confidence. In our institution, a value of 0.85 has been used, to ensure that the results are comparable with those previously published, while accepting that the true value across the injured brain is unknown. Future studies on the regional differences in the value of r in disease states, such as head injury, would improve the accuracy of regional PET-based CBV measurements. In the 15O PET model used in this study, the choice of value for this constant will only affect the absolute value for the calculated CBV. The calculation of CBF does not require measurement of CBV, and the correction for intravascular 15O2 in the calculation of OEF and CMRO2 is independent of r (Frackowiak et al, 1980; Lammertsma et al, 1987). However, in the context of interventional PET studies, it is clearly possible that changes in vasoreactivity may lead to global and or regional changes in the value of r, which will reduce the measured accuracy of changes in CBV after a therapeutic intervention.
Despite publications that have suggested a value for p of 0.86 (Lammertsma et al, 1992), its true value remains unknown (Herscovitch and Raichle, 1985; Lammertsma et al, 1981), particularly within pathological disease states such as head injury. In our institution, a whole brain value of 0.95 mL/mL has been used, based on in vitro data (Herscovitch and Raichle, 1985), while recognising that the values for grey and white matter differ. In analysing the data in this paper, we choose to use relatively large mixed ROIs incorporating both grey and white matter. In addition, the resolution of the CT and PET images obtained, and the presence of significant structural and physiological abnormalities, precluded accurate segmentation of ROIs into grey and white matter.
The data in this study included a group of patients with head injury and a group of age-matched controls. Research from other centres using an 15O PET technique similar to that used in our centre have demonstrated that CBF and CMRO2 decline with age (Leenders et al, 1990; Frackowiak et al, 1980; Lebrun-Grandie et al, 1983). Both groups of subjects included in this paper show a wide range of age, which will cause an increase in measured intersubject variability within the individual subject groups. Despite this, the similar age range means that comparison can be made between the two representative groups. We explored the effect of age on variability in our control and clinical population, but were unable to find any statistically significant association. However, our sample sizes are small, and we might have missed associations that might be detected in larger samples. It is important to remember that age is an important determinate of cerebral physiology, and allowance for this fact should be made when comparing data between different subject groups.
We were able to assess the reproducibility of PET measurements of CBF, CBV, CMRO2 and OEF using the steady-state method. We have shown that there is a wide variation in cerebrovascular physiology measured using steady-state 15O PET, both in healthy controls and patients with head injury. Such variability has been shown previously (Leenders et al, 1990) and implies that real changes between patient groups will only be identified when either the differences are large or large groups of subjects are studied. Such studies are extremely difficult in fields such as acute head injury, where data are usually obtained in small groups of patients. The few PET studies published in head injury have typically been used to examine the effect of clinical interventions within small groups of patients (Coles et al, 2002, 2004; Diringer et al, 2000, 2002). It is useful to consider the sources of variability in PET data in the setting where we are trying to address the significance of changes between normal physiology and disease states, or changes that are the consequence of an intervention. In the first case, the relevant sources of error are the intersubject variability in the patient and control groups. Our data are broadly concordant with results from other groups (Diringer et al, 2000; Leenders et al, 1990), and show that these are high, with CoV ranging from 7.3% for OEF to 22.5% for CBV in controls. To be certain that PET values derived from an individual patient are significantly abnormal, with a confidence of 95%, these figures suggest that we need to have CBF values (for example) that are at least 27% lower than control means. This estimate, and the secure distinction of a patient group as abnormal, is further confounded by the even higher intersubject CoV in patients with head injury (15.2% to 32.9% for CBV and CBF, respectively). These figures underline the difficulty of using PET in small groups of patients who have variable pathophysiology, as is the case with head injury. In practice, however, estimated sample sizes in such studies are moderated by the fact that the changes in cerebrovascular physiology in disease are often dramatic, and significance is often detected with manageable numbers, despite the large intersubject variability in control and patients groups.
However, it is important to point out that these figures are largely irrelevant when considering the power and design of interventional studies, when PET is being used to monitor changes in cerebral physiology under conditions of comprehensive monitoring and control of systemic physiology. In such settings, the subject is his or her own control, and the relevant parameter is intrasubject variability or reproducibility. We addressed this issue for patients with head injury by obtaining test—retest reproducibility measurements in a group of six patients under conditions of unchanged physiology. Our data show that these figures for CoV are much smaller than those obtained from the discussion in the previous paragraph (Tables 1 and 2), and provide reference data for CBF, CBV, CMRO2 and OEF reproducibility for the head-injured population as a whole.
While these data are extremely useful, we realised that it would be helpful to have a measure of variability within each individual subject who participated in an interventional study. The acquisition of 15O PET data in two frames provided the opportunity of using individual frames to calculate two independent sets of metabolic images, which could be used to assess reproducibility within the context of a single preintervention baseline PET study (within-session reproducibility). However, using this technique, we were unable to determine the within-session reproducibility for CBV, since the data were calculated from a single 5-min frame acquired after a bolus administration of C15O. In addition, as the data were not acquired using separate radioisotope administrations, it might be argued that the intrasubject variability in actual interventional studies could be slightly higher. We therefore compared assessments of reproducibility obtained using these two approaches: the test—retest reproducibility (obtained from two independent studies) and the within-session reproducibility (acquired using the two independent frames within a single study). In the six subjects who underwent two separate PET studies, the test– retest measurements were comparable to the within-session reproducibility measurements (Table 2). In addition, the data were similar to the within-session reproducibility measurements calculated from the initial 18 patients (Table 1). This is an important finding and implies that, in patients with head injury, the within-session reproducibility of the baseline steady-state 15O PET image can be used to assess the significance of any change in physiology after a therapeutic intervention. The small changes seen between the within-session and test—retest reproducibility probably reflect the fact that only using the emission data from one 5-min frame to calculate the data dictates that the signal-to-noise characteristics of the images produced are worse. This, by definition, will increase the degree of spread of voxel values, and was probably responsible for the significant increase in the CoV for CBF found between the test—retest and within-session reproducibility measurements.
These data provide guidance for designing interventional studies in volunteers, and suggest that it should be possible to detect differences of approximately 10% to 15% with confidence. Indeed, the tight control of systemic physiology that we achieved in patients means that it should be possible to detect changes of 5% to 10% in physiological variables (Tables 1 and 2). Clearly, such estimates only strictly apply to our institution and our study populations, but they provide a useful starting point for study design. There are a large number of factors particular to our scanning protocols and institutional setup that limit the use of the reproducibility measurements that we provide. These include, but might not be limited to, such factors as the 15O PET model used, scanner, acquisition protocols, data correction and reconstruction, and processing. Despite these intercentre variations, it should be possible for other groups to use the methodology that we describe to derive ‘in-house’ data for their studies. In addition, it is important to acknowledge that as the steady-state 15O model is nonlinear (Baron et al, 1989; Lammertsma et al, 1981), particularly in states of increased blood flow, it is best suited to the assessment of conditions of low or decreased flow, such as occur after the acute phase of stroke or severe head injury. While we have no data to address this issue, it is highly likely that, in states of increased flow, there might be an increase in the variability of measurements.
It is also important to acknowledge that we did not acquire any test—retest measurements in controls, and therefore are unable to formally compare the within-session reproducibility measurements in this group of subjects. However, any differences between the assessments of reproducibility using the techniques described here should be entirely related to the technique applied and not be patient or group specific. Although our approach to defining reproducibility using within-session reproducibility could theoretically underestimate the true variability, the data that we present do not support this. In fact, the within-session reproducibility might be a conservative estimate of reproducibility due to errors induced by the decrease in the signal-to-noise characteristics of the data used to construct the parametric data. In addition, although these data provide guidance for designing interventional studies in volunteers, the steady-state 15O PET technique would be difficult to apply to such studies due to the relatively long time required to complete a single imaging session (∼60 mins). While such studies are possible, they require subjects to remain stationary and maintain stable physiology during each separate image sequence.
Finally, a more conservative estimate is required when we discuss the ability of PET to detect changes in physiology on serial images obtained at two separate sessions without tight control of physiology. An example would be serial PET studies over time, or when baseline and postinterventional data are obtained on two separate days or imaging sessions. While we have no direct data on this, it is reasonable to assume that the figure that characterises variability in this third setting lies between the intersubject variability and intrasubject variability that we have discussed above.
The correlation between blood flow and metabolism that we present in controls is in agreement with current understanding of physiological mechanisms in health. Blood flow and metabolism are closely related, which dictates that the OEF is similar across the different regions of the brain. This indicates that blood flow is locally adjusted to the underlying metabolic demand, and is in agreement with previous PET studies (Leenders et al, 1990; Lebrun-Grandie et al, 1983). As expected, in controls, the slope of the regression line was greater and there was less variability in the relationship than in patients with head injury. Despite these findings, it is important to realise that the relationships between such PET parameters might be positively biased by common variables within their calculation (Frackowiak et al, 1980). Such effects may become particularly significant in disease states where relationships between blood flow and metabolism are clearly disordered. We were able to examine the potential magnitude of such errors in healthy controls and patients using separate data for H215O and 15O2 emissions. We found that the relationship between blood flow and metabolism was broadly unchanged. In fact, the small changes induced were more likely the result of a reduction in the signal-to-noise characteristics of the emission data, and produced a wider spread of data values. These data confirm previous reports using 15O PET and allow some security in the interpretation of data that suggest changes in such physiological relationships with disease processes. However, in disease states where physiological relationships might be absent or poorly defined, it would seem prudent to consider the potential effects of mathematical correlation between physiological variables calculated using the 15O PET technique. Despite the obvious reduction in the signal-to-noise ratio imposed by the use of independent emission data, the technique we report is able to assess the clinical significance of mathematical correlation on important physiological relationships.
Conclusions
We believe that these findings have important clinical implications. They provide additional reference data by which to interpret pathophysiological derangements induced by a variety of disease states, including traumatic brain injury. In addition, the data on reproducibility of the technique will inform future interventional studies using PET. While ideally each centre should develop its own bank of such data, the figures provided will allow initial generic approximations of sample size for such studies.
Footnotes
Acknowledgements
The authors thank the members of the Wolfson Brain Imaging Centre for all their help in conducting these studies.