
Abstract
In an effort to elucidate the molecular mechanisms underlying cerebral vascular alteration after stroke, the authors measured the spatial and temporal profiles of blood–brain barrier (BBB) leakage, angiogenesis, vascular endothelial growth factor (VEGF), associated receptors, and angiopoietins and receptors after embolic stroke in the rat. Two to four hours after onset of ischemia, VEGF mRNA increased, whereas angiopoietin 1 (Ang 1) mRNA decreased. Three-dimensional immunofluorescent analysis revealed spatial coincidence between increases of VEGF immunoreactivity and BBB leakage in the ischemic core. Two to 28 days after the onset of stroke, increased expression of VEGF/VEGF receptors and Ang/Tie2 was detected at the boundary of the ischemic lesion. Concurrently, enlarged and thin-walled vessels were detected at the boundary of the ischemic lesion, and these vessels developed into smaller vessels via sprouting and intussusception. Three-dimensional quantitative analysis of cerebral vessels at the boundary zone 14 days after ischemia revealed a significant (P < 0.05) increase in numbers of vessels (n = 365) compared with numbers (n = 66) in the homologous tissue of the contralateral hemisphere. Furthermore, capillaries in the penumbra had a significantly smaller diameter (4.8 ± 2.0 μm) than capillaries (5.4 ± 1.5 μm) in the homologous regions of the contralateral hemisphere. Together, these data suggest that acute alteration of VEGF and Ang 1 in the ischemic core may mediate BBB leakage, whereas upregulation of VEGF/VEGF receptors and Ang/Tie2 at the boundary zone may regulate neovascularization in ischemic brain.
Keywords
Vascular endothelial growth factor (VEGF) and its tyrosine kinase receptors, VEGFR-1 and VEGFR-2, are required for normal development of the embryonic vascular system (Ferrara, 1995; Carmeliet and Collen, 1997; Yancopoulos et al., 2000). VEGF is also a potent vascular permeability factor that increases microvascular permeability to blood plasma proteins within minutes of exposure (Dvorak et al., 1995).
Angiopoietins (Ang 1 and Ang 2) are ligands for the endothelial-specific receptor tyrosine kinase, Tie 2 (Davis et al., 1996; Yancopoulos et al., 2000). VEGF is mitogenic for endothelial cells and functions during the earliest stages of vascular development, whereas Ang 1 plays a role in the mutation of newly formed vessels (Ferrara, 1995; Carmeliet and Collen, 1997; Yancopoulos et al., 2000). Ang 2 serves as a natural inhibitor of Ang 1 activity (Davis et al., 1996; Maisonpierre et al., 1997; Yancopoulos et al., 2000). Therefore, the angiopoietins work in concert with VEGF and other angiogenic factors to promote vascular formation. Recent studies demonstrate that, in addition to its effects on angiogenesis, Ang 1 protects the adult vasculature from vascular leakage (Thurston et al., 1999, 2000). Overexpression of Ang 1 inhibits vascular leakage induced by VEGF or inflammatory agents, suggesting that Ang 1 counters the effect of VEGF on vascular permeability (Thurston et al., 1999, 2000).
Expression of VEGF is regulated by local oxygen concentration, and hypoxia increases expression of VEGF (Marti et al., 2000). In contrast, Ang 1 is downregulated by hypoxia (Levy et al., 1995; Enholm et al., 1997; Mandriota and Pepper, 1998). Transient and permanent middle cerebral artery (MCA) occlusion in rat evokes upregulation of VEGF/VEGF receptors and Ang/Tie 2 (Hayashi et al., 1997; Cobbs et al., 1998; Lennmyr et al., 1998; Plate et al., 1999; Beck et al., 2000; Lin et al., 2000). However, how expression of VEGF/VEGF receptors and Ang/Tie 2 is related spatially and temporally to the evolution of the blood–brain barrier (BBB) disruption and angiogenesis after stroke has not been completely described. Elucidation of the correlation between expression of these angiogenic growth factors and BBB disruption and angiogenesis will be useful in efforts toward developing therapeutic interventions for treatment of brain injury.
MATERIALS AND METHODS
All experimental procedures have been approved by the Care of Experimental Animals Committee of Henry Ford Hospital.
Animal model
Male Wistar rats (n = 75) weighing 300–350 g were anesthetized with halothane (1%–3.5% in a mixture of 70% N2O and 30% O2) using a face mask. The MCA was occluded by placement of a single intact fibrin-rich 24-hour-old homologous clot (approximately 1 μL) at the origin of the MCA (Zhang et al., 1997). After MCA occlusion, all rats exhibited neurologic deficits, including turning to the left (Zhang et al., 1997). Rats were killed at 1 hour to 28 days after MCA occlusion. Nonoperated rats were used as a control group.
Measurements of BBB leakage
To detect changes of the BBB leakage, Evans blue dye (1 mL of 2%, Sigma) was administered to rats before MCA occlusion so that cerebral microvessels were perfused with blood containing the dye. The rats were killed at 4 hours after embolization. Fluorescein isothiocyanate (FITC)–dextran was administered 1 minute before rats were killed. Intravenous Evans blue binds rapidly to serum albumin (Zhang et al., 1999b). Extravasation of the Evans blue indicates passage of albumin through the BBB into the parenchyma during 4 hours of MCA occlusion. In contrast, the FITC–dextran, which has a particle size of 27 nm, is present only in perfused vessels that were not blocked after MCA occlusion, and extravasation of the FITC–dextran indicates disruption of the BBB at one time point (Zhang et al., 1999b). Evans blue and FITC–dextran emit red and green fluorochrome, respectively, and thus permitted measurement of plasma-perfused (yellow color, Evans blue, and FITC–dextran) and non–plasma-perfused microvessels (red, Evans blue only) in three dimensions after MCA occlusion. Because Evans blue excitation and emission frequencies are within the spectrum of Cy 3 and Cy 5, rats receiving Evans blue dye were not used for double immunofluorescent staining.
Tissue preparation
For paraffin sections, brains were fixed in 10% buffered formalin and embedded in paraffin. Six-micrometer-thick coronal sections were cut and stained with hematoxylin and eosin for histopathologic evaluation. Frozen sections: Brains were embedded in Tissue-Tek OCT compound (Miles, Inc., Elkhart, IN, U.S.A.), frozen in 2-methylbutane (Fisher Scientific, Itasca, IL, U.S.A.), and cooled on dry ice. Coronal brain sections (8-μm thick) were cut on a cryostat, and thaw-mounted onto gelatin-coated slides. For vibratome sections, brains were fixed in 4% of paraformaldehyde at 4°C for 48 hours. Coronal sections (100 μm) were cut on a vibratome. A coronal section from the center of ischemic core (section D; bregma −0.8 mm) was used for immunohistochemical staining (Zhang et al., 1999b).
Reverse transcription–polymerase chain reaction
Reverse transcription–polymerase chain reaction was carried out on total RNA according to our previous method (Zhang et al., 1999b, 2001b). Primers used to detect VEGF, VEGFR-1, VEGFR-2, Ang 1, Ang 2, Tie 1, Tie 2, and hypoxia inducible factor-α (HIF-1α) are listed in the Table 1. Initially, reactions containing RNA (2 μg), RNase inhibitor (40 U), and oligo-dT (1 μg) were constituted to 20 μL with diethylpyrocarbonate-treated water and heated to 70°C for 10 minutes and then chilled on ice. Thereafter, final concentrations of dNTP (adenosine, cytidine, guanosine, and thymidine triphosphate; 200 μmol/L), reverse transcription–Moloney murine leukemia virus (40 U), and reverse transcription–buffer (1X) were added in a total volume of 40 μL, and the reactions were incubated at 37°C for 60 minutes. Reverse transcription–enzyme was inactivated by heating to 94°C for 5 minutes and chilling on ice. Aliquots (8 μL) of the cDNA reaction were used for PCR amplification. The samples were denatured at 95°C for 2 minutes and then amplified for 40 cycles. Each cycle consisted of denaturation at 95°C for 30 seconds, annealing at 52°C for 30 seconds, and extension at 72°C for 2 minutes. The samples (30 μL per well) were electrophoresed using 1X TAE (Tris-HCl, acetic acid, EDTA) Buffer on 1.5% agarose containing ethidium bromide.
Primers for reverse transcription–polymerase chain reaction
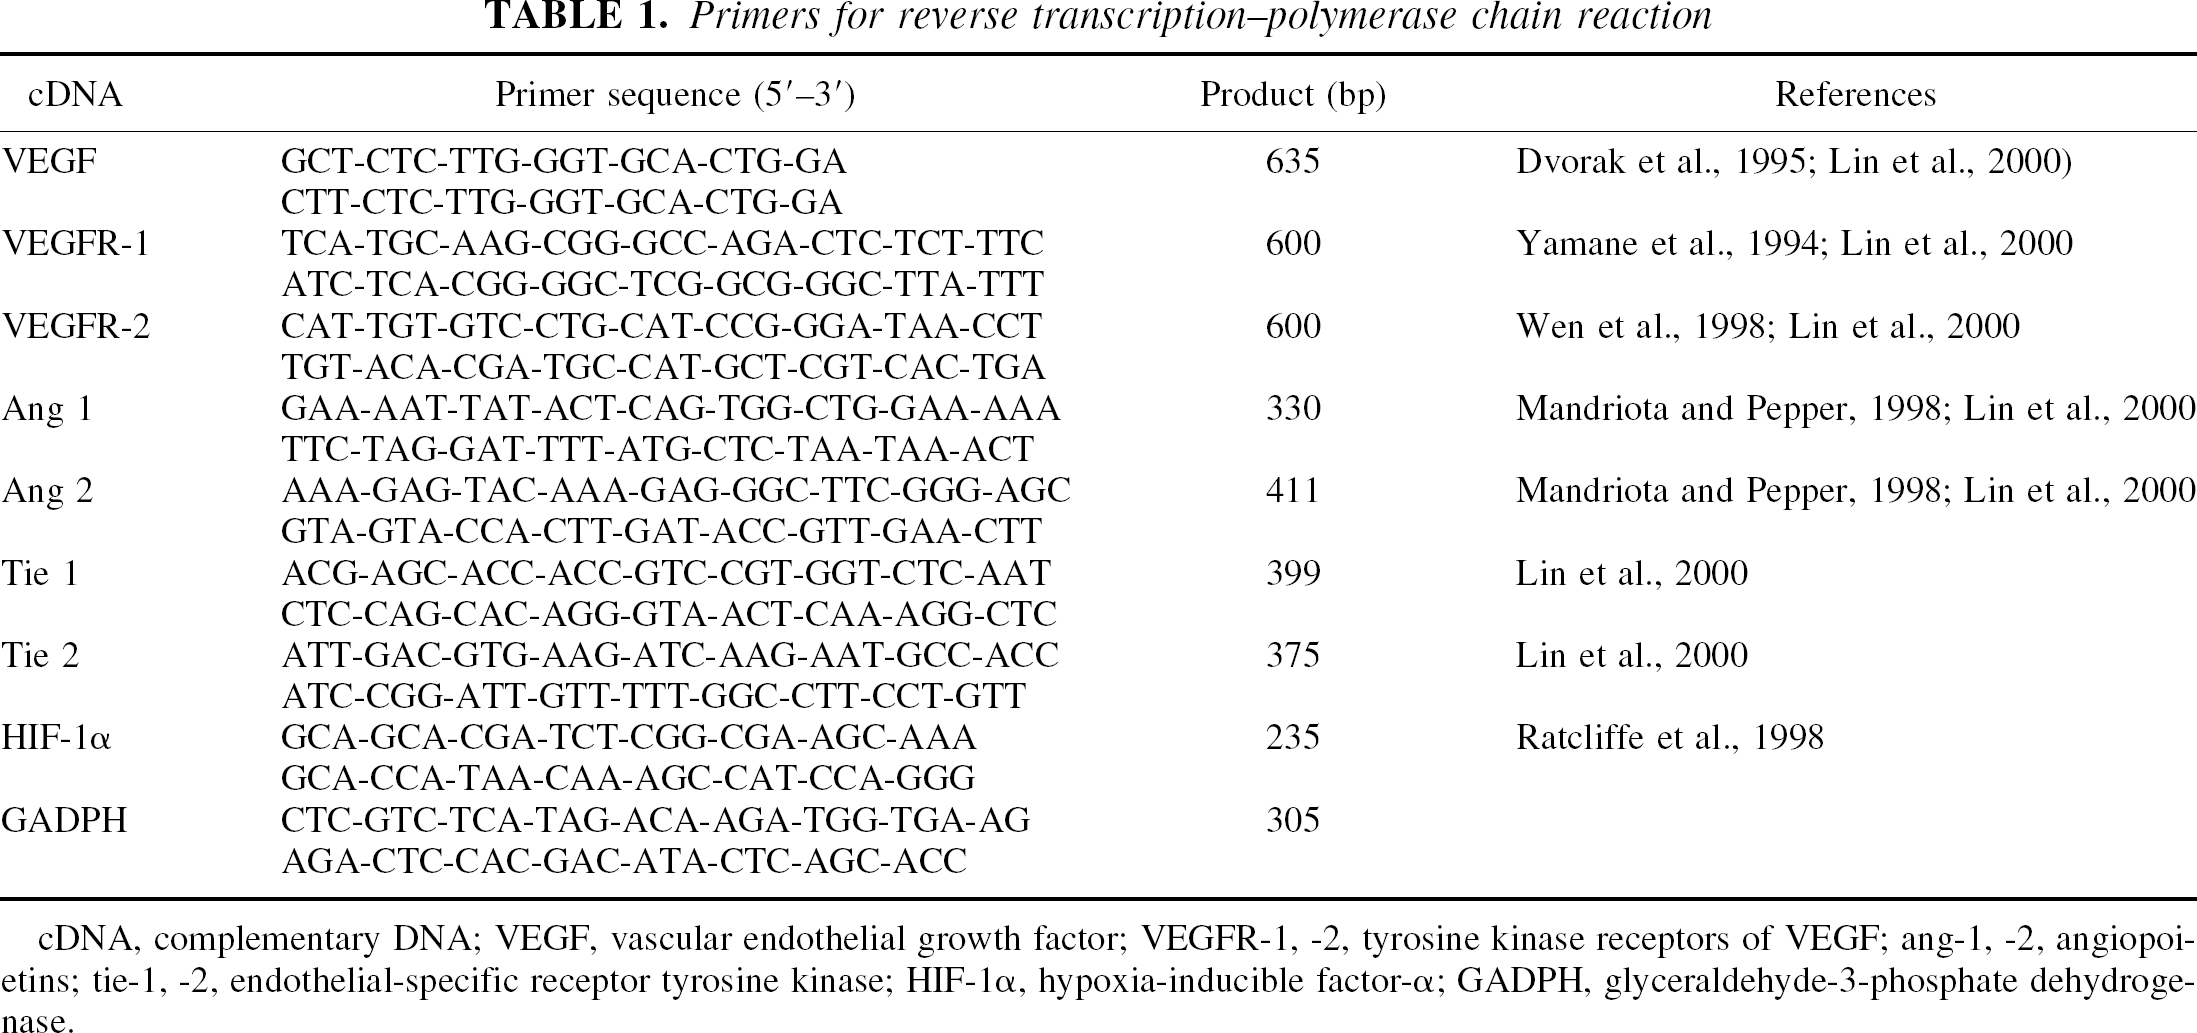
cDNA, complementary DNA; VEGF, vascular endothelial growth factor; VEGFR-1, −2, tyrosine kinase receptors of VEGF; ang-1, −2, angiopoietins; tie-1, −2, endothelial-specific receptor tyrosine kinase; HIF-1α, hypoxia-inducible factor-α; GADPH, glyceraldehyde-3-phosphate dehydrogenase.
Immunohistochemistry
A goat polyclonal antibody against VEGF (Santa Cruz Biotechnology, Inc., Santa Cruz, CA, U.S.A.) and rabbit polyclonal antibodies against VEGFR-1 and VEGFR-2 (Santa Cruz Biotechnology) were used. Coronal sections (6-μm thick, bregma −0.8 mm) (Paxinos and Watson, 1986) from paraffin-embedded tissue were incubated with the antibody against VEGF (1:200) and coronal sections (8-μm thick, bregma −0.8 mm) (Paxinos and Watson, 1986) from frozen fixed tissue were incubated with the antibodies against VEGFR-1 (1:50) and VEGFR-2 (1:100). The immunoreactivity was visualized with diaminobenzidine. For immunofluorescence, 100-μm-thick vibratome sections were incubated with primary antibodies against VEGF (1:100) and with Cy 5 conjugated secondary antibodies (Vector, Burlingame, CA, U.S.A.). The specificity of VEGF immunoreactivity was confirmed by using the anti-VEGF antibody absorbed with an excess of VEGF peptide (Santa Cruz Biotechnology) for 3 days at 4°C.
Quantitative measurements of vascular perimeters
Each von Willebrand Factor (vWF) immunostained coronal section was digitized under a 20x or 40x objective (BX40; Olympus Optical Co. Ltd., Nagano, Japan) for measurement of perimeters of vWF immunoreactive vessels (Zhang et al., 1999b) using a 3-CCD color video camera (DXC-970MD; Sony Corp., Tokyo, Japan) interfaced with MCID image analysis system (Imaging Research, St. Catharines, Ontario, Canada).
Three-dimensional image acquisition
The vibratome sections were analyzed with a Bio-Rad MRC 1024 (argon and krypton) laser-scanning confocal imaging system mounted onto a Zeiss microscope (Bio-Rad, Cambridge, MA, U.S.A.) (Zhang et al., 1999b). With the Evans blue and FITC-perfused tissue samples, vibratome sections were scanned throughout the entire coronal section in 512 × 512-pixel (1,042.4 × 1,042.4 μm) format in the x-y direction using a 4X frame-scan average, and 16 optical sections along the z-axis with a 5-μm step-size under a 10x objective were acquired with two separate photomultiplier tubes. For FITC-dextran–perfused tissue stained with the anti VEGF antibody (Cy5), FITC (FITC-dextran–perfused microvessels) and Cy5 fluorochromes on the sections were excited by a laser beam at 488 nm and 647 nm, respectively, and emissions were simultaneously acquired with two separate photomultiplier tubes through 522-nm and 680-nm emission filters, respectively. Areas of interest on the ipsilateral and homologous areas on the contralateral side were scanned with a 40x oil immersion objective lens with a numerical aperture of 1.3 in 512 × 512 pixel (260.6 × 260.6 μm) format in the x-y direction using a 4x frame-scan average. Twenty thin optical sections along the z-axis with 1-μm step size were acquired. The tissue volume or image size was 260.6 × 260.6 × 20 μm.
Three-dimensional image analysis
For measurements of Evans blue leakage, FITC-dextran–perfused vessels and VEGF immunoreactivity, the MCID system (Imaging Research) was used to process confocal images from the laser scanning confocal microscopy (Zhang et al., 1999b). All images were imported into the system as individual 256-gray-scale, TIF format images. The MCID system reconstructed in RAM memory a full three-dimensional model of the original tissue block. Each x,y,z point received its own memory location. Two composite three-dimensional images were reconstructed from the distributions of FITC–dextran. For the tissue samples with FITC–dextran and VEGF immunoreactivity, two sets of three-dimensional images were constructed, each one representing the distribution of a different fluorescent marker. A fixed gray-scale display cutoff was then applied to the model to ensure that the three-dimensional reconstruction was an accurate rendering of the original tissue-staining pattern. The total volume of staining present in the rendered cube of tissue was then calculated in cubic micrometers and divided by the total tissue volume to determine the percentage of tissue volume that was fluorescently marked.
For extracting three-dimensional (3D) quantitative measures of cerebral microvessels perfused by FITC–dextran, a computerized method and software has been developed, which is called three-dimensional vessel quantification (3DVQ) (Soltanian-Zadeh et al., 2001). The quantitative measurements of blood vessels performed by 3DVQ include measuring vessel diameters, vascular branching points, and lengths of vascular segments. The software has been developed using state-of-the-art algorithms for noise suppression, image segmentation, skeletonization (Shahrokni et al., 2001), voxel coding, branch labeling, and image quantitation. The noise suppression algorithm benefits from adaptive and nonlinear methods such as median filtering. The image segmentation method is based on adaptive thresholding and 3D connectivity. The voxel coding algorithm generates two voxel code fields: boundary-seeded field and single-seeded field. These fields are generated using approximation of the Euclidean distances of the vessel voxels from the boundary voxels and a single reference point (e.g., a branching point), respectively. Using the results, the software defines clusters of voxels that are equidistance from the reference point. This is accomplished by finding sets of connected voxels that have the same single-seeded code. Then it determines the skeleton or the medial axis of the vessel by traversing all the clusters in the vessel and obtaining their medial points with respect to the vessel boundary. The software labels the voxels and branches during the progressive medial-point-extraction process. In this procedure, all medial points of a vessel branch get the same label. In addition, the method finds the starting (branching) node and the ending node of each vessel branch. A branching node is a medial point whose cluster is immediately followed by more than one cluster having the same single-seeded code. An ending node is a medial point having no successor cluster. The program establishes “parent-and-child” relationship between the medial points by examining the Euclidean distance between subsequent medial points with increasing single-seeded field values. To remove spurious branches, the method applies a pruning technique based on the minimum length of real branches. Then, it uses parent-and-child relationship to merge branches that were initially labeled differently because of the spurious segments.
Using the aforementioned, the program quantitates the vessels. To find the length of each branch, the software counts the number of skeleton voxels in that branch. To compute the diameter of each vessel branch, the software uses the medial axis. It finds the orientation of the medial axis by template matching of “rotating structuring elements” with variable lengths. Then, it finds the diameter of the vessel at the matched points by examining the voxels in the direction normal to the medial axis. Finally, 3DVQ uses the boundary-seeded field to visualize the segmented vessels with the aid of the isosurface rendering technique.
Statistical analysis
Analysis of variance followed by t-tests with Bonferroni correction was used. All data are presented as mean ± SE and P < 0.05 was considered statistically significant.
RESULTS
Increases in VEGF and VEGFR-1 mRNA were detected at 2 hours of ischemia and VEGFR-2 mRNA was increased at 4 hours of ischemia. Increased levels of VEGF, VEGFR-1, and VEGFR-2 mRNA persisted for at least 28 days after ischemia (Fig. 1A). In addition, HIF-1α was detected at 2 hours to 28 days of ischemia (Fig. 1A). Endothelial-specific receptors, Tie 1 and Tie 2, were present in nonischemic brain (Fig. 1B) and Tie 1 and Tie2 mRNA increased at 2 hours to 28 days of ischemia (Fig. 1B). Ang 1 was expressed in nonischemic brain but not Ang 2 (Fig. 1B). However, levels of Ang 1 mRNA decreased at 2 hours of ischemia (Fig. 1B). Increases in Ang 1 mRNA were detected at 24 hours of ischemia and persisted for 28 days (Fig. 1B). Ang 2 mRNA was not detected until 24 hours of ischemia, and increased Ang 2 mRNA persisted for 28 days after ischemia (Fig. 1B).
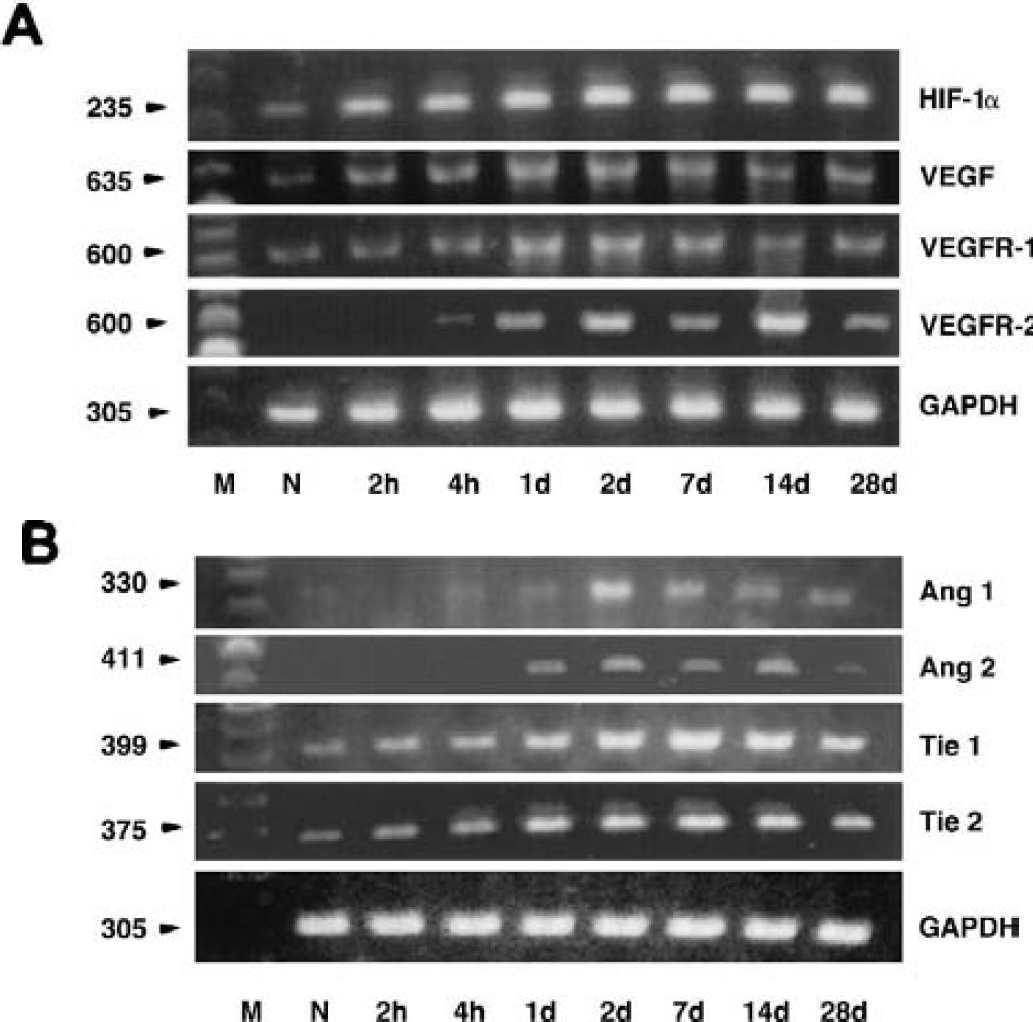
Reverse transcriptase-polymerase chain reaction on total RNA isolated from the brains of nonoperated rats (N) and ischemic hemisphere 2 hours to 28 days (n = 3 per each time point) after middle cerebral artery occlusion using paired primers listed in Table 1. Vascular endothelial growth factor (VEGF) and VEGFR-1 mRNA increased at 2 hours of ischemia and VEGFR-2 mRNA increased at 4 hours of ischemia. Increased levels of VEGF, VEGFR-1, and VEGFR-2 mRNA persisted for at least 28 days after ischemia
VEGF immunoreactivity was observed in astrocytes in nonischemic rat brain (Fig. 2A, arrow). VEGF immunostaining increased in activated astrocytes in the ischemic core at 2 hours of ischemia and gradually decreased in astrocytes in the ischemic core from 6 hours of ischemia (Fig. 2B arrows and 2C arrow). Microvessels exhibited VEGF immunoreactivity in the ischemic core from 24 hours of ischemia (Fig. 2D arrows). Increases in VEGF immunoreactivity in hypertrophic astrocytes and in endothelial cells were detected in the penumbra from 24 hours of ischemia and persisted for at least 2 weeks (Figs. 2E, arrows, and 2F). Quantitative analysis revealed that VEGF immunoreactivity primarily localized to ischemic core and penumbra 2 hours to 6 hours and 24 hours to 2 weeks, respectively, after ischemia (Fig. 2G).
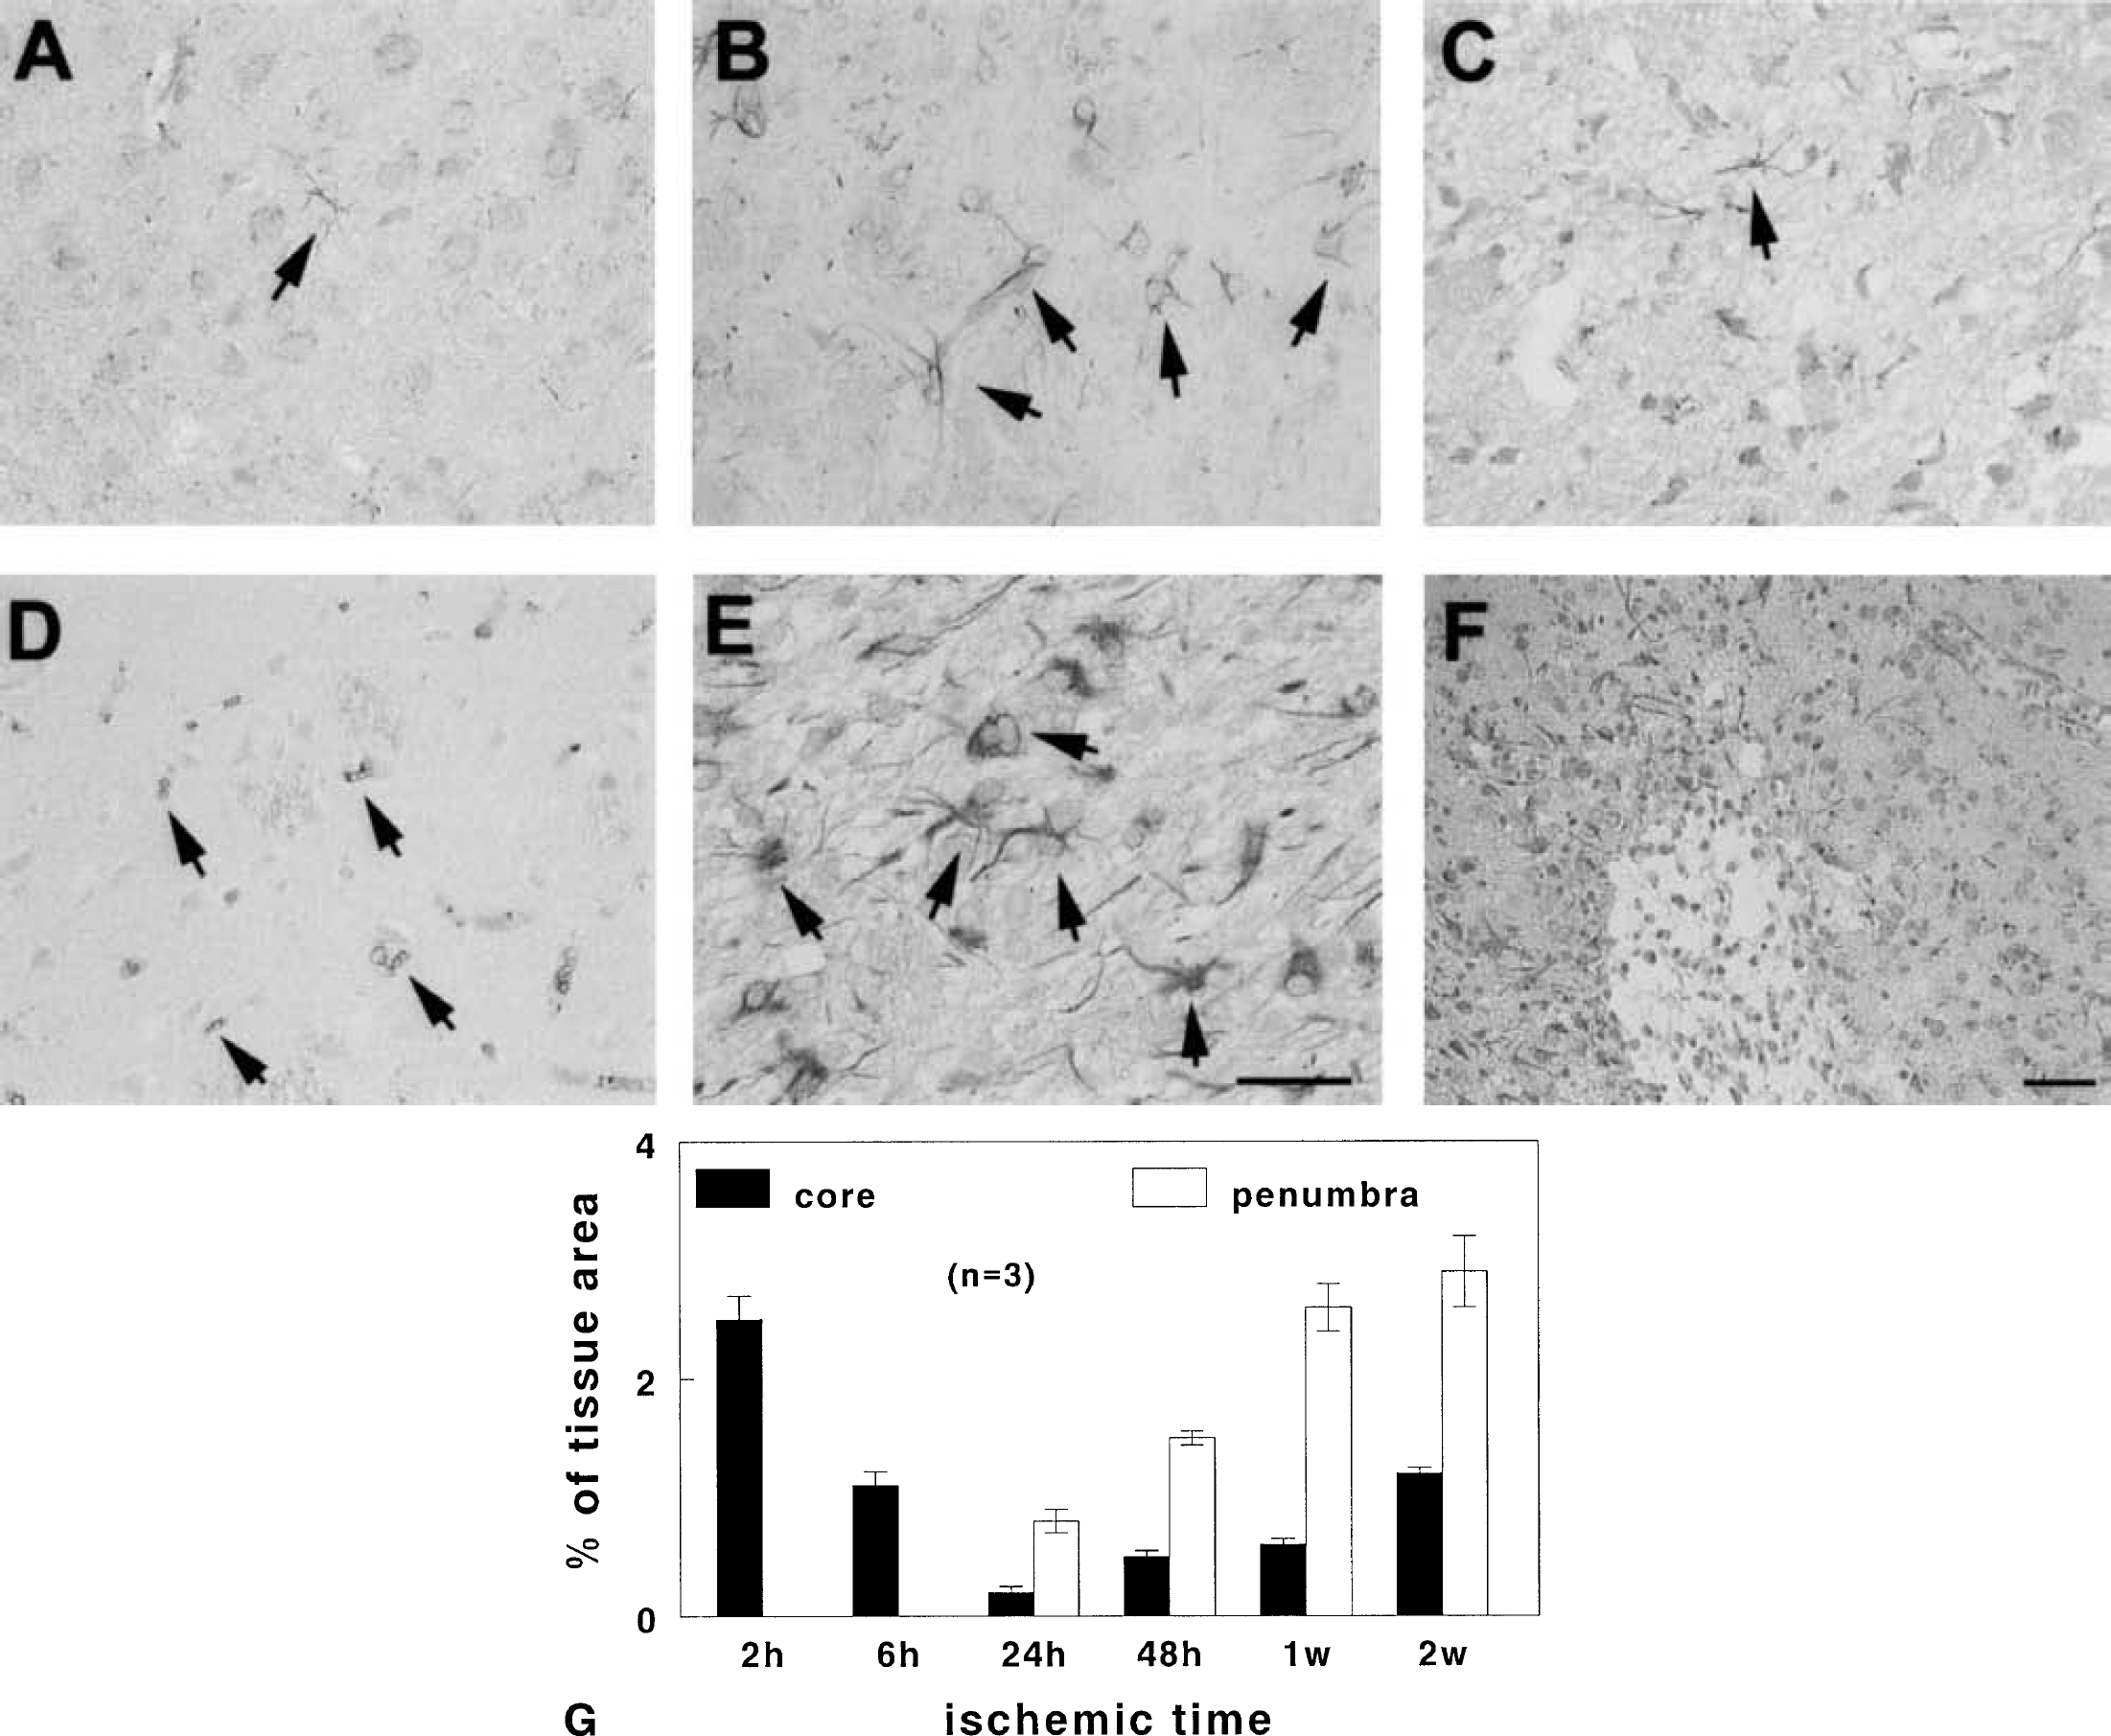
Vascular endothelial growth factor (VEGF) immunoreactivity in nonischemic and ischemic brain. VEGF immunoreactivity is present in astrocytes in nonischemic brain (
To examine the spatial relation between upregulation of VEGF and plasma perfusion, we performed 3D immunofluorescent staining with VEGF on FITC-dextran– perfused tissue. Figure 3 shows three dimensionally rendered images of VEGF immunoreactivity (red) and cerebral microvessel plasma perfusion (green) in the ischemic hemisphere (Fig. 3A) and in the homologous tissue in the contralateral hemisphere (Fig. 3D) 2 hours after cerebral embolic stroke. VEGF immunoreactivity was highly localized to astrocytes adjacent to vessels with low plasma perfusion (Fig. 3B). The contralateral hemisphere shows vessels that are well plasma perfused with a much-reduced VEGF immunoreactivity in astrocytes compared with the ipsilateral ischemic tissue. A significant (P < 0.05) increase of VEGF immunoreactivity was detected in areas with a significant (P < 0.05) reduction of cerebral microvessel plasma perfusion (Figs. 3A to 3C, 3G) compared with the contralateral homologous areas (Figs. 3D, 3E, and 3G) at 2 hours after ischemia, suggesting that early upregulation of endogenous VEGF is localized in the ischemic core. Fourteen days after ischemia, strong VEGF immunoreactivity (Fig. 3H, red) was detected at the border of the infarct with an irregular pattern of tortuous cerebral blood vessels (Fig. 3H, green) compared with homologous tissue in the contralateral hemisphere (Fig. 3I). Few scattered VEGFR-1 and VEGFR-2 immunoreactive vessels were detected in brains of nonischemic animals (Figs. 4A and 4D). Increases in VEGFR-1 immunoreactive microvessels were detected at 1 hour (Fig. 4B) and 24 hours (Fig. 4C) compared with immunoreactivity in nonischemic rats (Fig. 4A). Increases in VEGFR-2 immunoreactivity were observed at 4 (Fig. 4E) and 24 hours (Fig. 4F) after ischemia. VEGFR-1 and VEGFR-2 immunoreactivity was primarily localized to cerebral vessels as demonstrated by double immunostaining for VEGFR-1 and VEGFR-2 with endothelial marker, vWF (Figs. 4G to 4I) or CD31 (Figs. 4J to 4L).
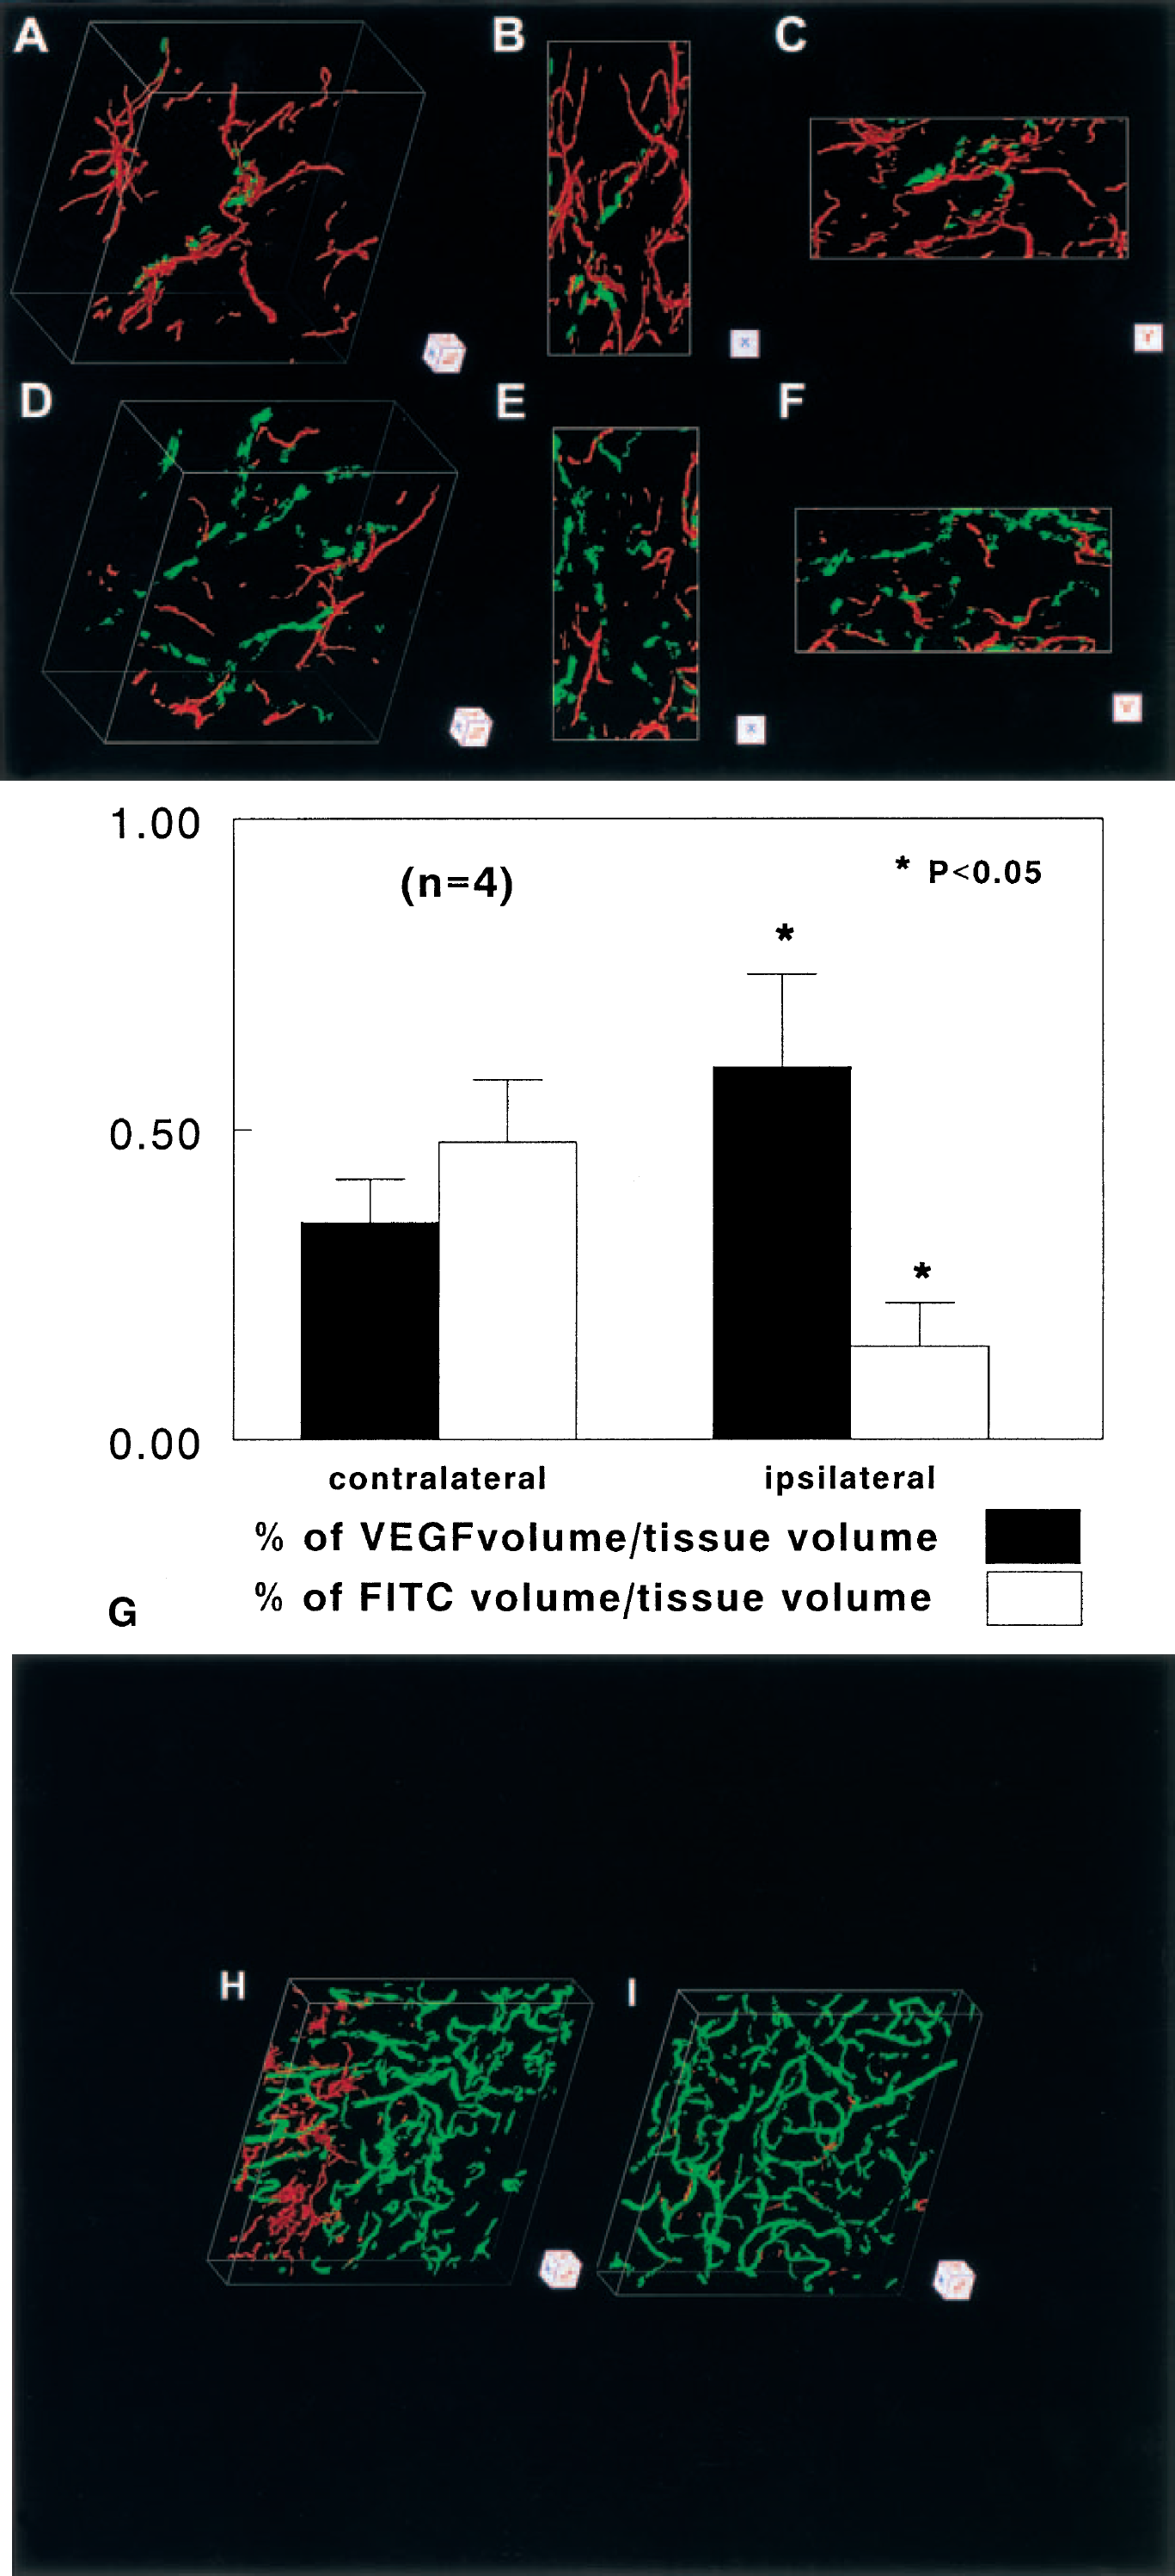
Three-dimensional images of microvessels [fluorescein isothiocyanate (FITC)–dextran, green] and vascular endothelial growth factor (VEGF) immunoreactivity (red) obtained from the ipsilateral striatum
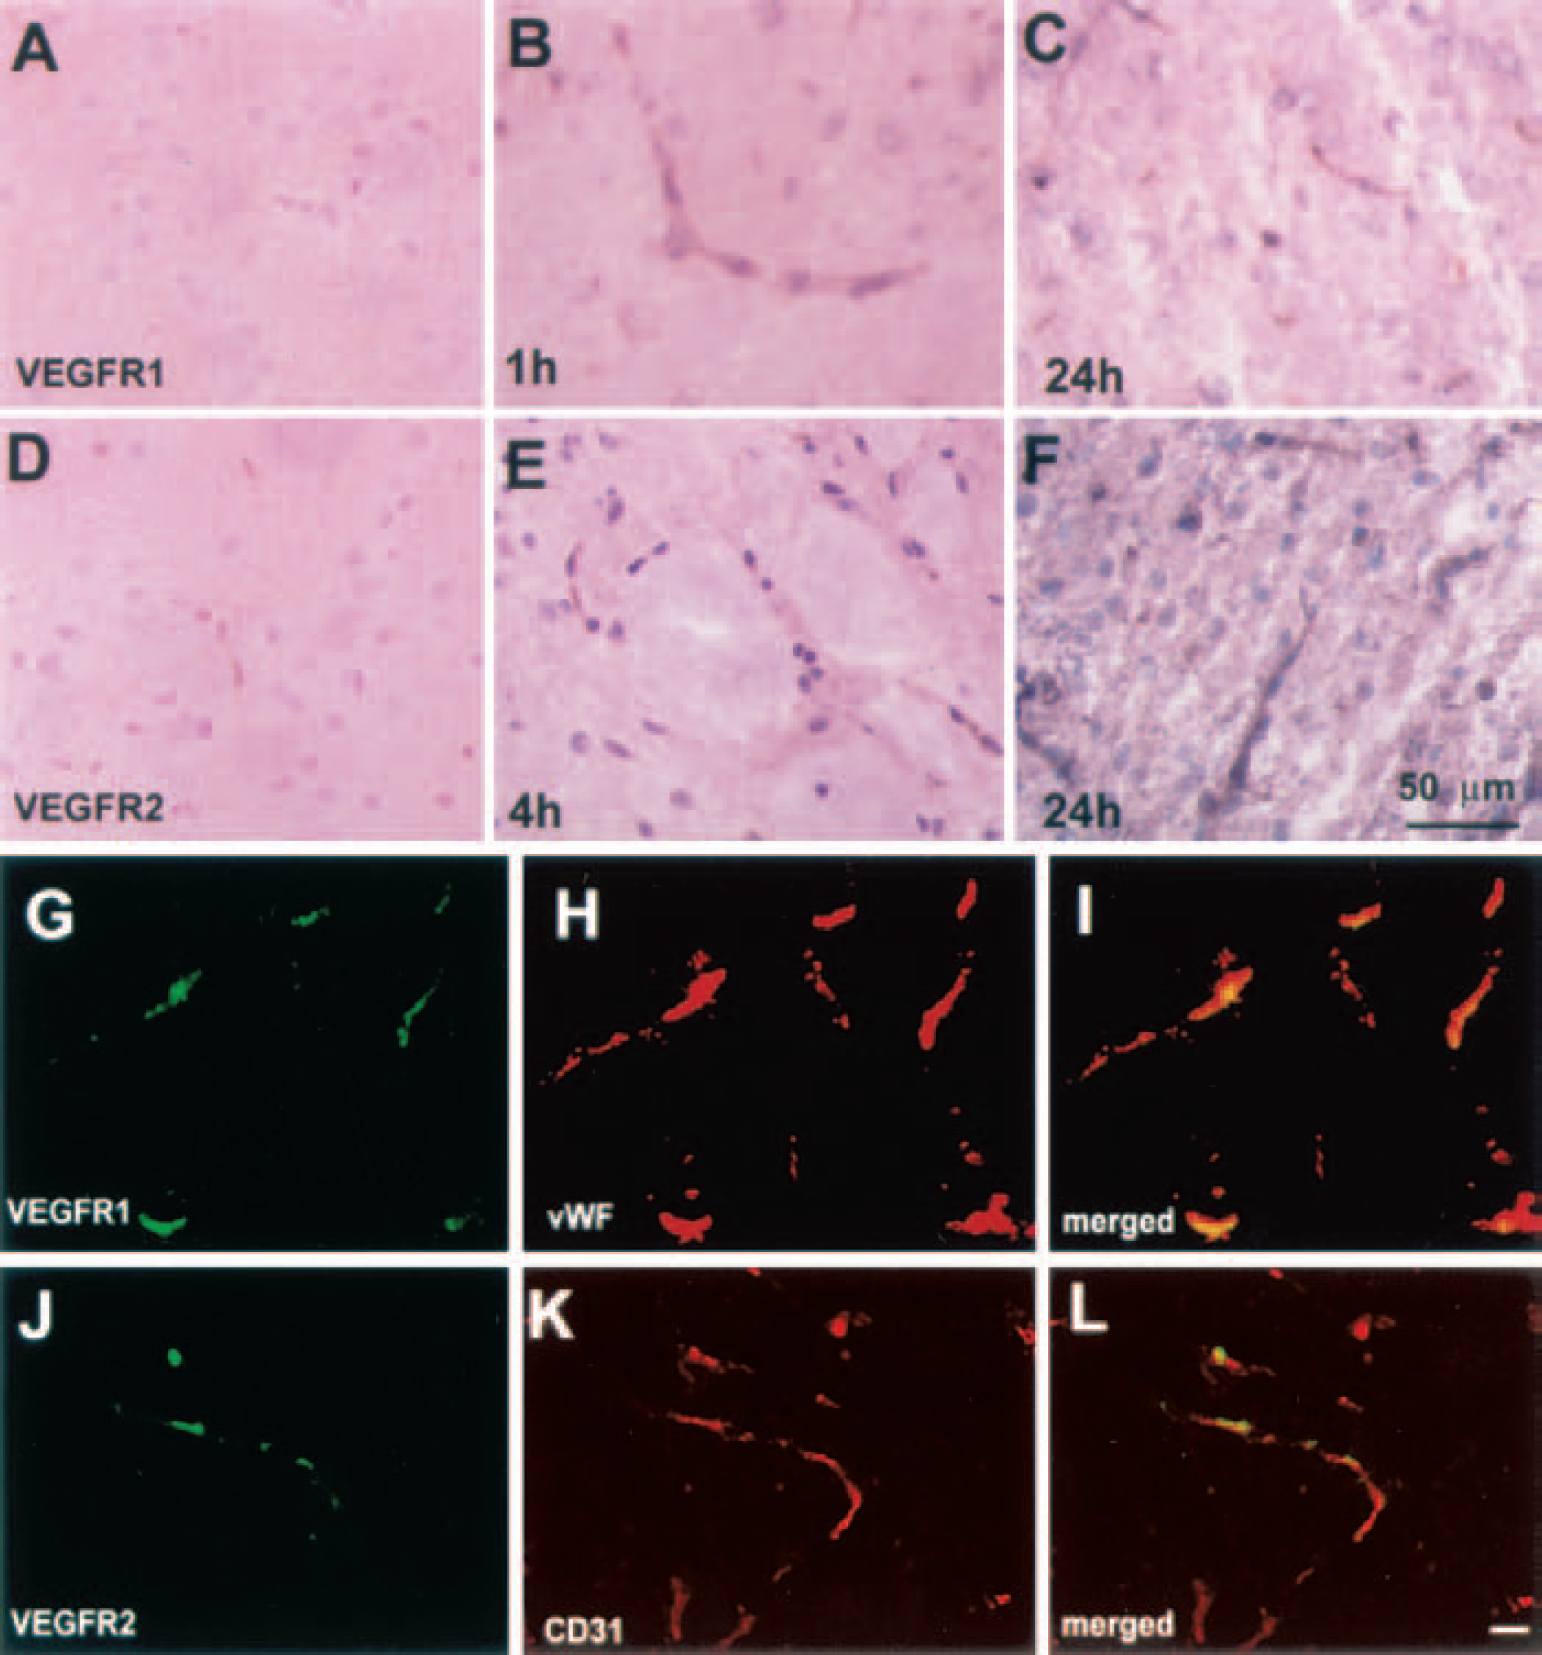
Immunostaining for vascular endothelial growth factor (VEGF)R-1
To examine cerebral microvascular plasma perfusion and BBB leakage, we injected Evans blue and FITC–dextran before MCA occlusion and before the animals were killed, respectively. Evans blue and FITC–dextran emit red and green fluorochrome, respectively, and thus permitted us to measure plasma-perfused (yellow color, Evans blue, and FITC–dextran) and non–plasma-perfused microvessels (red, Evans blue only) in three dimensions after MCA occlusion. Three-dimensional images show a large leakage of Evans blue dye (Fig. 5A, red area) with low plasma perfusion (Fig. 5A, yellow) in the ipsilateral preoptic area, and the contralateral homologous area exhibited microvessels that were well plasma perfused (Fig. 5B, yellow) without any diffusely stained red areas. High magnification revealed extravasation of Evans blue from a microvessel in the ipsilateral preoptic area (Fig. 5C, red). Quantitative data analysis revealed that the percentage of Evans blue volume in tissue with low plasma perfusion in the ipsilateral hemisphere was significantly (P < 0.05) higher than in the homologous tissue in the contralateral hemisphere (Fig. 5D). Extravasation of Evans blue was limited to the subcortex, mainly to the preoptic area, suggesting that an increase in the BBB permeability in the ischemic core regions after embolic ischemia.
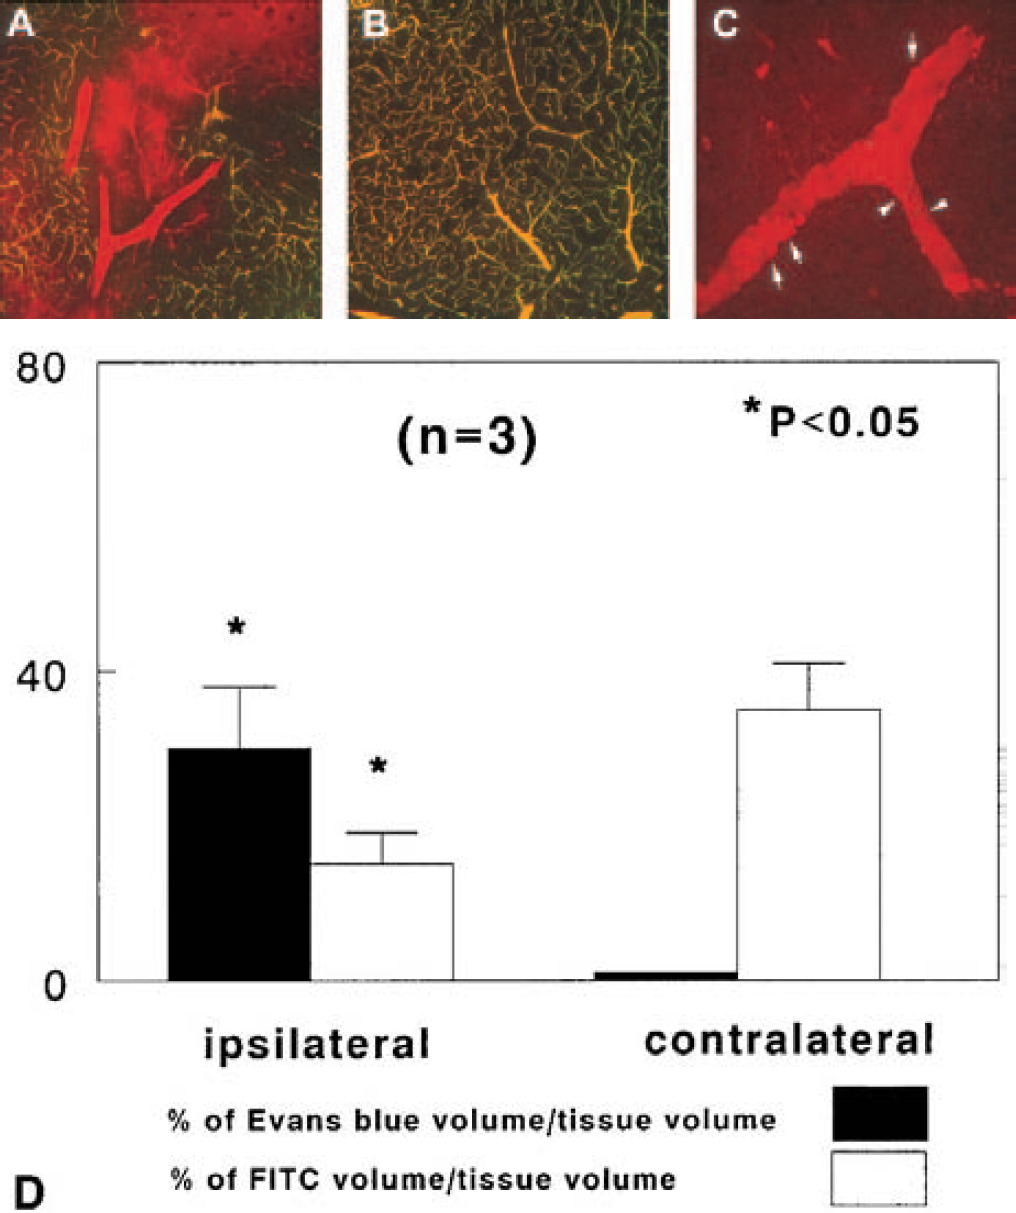
Evans blue leakage. Composite images obtained from 15 laser scanning confocal microscopy sections (5 μm/section) of brain tissue perfused with Evans blue and fluorescein isothiocyanate (FITC)–dextran show Evans blue dye within and outside of vessels (
To examine dynamic changes in cerebral blood vessels after MCA occlusion, we performed morphologic analysis of vessels in two and three dimensions during 4 hours to 28 days of ischemia. Cerebral microvessels were well perfused by FITC–dextran in nonischemic rats (Fig. 6A). Occlusion of MCA resulted in reduction of plasma perfusion in microvessels 4 hours after ischemia (Fig. 6B), and almost no plasma perfusion in microvessels was detected 48 hours after ischemia (Fig. 6C). However, plasma-perfused vessels with small and enlarged diameters were detected at the boundary of ischemia 14 days after ischemia (Fig. 6D, arrows). Morphologic analysis of vessels immunostained with anti-vWF antibody revealed enlarged and thin-walled blood vessels (Fig. 7A) at the boundary of the ischemic lesion, which evolved into smaller vessels by sprouting (Fig. 7B, arrow) or intussusception (Fig. 7C, arrows) into the ischemic core during 7 to 28 days after ischemia. Vessel sprouting (Figs. 7D to 7H, arrows) and splitting (Figs. 7D to 7H, arrowhead) were observed in 3D images.
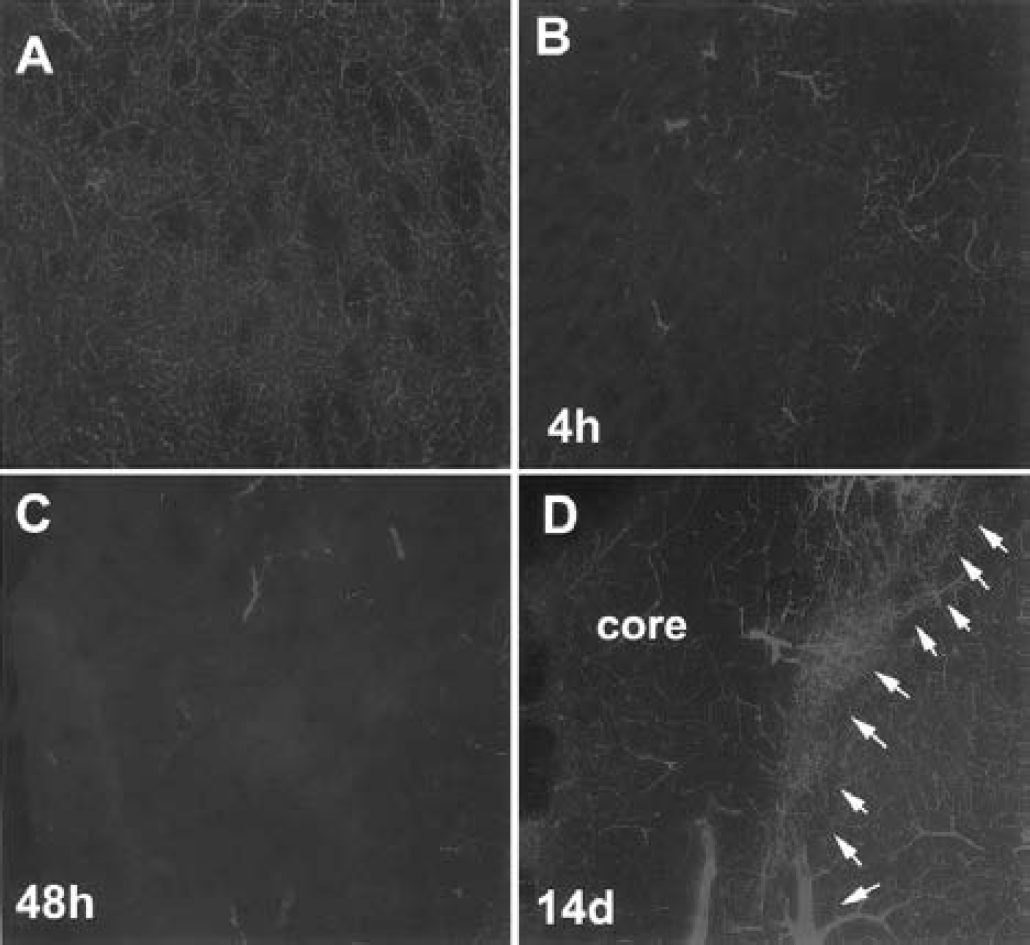
Fluorescein isothiocyanate (FITC)-dextran–perfused brain coronal sections (section thickness, 100 μm). FITC-dextran–perfused cerebral microvessels exhibit an irregular pattern of tortuous and anastomosing capillaries in the subcortex of a nonischemic rat
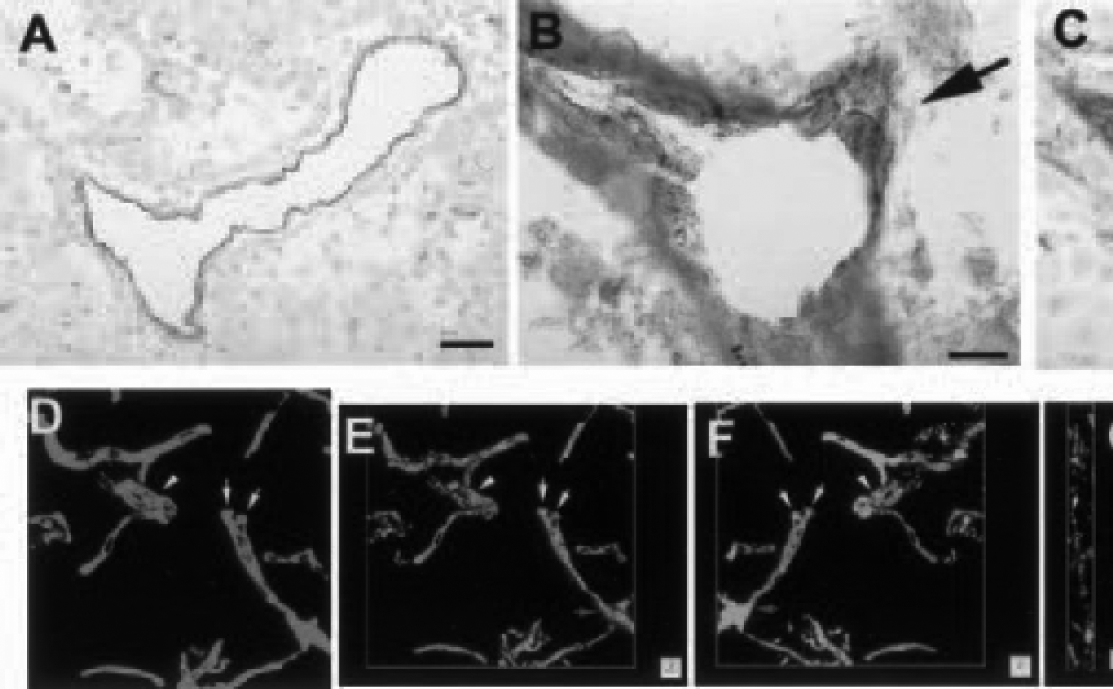
Immunnostaining for von Willebrand Factor (vWF) and three-dimensional images of microvessels. Immunostaining for vWF shows an enlarged and thin-walled vessel
Our 3D quantitative analysis program has features to measure numbers of vessels, numbers of branch points, segment length, and diameters of vessels. Figure 8 shows reconstructed 3D cerebral microvessels of the cortex (A–D) and the striatum (E–H) from a normal rat. Different colors in Fig. 8A and 8E represent individual vessels that were not connected to each other, and green and red colors in Fig. 8B and 8F code for diameters of blood vessels smaller than 7.5 μm and larger than 7.5 μm, respectively. These reconstructed 3D images derived from the original images obtained from LSCM (Figs. 8C and 8G). Numbers of segments of blood vessels in the cortex were twofold of numbers in the striatum (Figs. 8D and 8H). These data are consistent with published studies on cerebral vessels (Gesztelyi et al., 1993; Hudetz et al., 1993; Miyoshi et al., 1995). Using this program, we analyzed cerebral vessels in the penumbra and vessels in homologous area of the contralateral hemisphere in four rats 14 days after ischemia. Many cerebral vessels in the penumbra were not connected, and these vessels had different diameters (Figs. 9A and 9B) compared with vessels in the contralateral hemisphere (Figs. 9C and 9D). Quantitative data reveals that numbers of vessels that were not connected significantly (P < 0.01) increased in the penumbra (n = 365) compared with numbers of vessels in the homologous tissue of the contralateral hemisphere (n = 66). Furthermore, capillaries (diameter smaller than 7.5 μm) in the penumbra exhibited a significantly (P < 0.01) smaller diameter (4.8 ± 2.0 μm, n = 614 of segments) compared with capillaries (5.4 ± 1.5 μm, n = 858 of segments) in the homologous regions of the contralateral hemisphere (Figs. 9E and 9F). In contrast, vessels with diameters larger than 7.5 μm in the penumbra showed a significantly (P < 0.01) larger diameter (12.5 ± 6.0 μm, n = 193 of segments) compared with vessels (10.7 ± 3.5 μm, n = 637 of segments) in the contralateral hemisphere (Figs. 9E and 9F).
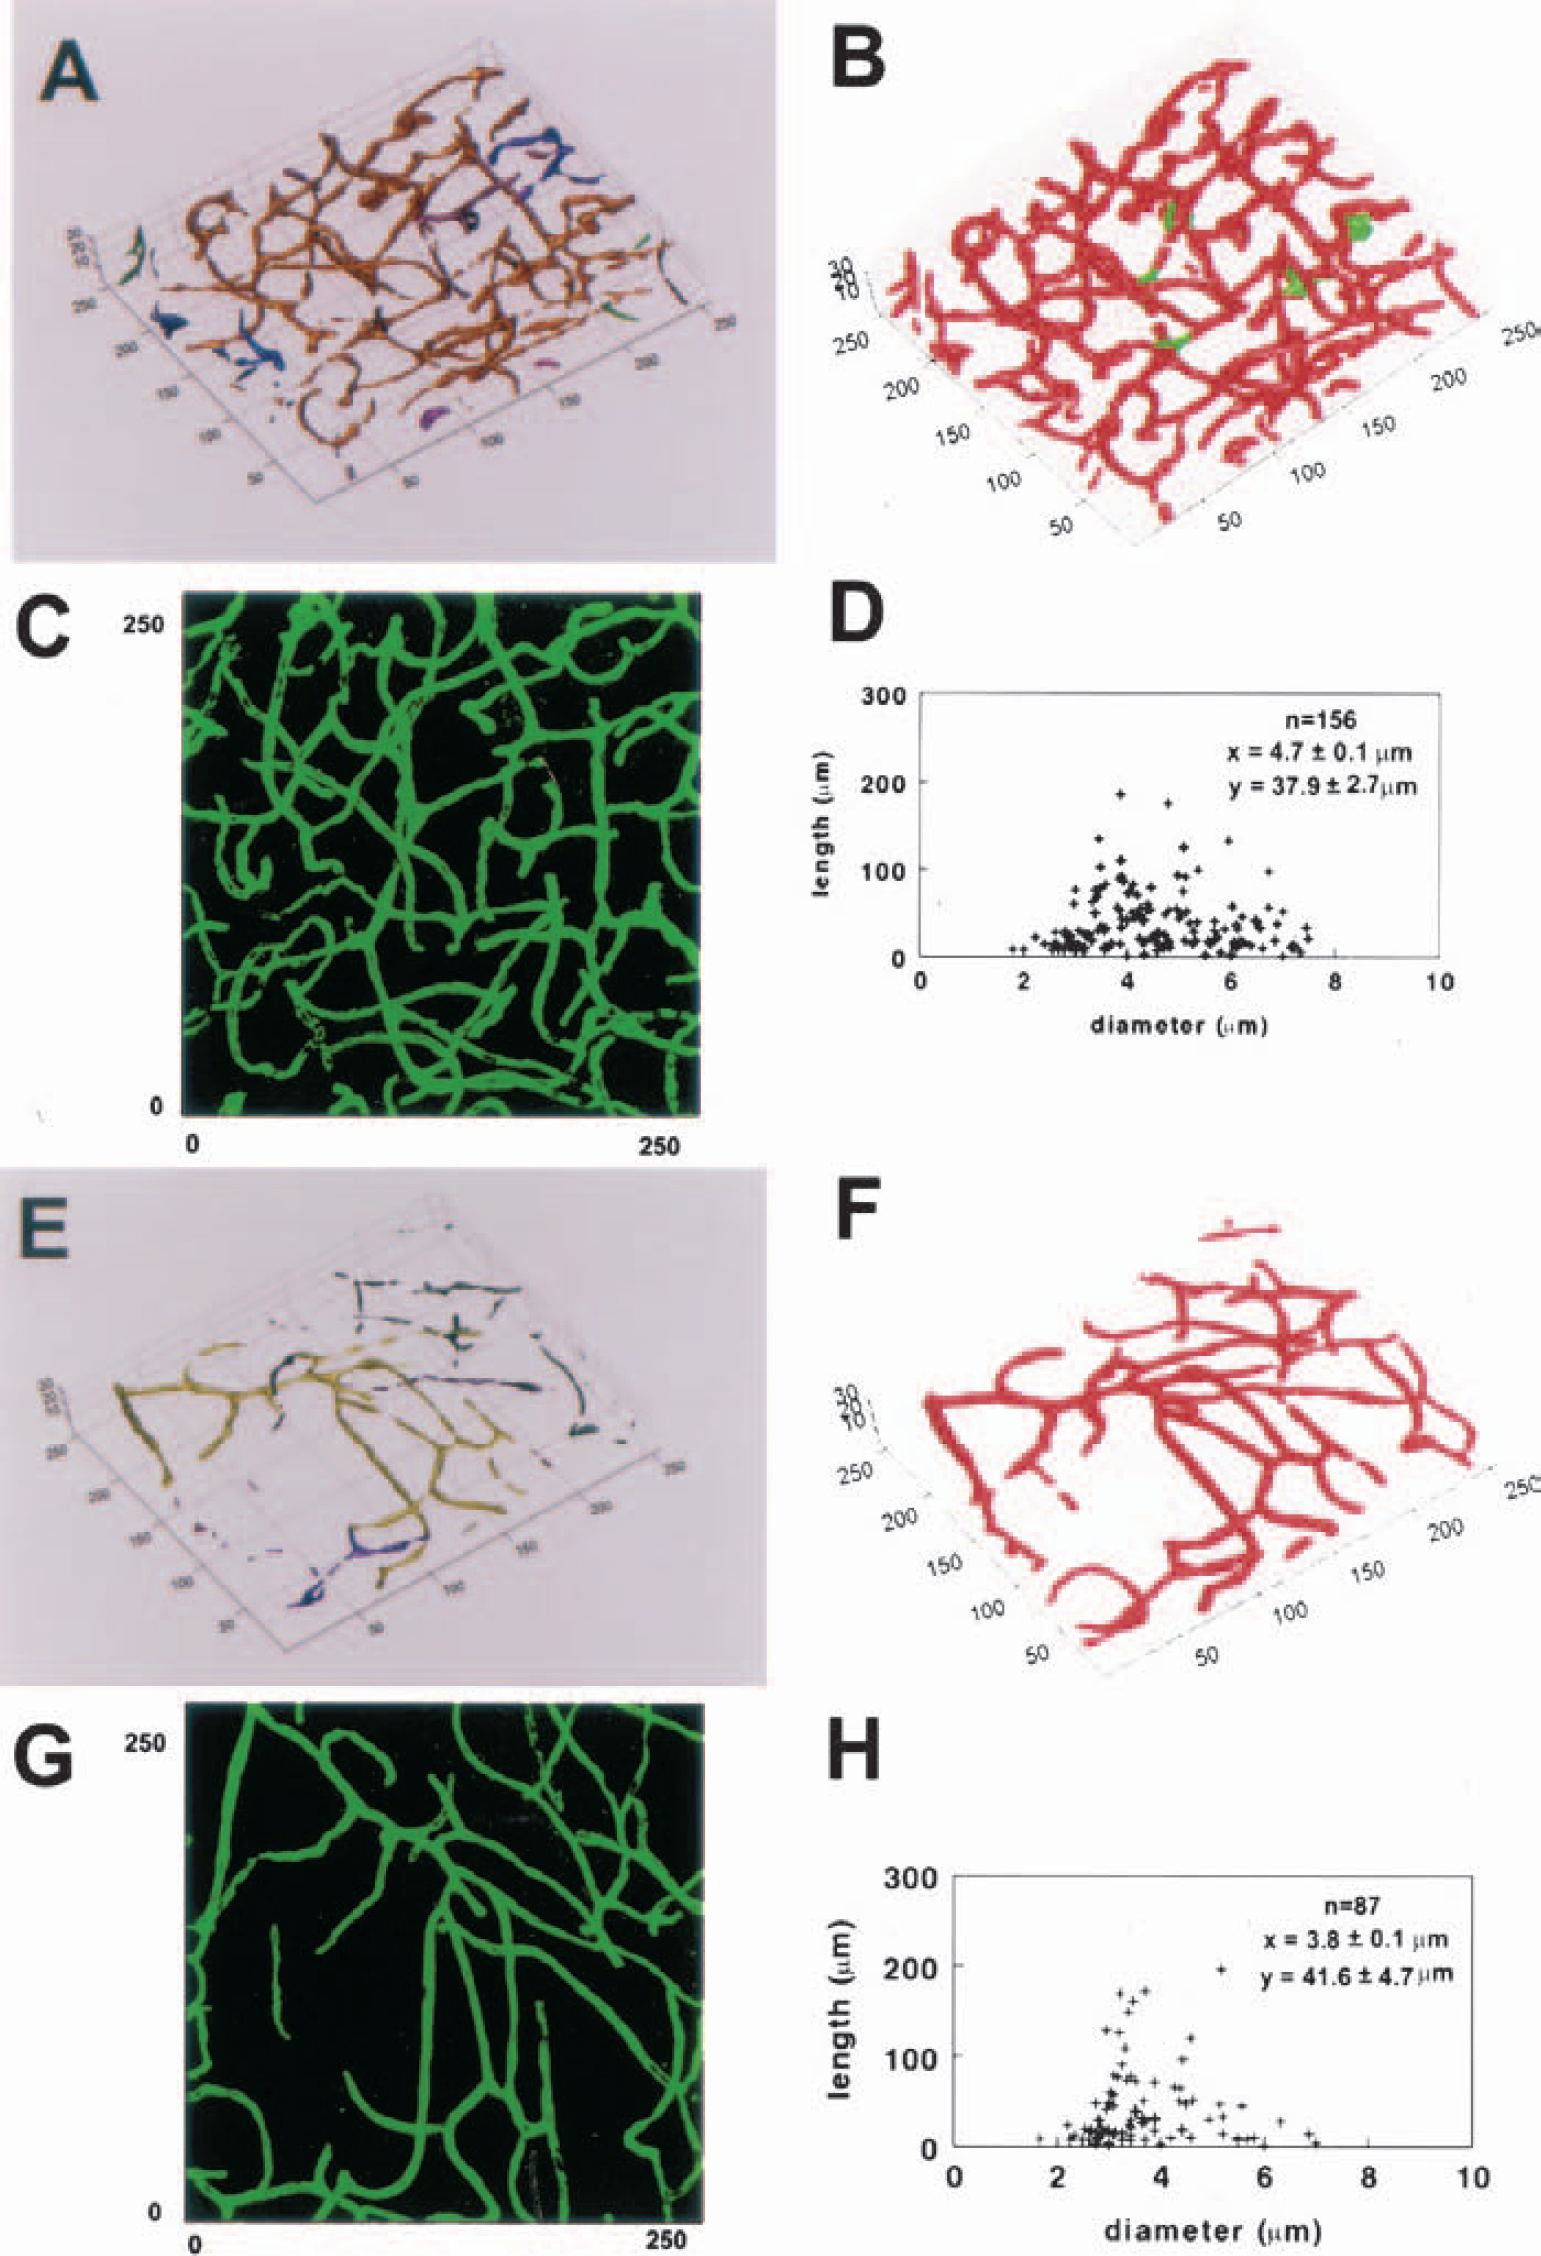
Three-dimensional images of cerebral vessels in the cortex
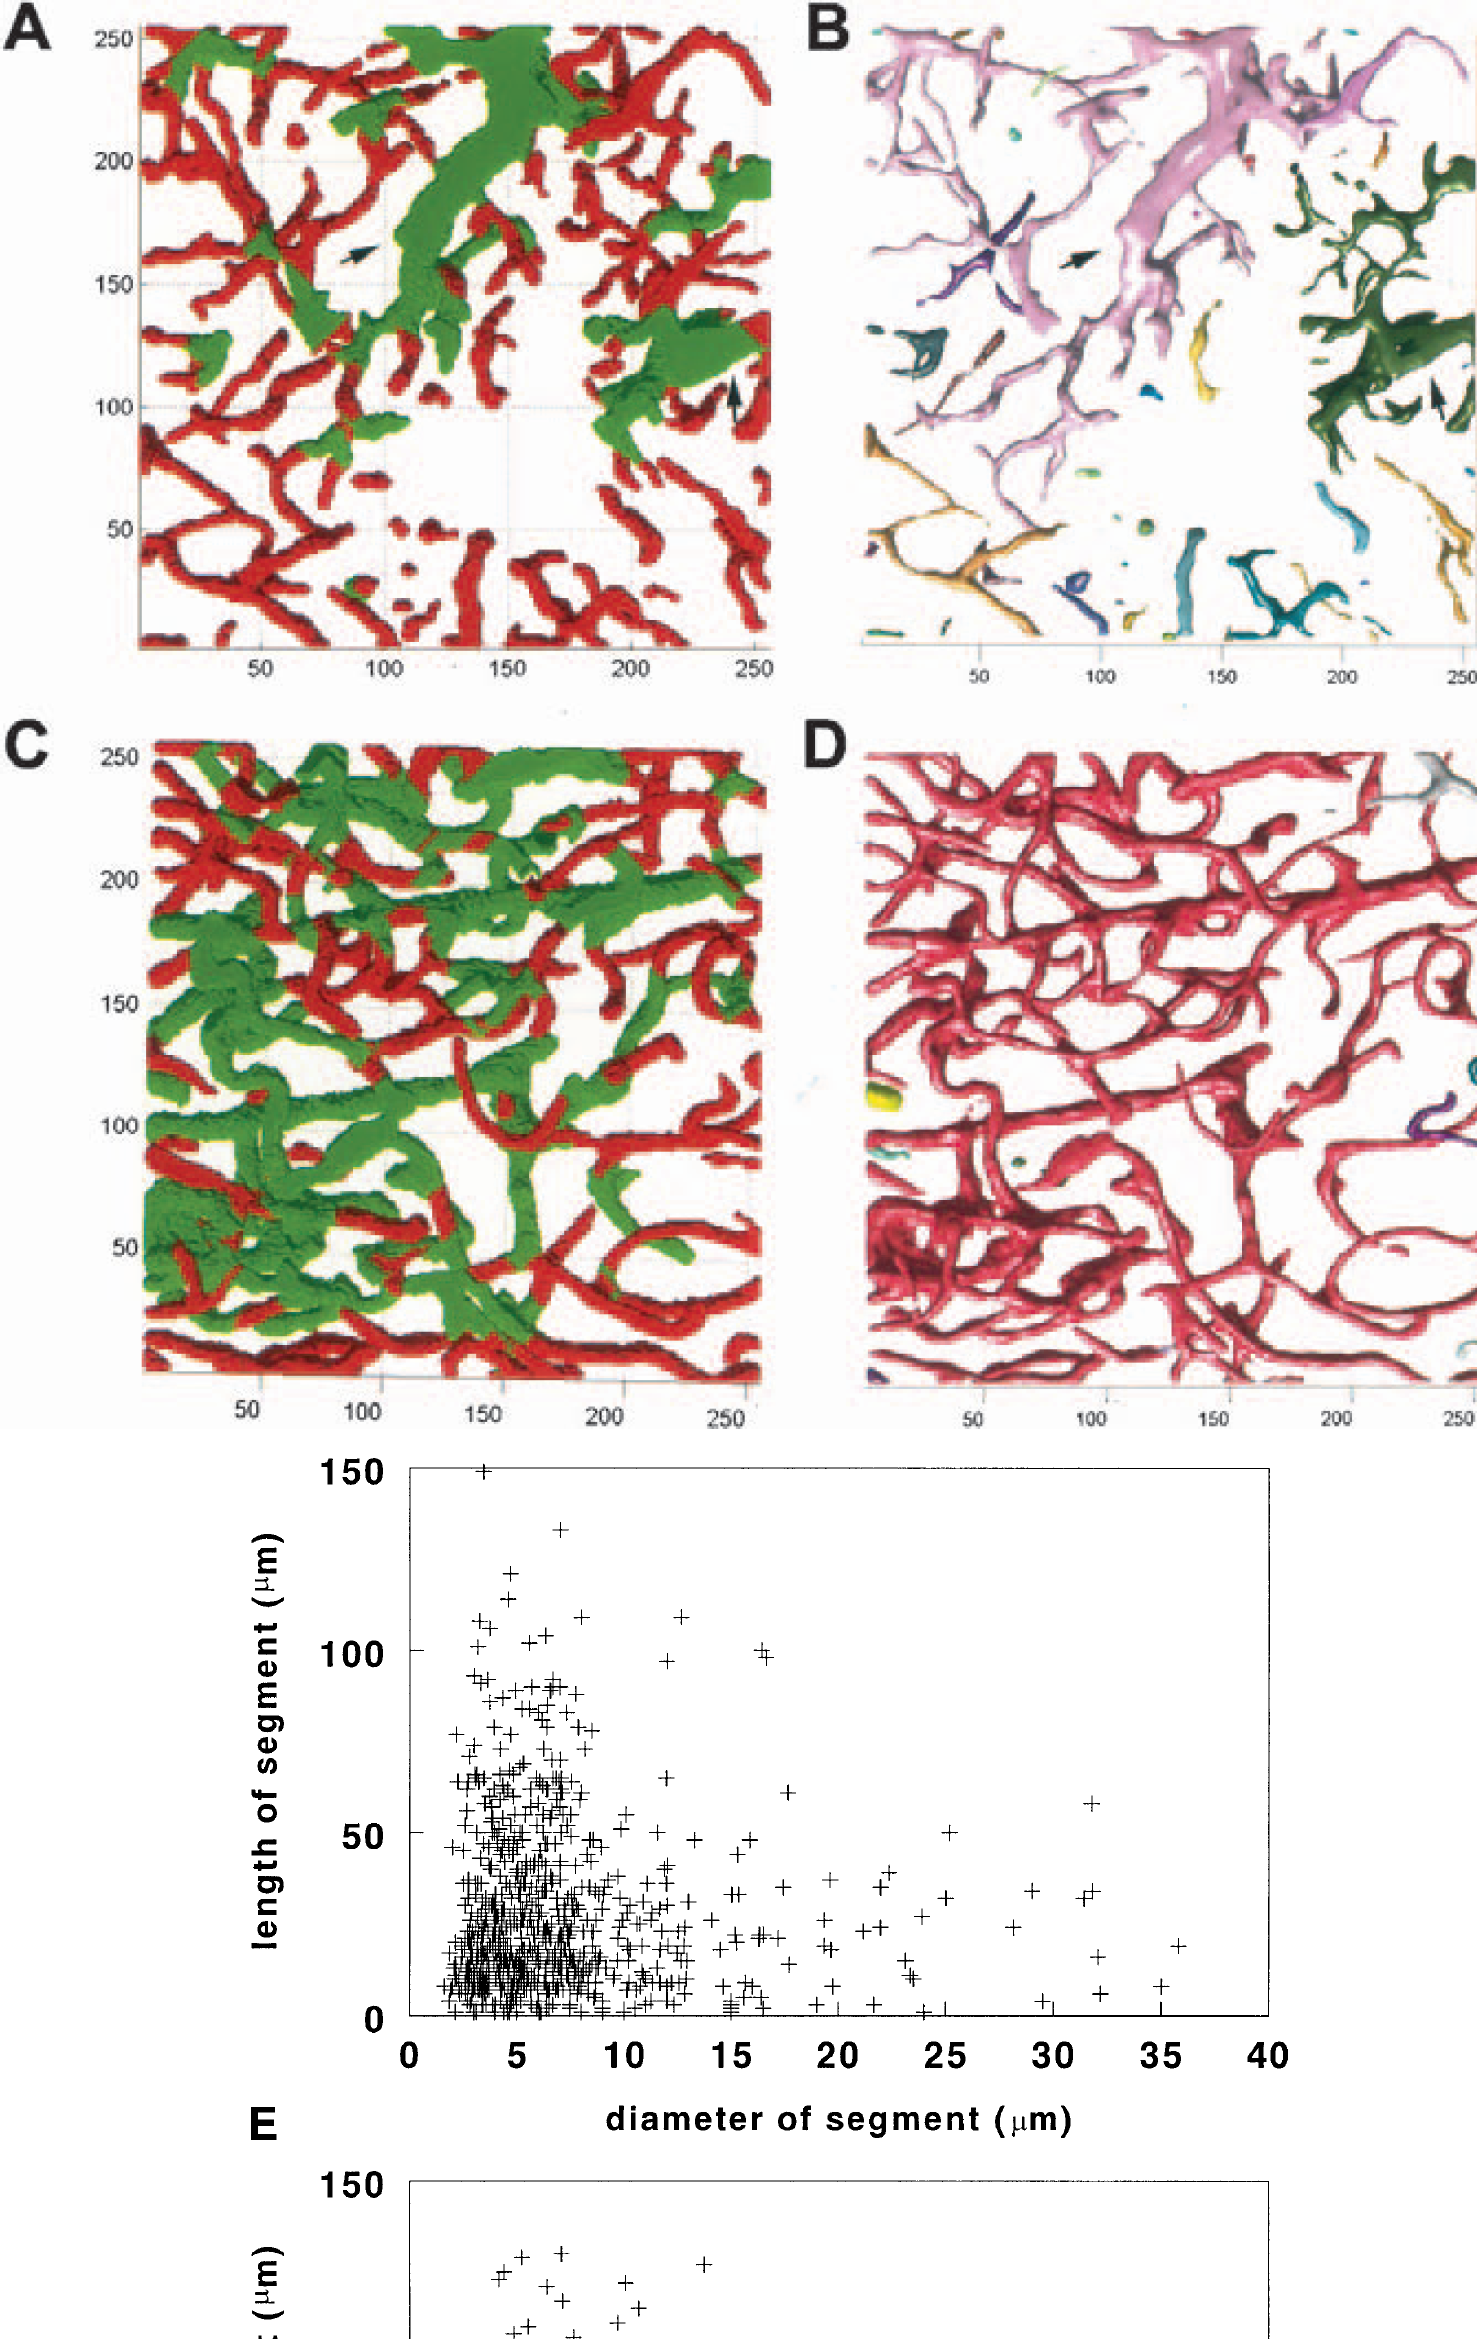
Three-dimensional images of cerebral vessels in the penumbra (
DISCUSSION
There has been no systematic investigation of the relationships of expression of VEGF/VEGF receptors and Ang/Tie 2 to changes in the BBB permeability and angiogenesis after cerebral embolic ischemia, although the temporal and spatial profiles of expression of VEGF/VEGF receptors and Ang/Tie 2 have been reported in ischemic brain after permanent and transient MCA occlusion (Hayashi et al., 1997; Cobbs et al., 1998; Lennmyr et al., 1998; Plate et al., 1999; Beck et al., 2000; Lin et al., 2000). Our observations that early upregulation of VEGF/VEGF receptors and downregulation of Ang 1 in the ischemic core where BBB leakage occurs suggest that VEGF and Ang 1 may be required for maintaining BBB integrity. Furthermore, our data show that increases in numbers of capillaries and the presence of enlarged vessels in the penumbra are coincident with late upregulation of VEGF/VEGF receptors and Ang/Tie 2, suggesting that these angiogenic growth factors cooperatively mediate angiogenesis in ischemic brain.
Our data demonstrate that VEGF and Ang 1 are expressed in the nonischemic brain. However, 2 to 4 hours after embolic MCA occlusion, VEGF expression increased while Ang 1 decreased. These data are consistent with previous reports (Hayashi et al., 1997; Cobbs et al., 1998; Lennmyr et al., 1998; Plate et al., 1999; Beck et al., 2000; Lin et al., 2000). Increases in expression of HIF-1α may perturb gene expression because hypoxia is a potent inducer of VEGF and can downregulate expression of Ang 1 (Levy et al., 1995; Enholm et al., 1997; Mandriota and Pepper, 1998). Our 3D data show that upregulated VEGF localized to the ischemic core as indicated by low plasma perfusion. Furthermore, there was an increased BBB leakage in the ischemic core at 4 hours after embolization. Although upregulation of VEGF persists, BBB leakage subsides 72 to 96 hours after ischemia when upregulation of Ang 1 is detected at 48 to 72 hours after ischemia (Croll and Weigand, 2001). Temporal and spatial coincidence between perturbation of VEGF and Ang 1 expression and BBB leakage suggests that VEGF and Ang 1 may be involved in BBB leakage. VEGF is a potent vascular permeability factor (Dvorak et al., 1995). Early upregulation of endogenous VEGF on astrocytes in the ischemic core may interact with receptors for VEGF on the ischemic vessels and induce BBB leakage. Administration of VEGF to ischemic rats exacerbates BBB leakage, and treatment of MCA-occluded mice with a soluble VEGF receptor chimeric protein, Flt-(1–3)-immunoglobulin G, which inactivates VEGF, significantly reduces brain edema (van Bruggen et al., 1999). Ang 1 expression in nonischemic brain may maintain the integrity of the BBB. Ang 1 can counter the effect of VEGF on permeability (Thurston et al., 1999, 2000). Overexpression of Ang 1 significantly reduces BBB leakage in mice subjected to MCA occlusion and in mice treated with VEGF after MCA occlusion (Zhang et al., 2001a). Taken together, these data suggest that in addition to VEGF, Ang 1 is an important contributor to BBB leakage. We propose that a balance between VEGF and Ang 1 is required to maintain integrity of the BBB and that MCA occlusion perturbs this balance, which causes BBB leakage.
The kinetics of new blood vessel formation and the structure of the newly formed vessels in ischemic brain have not been investigated in detail. During embryonic development, cerebral vessels are formed by angiogenesis, the sprouting capillaries from preexisting blood vessels (Breier et al., 1997; Risau, 1998). Endothelial cell proliferation ceases in the adult brain (Engerman et al., 1967; Robertson et al., 1985). Whether angiogenesis takes place in the adult brain after stroke and whether newly formed vessels are functional are uncertain (Hills, 1964; Coyle, 1984; Coyle and Heistad, 1987; Garcia et al., 1994; Sbarbati et al., 1996). Based on measurements of pial vessels, Coyle et al. conclude that angiogenesis does not occur after MCA occlusion (Coyle, 1984; Coyle and Heistad, 1987). Using a vascular corrosion technique, Sbarbati et al. demonstrate formation of new vessels in ischemic brain after ischemia (Sbarbati et al., 1996). Angiogenesis is usually measured by counting vascular density in two dimensions. Endogenous thrombolysis occurs at a late stage of stroke, which can lyse embolism within cerebral vessels. Thus, increases in number of plasma-perfused vessels observed during stroke recovery may represent recanalization of cerebral microvessels rather than formation of new vessels.
Our data show that occlusion of the MCA resulted in significant decreases in numbers of plasma-perfused vessels in the ischemic core during the first 48 hours of stroke, which is consistent with our previous findings (Zhang et al., 1999a) and comparable to observations from patients who have had acute stroke and who show continuous reduction in cerebral blood flow in the ischemic core (Fisher and Garcia, 1996). However, we found enlarged and thin-walled blood vessels at the boundary of the ischemic lesion, and the perimeters of these vessels were significantly enlarged compared with vessels in the contralateral hemisphere during 2 to 28 days after ischemia. Enlarged thin-walled vessels are termed “mother” vessels and have been found under conditions of pathologic angiogenesis (Pettersson et al., 2000). Mother vessels can develop into small vessels by sprouting, by invaginating, or by forming transluminal endothelial bridges to build smaller-caliber daughter vessels and glomeruloid bodies (Pettersson et al., 2000; Sundberg et al., 2001). In ischemic brain, the presence of sprouting and intussusception vessels suggests that mother vessels may evolve into smaller vessels by these two pathways. Moreover, our 3D quantitative analysis reveals that capillaries in the penumbra have a significantly smaller diameter, whereas diameters of arterioles and venules are significantly increased compared with the homologous tissue in the contralateral hemisphere. Together, these findings argue that angiogenesis takes place in the adult brain after stroke.
Increases in expression of VEGF/VEGF receptors and Ang/Tie2 at the border of infarct from 2 to 28 days after ischemia are coincident with the time and distribution of neovascularization in ischemic brain, suggesting that these angiogenic growth factors are temporally and spatially correlated with angiogenesis. VEGF is mitogenic for endothelial cells and functions during the earliest stages of vascular development, whereas Ang1 alone does not induce endothelial proliferation or tube formation but plays a role in maturation of newly formed vessels, indicating that VEGF and Ang 1 have complementary roles to form new vessels (Davis et al., 1996; Carmeliet and Collen, 1997; Suri et al., 1998). VEGF induces mother vessels, which develop into small vessels both in vitro and in vivo (Pepper et al., 1991; Drake and Little, 1995; Pettersson et al., 2000). Ang 1 induces vessel sprouting and branching (Davis et al., 1996; Koblizek et al., 1998). Mice with overexpression of Ang 1 in the skin exhibit the most striking increases in vascular branches in addition to significant increases in the number and size of vessels (Suri et al., 1998). Our observations of the presence of mother vessels and significant increases in the numbers of vessels raise the possibility that angiogenesis after focal cerebral ischemia might be similarly induced by VEGF and Ang 1 pathways. Indeed, administration of VEGF at the time (i.e., 48 hours after stroke) when endogenous VEGF/VEGF receptors and Ang/Tie2 were upregulated enhanced neovascularization in ischemic brain (Zhang et al., 2000). Ang 2 serves as a natural inhibitor of Ang 1 activity (Maisonpierre et al., 1997). However, at high concentrations, Ang2 can enhance angiogenesis (Kim et al., 2000).
Recent studies suggest that VEGF-induced vessels are short lived, and VEGF gene delivery to myocardium induces hemangiomas (Lee et al., 2000; Pettersson et al., 2000). Angiogenesis induced by VEGF in skeletal and heart muscle is largely resolved by 3 weeks (Pettersson et al., 2000). In contrast, newly formed vessels in ear skin persist and continue to be perfused by blood for at least 3 months (Pettersson et al., 2000). These data indicate that angiogenesis in response to VEGF depends on different tissue microenvironments (Aird et al., 1997; Pettersson et al., 2000). In the current study, upregulation of VEGF/VEGF receptors and Ang/Tie2 was present 28 days after ischemia, which may explain why newly formed vessels persisted in ischemic brain for 28 days. However, other angiogenic factors such as neuropilin-1, which is upregulated after ischemia, may also contribute to angiogenesis (Zhang et al., 2001b). VEGF-induced mother vessels can evolve into glomeruloid bodies, which are usually found in hemangioma (Pettersson et al., 2000). Lack of glomeruloid bodies in ischemic brain may account for the absence of hemangioma. Taken together, our data indicate that these angiogenic growth factors may cooperatively mediate angiogenesis after stroke, which is consistent with recent studies that VEGF/VEGF receptors and Ang/Tie2 are regulated in spatial, temporal, and quantitative manner to avoid vascular disaster (Yancopoulos et al., 2000). Therefore, therapeutic strategies aimed at enhancing both pathways may be more effective in promoting angiogenesis in ischemic brain than individual pathway.
The results presented here for angiogenesis in ischemic brain may have clinical implications. Patients with stroke with a higher density of blood vessels appear to have reduced morbidity and a longer survival (Krupinski et al., 1994; Cramer et al., 1997; Cramer and Chopp, 2000; Slevin et al., 2000). Functional imaging of patients with stroke shows increased cerebral blood flow and metabolism in tissue surrounding focal brain infarcts (Krupinski et al., 1994; Cramer et al., 1997; Cramer and Chopp, 2000; Slevin et al., 2000). Our data show that new blood vessels persist at least for 28 days after ischemia, and these vessels contain blood cells, suggesting that these newly formed vessels contribute to restoration of cerebral microvascular circulation after stroke. Recent studies demonstrate that in addition to their roles in angiogenesis, angiogenic growth factors also mediate neurogenesis in the adult brain (Leventhal et al., 1999; Palmer et al., 2000). Thus, elucidation of the relation between expression of these angiogenic growth factors and angiogenesis provides a baseline for future studies design to optimize functional angiogenic response after stroke.
In summary, our data indicate that acute upregulation of VEGF and downregulation of Ang 1 in the ischemic core mediate BBB leakage, whereas late upregulation of VEGF/VEGF receptors and Ang/Tie2 at the boundary zone regulate neovascularization in ischemic brain.
Footnotes
Acknowledgments:
The authors thank Cyntha Roberts for technical assistance.