
Abstract
The origins of reflected light changes associated with neuronal activity (optical signals) were investigated in rat somatosensory cortex with optical imaging, microspectrophotometry, and laser-Doppler flowmetry, and dynamic changes in local hemoglobin concentration and oxygenation were focused on. Functional activation was carried out by 2-second, 5-Hz electrical stimulation of the hind limb under chloralose anesthesia. These measurements were performed at the contralateral parietal cortex through a thinned skull. Regional cortical blood flow (rCBF) started to rise 1.5 seconds after the stimulus onset, peaked at 3.5 seconds (26.7% ± 9.7% increase over baseline), and returned to near baseline by 10 seconds. Optical signal responses at 577, 586, and 805 nm showed a monophasic increase in absorbance coincident with the increase in rCBF; however, the signal responses at 605 and 760 nm were biphasic (an early increase and late decrease in absorbance) and microanatomically heterogeneous. The spectral changes of absorbance indicated that the concentrations of both total hemoglobin and oxyhemoglobin increased together with rCBF; deoxyhemoglobin, increased slightly but distinctly (P = 0.016 at 1.0 seconds, P = 0.00038 at 1.5 seconds) just before rCBF increases, then decreased. The authors conclude that activity-related optical signals are greatly associated with a moment-to-moment adjustment of rCBF and metabolism to neuronal activity.
Keywords
Optical imaging based on intrinsic signals is a most useful technique for studying the functional organization of the brain cortex and its plasticity. Intrinsic signals are defined as the changes in the optical properties of brain and nerve tissues associated with neuronal activity (Grinvald et al., 1986), and many studies on these signals have been performed since Hill and Keynes (1949) made the first such report. The results have shown that intrinsic signals have multiple origins, which can be divided into three categories: (1) light-scattering changes related to cellular swelling (Cohen and Keynes, 1971; Lipton, 1973; MacVicar and Hochman, 1991) and blood volume increases (Narayan et al., 1995), (2) absorbance or fluorescence changes related to the redox changes of mitochondrial components such as cytochromes (Jöbsis et al., 1977; LaManna et al., 1987; Federico et al., 1994) and NADH (Chance et al., 1962), and (3) absorbance changes related to hemoglobin concentration and oxygenation changes (Grinvald et al., 1986; Frostig et al., 1990). Indeed the spatiotemporal characteristics and wavelength dependency of intrinsic signals differ among preparations, activation procedures, anesthetic states, cortices activated, and animals (MacVicar et al., 1993). Recently, Malonek and Grinvald (1996) investigated the temporal dynamics of hemoglobin and light-scattering components of the intrinsic signals in the cat visual cortex with a new technique called “imaging spectroscopy.” They showed an activity-induced early localized increase in the deoxyhemoglobin concentration followed by a later increase in the oxyhemoglobin concentration. However, the existence of the initial deoxygenation of hemoglobin is still controversial (Magistretti and Pellerin, 1996), and the question is whether an increase in neuronal activity is always accompanied by the initial deoxygenation. For example, Narayan et al. (1995) suggested that the majority of the intrinsic signals can be attributed to the changes in light scattering related to blood volume increases in the rat somatosensory cortex. To solve these problems, not only spectroscopic information but blood flow information is indispensable.
The present study was designed to examine the origins of the activity-related optical intrinsic signals, and the dynamic changes in hemoglobin concentration and oxygenation were focused on. The intrinsic signals were observed at various wavelengths in the rat somatosensory cortex with the techniques of charge-coupled device (CCD) imaging and microspectrophotometry, and activity-related changes in regional cortical blood flow (rCBF) were also monitored with laser-Doppler flowmetry (LDF). In the light of an accurate knowledge of the time course of the rCBF changes we have interpreted the spatiotemporal profiles and wavelength dependency of the intrinsic signals. Furthermore, we have calculated the changes in several optical components that constitute the intrinsic signals with multicomponent spectral analysis and reported the dynamic changes in hemoglobin concentration and oxygenation.
Preliminary results have been published previously in abstract form (Nemoto et al., 1997; Sato et al., 1997).
MATERIALS AND METHODS
Animal preparation and somatosensory electrical stimulation
Male Wistar rats weighing between 200 and 250 g were initially anesthetized with 2% halothane. The left femoral vein and tail artery were cannulated for intravenous drug administration, blood pressure monitoring and blood gas analyses. After an intravenous injection of α-chloralose (80 mg/kg), halothane was discontinued (Lindauer et al., 1993). The animals were tracheotomized, immobilized with continuous infusion of pancuronium bromide (2 mg·kg−1·h−1 intravenously), and artificially ventilated with 60% N2 and 40% O2. Ventilation was adjusted to maintain arterial blood gas tension in the physiologic range. Anesthesia was maintained with continuous infusion of α-chloralose (20 mg·kg−1·h−1 intravenously). Rectal temperature was stabilized at 37.0°C ± 1.0°C with a heating pad.
The head of each rat was firmly fixed in a stereotaxic frame to prevent motion artifacts in optical imaging. The skull was exposed and the left parietal bone was thinned (5 × 7 mm) over the somatic sensorimotor cortex using a dental drill under continuous cooling with physiologic saline (Frostig et al, 1990; Masino et al, 1993; Blood et al, 1995). After hemostasis of the bleeding from diploic veins with bone wax, the thin skull window was filled with a jelly made of a carboxymethyl polymer to make the bone translucent, and a coverslip (15 mm in diameter) was placed over the jelly.
A pair of needle electrodes were inserted underneath the skin of the plantar and ankle region in the contralateral hind limb and then the posterior tibial nerve (peroneal nerve, in part) was transcutaneously stimulated with rectangular pulses of 3.6- to 4.0-mA intensity and 0.5-ms duration at a frequency of 5 Hz for 2.0 seconds. The interstimulus interval was 4 minutes. This electrical stimulation was provided by a stimulator (Synax ER 1100; NEC, Tokyo, Japan) linked with a spectrophotometer.
Optical imaging and data analysis
Rats were placed on the stage of a Zeiss Axiotron microscope with a cooled CCD (C4880; Hamamatsu Photonics, Hamamatsu, Japan). An objective lens with a magnification of 1.25×, 2.5×, 5×, or 10× and long working distances was used. The image data were acquired at either 10-bit depth and 500 (W) × 508 (H) pixels in size or 14-bit depth and 256 (W) × 256 (H) pixels. This system provided spatial resolution in the range from 9.6 μm over a 4.8 × 4.8-mm2 field to 2.4 μm over a 1.2 × 1.2-mm2 field, which made it possible to determine the microanatomic sources of the intrinsic signals, whether the signals originated from arterioles, venules, or the capillary bed. The cortex was epiilluminated with white light from a stabilized 150-W halogen bulb (MC-2563; Otsuka Electronics, Osaka, Japan). Digitized CCD images were obtained with an exposure time of 250 ms through transmission filters at 577 nm (half-width [Hw] 2 nm), 586 nm (Hw, 2 nm), 605 nm (Hw, 2 nm), 760 nm (Hw, 6 nm), and 805 nm (Hw, 8 nm), because these wavelengths reflect changes in the hemoglobin concentration and oxygenation state as described later. After the microscope was focused on the vascular structures of the cortical surface (from the level of pial vessels to capillaries) but not below the surface, using a 577-nm filter, 30 consecutive images including two prestimulus controls were acquired for each trial through the above filters at a rate of 500 or 600 ms synchronized to respiration. The images were analyzed by a pixel-by-pixel division and logarithm (Δ absorbance image) to detect intrinsic signals, using a computer program (HiPic; Hamamatsu Photonics, GmbH, Germany) as follows:
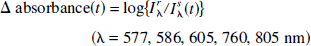
where Irλ is reflected light intensity at a wavelength of λ in the prestimulus state, and Isλ (t) represents reflected light intensity t seconds after the stimulus onset.
Δ Absorbance images were averaged across trials at each time epoch to cancel out shotnoise (high spatial frequency components) and biologic fluctuations (Bonhoeffer and Grinvald, 1996). Typical images at 577 and 586 nm were obtained by single trial or by averaging 2 to 5 trials because the peak magnitudes of the signals at these wavelengths were large (5% to 8% and 2% to 4% decrease of the reflected light, respectively), which were 5 to 10 times as large as the standard deviation of biologic fluctuations during prestimulus control states. On the other hand, the images at 605, 760, or 805 nm were averaged across 4 to 15 trials because the early signals at 605 and 760 nm and the signal at 805 nm were small (0.1% to 0.3% decrease), which were almost the same level as the biologic fluctuations.
Microspectrophotometric measurement and multicomponent spectral analysis
Reflected light from the activated cortex (capillary bed) in which the intrinsic signals had been detected by optical imaging was then guided to a spectrophotometer (MCPD 2000, Otsuka Electronics, Osaka, Japan) through a quartz light guide (2 mm in diameter) inserted into the eyepiece segment of the microscope (Watanabe et al., 1994). A sequence of absorbance spectra (500 to 850 nm, 1.63-nm resolution) from the spot (approximately 400 μm in diameter with a 5× objective lens) was obtained at a rate of 500 ms for 38 seconds (a 20-second prestimulus period and an 18-second poststimulus onset period), using a piece of white polyvinyl tape as a standard reference. Because the actual absorbance spectra are greatly affected by the instrumentation properties and include a nonlinear baseline caused by light scattering and unknown absorbers (Jöbsis et al., 1977; LaManna et al., 1987), Δ absorbance spectra (difference spectra of poststimulus onset absorbance minus prestimulus absorbance) were adopted. A multicomponent least-square curve-fitting analysis was then performed for quantification of changes in concentrations of oxyhemoglobin (oxyHb) and deoxyhemoglobin (deoxyHb) using the following equations:
where I°λ is the reflected light intensity of the reference at the wavelength λ (500 to 850 nm); Lλ and ɛλ represent mean light path length and the absorption coefficient of each component at the wavelength λ, respectively; Lλ is almost constant with changes in the hemoglobin concentration and oxygenation state under physiologic conditions (Nomura et al., 1997); Δ[oxyHb(t)], Δ[deoxyHb(t)], and Δ[water(t)] are changes in concentration of each component; Δ[water(t)] primarily improved the curve fitting in the near-infrared (NIR) wavelength range; and ΔK(t) is change in the wavelength-independent component, which may be related to the light scattering (Malonek et al., 1996, 1997). In blood-free preparations (cortical slices and large nerves), the optical intrinsic signals caused by changes in light scattering have been also observed to be independent of wavelength (Cohen and Keynes, 1971; Grinvald et al., 1982; Frostig et al., 1990). Changes in the total hemoglobin concentration were calculated as follows:

Blood flow measurement with laser-Doppler flowmetry
Changes in rCBF caused by functional stimulation were measured with a laser-Doppler flowmeter (prefix PF 3, Perimed, Stockholm, Sweden; wavelength of 632.8 nm) and a probe (Probe 301, Perimed; angled probe; one transmitter and two receivers; fiber diameter, 0.125 mm; fiber separation, 0.25 mm). The probe was installed in a dummy case of an objective lens and was precisely placed over the activated cortex (capillary bed) in which the intrinsic signals had been detected by optical imaging, then the stage of the microscope was advanced up on the probe. The time constant of the LDF was set to 200 ms, and the perfusion signals were digitized at 32 Hz and transferred to a computer. Then rCBF was monitored for 40 seconds (20-second periods before and after the stimulus onset) at a rate of 500 ms (16 data points per 500 ms were averaged). Changes in rCBF were expressed as a percentage of the prestimulus baseline (%rCBFLDF).
Statistical analysis
The data for spectrophotometry and LDF were time-locked to the onset of the hind limb electrical stimulation; the times in the data indicated when the data collection started with respect to the onset of the stimulation. Averages and SD of the changes in absorbance, hemoglobin, and other components and %rCBFLDF were calculated and tested for significance using Student's paired t test.
RESULTS
Physiologic data
All physiologic variables were stable during data acquisition. Arterial blood gas status was as follows: PaO2, 128 ± 22 mm Hg (mean ± SD, n = 25); PaCO2, 39.3 ± 3.4 mm Hg; pH 7.38 ± 0.03. Mean arterial blood pressure had a range of 105 to 149 mm Hg (122 ± 13 mm Hg), and no major changes were detected during and after the stimulation in analog recordings. However, digitized data on MABP in additional experiments showed that the electrical stimulation (3.8-mA intensity) caused a little increase in MABP from 2.0 to 6.0 seconds after the stimulus onset. Maximal change in MABP was 2.4 ± 2.6 mm Hg (mean ± SD, P < 0.01, n = 75, 5 rats) at 3.5 seconds.
Optical imaging
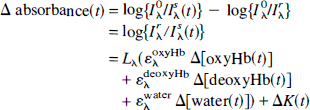
Optical imaging of intrinsic signals was performed in 25 rats following the protocol described above. Intrinsic signals were detected centered at 2 to 3 mm lateral and 1 to 2 mm caudal to the bregma as shown in Fig. 1. Intrinsic signal responses at each wavelength exhibited consistent characteristics in the time course, magnitude, and distribution. Judging from the spatiotemporal profiles of intrinsic signals, we divided the signal responses into two groups, namely, (1) the 577-, 586-, and 805-nm group and (2) the 605- and 760-nm group.
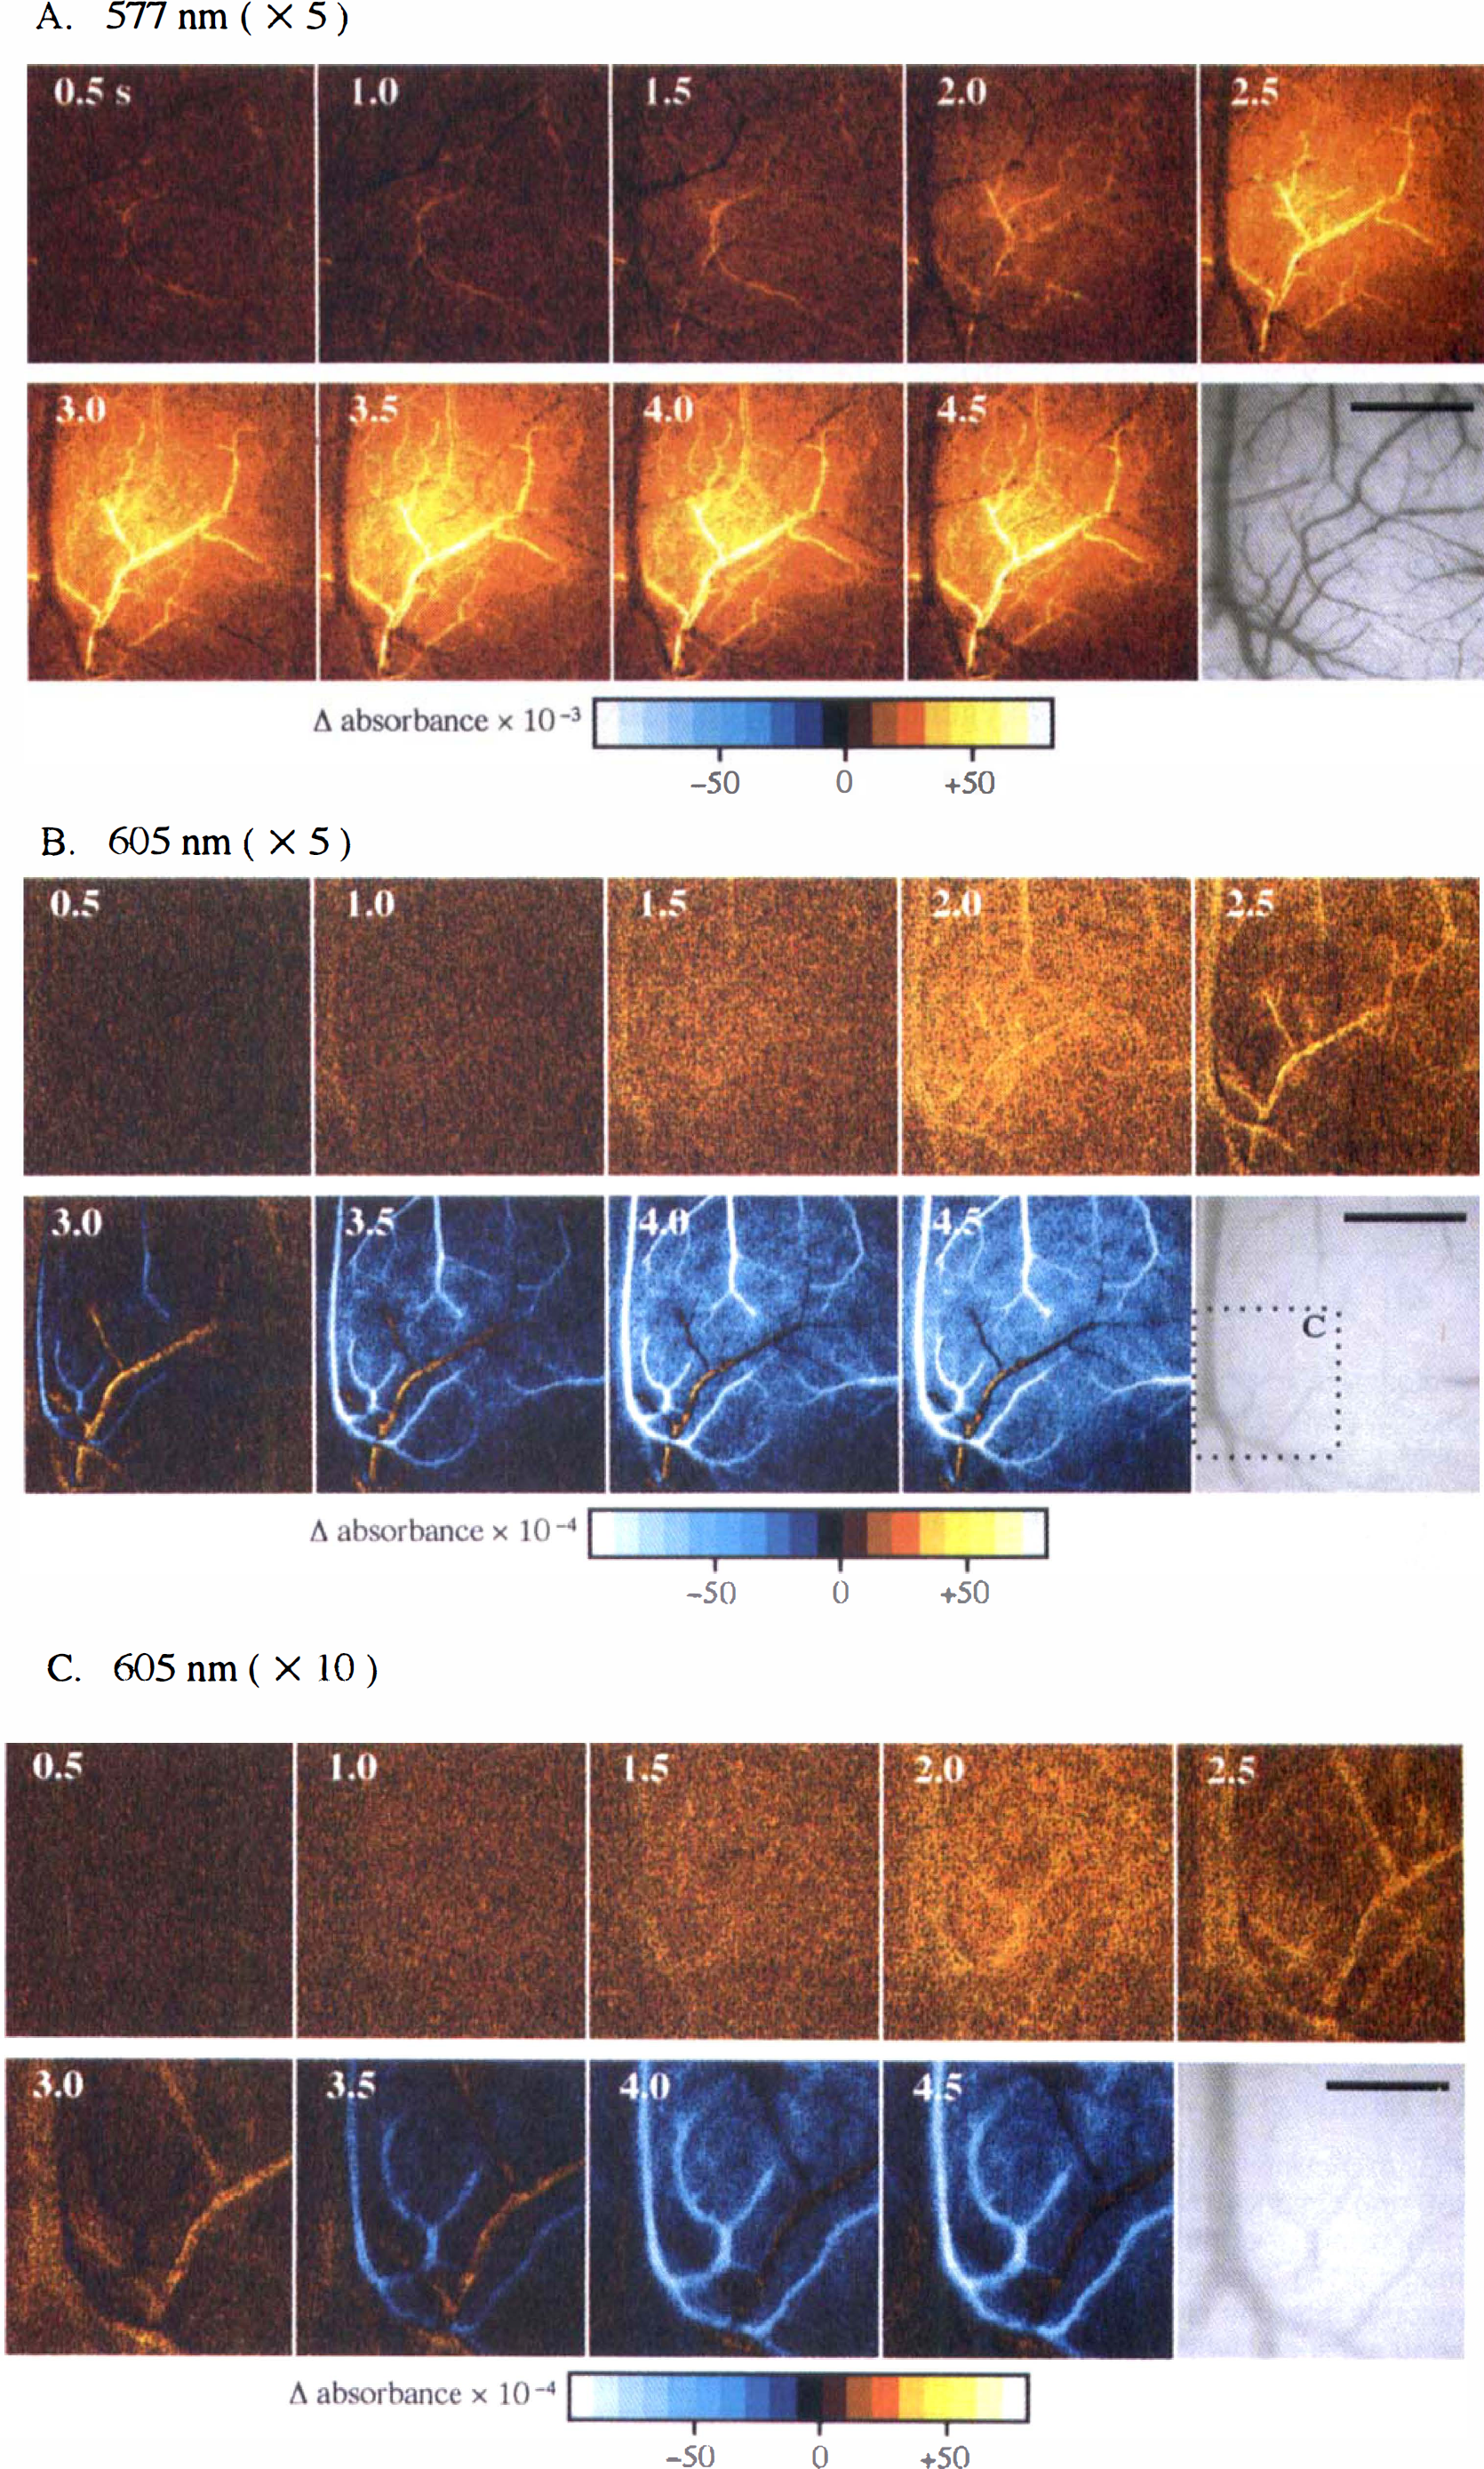
Spatiotemporal dynamics of typical intrinsic signals at a wavelength of 577 nm in the 2.0-second, 5-Hz stimulation. The magnitude of the signals in each pixel was calculated by absorbance changes (Δ absorbance, see the text) from a prestimulus control to poststimulus onset images, and was color-coded to draw the map of the signals. The times in the frames indicate when the collection of the frame data started with respect to the stimulus onset. The bottom left frame shows the original charge-coupled device (CCD) image over the parietal cortex through the thinned skull. The microscope was focused at the cortical vasculature through a 577 nm (half-width, 2 nm) transmission filter with a 2.5× objective lens. The image data were acquired at 10 bits in depth and 500 (W) × 508 (H) pixels in size over a 4.8 × 4.8-mm2 field. (Orientation: top, sagittal; left, rostral; B, bregma; solid arrows, parietal branches of the middle cerebral artery; open arrows, superficial cortical veins. Scale bar, 1 mm.)
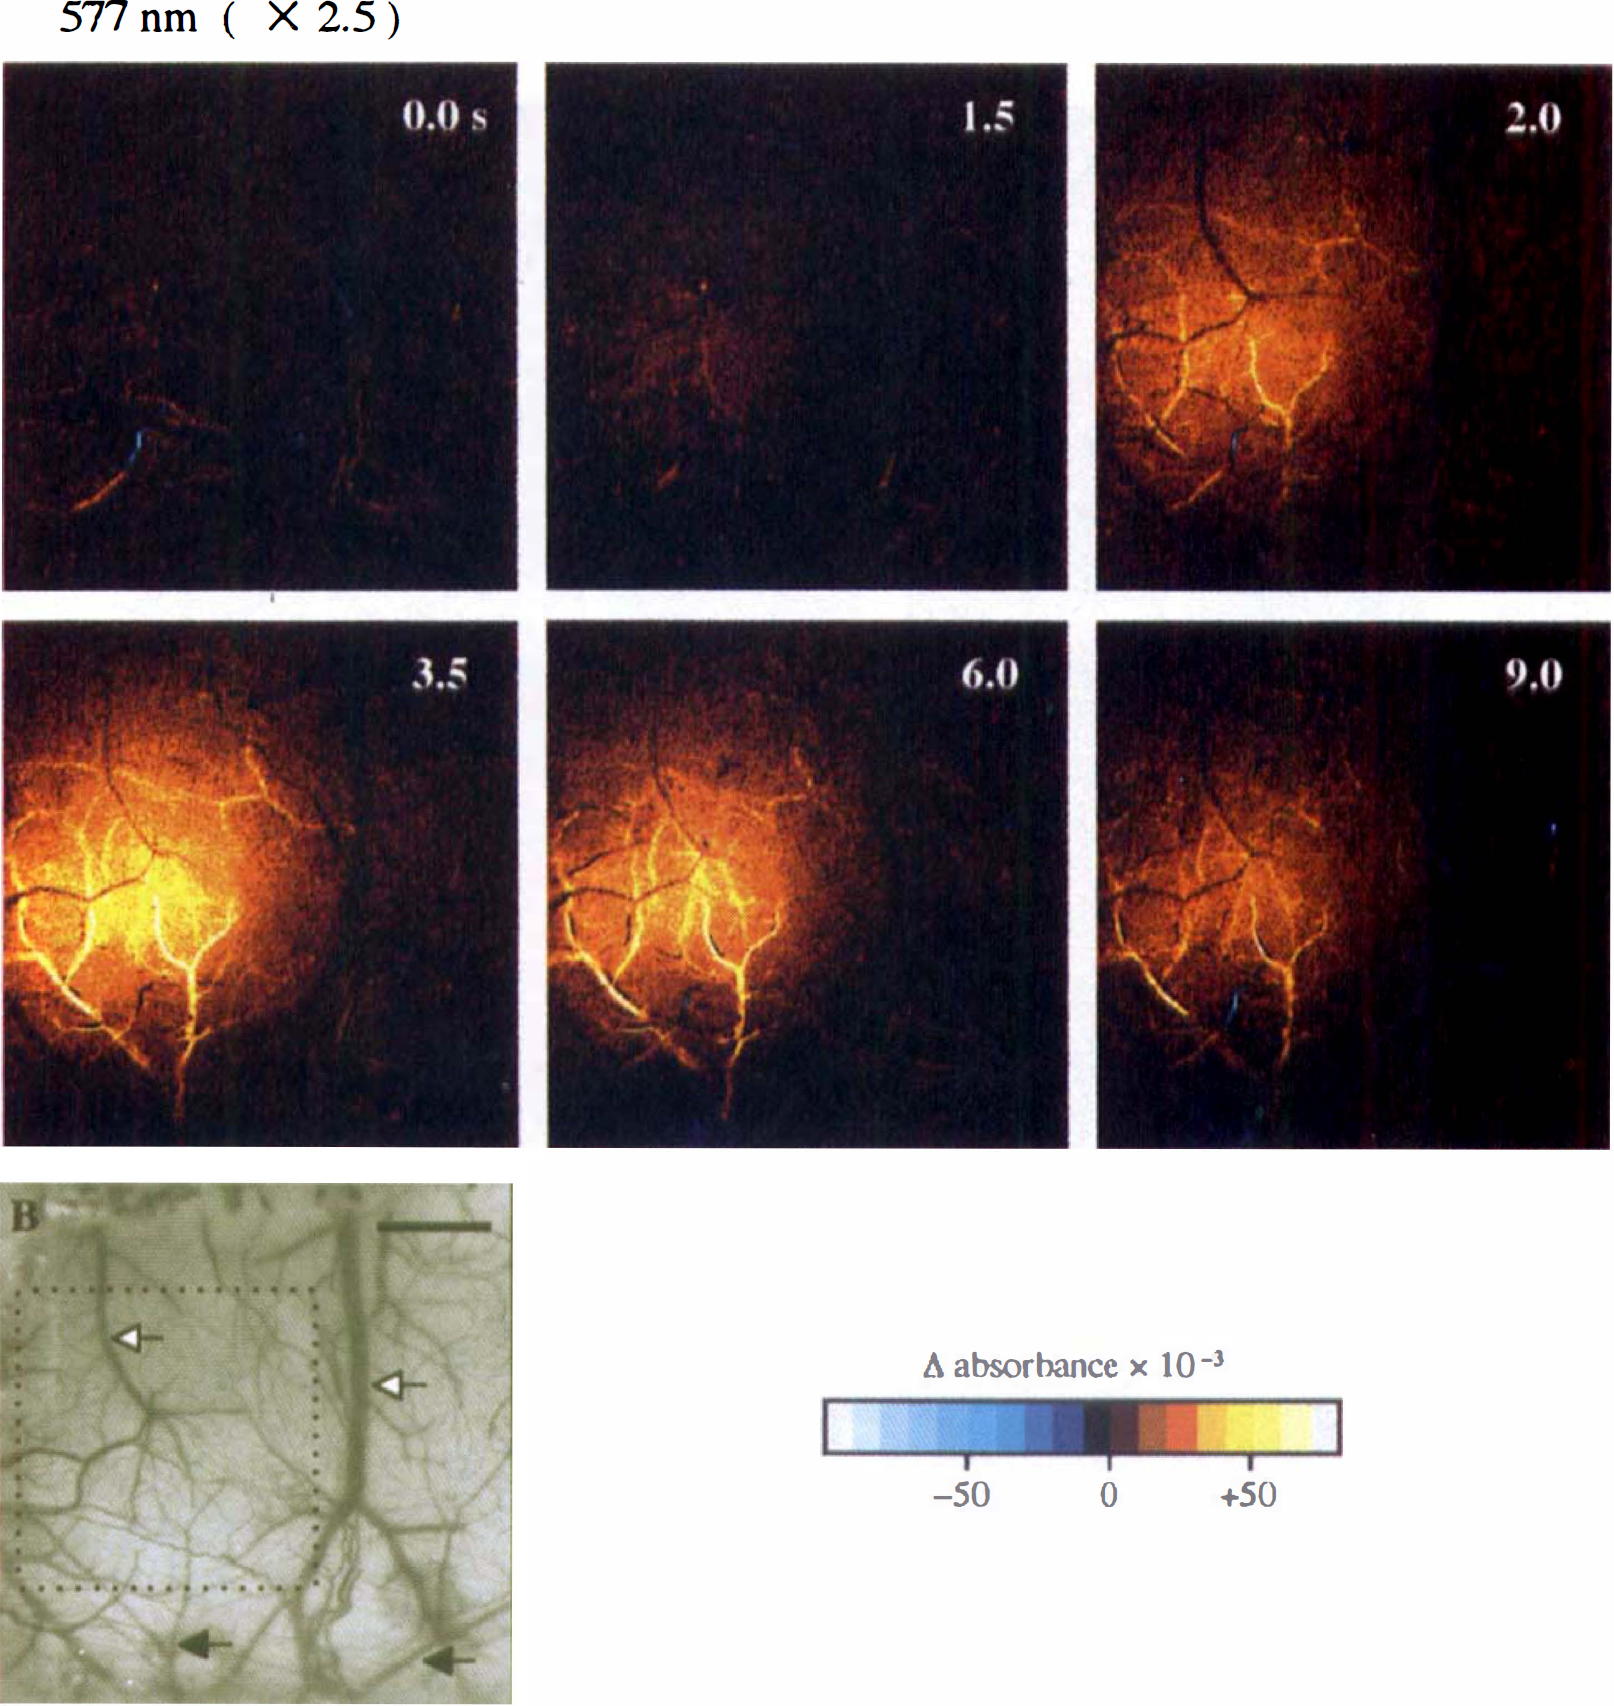
Intrinsic signal responses at 577, 586 and 805 nm. Intrinsic signals at 577, 586, and 805 nm were always detected as an increase in absorbance. Figure 1, 2, and 3A show sequential images of Δ absorbance at 577, 586, and 805 nm. Diffuse signals originating from the capillary bed or cerebral tissue appeared 1.5 seconds after the stimulus onset, their magnitude peaked at 3.0 to 4.0 seconds, and they almost disappeared by 9.0 seconds. The spatial extent of the diffuse signals was about 2 mm in diameter at the peak time. The magnitude was maximal near the center of the diffuse signals and gradually decreased marginally (Fig. 1). The peak magnitude of the diffuse signals at 577 nm was at least twice as large as that at 586 nm, whereas the peak magnitude at 805 nm in the NIR wavelength range was small, about 1/15 to 1/10 as large as that at 586 nm (Fig. 2).
Wavelength dependency of spatiotemporal profiles in the intrinsic signal responses to the 2.0-second, 5-Hz stimulation. The top frames are the original CCD images obtained at 577, 586, 605, 760, and 805 nm, showing the area that was surrounded by broken lines in the bottom left frame of Fig. 1. The digitized data are 14 bits in depth and 256 × 256 pixels in size over a 2.4 × 2.4-mm2 field. The signal images at 577 and 586 nm display one typical trial; on the other hand, the images at 605, 760, and 805 nm represent the averages across four trials to improve the signal-to-noise ratio. The color-coded scale at 577 and 586 nm indicates Δ absorbance × 10−3; at 605, 760, and 805 nm, Δ absorbance × 10−4. (Scale bar, 1 mm.)
Microanatomic sources of intrinsic signals at 577
Large curvilinear signals primarily originated from pial arteries, that is, parietal branches of the middle cerebral artery and, occasionally, the anterior cerebral artery. These signals of pial arteries started from near the center of the diffuse signals, and then extended to the proximal vessels or the branches of the vessels (Figs. 1, 2, and 3A), which we found to be closely related to the dilation of the arterioles by referring to the original CCD images. In contrast, the signals coming from cortical veins were inconspicuous; we could detect small signals of an increase in absorbance at 577 nm in fine venules, but not in large cortical veins (Fig. 3A). In the images at 805 nm, as compared with the images at 577 and 586 nm, the signals that originated from the cortical vasculature were indistinct from diffuse signals (Fig. 2).
Intrinsic signal responses at 605 and 760 nm. The spatiotemporal characteristics of intrinsic signals at 605 and 760 nm were quite different from those at 577, 586, and 805 nm. Figures 2, 3B and C show sequential images of Δ absorbance at 605 and 760 nm. Diffuse signals were detected as an absorbance increase in the early phase and an absorbance decrease in the late phase. In the images at 605 nm, the diffuse signals appeared 1.0 seconds after the stimulus onset, their magnitude peaked at 2.0 seconds, then they showed a large absorbance undershoot and almost disappeared by 9.0 seconds. The diffuse signals of an absorbance increase in the early phase were confined in a small area. By contrast, those of an absorbance decrease in the late phase were flattened and widespread along the cortical veins. The spatiotemporal characteristics of the signals at 760 nm were similar to those at 605 nm, but the magnitude was smaller (1/10 to 1/2) and the turning point of the signal direction was observed a little later than at 605 nm (Fig. 2).
Large curvilinear signals, showing biphasic patterns like the diffuse signals, came from cortical veins, whereas other large signals, displaying a direction opposite to the diffuse signals in the late phase, originated from dilated pial arteries (Fig. 3B and C). First, the venous signals came into view as an absorbance increase at 1.5 seconds; second, not only the venous signals but also arterial signals were clearly observed as an absorbance increase at 2.0 seconds; third, the arterial signals became prominent at 2.5 to 3.0 seconds; finally, the venous signals exhibited an absorbance decrease like the diffuse signals after 3.0 to 3.5 seconds, while the arterial signals continued to display an absorbance increase. In addition, the venous signals were observed at a low magnification (1.25 ×, 2.5 ×) to go downstream from the venules near the center of the diffuse signals to the larger cortical veins distant from the center as time passed. On the other hand, at a higher magnification (5×, Fig. 3B; 10×, Fig. 3C), the heterogeneity in the magnitude of the signals was detected inside large cortical veins.
Microspectrophotometric measurement and multicomponent spectral analysis
A total of 74 microspectrophotometric measurements and multicomponent spectral analyses were performed in 8 rats after optical imaging of intrinsic signals. The activity-related changes in absorbance spectra were obtained mainly from the capillary bed in which the intrinsic signals were detected by optical imaging.
Activity-related changes in absorbance spectra (500 to 850 nm). Figure 4A and B show typical changes in the absorbance spectra and Δ absorbance spectra taken for 10 seconds and 8 seconds after the stimulus onset, respectively. These spectra and difference spectra were good illustrations of a great influence of changes in hemoglobin concentration and oxygenation state, compared with the absorption coefficient spectra of the main absorber in the cerebral tissue (Fig. 4C): for the first 2.0 seconds the absorbance in the wavelength range from 500 to 850 nm gradually rose; for the next 2.0 seconds the absorbance near 542 and 577 nm mounted; in contrast, the absorbance near 600 nm fell, then the absorbance from 500 to 850 nm was almost restored to the baseline level 10 seconds after the stimulus onset (Fig. 4B).
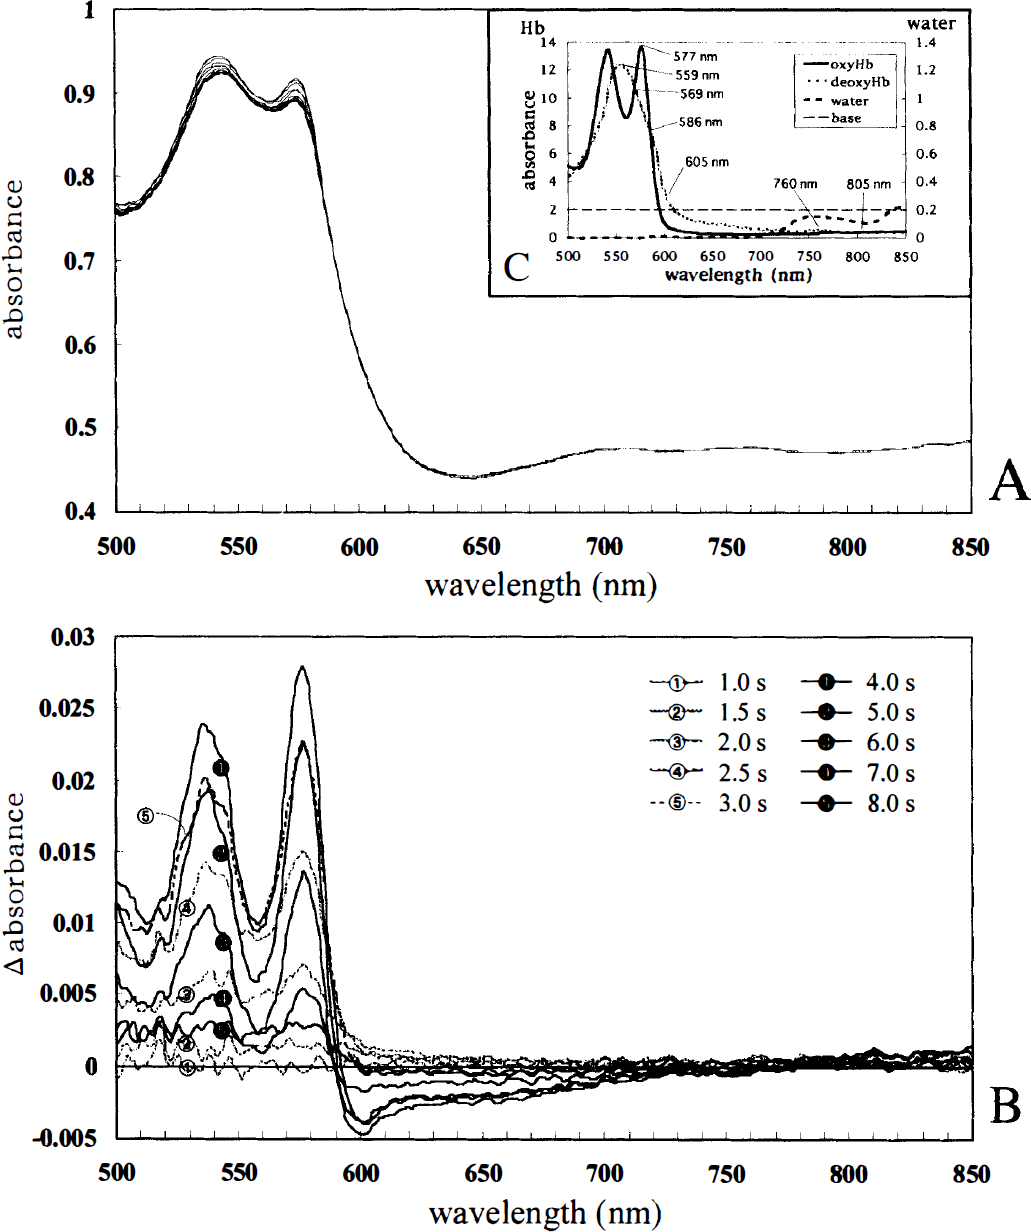
Activity-related changes in absorbance spectra (500 to 850 nm) obtained mainly from the capillary bed (400 μm in diameter) where the intrinsic signals had been detected by optical imaging.
Fig. 5A shows the time courses of changes in absorbance at four different wavelengths (559, 569, 577, and 586 nm) in 74 measurements. The absorbance began to increase 1.0 and 1.5 seconds after the stimulus onset, rose with a steep slope from 2.0 to 3.0 seconds, peaked at 3.0 to 4.0 seconds, and returned to near the baseline level 7.0 to 10.0 seconds after the stimulus onset. Fig. 5B shows the time courses of absorbance changes at four other wavelengths (600, 605, 610, and 620 nm). The absorbance changes showed biphasic patterns: they started to increase at 0.5 to 1.0 seconds, peaked at 2.0 seconds, and then decreased largely in the late phase (with a negative peak at 5.0 seconds). Fig. 5C shows the time courses at 760, 805, 830, and 850 nm in the NIR wavelength range. The absorbance changes showed biphasic patterns at 760 nm, but increases at 805, 830, and 850 nm in a monophasic pattern.
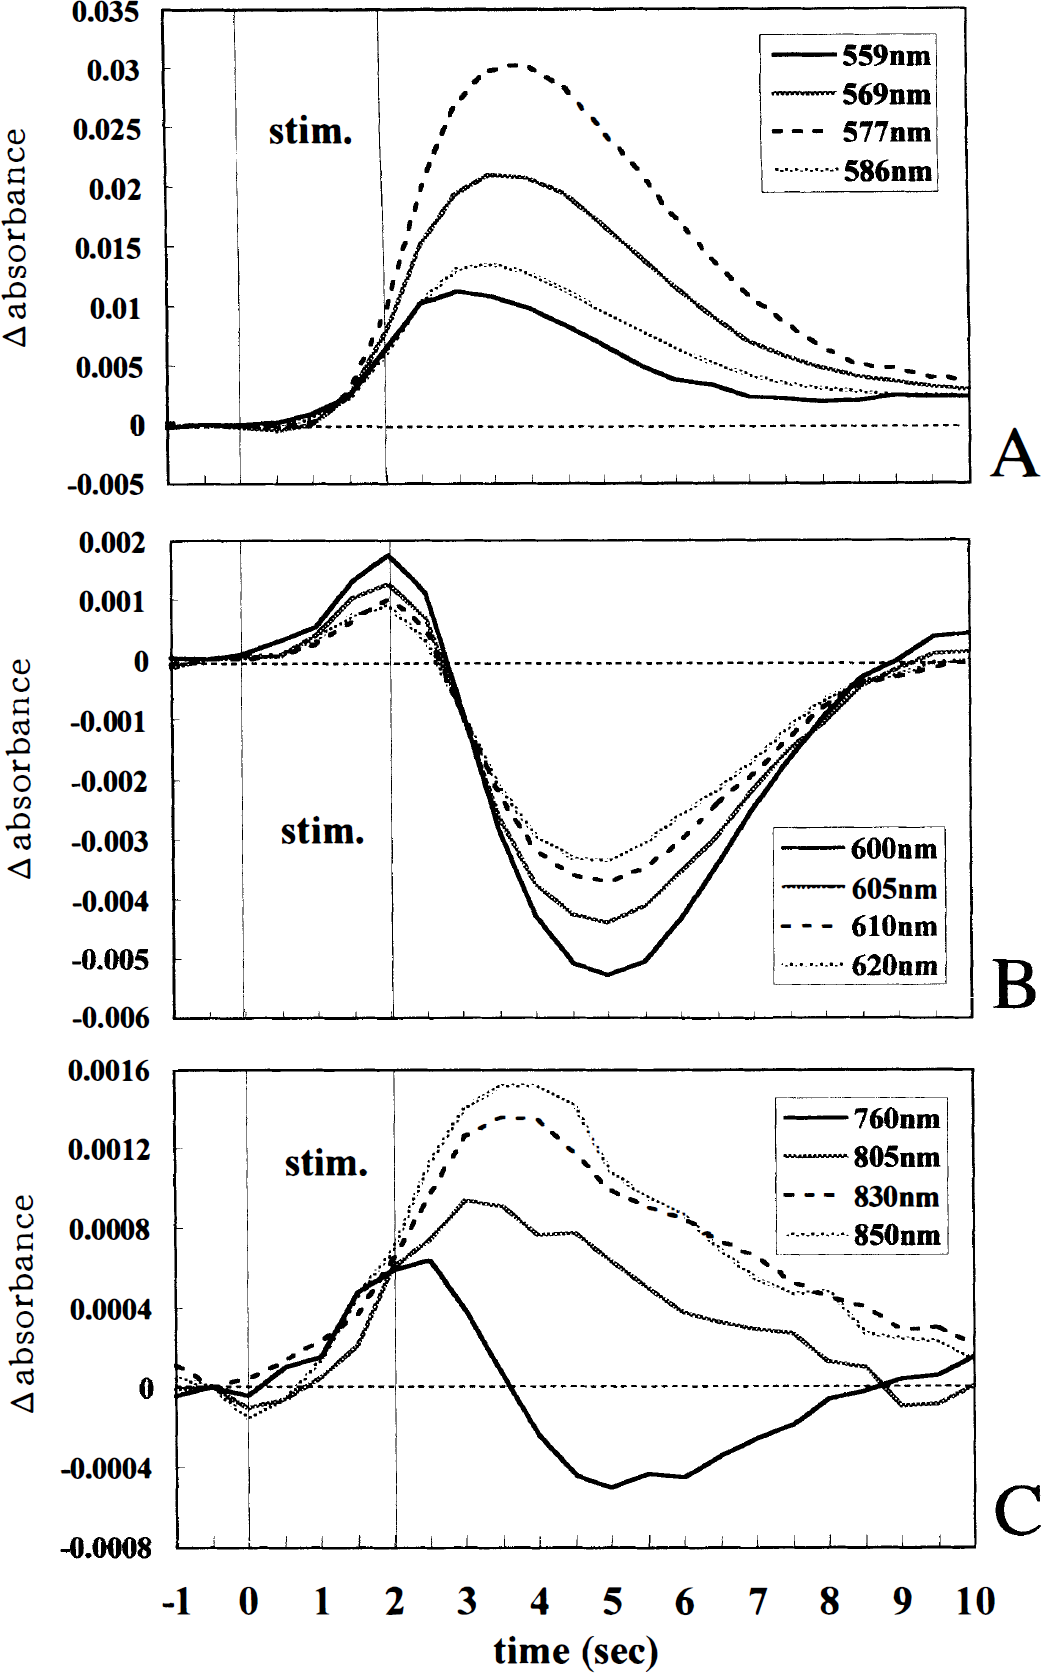
Time courses of the Δ absorbance at the wavelengths sensitive to the hemoglobin concentration and oxygenation state in the 2.0-second, 5-Hz stimulation (averages of 74 trials in eight rats). The times in the data indicated when the data collection started with respect to the onset of the stimulation (stim.).
Thus, the absorbance in the wavelength ranges of 500 to 588 and 780 to 850 nm increased in a monophasic pattern after the stimulus onset. On the other hand, the absorbance changes in the wavelength range of 592 to 770 nm showed biphasic patterns. In addition, the absorbance increases at 559, 600, 605, 610, 620, and 760 nm preceded the increases at 569, 577, 586, 805, 830, and 850 nm (Fig. 5, see legend).
Changes in the oxyhemoglobin and deoxyhemoglobin components. The changes in the concentrations of hemoglobin derivatives were calculated with multicomponent analysis. Fig. 6 shows the time courses of the changes in the oxyhemoglobin, deoxyhemoglobin, and total hemoglobin components. The oxyhemoglobin component started to increase at 1.5 seconds (P = 0.0012), peaked at 4.0 seconds, and returned to near the baseline level 9.0 seconds after the stimulus onset. In contrast, the deoxyhemoglobin component significantly increased in the early stage (P = 0.016 at 1.0 seconds; P = 0.00038 at 1.5 seconds) and decreased to a minimum value at 4.5 seconds, then returned to near the original level 9.0 seconds after the stimulus onset. The total hemoglobin component, the sum of the oxyhemoglobin and deoxyhemoglobin components, began to increase at 1.5 seconds, peaked at 3.5 seconds, and then returned to near the baseline level.
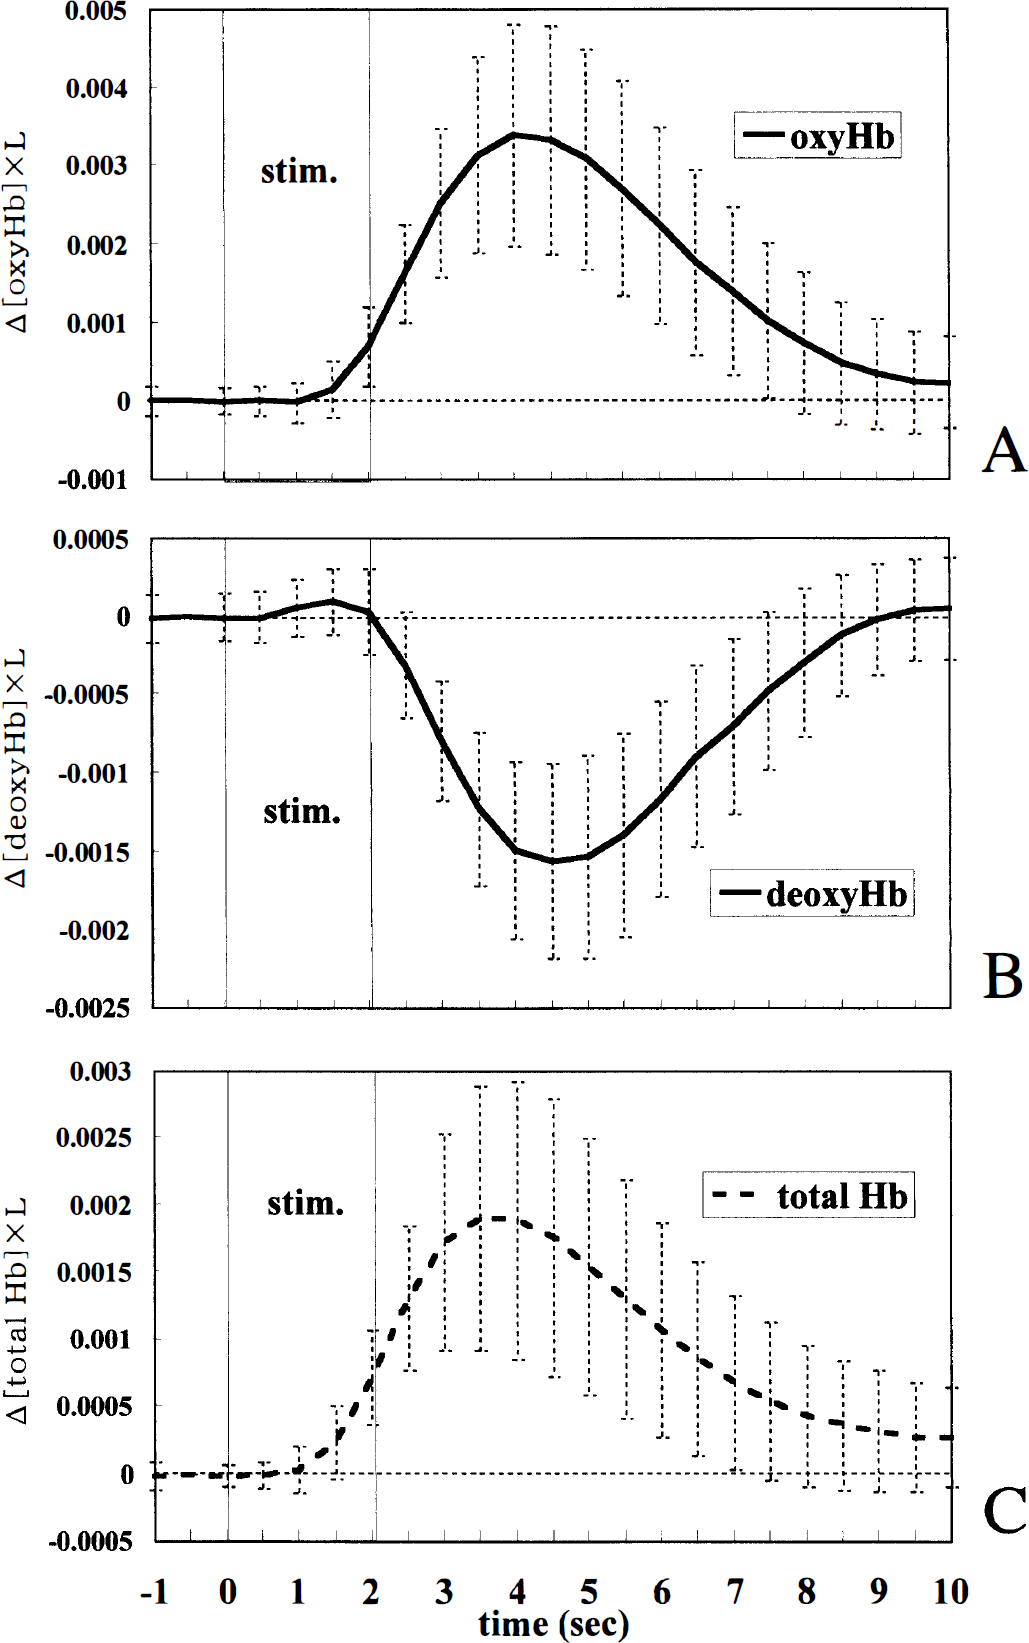
The time courses of the changes in the oxyhemoglobin (oxyHb), deoxyhemoglobin (deoxyHb), and total hemoglobin (total Hb) components in the 2.0-second, 5-Hz stimulation (averages ± SD of 74 trials in eight rats). (Δ[oxyHb, deoxyHb or total Hb], concentration changes in each absorber; L, mean light pass length.)
Changes in the water and wavelength-independent components. Fig. 7 shows the time courses of the changes in the water and wavelength-independent components. The water component slightly decreased in the early phase and largely increased in the late phase. In contrast, the wavelength-independent component significantly increased from the earliest stage (P = 0.0050 at 0.5 seconds) and decreased in the late phase.
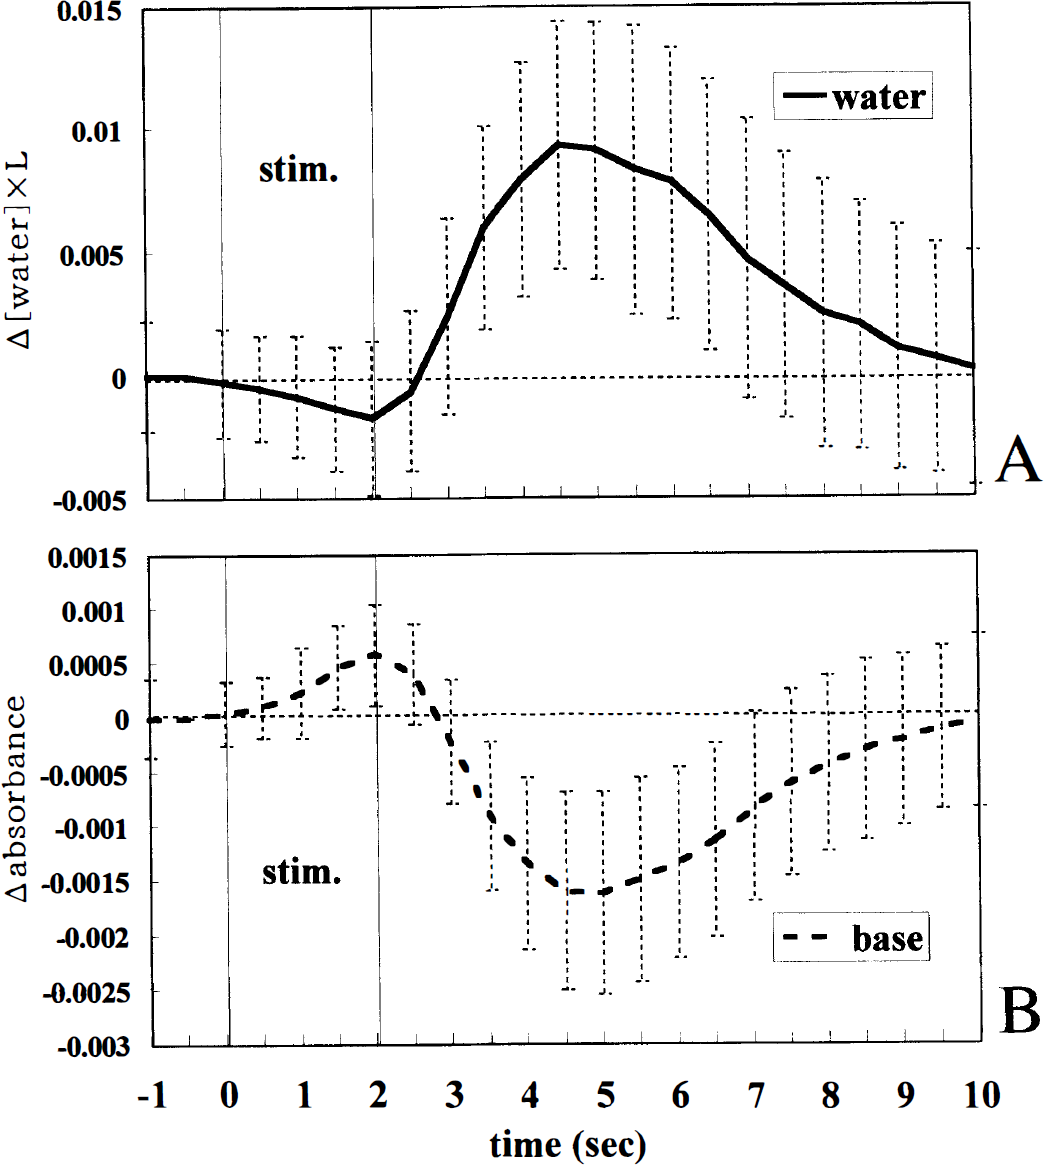
The time courses of the changes in the water and wavelength-independent components in the 2.0-second, 5-Hz stimulation (averages ± SD of 74 trials in eight rats). (Δ[water], concentration changes in the water component,) “Base” represents the wavelength-independent component, that is, a baseline component independent of wavelengths for multicomponent curve-fitting analysis (ΔK, see the text).
Blood flow measurement with laser-Doppler flowmetry
A total of 44 blood flow measurements with LDF were performed in eight rats after optical imaging of intrinsic signals. Fig. 8 shows the time course of %rCBFLDF in the activated cortex: rCBFLDF started to rise at 1.5 seconds (P = 0.000058), peaked at 3.5 seconds (an increase of 26.7% ± 9.7% above the rCBFLDF baseline), and then decreased. The time course of %rCBFLDF is similar to that of the changes in absorbance at 569, 577, and 586 nm, or that of the changes in the total hemoglobin or oxyhemoglobin component.
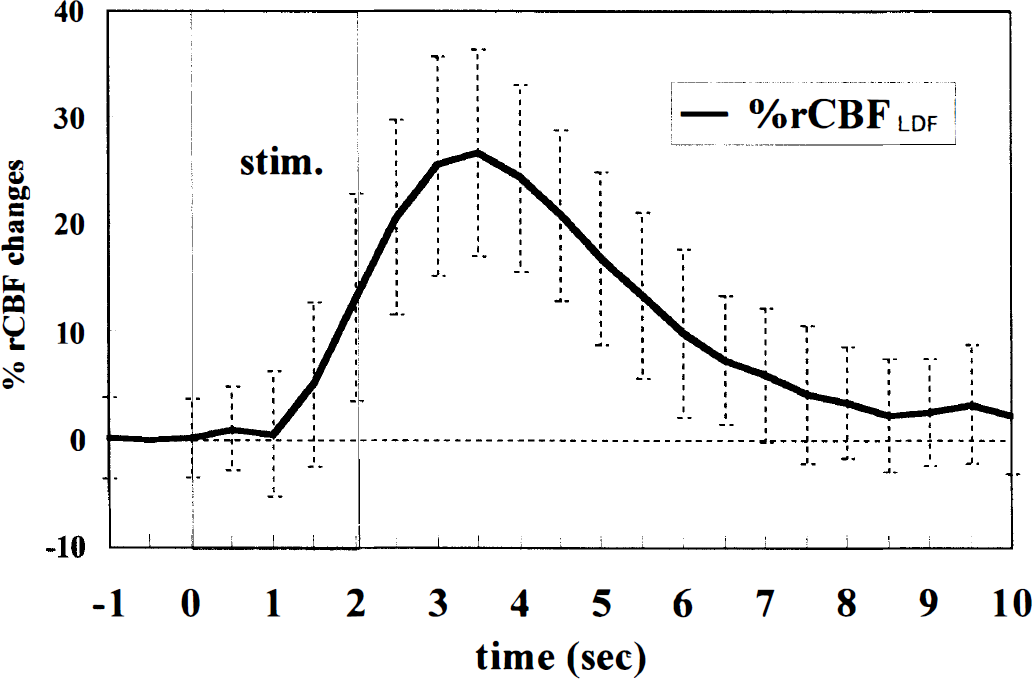
The time course of the changes in regional cortical blood flow (rCBF) measured with laser-Doppler flowmetry in the 2.0-second, 5-Hz stimulation (average ± SD of 44 trials in eight rats). Changes in rCBF are expressed as percentage of prestimulus baseline (%rCBFLDF). The rise time was 1.5 seconds and the peak magnitude of %rCBFLDF was 26.7% ± 9.7% at 3.5 seconds.
DISCUSSION
Electrical stimulation
A precise study on the electrophysiologic basis of the methodology of the electrical stimulation to the hind limb has been reported by one of the collaborators in this study (Koyanagi and Tator, 1996). In addition, other investigators have already explored the vascular response and the laser-Doppler flow response to hind-limb electrical stimulation in the rat (Ngai et al., 1988, 1995). Therefore, as a method for activation of the somatosensory cortex we selected electrical stimulation to the hind limb, but not natural stimulation. We have tried to elucidate the relationship between the intrinsic signals and the widely known rCBF response. The stimulus intensity (3.6 to 4.0 mA) used in the present study was at a level just above the motor and sensory thresholds, which is sufficient to excite large-diameter fibers such as Aα and Aβ axons, but not Aδ and C fibers (Sato et al., 1969; Fehlings et al., 1988). On the other hand, the threshold for dilator responses of pial arterioles is near the sensory threshold level, thus the innocuous stimuli of 3.6- to 4.0-mA intensity and 0.5-ms pulse duration made it possible to elicit activity-related rCBF responses. Although systemic blood pressure was slightly affected at stimulus intensity of 3.8 mA in this study, the increase of 2 to 3 mm Hg in MABP might influence on rCBF to only a little extent (Ngai et al., 1988; Dirnagl and Pulsinelli, 1990). As for the effect of the stimulus frequency, it is generally agreed that somatosensory stimuli at frequencies of 4 to 10 Hz bring about a maximal rCBF response (Leniger-Follert and Hossmann, 1979; Fox and Raichle, 1984; Ngai et al., 1988; Ibáñez et al., 1995). We also observed a maximal response in arteriolar dilation and rCBF when we chose to stimulate at a frequency of 5 Hz. Furthermore, we found that the magnitudes of the optical response signals at 577 and 586 nm and the undershoot signals at 605 nm were closely correlated to those of the rCBF responses. Consequently, we could analyze the optical signals originating from activity-related blood flow responses because we could control the time course and the magnitude of the blood flow response by altering the parameters of electrical stimulation (Sato et al., 1997).
Blood flow oscillations
During the experiments we frequently encountered periodic signals in the frequency range of 4 to 12 cycles/min in optical imaging. The signals in the images of Δ absorbance at 577 and 586 nm showed periodic changes in the amplitude and the location along pial arteries; the signals at 605 nm, along cortical veins. These signals, which were synchronized with laser-Doppler flow oscillations and vasomotions of pial arteries, moreover, were enhanced in amplitude by hyperventilation and hypotension. Thus these signals were identified as the low-frequency spontaneous flow oscillations investigated in detail with LDF (Dirnagl et al., 1989; Morita-Tsuzuki et al., 1992; Hudetz et al., 1992, 1995), and their amplitudes were sometimes observed to be the largest of biologic fluctuations. When the periodic signals were prominent, absorbance in the wavelength range of 500 to 850 nm oscillated with a phase peculiar to each wavelength. Multicomponent analyses of these spectra indicated that each oxyhemoglobin and deoxyhemoglobin component also oscillated with a different phase; consequently, the hemoglobin concentration and oxygenation oscillated. When the somatosensory cortex was activated under the conditions of large-amplitude flow oscillations, the time courses of the oxyhemoglobin and deoxyhemoglobin components were altered in a regular fashion related to the phase of the oscillations in which the neuronal activation set in. During the increasing phase of rCBF oscillations, no activity-related initial increase in the deoxyhemoglobin component could be detected; conversely, during the decreasing phase, it appeared to be enhanced. In the same way, the activity-related monophasic increase in the oxyhemoglobin component was enhanced, attenuated, or even inverted temporarily by oscillations. On the other hand, the phase of oscillations was reset by neuronal activation. Thus, the data that were obtained when the flow oscillations were so strong that the amplitude was greater than half the activity-related absorbance changes were excluded from analysis.
Optical imaging
The spatial distribution of the optical intrinsic signals in the present study was consistent with previous mapping studies with electrophysiology (Hall and Lindholm, 1974; Sakatani et al., 1990): the center of the cortical area where the diffuse signals were observed at various wavelengths showed a good correspondence with the domain where the peaks of somatosensory evoked potential at latencies of 13 to 18 ms (cortical components) had been recorded with maximal amplitude (Koyanagi and Tator, 1996). However, the spatial extent of intrinsic signals significantly varied with different wavelengths, the timing of observation, and macrovasculature (Fig. 2).
Intrinsic signal responses at 577, 586, and 805 nm. Optical imaging at the three wavelengths of 577, 586, and 805 nm is sensitive to changes in the concentrations of oxyhemoglobin and total hemoglobin. The images of Δ absorbance at 586 nm, an isosbestic point of oxyhemoglobin and deoxyhemoglobin (Fig. 4C), reflect changes in the concentration of the total hemoglobin and in the light scattering. The monophasic increase in the diffuse signals at 586 nm is likely to indicate the activity-related blood volume increase (Frostig et al., 1990; Narayan et al., 1995). This observation might be explained by the expansion of microvessels (Atkinson et al., 1990; Duelli and Kuschinsky, 1993; Villringer et al., 1994) and recruitment of red blood cells to poorly perfused capillaries, but not opening of previously nonperfused capillaries (Villringer et al., 1994; Hudetz et al., 1997).
The images of Δ absorbance at 577 nm, a peak wavelength of oxyhemoglobin (Fig. 4C), are greatly affected by changes in the oxyhemoglobin concentration. Compared with the images of Δ absorbance at 586 nm, the images at 577 nm had higher amplitude response signals originating from the capillary bed (Fig. 2). This difference might be explained by changes in blood oxygenation in the capillaries: the regional blood flow increases over the oxygen consumption in the activated cortex (Fox et al., 1986), and the blood in the hyperoxygenation state passes through the capillaries (Leniger-Follert and Hossmann, 1979; Hoshi and Tamura, 1993; Ogawa et al., 1992).
In these images, the macrovascular signals were mainly traced to the branches of the middle cerebral artery, but sometimes simultaneously to those of the anterior cerebral artery. This observation means that the primary sensory cortex of the hind limb is anatomically located in the arterial border zone between the middle cerebral artery and anterior cerebral artery, and furthermore, is functionally supplied with blood from both of them. On the other hand, we could not detect signals in large cortical veins, which might be explained by the nonlinear relationship between the changes in concentrations of hemoglobin derivatives and the absorbance changes in high absorbance range (Nioka et al., 1990b).
The images of Δ absorbance at 805 nm, the isosbestic point of oxyhemoglobin and deoxyhemoglobin in the NIR wavelength range (Fig. 4C), are influenced by changes in the total hemoglobin concentration, similar to the images at 586 nm. However, the absorbance changes arising from hemoglobin derivatives in the NIR wavelength range are much less than those in the visible wavelength range. Instead, the activity-related changes in light scattering are not so different between the visible and NIR wavelength range (Cohen and Keynes, 1971; Grinvald et al., 1982; Frostig et al., 1990; MacVicar and Hochman, 1991). Consequently, the light-scattering changes may contribute to the signals in the NIR wavelength range to a relatively greater extent (Bonhoeffer and Grinvald, 1996).
Intrinsic signal responses at 605 and 760 nm. Optical imaging at 605 and 760 nm is sensitive to changes in the concentration of deoxyhemoglobin, because both the ratio of ɛdeoxyHbλ to ɛoxyHbλ and the difference between ɛdeoxyHbλ and ɛoxyHbλ are significantly large at 605 nm, and both of them are relatively large at 760 nm, a peak wavelength of deoxyhemoglobin in the NIR wavelength range (Fig 4C). The spatiotemporal aspects of the images of Δ absorbance at 605 and 760 nm were complicated, because deoxygenation of hemoglobin, dilation of arterioles, and expansion of capillaries and venules augmented the absorbance at 605 and 760 nm; on the other hand, the overcompensatory blood flow increase caused by that dilation of arterioles reduced the absorbance in the capillaries and draining veins because of a decrease in the deoxyhemoglobin concentration. To more concretely explain the origin of the signals in the images of Δ absorbance at 605 nm, the emergence of the diffuse signals at 1.0 to 1.5 seconds and the subsequent venous signals at 1.5 to 2.0 seconds might be caused by an increase in deoxyhemoglobin in the capillaries and then in venules. Arterial signals detected as an increase in absorbance after 2.0 seconds probably originated from dilation of the pial arterioles. The diffuse signals and venous signals observed as a decrease in absorbance after 3.0 to 3.5 seconds might indicate a decrease in deoxyhemoglobin in the capillaries and veins.
Furthermore, the signals inside of the large cortical vein were frequently observed to be localized on one side of the vein (Fig. 3B and C), which may indicate that the blood, having passed through the activated cortex, does not blend with other venous blood but flows in layers after draining into the large cortical vein. This one-sided distribution of intravascular signals may prove that the signals originate from the changes in blood oxygen saturation level (i.e., hemoglobin oxygenation state) rather than the changes in blood volume.
Microspectrophotometric measurement
The results of microspectrophotometric measurements were consistent with the observations of intrinsic signals by optical imaging. In addition, the time course of absorbance changes at the wavelength of 559 nm, in spite of sensitivity to deoxyhemoglobin, was similar to the changes at 569, 577, and 586 nm. Because the ratio of ɛoxyHb559 to ɛdeoxyHb559 is much larger than that of ɛoxyHb605 to ɛdeoxyHb605 (Fig. 4C), the absorbance at 559 nm is influenced not only by the deoxyhemoglobin concentration but also by the oxyhemoglobin concentration. However, the peak magnitude was smaller, and both the rise time and time to peak were shorter than those at 569, 577, and 586 nm (Fig. 5A), which may reflect the changes in the deoxyhemoglobin concentration. The changes in absorbance at 600, 610, and 620 nm are greatly affected by the changes in the deoxyhemoglobin concentration as mentioned above for 605 nm (Fig. 4C). The changes in absorbance at these wavelengths showed biphasic patterns, the peak magnitude was maximal, and the rise time was shortest at 600 nm (Fig. 5B). The changes in absorbance at 830 and 850 nm, somewhat sensitive to oxyhemoglobin, were similar to those at 805 nm.
Consequently, monophasic increases in absorbance at the wavelengths of 500 to 588 and 780 to 850 nm, and biphasic changes in absorbance at the wavelengths of 592 to 770 nm were observed. The wavelength dependency and the time course of these changes in absorbance in the present study are similar to those of some previous reports (Frostig et al., 1990; Grinvald et al., 1991) but not to some other reports (Narayan et al., 1994, 1995; Toga et al., 1995). Moreover, the initial increases in absorbance at 559, 600, 605, 610, 620, and 760 nm preceded the increases at 569, 577, 586, 805, 830, and 850 nm. These findings suggested that the intrinsic signals of the initial phase were greatly associated with an increase in the deoxyhemoglobin concentration.
Multicomponent analysis and blood flow measurement
We applied multicomponent curve-fitting analysis to determine what generated these activity-related changes in absorbance spectra. The results indicated that the deoxyhemoglobin component increased significantly 1.0 to 2.0 seconds after the stimulus onset, whereas the oxyhemoglobin component started to increase at 1.5 seconds, and then the deoxyhemoglobin component decreased after 2.5 seconds; consequently, the capillary bed was initially deoxygenated to a slight extent and then changed into a hyperoxygenation state, which corresponded with previous studies with imaging spectroscopy in the cat visual cortex (Malonek and Grinvald, 1996; Malonek et al., 1997). Furthermore, these changes in the hemoglobin concentration and oxygenation state may be corroborated by the findings of LDF that the time course of the rCBF response was similar to that of the changes in the oxyhemoglobin or total hemoglobin component, and also similar to that of the changes of diameter in feeding pial arteries (Ngai et al., 1995; Sato et al., 1997). The initial deoxygenation of hemoglobin may possibly be attributable to an increase in oxygen gradients from the capillaries to the active tissue caused by an increase in tissue oxygen consumption without a parallel increase in blood flow (Malonek and Grinvald, 1996; Malonek et al., 1997). Another explanation is that the deoxygenation is related to a decrease in the oxygen affinity of hemoglobin caused by a pH drop (i.e., the Bohr effect) based on increased production of lactate or carbon dioxide without an increase in blood flow (Ueki et al., 1988; Prichard et al., 1991; Sappey-Marinier et al., 1992). Both the increase in oxygen gradients and the pH drop in the capillary bed are still controversial and require further investigation (Magistretti and Pellerin, 1996).
There are some difficult problems in this multicomponent spectral analysis. One of the most serious problems is the flattening of the absorbance spectra of living tissue in comparison with in vitro spectra measured in transparent and clear solutions (Chance et al., 1988, Nioka et al., 1990a,b). This is attributed to the light path length distribution dependent on wavelength by photon scattering. The other problems are the effects of redox states of cytochromes on the activity-related absorbance spectra, and where the optimal analysis range of wavelengths for curve fitting is, so as to know the concentration of each component exactly. Therefore we tested three other models: (1) correcting the deformed spectrum using an algorithm (Hirao, 1994; Kitai et al., 1993; Nemoto et al., 1997) before curve-fitting analysis, (2) including cytochrome oxidase as an analysis component, and (3) using visible wavelengths of 500 to 650 nm as the analysis range. However, no significant alterations in the time courses of the hemoglobin concentration and oxygenation resulted from these models (data not shown).
As for activity-related changes in the wavelength-independent component, we have noted the earliest increase of all components. This increase might be related to changes in tissue scattering because of its early occurrence. We also observed that the wavelength-independent component decreased and the water component increased in the late phase, which might have been generated by an increase in blood volume. However, we have only scanty information on the wavelength-independent and water components at present. Thus, there is a need for further investigation of these components, including cytochromes.
Based on the findings of these multicomponent analyses and blood flow measurements, we hypothesized the origin of the intrinsic signals at 605 nm to be as follows (Fig. 9): (1) The absorbance decrease in the late phase is mainly caused by the decrease in the deoxyhemoglobin component, not the total hemoglobin component. In other words, the late absorbance decrease represents overcompensatory hyperoxygenation in the capillary bed but not cerebral blood volume reduction in our experiments. There is an obvious discrepancy between these results and a previous study (Narayan et al., 1995), in which the undershoot signals were not always observed and were interpreted as a reversal of the vascular processes causing the original phase activation signals, such as poststimulus compensatory cerebral blood volume reductions (possibly from vasoconstriction). This might be explained by the differences in stimulation or animal preparation. In our parameters of electrical stimulation the dilator response of the resistance arterioles was so strong that the local cerebral blood flow increased excessively and the blood oxygenation in the capillary bed developed significantly. Conversely, when the activity-related response of arterioles is small owing to the procedure of neuronal activation or preparation, the absorbance decrease caused by the hyperoxygenation might not be observed, not only at 605 nm but also at 592 to 770 nm. As a result, the absorbance signals at 500 to 850 nm may wholly exhibit a monophasic increase. We feel that the rCBF response is more sensitive to the procedures of preparation, anesthesia, and functional activation than the electrophysiologic response (Ueki et al., 1988; Lindauer et al., 1993; Schmitz et al., 1996). (2) The initial absorbance increase until 2.0 seconds after the stimulus onset is most likely generated by the increases in the deoxyhemoglobin component and the wavelength-independent component. The absorbance increase at 1.5 to 2.5 seconds, however, may be affected by the increase in the oxyhemoglobin component dependent on the rCBF response.
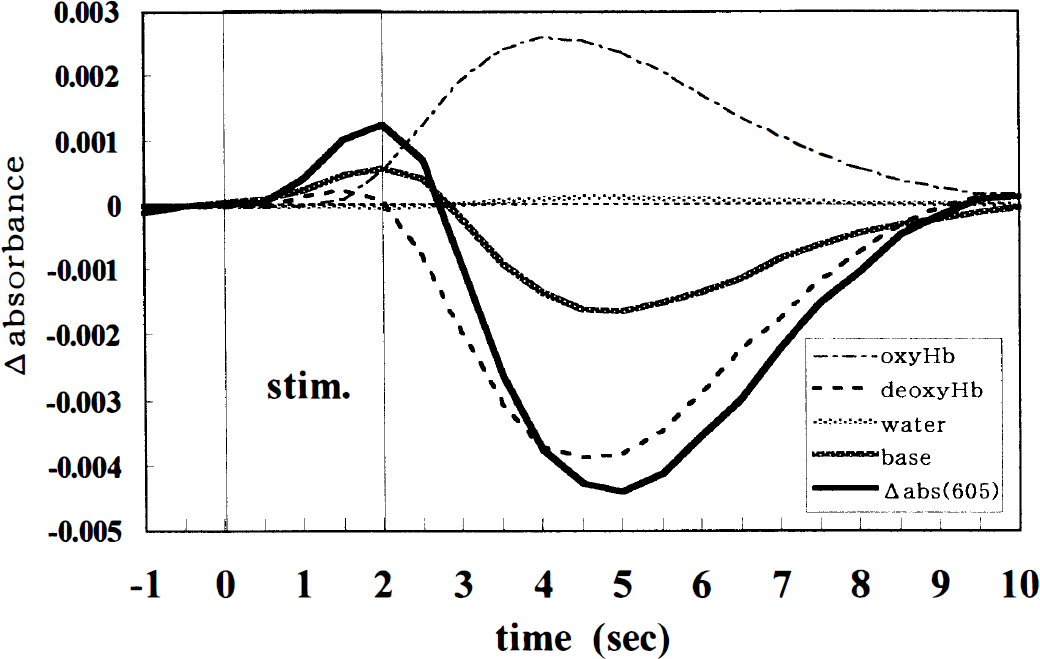
The time courses of the contribution of the different components to the absorbance changes at 605 nm. The contribution value (CV) of each component was calculated as follows: oxyHb-CV = ɛoxyHb605 × L × Δ[oxyHb], deoxyHb-CV = ɛdeoxyHb605 × L × Δ[deoxyHb], water-CV = ɛwater605 × L × Δ[water] and base-CV = Δ K, ɛ605 represents the absorption coefficient of each component at 605 nm, respectively.
In summary, we have shown the spatiotemporal characteristics of the activity-related intrinsic signals at various wavelengths sensitive to the hemoglobin concentration and oxygenation state and have evaluated the dynamic changes in the hemoglobin concentration and oxygenation state with microspectrophotometry, comparing them with rCBF responses monitored by LDF. The results confirmed that the concentrations of total hemoglobin and oxyhemoglobin, together with rCBF, increase in the activated somatosensory cortex during and after appropriate electrical stimulation of the peripheral nerve, and that the deoxyhemoglobin concentration increases slightly but distinctly just before rCBF increases, and then decreases. We have also revealed that the dynamic changes in various components including these changes in the concentrations of the hemoglobin derivatives come together and form the activity-related intrinsic signals proper to each wavelength. Finally, this microscopic system has proven simple and useful for studying the origin of the intrinsic signals and dynamic coupling between the neuronal activity, metabolism, and microcirculation.
Footnotes
Acknowledgements
The authors thank Konomu Hirao for advice on multicomponent spectral analysis, and Dr. Shingo Kawamura from Department of Surgical Neurology, Research Institute for Brain and Blood Vessels-AKITA, for advice on animal preparation and the experimental setup.