
Abstract
The potential of positron emission tomography for the quantitative estimation of receptor concentration in extrastriatal regions has been limited in the past because of the low density of the D2 receptor sites in these regions and the insufficient affinity of the most widely used radioligands for dopamine receptors. The new method described in this paper permits the estimate of the D2 receptor concentration in the extrastriatal regions using a two-injection protocol and FLB 457, a ligand with a high affinity (20 pmol/L in vitro) with D2 dopamine receptors. This approach is not valid for the striatal regions because some hypotheses cannot be verified (because of the high receptor concentration in these regions). The experimental protocol includes two injections with ligand doses designed to significantly occupy the extrastriatal receptor sites (≈ 90%), while leaving less than 60% of the receptor sites occupied by the ligand in the striatal regions. The results obtained using this double-saturation method are in line with the concentration estimates previously obtained using the multiinjection approach. The receptor concentration is 2.9 ± 0.5 pmol/mL in the thalamus, 1.0 ± 0.2 pmol/mL in the temporal cortex, and 0.35 ± 0.13 pmol/mL in the occipital cortex. This study provides new arguments supporting the presence of a small receptor-site concentration in the cerebellum, estimated at 0.35 ± 0.16 pmol/mL The simplicity of the calculation used to estimate the receptor concentration lends itself easily to parametric imaging. The receptor concentration is estimated pixel by pixel, without filtering. This method permits estimation of the extrastriatal D2 receptor concentration using an experimental protocol that can easily be used in patient studies (i.e., single experiment, no blood sampling, short experiment duration).
The quantitation of the striatal dopamine D2 receptors has been considerably developed in vivo using positron emission tomography (PET) because of the availability of several selective antagonist neuroleptics, such as [11C]raclopride (Farde et al., 1986, 1989). However, the study of the extrastriatal dopamine D2 receptor, which is involved in the medication of antipsychotic drug effects (Janowski at al., 1992; Deutch and Duman, 1996), has been limited because of the low density of these receptor sites and the insufficient affinity of the most widely used extrastriatal dopamine-receptor radioligands.
The compound FLB 457 is a ligand with a high affinity (20 pM in vitro) for D2 dopamine receptors (Farde et al., 1997). This ligand has been labeled both with carbon-11 (a short half-life isotope, 20.4 minutes) by Halldin et al. (1995), and with bromine-76 (a long half-life isotope, 16.2 hours) by Loc'h et al. (1996). Because carbon and bromine atoms are parts of the FLB molecule, [11C]FLB 457 and [76Br]FLB 457 have the same chemical formulae and, therefore, have the same binding characteristics. This double synthesis makes it possible to perform long experiments on animals using radiobrominated ligand, and to simplify protocols in patients with radiocarbonated ligand. This molecule has been used by Farde et al. (1997) to study the extrastriatal D2 receptors in healthy subjects and antipsychotic drug-treated patients. Olsson et al. (1999) demonstrate the possibility of applying the usual quantification methods (i.e., distribution volume, linear graphical analysis, reference-region method) to the study of [11C]FLB binding to extrastriatal dopamine receptors in the human brain.
Recently, the interactions between FLB 457 and D2 receptors have been studied in striatal and extrastriatal regions of baboons using the multiinjection approach (Delforge et al., 1999). All the parameters of the four-compartment ligand-receptor model have been estimated. In particular, the D2 receptor concentrations have been estimated in vivo for the first time in the cerebellum (0.39 ± 0.17 pmol/mL) and in the cortex (0.32–1.9 pmol/mL). If all model parameters are known, one can simulate the ligand kinetics and, using the particular characteristics of the ligand kinetics, imagine and test simplified approaches applicable to human studies. The main difficulty in finding such simplified methods for FLB 457 is that the two most common assumptions used to achieve a simplified method, the equilibrium state and the reference-region approaches, are not valid during the first hours after tracer injection because of the high affinity of this ligand (Delforge et al., 1999). Therefore, all the usual simplified methods are invalid and an original method is needed.
We propose the double-saturation method that enables estimation of the receptor concentration in the extrastriatal D2 receptors using a protocol that can easily be applied to patient studies (single experiment, no blood sampling, and short experiment duration). The protocol consists of two injections with ligand doses designed to significantly occupy the extrastriatal receptor sites (≈ 90%). Obviously, this approach is valid only if the necessary amount of ligand needed to occupy this large percentage of extrastriatal receptor sites does not induce a pharmacologic effect. This condition is verified in this study because of the high affinity of FLB 457 and of the small receptor-site concentration of the extrastriatal D2 receptors (with the doses used, less than 60% of receptor sites are occupied by the ligand in the striatal regions).
The results obtained with this approach are compared with the receptor-site concentrations previously estimated using the multiinjection method. The simplicity and robustness of the proposed method permits an easy pixel-by-pixel estimation of the receptor concentration, and, thus, the parametric imaging of B′max.
MATERIALS AND METHODS
Radiopharmaceutical preparation
The compound FLB 457 ((S)-(−)-N-((1-ethyl-2-pyrrolidinyl)methyl)-5-bromo-2,3-dimethoxy-benzamide) and its labeling precursors (bromine-76, (S)-(−)-N-((1-ethyl-2-pyrrolidinyl)methyl)-5-trimethyltin-2,3-dimethoxybenzamide; carbon-11, (S)-(−)-N-((1-ethyl-2-pyrrolidinyl)methyl)-5-bromo-2-hydroxy-3-methoxybenzamide) were prepared as previously described (Loc'h et al., 1996; Langer et al., 1999). Bromine-76 (half-life, 16.2 hours) was prepared in our facilities by irradiation of an arsenic target with a 30-MeV 3He-ion beam provided by the cyclotron (CGR-MeV 520, Buc, France). [76Br]FLB 457 with a specific radioactivity ranging from 20 to 40 GBq/μmol (at the time of PET injections) was prepared from the corresponding trimethyltin precursor as previously reported (Loc'h et al., 1996). Carbon-11 (as carbon dioxide; half-life, 20.4 minutes) was produced by irradiation of a nitrogen target with a 20-MeV proton beam. [11C]FLB 457 with a specific radioactivity ranging from 15 to 30 GBq/μmol (at the time of the first injection of the PET protocol) was prepared from the corresponding nor precursor (desmethyl derivative) using [11C] methyltriflate (Lundkvist et al., 1998; Langer et al., 1999). Radiochemical and chemical purities of radiolabeled forms of FLB 457 were determined by high-pressure liquid chromatography and were found to be greater than 98%.
For injection in animals, the radioligands were dissolved in saline and filtered through a 0.22-μm sterile membrane (Millipore, FG, Malsheim, France). The total amount (in nanomoles) of injected radiolabeled FLB 457 was adjusted to the desired value used in the PET protocol by adding a known quantity of unlabeled FLB 457.
Ligand-receptor model
The compartmental model used in this study, as shown in Fig. 1, is based on the usual nonequilibrium nonlinear model (Syrota et al., 1984; Mintun et al., 1984; Huang et al., 1986; Delforge et al., 1993). This model includes four compartments (nonmetabolized ligand in plasma, free ligand, specifically and unspecifically bound ligands) and seven parameters: k1 and k2 (the rate constants between the plasma and the free-ligand compartment), kon /VR and koff (the association and dissociation rate constants), k5 and k6 (the rate constants between the plasma and the nonspecifically binding compartments), and B′max (the D2 receptor-site concentration), which appears as a parameter in the binding reaction. The volume of reaction, VR, has been introduced to account for the heterogeneity of the free-ligand concentration (e.g., that resulting from the obvious heterogeneity of the tissue) (Delforge et al., 1996).
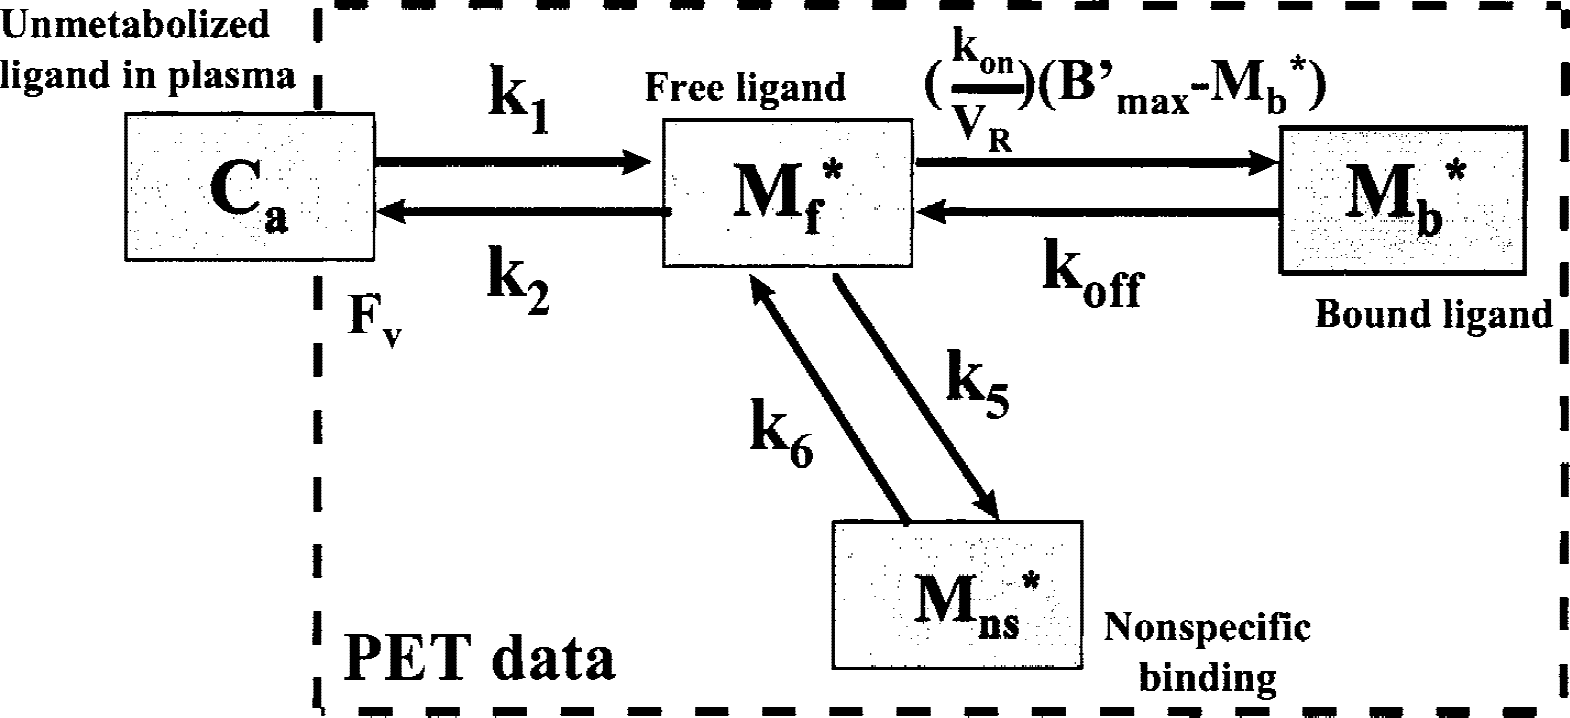
Four-compartment ligand-receptor model used for the analysis of FLB 457 time–concentration curves obtained with positron emission tomography (PET). All transfer probabilities of ligand between compartments are linear except for the binding probability, which depends on the local association rate constant (kon), the local free-ligand concentration (M*f (t)/VR), and on the local concentration of unoccupied receptor sites (B′max −M*b (t)). The PET experimental data correspond to the sum of the labeled ligand in the three tissular compartments and of a fraction (FV) of the blood concentration.
Double saturation-injection method
The double saturation-injection protocol consists of two injections of labeled ligand. The doses used during these two injections are obviously different, but both are selected to ensure that the extrastriatal receptor sites are quasi-saturated (≈ 90%). Because of the small receptor concentrations in the extrastriatal regions and the high affinity of the ligand, this receptor saturation is obtained by an injection of merely 15 to 30 nmol FLB 457.
The mathematical model includes two parts, a saturable part (the specific binding) and a linear part (the free ligand and the nonspecific binding). The idea consists in considering that the concentrations corresponding to the saturable part are approximately equal to B′max, and thus are equivalent in the two experiments. Consequently, the differences between the two PET curves relate only to the linear part of the model, where concentrations are assumed to be proportional to the injected doses.
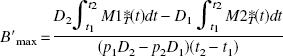
For example, let us consider the integral of the PET concentrations (denoted by M1*T and M2*T for the two experiments, respectively) during a period [t1, t2], assuming that the concentration in the bound-ligand compartment is equal to B′max in both experiments and that those of the free ligand and of the nonspecific binding compartments are proportional to the injected doses (with a coefficient α):
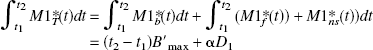
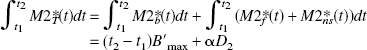
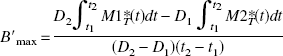
where D1 and D2 are the two injected FLB 457 doses and {Mib, Mif, Mins}i=1,2 are the concentrations in the model compartments (Fig. 1). By eliminating α, one deduces that the receptor concentration is given by:
However, because it is known that the occupancy of the receptor sites is not complete in practice, we can substitute B′max in the relations 1 and 2 by p1 B′max and p2 B′max, respectively, where p1 and p2 are the estimated fractions of occupied receptor sites after the two injections. Thus, it is possible to be more realistic by using the following equation:
For example, if we estimate that the percentages of receptor sites occupied by the ligand with the used doses are approximately 87% and 95%, respectively, the respective values of p1 and p2 will be 0.87 and 0.95. These values can be estimated by simulation as a function of the injected doses (see Results).
This relation is based on two different experiments. However, in patient studies, it is preferable to perform the two injections during a single experiment, in which case the curve M2T *(t) resulting from the second injection is deduced from the PET curve by eliminating the radioactivity resulting from the first injection (using an extrapolation of the first part of the curve denoted by M1T *ext(t)). However, because a large portion of the receptor sites is already occupied by the first-injection ligand, the fraction p2 of the receptor sites occupied by the ligand injected during the second injection (at time T) is small (from 5–15%). In this instance, we propose to estimate p2 by using the following equation:
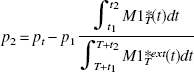
where pt is the total fraction of the occupied receptor sites after the second injection. The ratio of the two integrals allows to take into account the small decrease of the receptor occupancy between the time of the maximum occupancy and the beginning of the second injection. This relation is easily obtained by assuming that the decrease in PET concentration reflects the decrease in the bound-ligand concentration.
Experimental protocol
Ten PET experiments were conducted in male papio anubis baboons weighing approximately 15 kg. Anesthesia was maintained with 1% isoflurane and a ventilator-controlled mixture of 66% nitrous oxide and 33% oxygen. The subject's head was fixed in a headholder and positioned in the scanner gantry for axial plane acquisition. A transmission scan was recorded to correct for γ-ray attenuation.
The protocol was based on the two injections with doses designed to saturate the receptor sites in the extrastriatal regions (15–40 nmol). The second injection was performed 40 minutes after the first, and the overall duration of the experiment was 80 minutes. Five experiments were performed with [76Br]FLB 457 and five were performed with [11C]FLB 457. The compound needed for the two injections of labeled FLB 457 was produced during a single synthesis.
With the bromine-76 label, the specific radioactivity ranged from 340 to 750 mCi/μmol and the doses of FLB 457 were obtained by adding unlabeled compound. The injected activities ranged from 11 to 44 MBq. With the carbon-11 label, the specific radioactivity ranged from 250 to 820 mCi/μmol and the doses of FLB 457 were obtained without unlabeled compound. The injected activities ranged from 158 to 251 MBq. The details of the administered doses are given in Table 1.
Detailed estimates of the D2 receptor concentration obtained using the double-saturation approach and FLB 457 labeled with bromine-76 or carbon-11
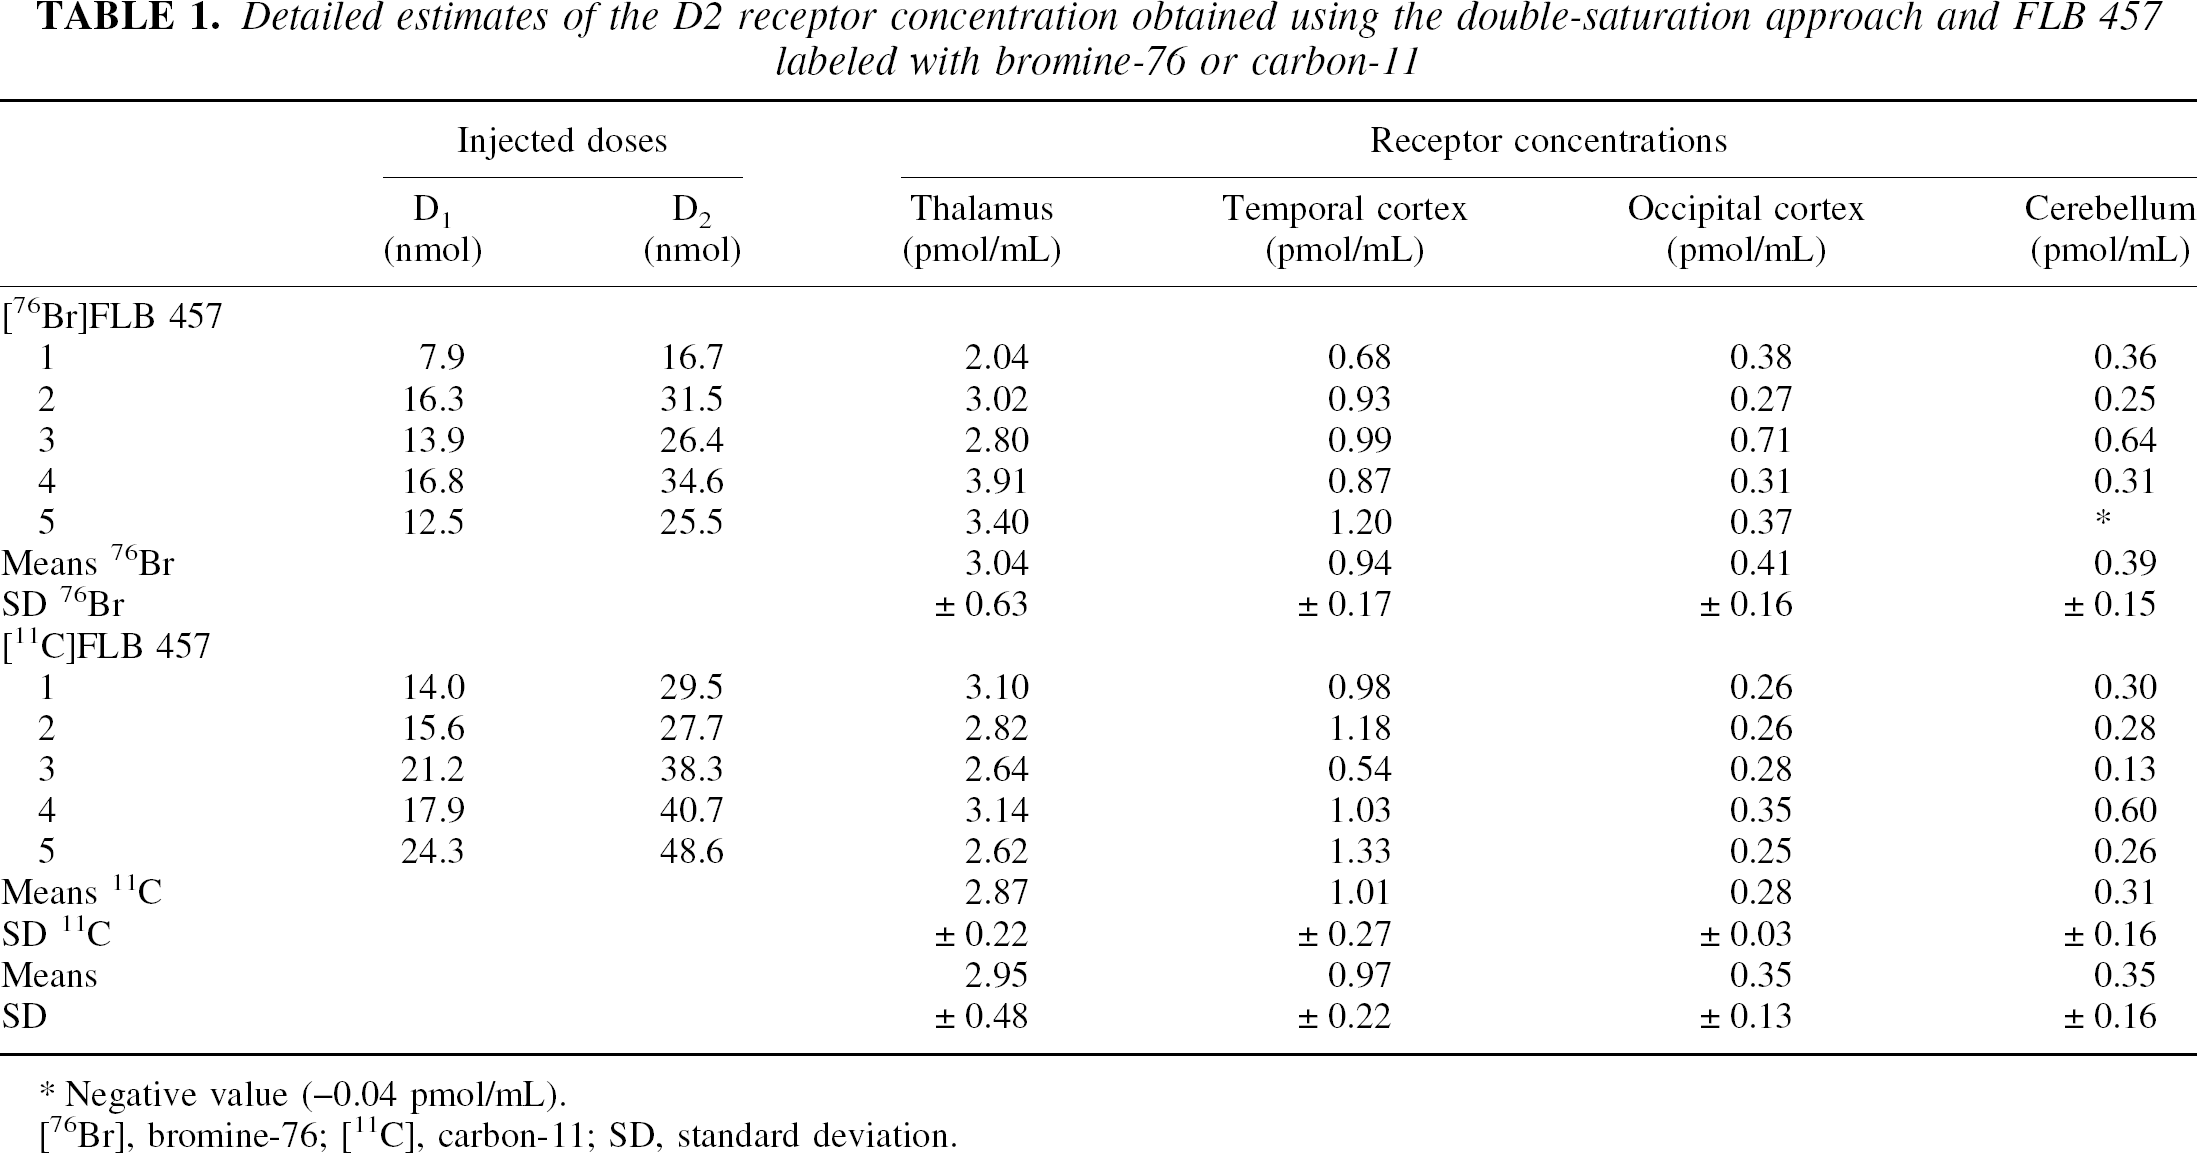
Negative value (−0.04 pmol/mL).
[76Br], bromine-76; [11C], carbon-11; SD, standard deviation.
All animal-use procedures were in strict accordance with the recommendations of the European Union (86/609-CEE) and the French National Committee (décret 87/848) for the care and use of laboratory animals.
Positron emission tomography measurements and data analysis
The PET studies were performed with the ECAT EXACT HR+ positron tomograph (Siemens-CTI, Knoxville, TN), which is capable of acquiring 63 continuous slices simultaneously (Brix et al., 1997). The resolution in the two-dimensional mode 1 cm from center is 4.5 mm in the transverse direction and 4.1 mm in the axial direction. For each animal, a magnetic resonance imaging examination was performed with a 1.5-Tesla unit (SIGNA, General Electric, Milwaukee, WI). To obtain a set of magnetic resonance images that were superposable on the PET images, contiguous axial T1-weighted slices were obtained. Sixteen sequential PET scans were acquired (image acquisition duration, 5 minutes).
For data analysis, regions of interest identified on magnetic resonance imaging slices were drawn on selected PET images to involve the thalamus, cerebellum, occipital, and temporal cortices. Concentrations of radioactivity in the different regions of interest were calculated for each sequential PET scan and plotted versus time. Radioactivity was measured in the selected cerebral structures after correction for bromide-76 or carbon-11 decay and expressed as pmol/mL after normalization using the specific radioactivity measured at injection time. To compare results with the those obtained from the multiinjection approach, a correction of partial volume was performed for the thalamus (see Delforge et al., 1999). No correction was made for other extrastriatal regions. The correction method, which is based on a phantom study, is described in Bendriem et al. (1991).
The receptor concentration was estimated using equation 4. To segregate the radioactivity resulting from the two injections, the curve obtained before the second injection (M1*T) was extrapolated using an exponential relation. The curve M2*T is deduced from the PET curve after the second injection by subtracting this exponential extrapolated curve (M1T *ext(t)). The times of the interval [t1, t2] used for integration of the curves M1*T and M2*T was 10 and 25 minutes. The calculations have been performed with p1 = 0.85 for the cerebellum and occipital cortex, p1 = 0.80 for the temporal cortex and p1 = 0.75 for the thalamus. The coefficient pt is assumed to be 0.95 regardless of region. The coefficient p2 is estimated using equation 5.
For the parametric images, the receptor concentration was estimated pixel by pixel without filtering. As with the region of interest approach, the receptor concentration was estimated using equation 4 and a B′max image was constructed. The images have been obtained using the coefficients p1 = 0.85 and pt = 0.95.
RESULTS
Simulations in the cerebellum and thalamus
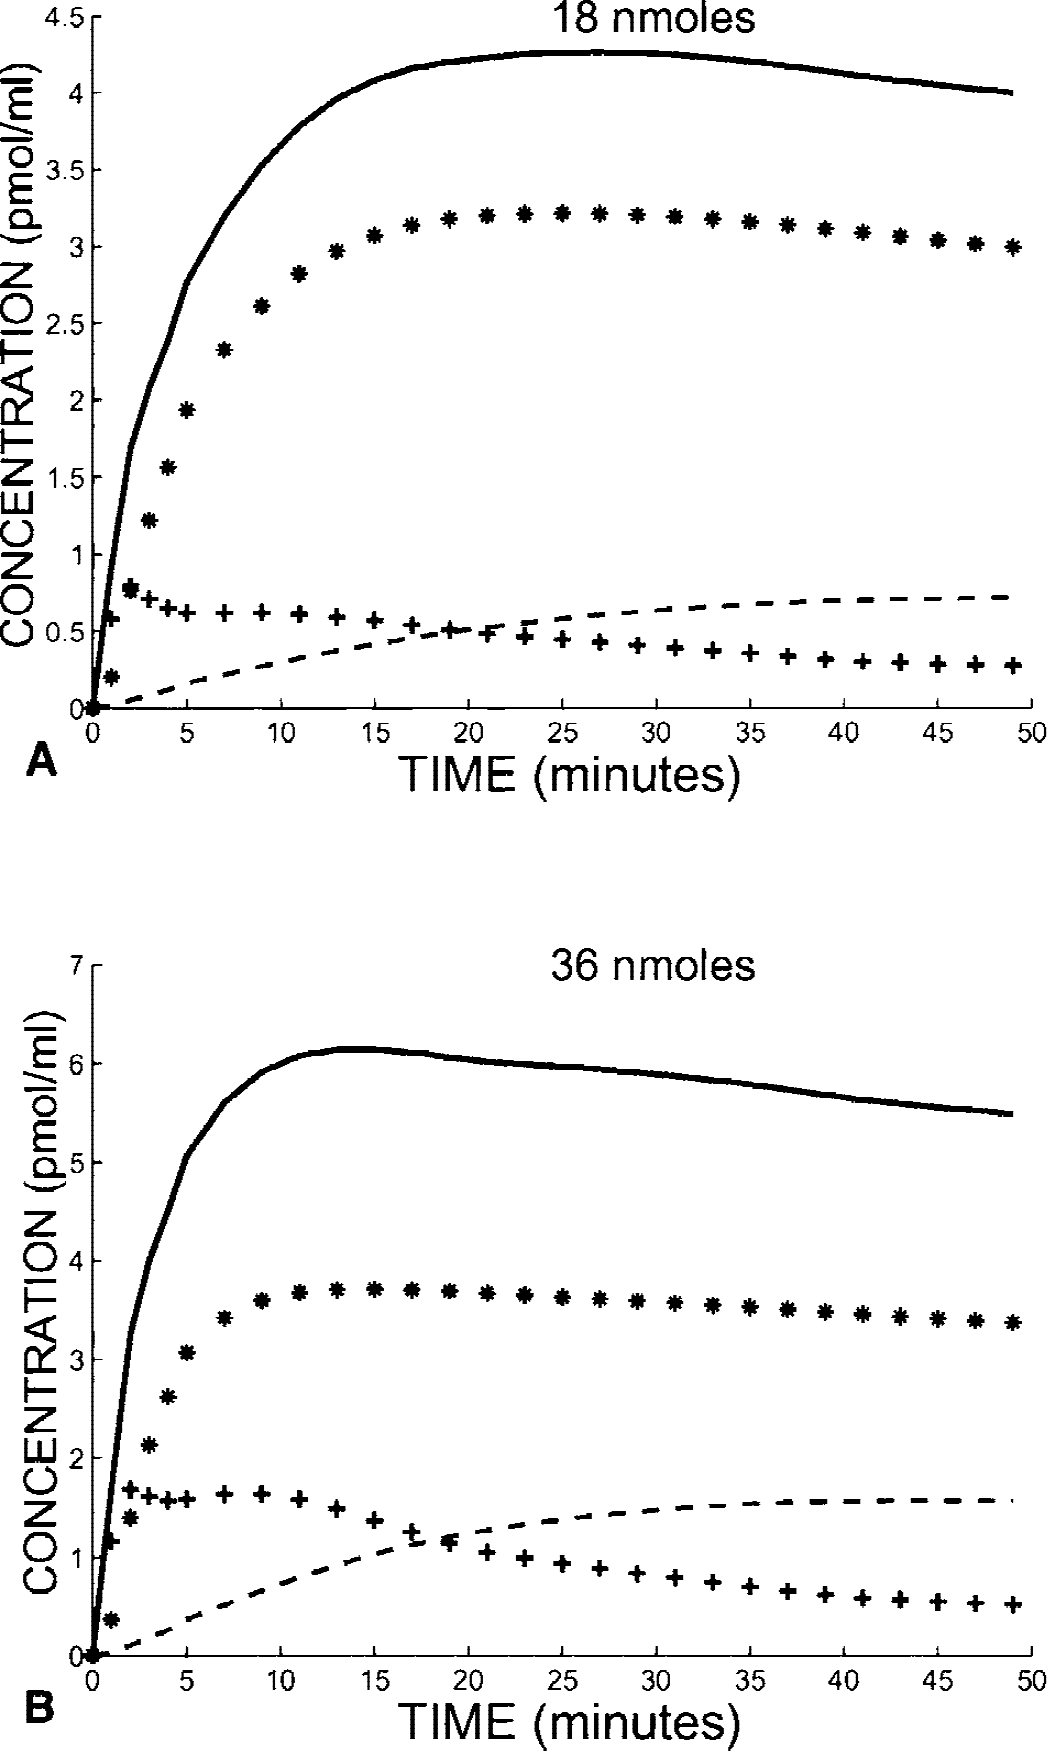
Fig. 2 shows the two simulated curves of the PET concentration in the cerebellum after an 18-nmol (Fig. 2A) and 36-nmol FLB 457 injection (Fig. 2B). This simulation was performed with the following model parameters previously estimated using the multiinjection approach (Delforge et al., 1999): B′max = 0.39 pmol/mL, k1 = 0.14 min−1, k2 = 0.63 min−1, kon /VR = 0.22 mL · pmol−1min−1, koff = 0.023 min−1, k5 = 0.018 min−1, and k6 = 0.15 min−1. Approximately 10 minutes after the ligand injection, the bound-ligand concentration reached its maximum, with 87% (Fig. 2A) and 95% (Fig. 2B) of receptor sites being occupied by a ligand, respectively. After this time, this percentage decreased slowly, 84% and 91%, respectively, 25 minutes after the ligand injection (which is the end of the interval used) and 76% and 86%, respectively, at the end of the simulation (60 minutes).
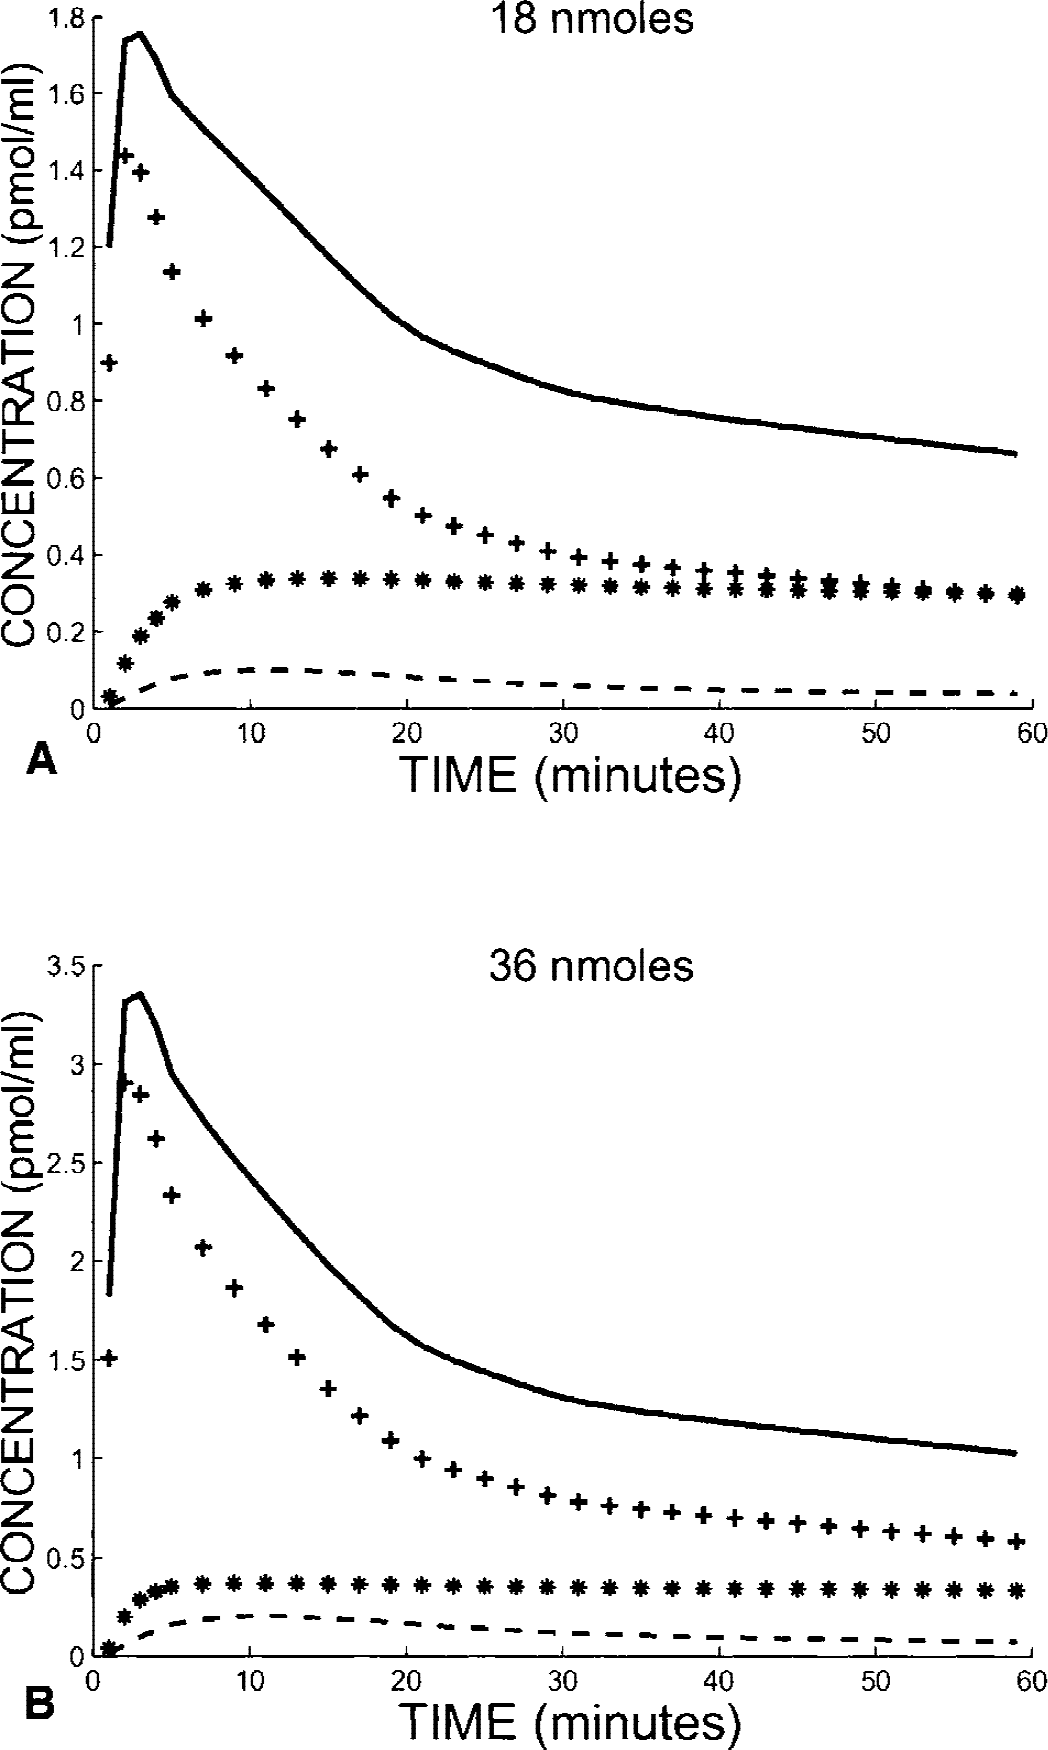
Simulations of FLB 457 kinetics in the cerebellum after injection of 18 (
The receptor concentration in the cerebellum was estimated from these simulations by using equation 3 (without incomplete occupancy correction) with the interval times 10 and 25 minutes. The value obtained (0.30 pmol/mL) underestimated the true value used for the simulation (0.39 pmol/mL). This difference resulted from the incomplete saturation of the receptor sites. Equation 4 includes the corrective coefficients p1 and p2 needed to partially correct this bias. By using p1 = 0.85 and p2 = 0.93 (deduced from the previous simulations), the receptor concentration is 0.386 pmol/mL, which is very close to the true value.
In practice, p1 and p2 are unknown and can only be estimated from the injected doses and the assumed value of the receptor concentration. However, the bias resulting from these uncertainties is acceptable. For example, if we use the proposed standard values for the cerebellum (p1 = 0.85 and p2 = 0.95), the B′max is estimated at 0.397 pmol/mL. If we assume that the both occupancies are underestimated by 5% (p1 = 0.80 and p2 = 0.88), one obtains a cerebellum-receptor concentration of 0.41 pmol/mL, which only represents a 2.5% overestimation. In Fig. 3, three examples of simulations that describe the effect of coefficients p1 and p2 on the receptor concentration estimate are represented. In two cases, the B′max estimate is given as a function of either p1 or p2, and the other coefficient is set to a constant (0.85 for p1 and 0.95 for p2). The bias is usually less than 10% for the p1 and p2 values coherent with the ratio 2 between the injected doses (36 vs. 18 nmol). However, this bias can lead from 15% to 20% in some unrealistic cases, such as when coefficients p1 and p2 are too close (19.7%, p1 = p2 = 0.95) or too different (14.9%, p1 =0.80 and p2 =0.95). We also tested the simultaneous variation of the two coefficients according to the relation (1 − p1) = 2(1 − p2). The maximum bias is obtained with p1 = p2 = 1 (i.e., without correction for the uncompleted occupancy of the receptor sites). In conclusion, it is preferable to introduce a correction, even with an approximate p1 and p2 value.
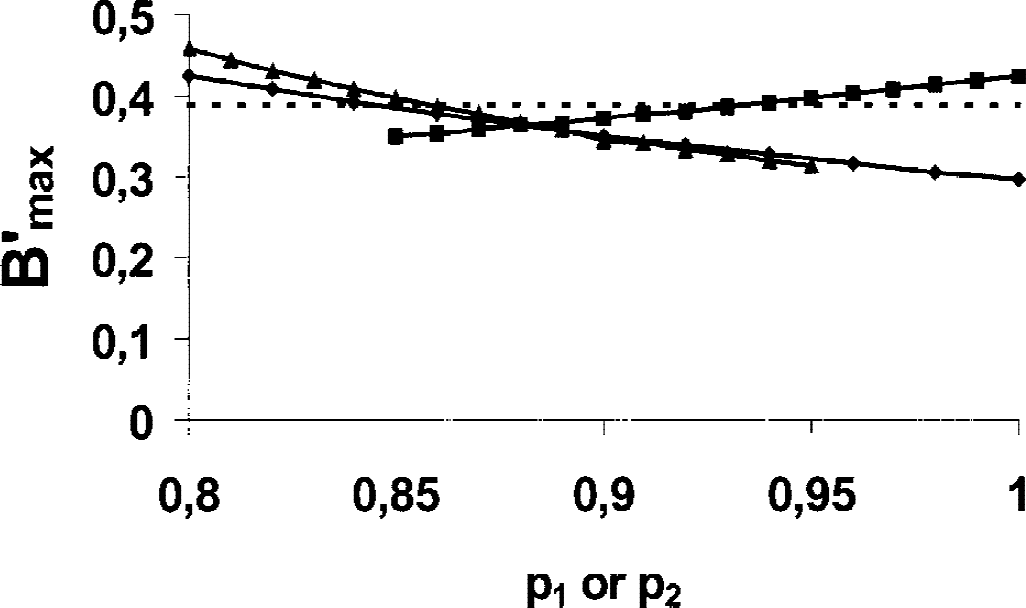
Study of the effect of p1 and p2 coefficients on the receptor-concentration estimate in cerebellum. These calculations are based on the simulated experimental data given in Fig. 2. Three simulations were performed. The triangles are estimates of B′max as a function of p1 (p2 = 0.85). The squares are estimates of B′max as a function of p2 (p1 = 0.95). In both cases, we assumed that p1 < p2. The lozenges are estimates of B′max as a function of p1, p1, and p2 varying simultaneously according to the relation (1 − p1) = 2(1 − p2). The dotted line shows the true value of the receptor concentration (0.39 pmol/mL).
The same simulation study was performed in the thalamus (Fig. 4) with the following parameters: B′max = 4.0 pmol/mL, k1 = 0.11 min−1, k2 = 0.45 min−1, kon /VR = 0.21 mL · pmol−1min−1, koff = 0.023 min−1, k5 = 0.10 min−1and k6 = 0.017 min−1(Delforge et al. 1999). Because of a larger receptor concentration (10 times larger than in cerebellum), the saturation of the receptor sites was far from complete. After the injection of 18 nmol FLB 457 (Fig. 4A), the percentage of occupied receptor sites was 68% at 10 minutes, reached a maximum (81%) at 26 minutes, and then decreased to 70% at the end of the simulation (60 minutes). With the largest dose (Fig. 4B), this percentage ranged from 90% to 93% between 10 and 25 minutes (the maximum, 0.93%, was reached 15 minutes after the injection). The estimate of the receptor concentration using the double-saturation method with p1 = 0.74 and p2 = 0.92 was 3.67 pmol/mL, which corresponds to a small underestimation of the value used for the simulation (4.0 pmol/mL).
Simulations of the kinetics of FLB 457 in the thalamus after injection of 18 (
The simulated curves help determine the interval [t1, t2] used in equations 3 and 4. The method assumes that during this interval, the occupancy of the receptor sites is approximately constant and close to the maximum value. To reduce the uncertainties in PET concentration values, the interval has to be as large as possible. However, the decrease with time of the bound-ligand concentration can lead to an insufficient percentage of occupied receptor sites, so t2 cannot be too large. Therefore, the optimal interval depends on the model parameters (and thus on the regions) and ligand doses. Regarding the cerebellum, Fig. 2 shows that the bound-ligand concentration is close to its maximum after 7 minutes, and decreases slowly thereafter. Therefore, t1 has to be longer than 7 minutes, whereas t2 can be large. This moiety is verified by calculation: the B′max estimates are 0.379 and 0.368 pmol/mL by using a t2 value of 40 and 60 minutes, respectively, the difference between the B′max estimates obtained using the extreme t2 values (25 and 60 minutes) is less than 5%. In the thalamus, the maximum occupancy is reached approximately 10 minutes after injection for the higher dose (Fig. 4B) and after 17 minutes for the lower (Fig. 4A). After peaking, the bound-ligand concentration decreases significantly, and the t2 value must be limited. The estimate of B′max is 4.36 pmol/mL when t2 is 60 minutes, which correspond to a bias of 16% compared with the estimate obtained when t2 is 25 minutes. In conclusion, the best theoretical solution would be to use intervals optimized for each region; however, a single interval for all regions is suggested and the present simulations support the validity of the proposed values (i.e. t1 = 10 minutes, t2 = 25 minutes).
Experimental curves and receptor-concentration estimates
Fig. 5 shows typical experimental curves obtained in the thalamus and cerebellum using the double-saturation protocol performed during a single experiment, with a second injection administered 40 minutes after the first one. The first example (Fig. 5A) is obtained using [76Br]FLB 457 (experiment 2, see doses in Table 1), whereas the second is obtained with [11C]FLB 457 (experiment 1, see doses in Table 1).
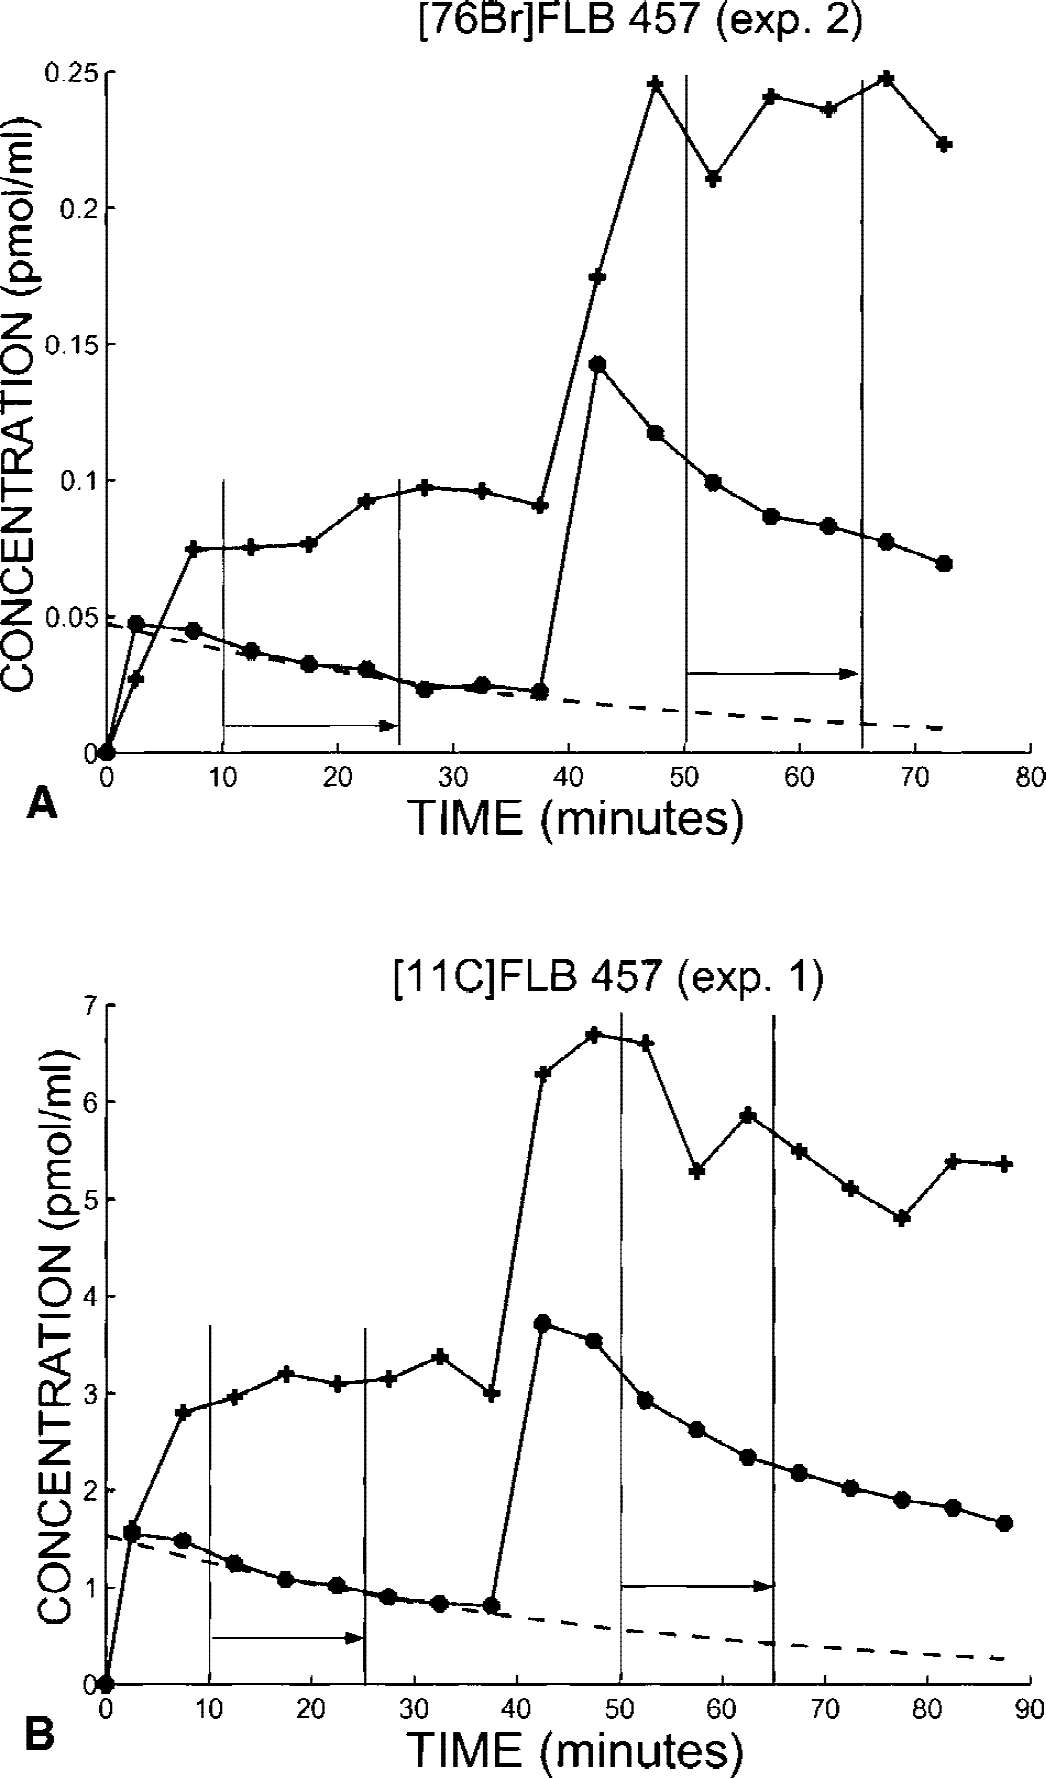
Examples of positron emission tomography (PET) data obtained using the double-saturation protocol. The first example (
To segregate the PET concentrations resulting from the two injections, there is a need to extrapolate the PET curve observed between 0 and 40 minutes beyond this period. The cerebellum curve was extrapolated using a monoexponential curve (see the dotted line in Fig. 5), whereas the PET concentration resulting from the first injection is assumed to be a constant in the thalamus; this constant was based on the last three concentrations before the second injection time. The measurements of the PET curve integrals were performed for the intervals 10 and 25 minutes and 50 and 65 minutes.
Table 1 gives the D2 receptor concentration estimated using the double-saturation method with [76Br]FLB 457 and [11C]FLB 457. The results obtained with the two labeling radioisotopes are close, which is not surprising considering that it is the same molecule with the same chemical formula and, therefore, with the same kinetics. Consequently, the kinetics of [11C]FLB 457 can be simulated using the model parameters as previously estimated with [76Br]FLB 457 and the multiinjection method (Delforge et al., 1999).
The receptor concentration in the cerebellum (0.35 ± 0.16 pmol/mL) is close to that in the occipital cortex (0.35 ± 0.13 pmol/mL), whereas it is more than twice as high in the temporal cortex (0.97 ± 0.22 pmol/mL) and seven times higher in the thalamus (2.95 ± 0.48 pmol/mL). The relative standard deviations are comparable with the usual values obtained in PET studies (i.e., 16% in the thalamus, but up to 47% in the cerebellum). A negative value was obtained in only one case (in the cerebellum using bromine labeling).
Parametric images
Parametric imaging can be performed easily because the calculations required to estimate receptor concentration are simple. For instance, Fig. 6 shows both the PET images (representing the ligand concentration) obtained during the period 10 and 25 minutes (top) and the parametric images of the receptor concentration estimates (bottom) at four brain levels. These images have been obtained with [11C]FLB 457 (experiment 1, see doses in Table 1) and the receptor concentration has been calculated pixel by pixel without filtering. The slices correspond to the level of the striatum, thalamus, temporal cortex, and cerebellum, respectively. Fig. 7 shows the slice at the cerebellum level with a different concentration color scale. These images are of good quality with symmetrical patterns.
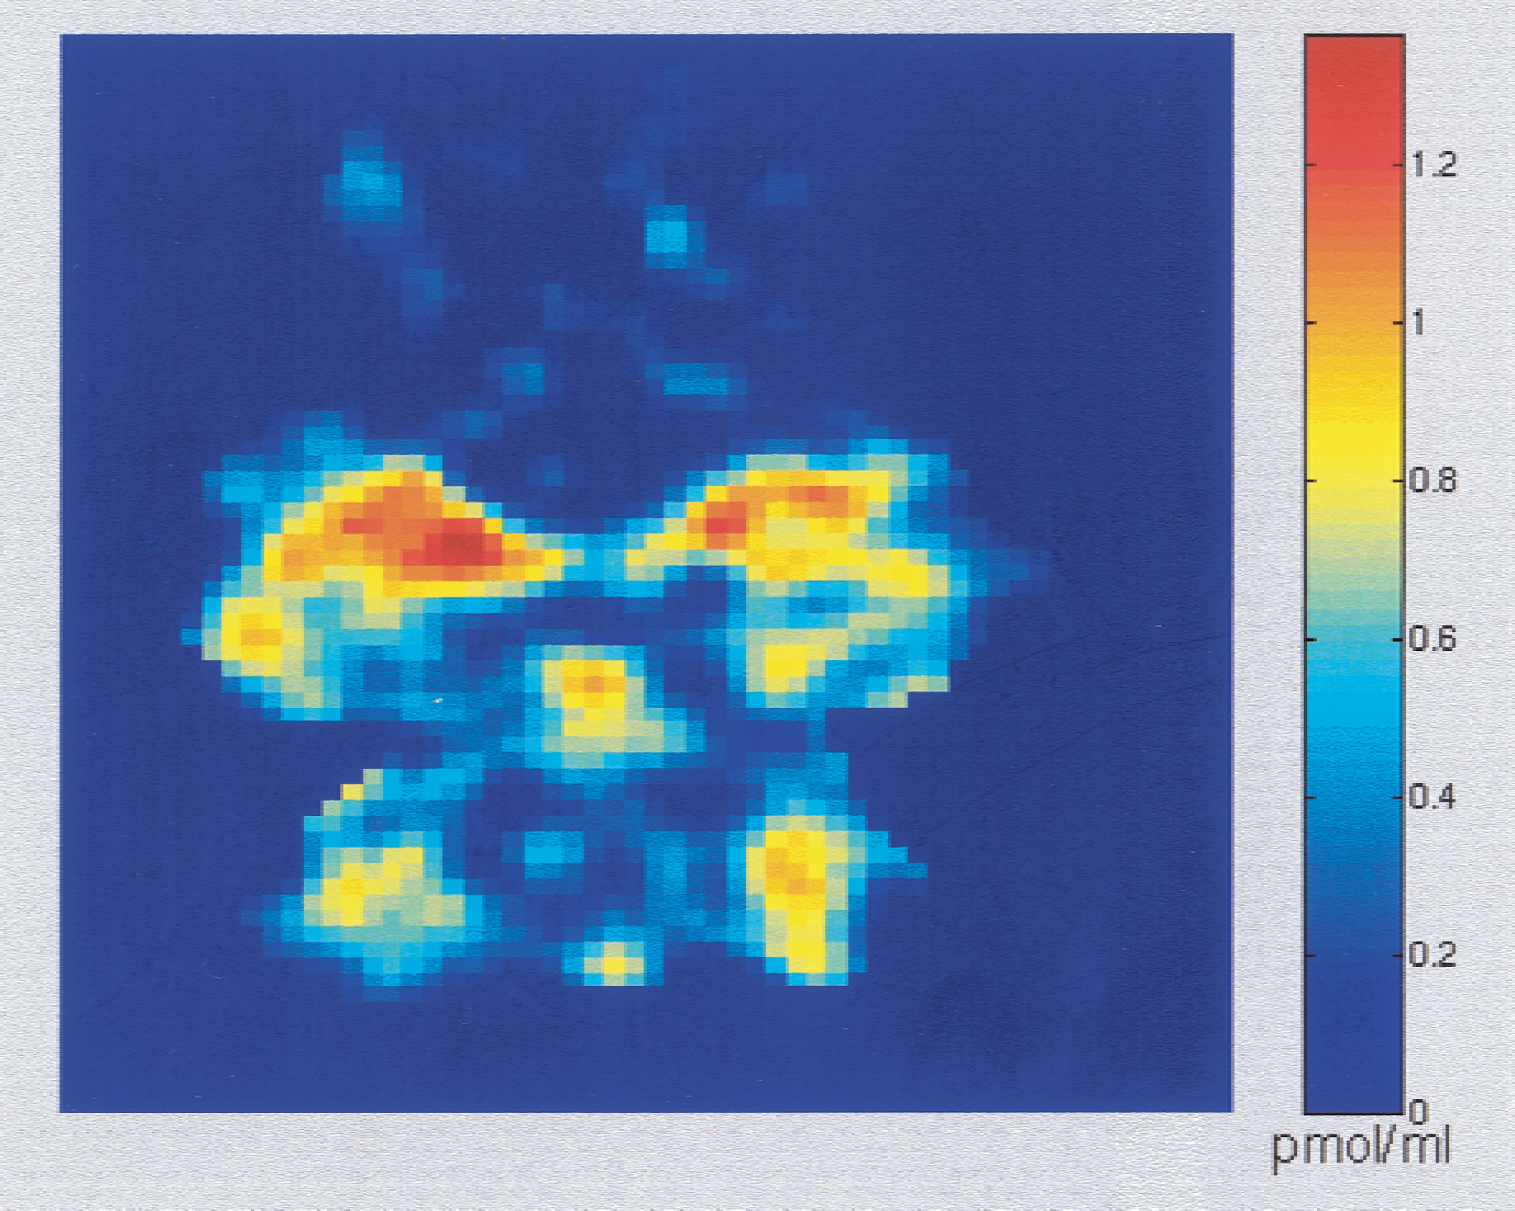
Receptor-concentration image at the cerebellum level. This image is the same as that depicted in Fig. 6, but with a different concentration color scale. The concentration appears to be heterogeneous in the cerebellum, with a maximum concentration of approximately 1 pmol/mL in the cerebellar hemisphere and a lower concentration in the vermis.
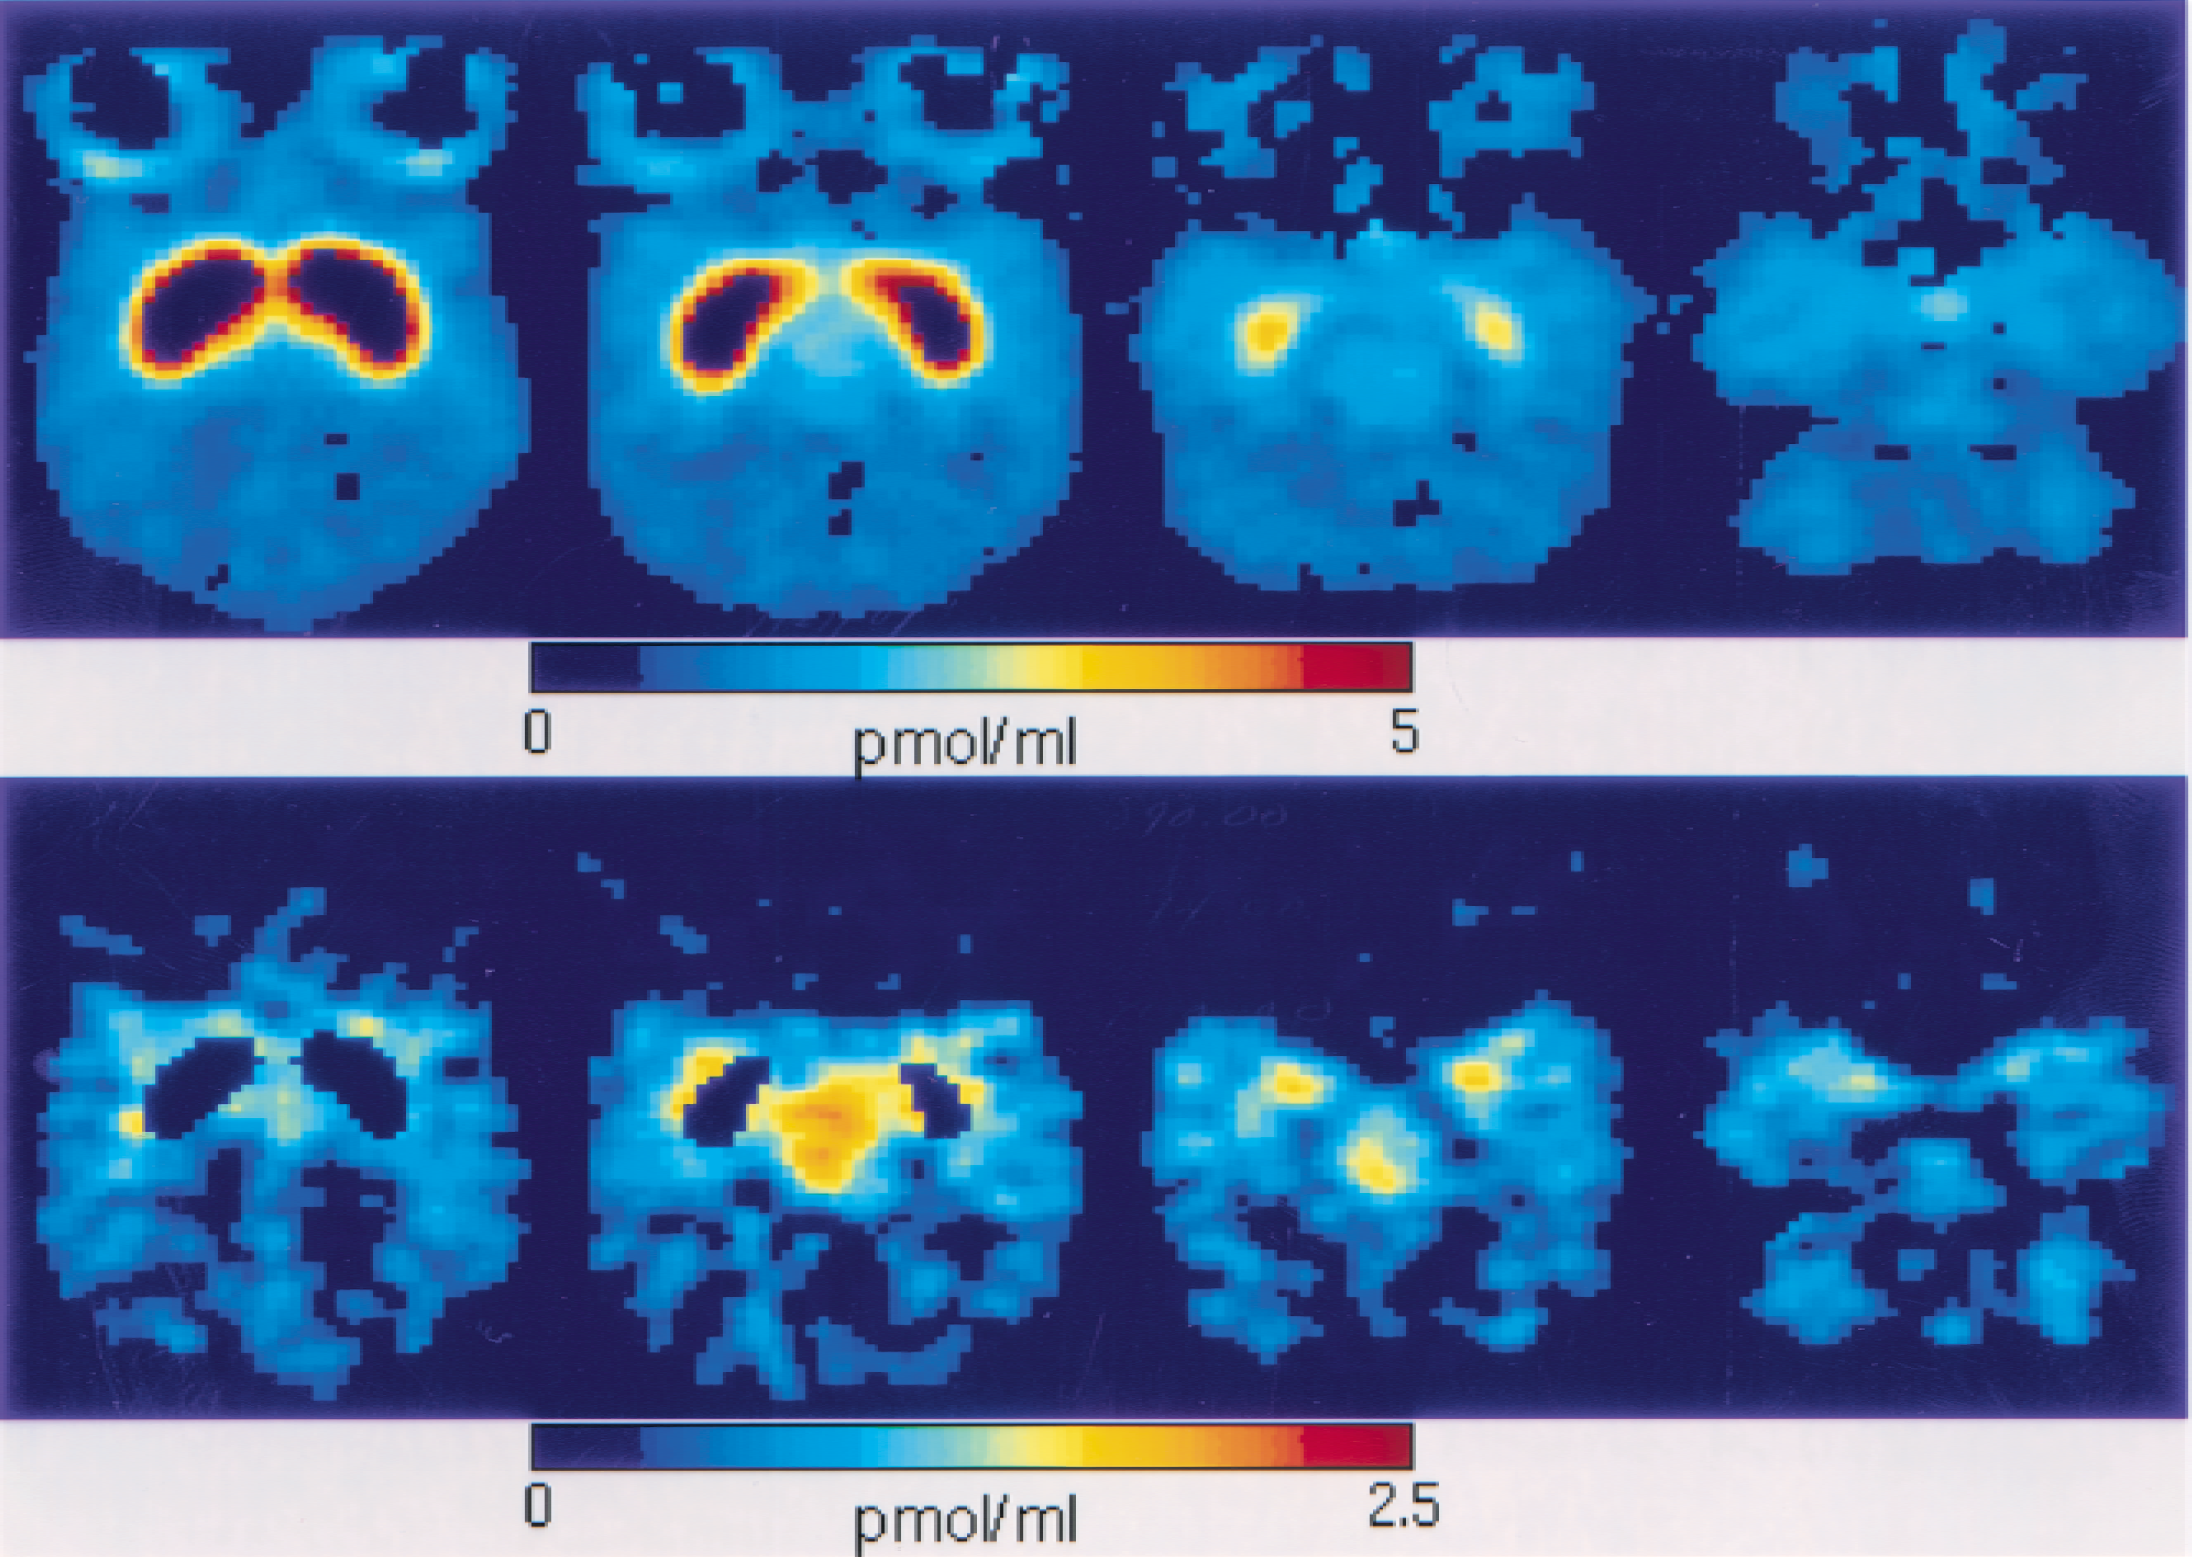
Comparison between the positron emission tomography (PET) images acquired during the period between 10 and 25 minutes (
DISCUSSION
The main advantage of FLB 457 is its high affinity, which permits observation of the D2 extrastriatal receptor sites. Halldin at al. (1995) showed in vitro that this molecule can also bind to D3 dopamine receptors. However, because selective D3 ligands are not available for pretreatment or displacement, it is difficult to estimate the possible D3 component in FLB 457 binding. The D3 dopamine receptors are restricted mainly to the ventral striatum and the Islands of Calleja, and we can assume that the FLB 457 binding in all other regions represents binding to the D2 dopamine receptor only (Olsson et al., 1999).
Binding-potential approach
The binding of this molecule in the thalamus and cortex (mainly temporal and frontal) has been demonstrated by Farde et al. (1997), and the receptor concentration has been recently quantified using the binding-potential (BP) method (Olsson et al., 1999) and the multiinjection approach (Delforge et al., 1999). The advantage of the BP method lies in its simplicity, which enables easy human studies and parametric imaging. However, this method only gives relative values whose relation with the receptor concentration is questionable. For example, the ratio of putamen BP to thalamus BP ranges from 2.6 to 6.7 (depending on the method used), whereas the in vitro receptor concentration ratio is 18 (estimated by Kessler et al., 1993 using epidepride). The result is similar to the ratio of putamen BP to frontal cortex BP (8–30 vs. 92).
The multiinjection approach is more complex and is difficult to use in human studies (mainly because of the need for an input function and the length of the experiment), but this method provides an absolute quantification of the receptor concentration. In contrast to the BP method, the ratios between the receptor concentrations estimated using the multiinjection approach have the same order of magnitude as the ratios estimated by in vitro methods (putamen and the thalamus, 11 vs. 18; putamen and the frontal cortex, 139 vs. 92). The binding potential, which is defined by the ratio B′max /Kd VR, is estimated by multiinjection approach at 117 in the putamen and at 31 in the thalamus. These values are significantly higher than those achieved by Olsson et al. (1999) using the usual BP method (putamen, 5.8–20.2; thalamus, 1.9–3.6), but the putamen:thalamus ratio (2.6– 6.7) is close to that found using the multiinjection method (3.8). In the cortex, the results are similar; the binding potential estimated from the multiinjection results was 6.1 in the temporal region and 2.7 in the frontal region, whereas Olsson reported values of 1.08 to 1.71 in the temporal region and 0.61 to 0.73 in the frontal region using the usual BP approach.
These differences can be explained by an incomplete validation of the hypotheses needed to use the BP approach. In particular, the model simulations show that the equilibrium state is not reached in the putamen and that the cerebellum cannot be used as a reference region (Delforge et al., 1999). Consequently, the binding potential approach does not appear to be valid for the study of the D2 receptor sites using FLB 457.
Double-saturation approach
It is often valuable to use the characteristics of the ligand kinetics to achieve quantification approaches for the purpose of estimating the receptor concentration without input function. One of the interests of the multiinjection approach is to identify all model parameters, to enable easier mathematical simulations, and thus to imagine and test simplified approaches. The method described in this paper has been simulated using the parameter models estimated previously (Delforge et al., 1999), which describe the interactions between D2 receptor sites and FLB 457.
This method is based on a double quasi-saturation of the extrastriatal receptor sites obtained after injection of 15 to 45 nmol FLB 457. Using these doses, the simulations showed that the occupancy of the receptor sites in the striatal regions is less than 60% (which implies that this method may be used in patients). These outcomes may be surprising because it is well known that the occupancy percentage does not depend on the receptor concentration if the free-ligand concentration and the affinity are equal in all regions. However, using the multiinjection method, we have previously shown that these two hypotheses are not valid with FLB 457. We found that the affinity estimates are close within the extrastriatal (Kd Vr = 0.16 ± 0.07 nmol/L) and striatal regions (Kd Vr = 0.39 ± 0.02 nmol/L), but with a significant difference (a ratio of 2.4) between the two groups (Delforge et al., 1999). Therefore, the first hypothesis (i.e., the same affinity regardless of the region) is not valid. This higher affinity value in the poor-receptor regions has already been observed with other ligands (see the flumazenil example in Delforge et al., 1995). The second hypothesis (i.e., an equal free-ligand concentration in all regions) is also invalid because it has been shown that the equilibrium state between the plasma and the free-ligand concentration is not reached in the striatal regions (Delforge et al., 1999), and as a consequence, the free-ligand concentration is smaller than in the extrastriatal regions.
Another argument in favor of the validity of this method is the consistency between the deduced receptor concentrations and the estimates obtained with the multiinjection approach.
The simulations showed the biases to be larger in the thalamus than in the other extrastriatal regions. The size of the injected doses may account for this finding because they have been optimized for the receptor concentrations at less that 1 pmol/mL, and thus are too small for the thalamus (where B′max ≈ 3 pmol/mL). Consequently, the occupancy of the receptor sites is not complete and the concentration of the free ligand is significantly smaller than that of the bound ligand (see Fig. 4)—two reasons that can lead to difficulties in estimating the linear part of the PET curves (see Methods).
These biases large enough in the striatal regions to invalidate this method. Indeed, the doses used in the present paper are not sufficient to obtain a complete occupancy of the striatal receptor sites (the occupancy is only approximately 60%); consequently, the biases resulting of approximate p1 and p2 are too large. Moreover, the free-ligand concentration is small compared with the bound-ligand concentration (see Delforge et al., 1999). Therefore, the differences between the two PET curves, which permit the estimate of α and the free-ligand concentration (see equations 1 and 2) are significantly biased by the significant variation of the bound-ligand curve.
Because this method is merely based on PET measures obtained in saturation conditions, one cannot deduce an estimate of the ligand affinity.
Estimates of the D2 receptor concentration
The orders of magnitude of the receptor concentration estimates obtained with this double-saturation approach (Table 1) are similar to those obtained with the multiinjection approach, though the two methods are based on different principles and different experimental protocols. The receptor concentration in the cerebellum (0.35 ± 0.16 pmol/mL) is close to the multiinjection estimate (0.39 ± 0.17 pmol/mL), whereas the small underestimation in the occipital (0.35 ± 0.13 pmol/mL vs. 0.43 ± 0.17 pmol/mL) is not significant. However, the underestimation is larger in the thalamus (26%: 2.9 ± 0.5 pmol/mL vs. 4.0 ± 1.3 pmol/mL) and in the temporal cortex (48%: 0.97 ± 0.22 pmol/mL vs. 1.90 ± 0.27 pmol/mL). This higher bias in the thalamus is consistent with the simulation studies and results from nonoptimized ligand doses. If this region is the main region of interest, using larger doses can reduce this bias.
The coefficients p1 and p2 are included in the receptor calculation to account for an incomplete occupancy of the receptor sites. Obviously, the exact values of these coefficients are unknown, and the values estimated for the model simulation were used as an approximate. However, the simulations show that the biases on the receptor concentration estimates are acceptable if p1 and p2 are not perfectly estimated, but are coherent with the injected doses. The proposed use of different standard coefficients for each brain region takes into account the differences in the order of magnitude of the receptor concentrations.
No correlation was observed between the injected doses and the receptor concentration. However, in the first experiment when the smallest doses (approximately half of the mean doses) were used, the concentrations in thalamus and temporal cortex were significantly smaller than the usual values, whereas the concentrations in the occipital cortex and in the cerebellum were correct. The use of too small a dose can lead to lower estimates of the receptor concentration resulting from an incomplete saturation, whereas the use of too large a dose can increase the standard deviation of the results (if the nonlinear part of the PET data becomes insignificant compared with the linear part).
Receptor sites in the cerebellum
The issue of the presence of receptor sites in the cerebellum is important because this region is usually assumed to be devoid of receptor sites, and thus is used as a reference region (Olsson et al., 1999). The presence of a saturable phenomenon has already been proven by the multiinjection approach (Delforge et al., 1999); it has not been possible to fit the PET curves obtained after two injections with different specific activities with a linear model (including only a nonspecific binding). Moreover, a low but detectable density of D2 receptor sites in the cerebellum has been observed in vitro, and has been estimated to range from 1% (Martres et al., 1985) to 0.1% (Hall et al., 1996) of the putamen density, which corresponds to the same order of magnitude as our in vivo estimate (0.87% of the putamen density, see Delforge et al., 1999).
The simplified method proposed in this paper is based on the existence of a nonlinear part in the model, and thus on a saturable part in the PET concentration as a function of the injected doses. If the model only included the linear part, the PET curves would be linear as a function of the dose. In this instance, equation 3 would lead to a null receptor concentration (the numerator of the equation is null). In practice, because of the experimental uncertainties, the receptor concentration estimates should yield negative and positive values, with a mean value close to zero. The results given in Table 1 show that a negative value is obtained only once (in the cerebellum, experiment 5 with bromine-76), whereas all the other values are positive. This cannot be obtained by chance, which proves the nonlinearity of the PET curves and, as a result, the presence of a saturable phenomenon in the four regions, including the cerebellum.
Parametric images
The method proposed in this paper enables good-quality parametric images of the receptor concentration. The comparison between the late PET images (acquired between 10 and 25 minutes) and the B′max images given in Fig. 6 shows that the PET concentration of FLB 457 is not a good index of the D2 receptor density. For example, the relatively high PET concentration in the eye areas (Fig. 6, top) corresponds to nonspecific binding; therefore, it is not related to the receptor concentration, which appears small in these regions (Fig. 6, bottom). In contrast, the B′max images reveal the relatively high concentration in the thalamus, which appears more clearly in these images than in the PET images.
All parametric images show symmetrical patterns, and the relative concentrations are in line with our knowledge of the D2 receptor distribution. The maximum receptor concentration value in the thalamus is approximately 2.5 pmol/mL. This value is smaller than that given in Table 1 (3.1 pmol/mL) because the parametric imaging necessarily uses a constant coefficient p1 = 0.85 regardless of the region, whereas in the region of interest approach, the relatively high concentration in the thalamus leads to a coefficient p1 = 0.75. The underestimate in the thalamus is not negligible (19%), and justifies the use of specific coefficients for the region of interest approach. Despite the need to use a constant coefficient p1 in the parametric imaging, the order of magnitude of the receptor concentration is correct.
In the cerebellum, the concentration appears to be heterogeneous, with a maximum concentration of approximately 1 pmol/mL in the cerebellar hemisphere, whereas the concentration is lower in the vermis (see Fig. 7). The receptor concentration appears to be higher in the medial part of the temporal cortex than in the lateral part. This result is consistent with the autoradiographic studies on human postmortem tissue, which show higher D2 receptor density in the amygdala (0.87 pmol/g) and medial temporal cortex (0.44 pmol/g) than in the lateral part (0.28 pmol/g) (Kessler et al., 1993). These differences are not easy to observe in PET images.
CONCLUSION
This study proposes a new method for estimating the D2 receptor concentration in the extrastriatal regions, thanks to the high affinity of the ligand (FLB 457). This protocol is easy to use in patient studies (i.e., single experiment, no blood sampling, short experiment duration). This method is based on a quasi-saturation of the extrastriatal receptor sites (85–95%); however, with the same doses, the occupancy in the striatal regions is less than 60%, which is lower than the usual occupancies resulting from usual medications. With the interval [t1,t2] = [10, 25 minutes] suggested in this study, the total duration of the experiment on patients is 50 minutes (the second injection is performed 25 minutes after the first). However, this duration can be reduced (e.g., at 30 minutes if t2 =15 minutes)
The results obtained with this approach are in line with the concentration estimates obtained using the multiinjection approach. The receptor concentration is 2.9 ± 0.5 pmol/mL in the thalamus, 1.0 ± 0.2 pmol/mL in the temporal cortex, and 0.35 ± 0.13 pmol/mL in the occipital cortex. This study provides new arguments in favor of a small presence of receptor sites in the cerebellum, in which the concentration is estimated at 0.35 ± 0.16 pmol/mL. The simplicity of the calculation used to estimate the receptor concentration lends itself easily to parametric imaging, even in routine patient studies.