
Abstract
The results of several recent papers have shown a significant influence of the endogenous neurotransmitters on the exogenous ligand kinetics measured by positron emission tomography. For example, several groups found that the percentage of D2 receptor sites occupied by the endogenous dopamine ranged from 25% to 40% at basal level. An obvious consequence of this significant occupancy is that the ligand-receptor model parameters, usually estimated by a model that does not take into account the endogenous ligand (EL) kinetics, can be significantly biased. In the current work, the authors studied the biases obtained by using the multiinjection approach. The results showed that in the classical ligand-receptor model, the receptor concentration is correctly estimated and that only the apparent affinity is biased by not taking the EL into account. At present, all absolute quantifications of the EL have been obtained through pharmacologic manipulation of the endogenous transmitter concentration, which is often too invasive a method to be used in patients. A theoretical reasoning showed that a noninvasive approach is necessarily based on both the apparent affinity measurement and on a multiregion approach. The correlation between the receptor concentration and the apparent affinity, previously observed with some ligands, verifies these two conditions; thus, the authors suggest that this correlation could be the result of the EL effect. To test this assumption experimentally, the effect of reserpine-induced dopamine depletion on the interactions between the D2 receptor sites and the FLB 457 is studied. With untreated baboons, the apparent FLB 457 affinity was smaller in the receptor-rich regions (striatum) than in the receptor-poor regions. This discrepancy disappeared after dopamine depletion, strongly suggesting that this affinity difference was related to the EL effect. Therefore, the purpose of the current study was to test the ability to quantify the EL based on the observed correlation between the receptor concentration and the apparent affinity. This approach offers a method for estimating the percentage of receptor sites occupied by the EL and, if its affinity is known, the free EL concentration. From the data obtained using FLB 457 with baboons, the authors found that approximately 53% of the D2 receptor sites are occupied by dopamine in the striatum and that the free dopamine concentration is approximately 120 nmol/L at basal level. This approach is transferable to patients, because the experimental data are obtained without pharmacologically induced modification of the EL.
Keywords
In the usual in vivo ligand-receptor model, the concentration of the receptor sites is denoted by B′max. Because of the presence of endogenous neurotransmitters, one usually assumes that part of the receptor sites is already occupied and therefore cannot be accessed by the labeled exogenous ligand. This explains partially the “prime” usually introduced in this parameter, and why B′max is defined as the receptor site concentration “available for binding.” The presence of these endogenous ligands (ELs) is obvious, because they are the chemical messengers that ensure the synaptic signal transduction. However, the concentration of these endogenous molecules in the synaptic cleft is usually unknown and is probably not constant, experiencing strong and fast variations as a function of the neuronal activations (Fisher et al., 1995). Because of the absence of data on this phenomenon, the quantification of the ligand-receptor model parameters was usually performed by neglecting the endogenous neurotransmitter effects.
However, during the past decade, many groups have provided evidence of a significant influence of the ELs on the positron emission tomography (PET) data in several ligand-receptor interaction systems (Carson et al., 1997; Dewey et al., 1992; Koepp et al., 1998; Laruelle et al., 1997a, 1998b; Price et al., 1998; Volkow et al., 1994, 1996). A complete and important critical review was recently published by Laruelle (2000). The EL concentration cannot be measured directly by PET (because it cannot be labeled), and therefore the relative or absolute quantifications of this concentration can be based only on indirect measurements obtained by studying the neurotransmitter influence on the kinetics of an exogenous labeled ligand. For example, several studies reported that the binding of [11C]raclopride decreases significantly after an amphetamine-induced dopamine elevation (Breier et al., 1997; Carson et al., 1997) and increases after a reserpine-induced dopamine depletion (Ginovart et al., 1997). The endogenous and exogenous ligand interactions have also been simulated using a mathematical model, for example by Logan et al. (1991), who studied the effects of dopamine on N-methylspiroperidol binding, and by Morris et al. (1995), who simulated the effects of the EL increase within the framework of activation detection studies.
The absolute quantification of the EL concentration is a difficult problem. Most of the published studies are based solely on relative measurements, such as variations of uptakes, binding potential, or distribution volume, which provided only relative variations of the EL concentration (Carson et al., 1997; Dewey et al., 1992; Koepp et al., 1998; Laruelle et al., 1997a; Price et al., 1998). At present, the only method allowing absolute quantification of the EL is based on the comparison between the binding potential with and without a pharmacologically induced EL depletion (Dewey et al., 1992; Ginovart et al., 1997; Laruelle et al., 1997a). Because of this pharmacologic action and the need for two different PET experiments, this method is difficult to use with patients.
These first studies showed that a significant percentage of the receptor sites are occupied by the EL, at least in some ligand-receptor systems. For example, the minimum percentage of D2 receptor sites occupied by dopamine ranges from 25% to 40% (Dewey at al., 1992; Ginovart et al., 1997; Laruelle et al., 1997a). Such percentages indicate that the endogenous neurotransmitter has a significant impact on the exogenous ligand kinetics, thereby creating a bias on the model parameters, which are usually estimated without modeling the neurotransmitter kinetics. Conversely, this bias produced by the EL on the PET curves could offer the opportunity to estimate its concentration in vivo using PET data.
The present study includes three parts. First, analytic calculations showing that a significant presence of an EL introduces a bias mainly on the association rate constant (and thus, on the apparent ligand affinity). The conditions needed to estimate in vivo the absolute quantification of the EL using PET and to obtain methods without pharmacologically induced EL variation are deduced. In the second part, the authors formulated the assumption that the correlation between the receptor density and the apparent affinity, previously observed with some ligands, is the result of the EL effect. In the final part, the experimental outcomes of this initial assumption are studied which showed that many arguments, based on previously published results and on new experimental data, support this interpretation. In particular, the effect of dopamine depletion on the interactions between the D2 receptor sites and FLB 457, a dopamine receptor antagonist is studied.
THEORY
Ligand-receptor model including the endogenous ligand kinetics
The compartmental model used in the current study is the usual nonequilibrium nonlinear model used for the multiinjection approach (Delforge et al., 1990, 1993; Huang et al., 1986; Mintun et al., 1984; Syrota et al., 1984), but with the addition of the kinetics of the endogenous neurotransmitter.
The exogenous ligand kinetics is described by the usual model including four compartments (nonmetabolized free ligand in plasma, free ligand in tissue, specifically and nonspecifically bound ligand) and seven parameters: k1 and k2 (the rate constants between the plasma and the free ligand compartment); kon/VR and koff (the association and dissociation rate constants); k5 and k6 (the rate constants between the plasma and the nonspecific binding compartments); and B′max (the receptor site concentration), which appears as a parameter in the binding reaction. The ratio of the dissociation to the association constants defines the equilibrium dissociation constant KdVR (the inverse of the affinity). VR is the volume of reaction that has been introduced to take into account the heterogeneity of the free ligand concentration, resulting, for instance, from the obvious heterogeneity of the tissue (Delforge et al., 1996). To simplify the figure, the model shown in Fig. 1 does not include the nonspecific binding compartment.
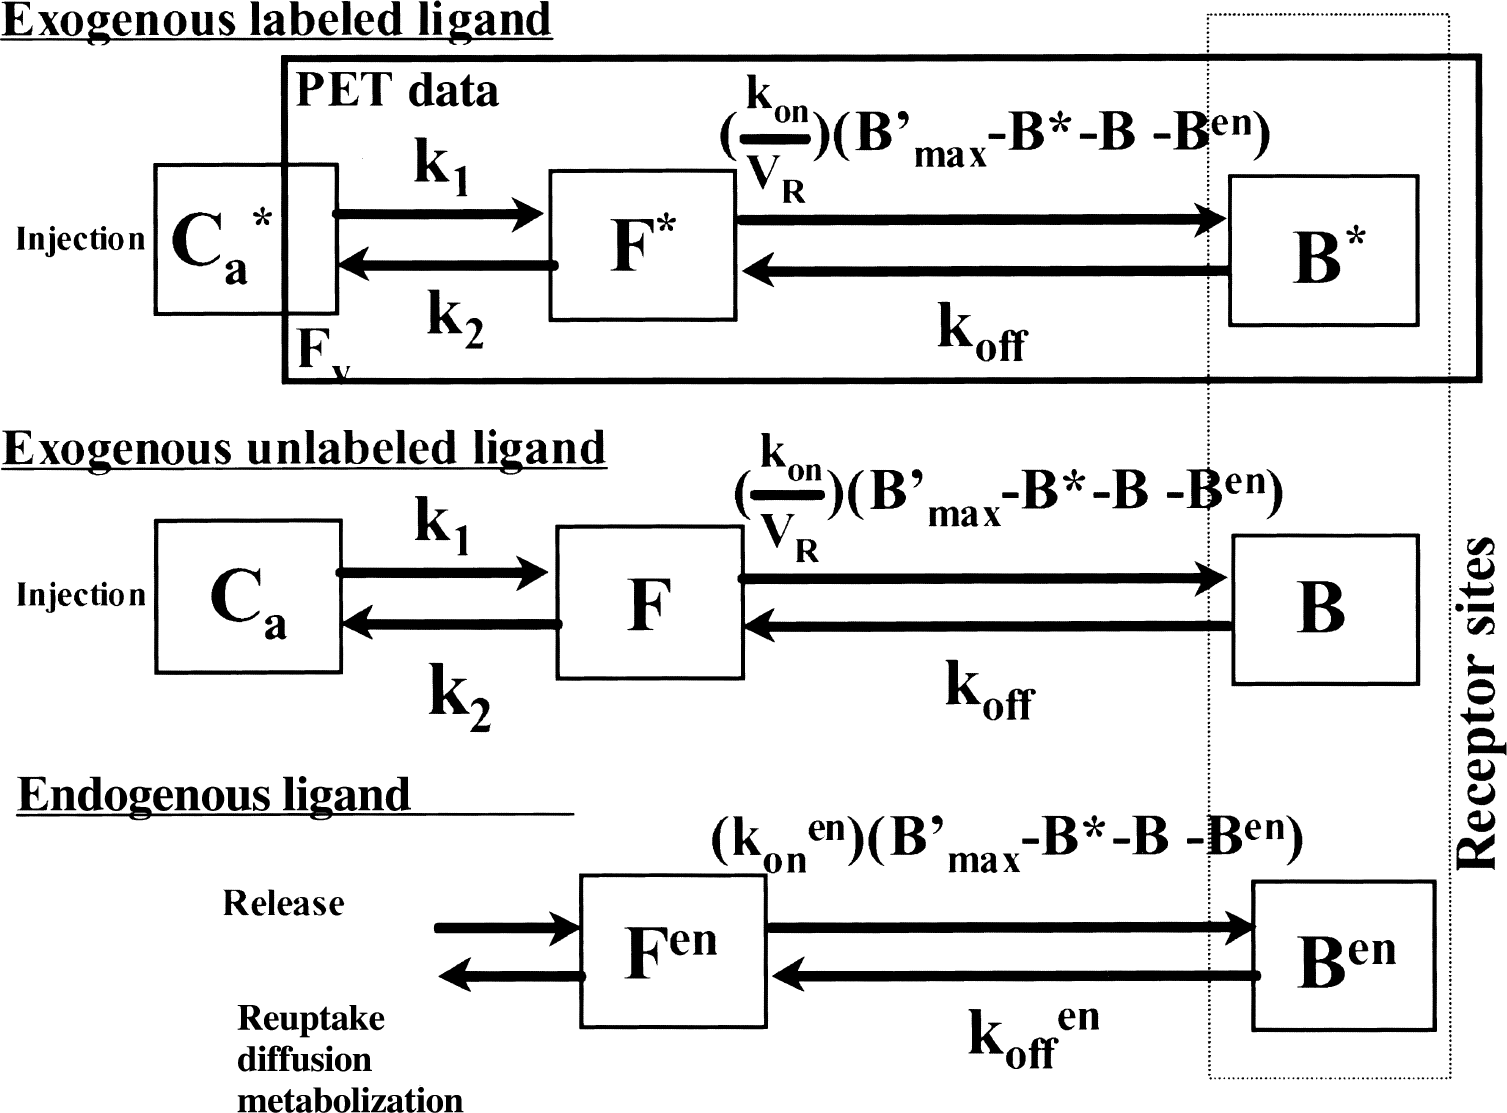
Compartmental ligand-receptor model used for the multiinjection method and including the endogenous ligand kinetics (the nonspecific binding compartments are not shown). The first two parts correspond to the kinetics of the exogenous ligand, labeled and unlabeled, respectively, and thus they have the same structure and the same parameter values. The last part represents the simplified kinetics of the endogenous ligand, reduced to the binding phenomenon. All probabilities of transfers between the compartments are linear except for the binding probability, which depends on the local association rate constant (kon or konen), the local free ligand concentration (F*/VR, F/VR, and Fen, respectively), and the local concentration of free receptor sites (B′max − B*(t) − B(t) − Ben(t)), which is common for the three parts of the model. The positron emission tomography (PET) experimental data correspond to the sum of the labeled ligand concentration in the tissular compartments and of a fraction FV of the labeled ligand concentration in the blood.
The multiinjection protocols can include injections of unlabeled ligand. Because the kinetics of the unlabeled ligand affects the concentration of the free receptor sites (and thus the binding probability of the labeled free ligand), it is necessary to simulate this kinetics, which is assumed to be similar to that of the labeled ligand. Thus, the first two parts of the model, respectively associated with the labeled and unlabeled ligand kinetics, have the same structure and the same parameters.
The kinetics of the EL is very complex, with fast variations associated with the neuronal activity (Fisher et al., 1995). Obviously, it is impossible to introduce the various phenomena related to the EL kinetics in the mathematical model, such as liberation from the vesicles, reuptake, diffusion, or the metabolization of this endogenous molecule. In the model shown in Fig. 1, the kinetics of the neurotransmitter is described by only two compartments, corresponding to the free (Fen) and the bound (Ben) EL. This simplified structure is usually used by authors (Logan et al., 1991; Morris et al., 1995) and is based on several assumptions. The first hypothesis assumes that the mean concentration of the free EL (Fen) can be considered as a constant throughout the experiment. It is well known that this concentration is variable, with brief moments of high concentration related to transmitter release combined with low concentration during much longer periods of quiescence (Fisher et al., 1995). However, these variations of the neurotransmitter are very short-lived (a few milliseconds) compared with a PET image duration (in the minute range); therefore, the use of a mean value is justified. The obvious implication is that this basal level is not disrupted by unexpected activation processes or by pharmacologic actions during the experiment (see below). The second hypothesis assumes that the kinetics of the EL is much faster than the kinetics of the exogenous ligand, and therefore that the EL kinetics can be assumed to be in a Scatchard equilibrium state. If the receptor sites exist in several states having different affinities for the neurotransmitter, it can be assumed that the equilibrium state is reached for each subtype and that the percentages of receptor sites in each subtype are not modified by injections of exogenous ligand (which is assumed to be an antagonist ligand). It can also be assumed that the concentration of EL is roughly homogenous in the synaptic cleft, and therefore the reaction volume of the EL can be set to 1. As for the exogenous unlabeled ligand, the neurotransmitter compartments are not directly observable from PET data, but the endogenous bound ligand concentration (Ben) has an impact on the local concentration of unoccupied receptor sites and consequently on the binding probability of the free labeled ligand.
Biases on the parameter estimates resulting from the endogenous ligand
In most of the quantification studies, the impact of the EL has been neglected. As a result, the estimated parameters can be biased, and the study of these biases may become important in attempting the quantification of the neurotransmitter concentration from PET data.
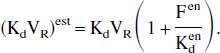
In the in vitro studies, it is possible to assume the equilibrium state for both exogenous and endogenous ligands. Thus, it can be deduced easily from the usual ligand-receptor interaction equations that the estimated affinity (1/Kdest) is related to the exact affinity (1/Kd) by the following equation:
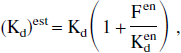
where Kden is the equilibrium dissociation constant of the neurotransmitter. This relationship is a classic result of the in vitro approach.
This relation has been used in vivo with PET data (Endres et al., 1997; Farde et al., 1995). These authors assumed that the equilibrium state was reached for both exogenous and endogenous molecules. However, some modeling approaches (such as the multiinjection method) do not assume the equilibrium state of the exogenous ligand and this hypothesis is not valid for some molecules (for example, with FLB 457, see Delforge et al., 1999).
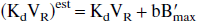
The analytic calculations corresponding to the general case, with the nonlinear and nonequilibrium model, are given in the appendix. By assuming only the equilibrium state of the EL, it can be shown that the model parameters estimated by neglecting the EL (parameters with the superscript “est” as in “estimated”) are related to the true parameters (without superscript) by the following relationships:
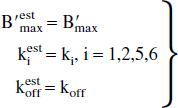
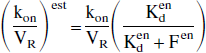
One can immediately deduce the relationship corresponding to the apparent affinity:
This last relationship appears similar to the in vitro relationship (Eq. 1), the only difference being the need to introduce the reaction volume VR in the in vivo studies.
An important consequence of these relationships is that the presence of an EL effect cannot be pointed out and quantified by studying the residual errors between the experimentally data and simulated curves. Indeed, if an experimental PET curve is simulated (without experimental uncertainties) using a model including a significant effect of the EL, it is possible (by fitting this curve) to find a new set of model parameters that perfectly simulate these PET data, but without EL effect. These estimated parameters are linked to the “true” parameters via the relationships in Eqs. 2 and 3.
Another important outcome is that only the association rate constant (and as a result the apparent affinity) is biased. In particular, the receptor concentration is correctly estimated despite the EL effect. This result has important repercussions, because it proves that the EL measurement is necessarily based on the measurement of the apparent association rate constant (or of the apparent affinity) and not on the receptor concentration.
Necessary conditions for a direct estimate of the EL parameters
Direct quantification of all the model parameters, including the parameters describing the neurotransmitter kinetics, from a single PET curve seems numerically unrealistic, even when using the multiinjection approach (this model includes 9 to 14 parameters). Moreover, if the equilibrium state of the EL is perfect, the results of the last paragraph show that the model parameters associated with the EL kinetics (Fen and Kden) cannot be identified. Indeed, according to Eqs. 2 and 3, the only information available on the 3 parameters—kon/VR, Kden, and Fen—is based on the determination of the single parameter (kon/VR)est. Thus, it is known that the apparent affinity is biased, but there is no information on this bias and obviously no information on the EL parameters. Therefore, if one wants to estimate separately Fen and Kden, more information is clearly needed. From the classic principle of modeling, two options are available: either decreasing the number of parameters or increasing the quantity of data.
The number of model parameters cannot be reduced by simplifying the model structure; the structure shown in Fig. 1 is already the minimal structure. The use of simplifying assumptions to reduce the number of parameters in the exogenous part of the model has no impact on the ability to identify neurotransmitter parameters.
Increasing the experimental data can be achieved by a perturbation of the EL kinetics (following the principle of the multiinjection approach), for example by a physiologic or a pharmacologic activation. However, to identify the model parameters, it is necessary to know the concentration of the free EL, which looks difficult because the exact kinetics of the EL cannot be simulated (only the binding phenomenon is simulated in Fig. 1). The only solution remaining is therefore to decrease significantly the concentration of the free EL (for example, by blocking neurotransmitter liberation) and thus to assume that this concentration is null. This approach is used, for example, in the method comparing binding potential with and without neurotransmitter depletion (Dewey et al., 1992; Ginovart et al., 1997; Laruelle et al., 1997a). However, such approaches are not practical for clinical studies on patients because the need for a complete depletion of the neurotransmitter can lead to significant adverse effects.
The authors' proposition is to test another solution that includes both a decrease in the number of parameters and an increase in the experimental data considered. Because the problem stems from the inability to identify the model parameters associated with the EL, the more logical approach would be to assume a relationship between these parameters as well as to consider simultaneously several regions of interest. In others words, for each region of interest, it is known that the bias on the affinity cannot be identified; however, comparing the results obtained with a lot of regions may highlight aberrations that can be related to this bias and thus to the effect of the EL. This is the principle of the following proposition.
Quantification of the endogenous ligand from the B′max versus KdVRest correlation
The basic assumption of this approach is that the positive correlation between B′max and KdVRest, observed at least with some ligand-receptor systems, is a bias resulting from the EL effect (that is not taken into account in the usual model structure).
This B′max versus KdVRest correlation was pointed out for the first time between the estimates of the benzodiazepine receptor density and those of the apparent flumazenil affinity with these receptor sites (Delforge et al., 1993), but it also was observed with other ligand-receptor systems (Andreasen et al., 1988; Delforge et al., 1999; Farde et al., 1995). Obviously, such a correlation could be observed only with a ligand-receptor system wherein the endogenous neurotransmitter occupies a significant percentage of receptor sites and thus has a significant effect on the exogenous ligand kinetics. The higher this occupancy percentage, the clearer the B′max versus KdVRest correlation. If this percentage is too small (for example, <10%), this correlation cannot be established because of the uncertainty on the model parameter estimates resulting mainly from the PET measure−ment uncertainties.
In this text, this B′max versus KdVRest correlation will be described by the following equation:
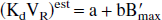
In this relationship, and with reference to the previous paragraphs, it can be assumed that the equilibrium dissociation constant (KdVR)est is a biased estimate, whereas B′max is the “true” value (the value unbiased by the EL effect). The logical idea (which will be discussed later) is to assume that a = KdVR (the unbiased value) and therefore, the following equation is obtained:
The search for an explanation of this correlation is very important. It is logical to attribute this B′max versus KdVRest correlation to a bias resulting from the assumptions introduced in the parameter estimation methods, which are mainly the assumptions on the model structure and some simplifying assumptions on the ligand kinetics. In a previous study, based on the flumazenil/benzodiazepine system that has been used by many groups with various methods (Delforge et al., 1995), it was reported that the only assumption common to all approaches that could explain a common bias was the structure of the model (see below). Because it is known at present that the EL can have a significant effect on the PET data, and because this phenomenon was not taken into account in the usual models, the endogenous neurotransmitter effect is a logical assumption. As expected by the previous theoretical considerations, this assumption is well related to an invalid model structure, and its outcome (the correlation between B′max and KdVRest) is well associated with a bias on the apparent affinity.
A consequence of this assumption is that a relationship between the free neurotransmitter concentration and the receptor concentration should exist. Indeed, if the theoretical bias introduced by the endogenous neurotransmitter effect (Eq. 4) is compared with the experimentally observed B′max versus KdVRest correlation (Eq. 6 with a = KdVR), the following relationship between Fen and B′max is obtained directly:
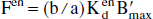
This increasing relationship between the receptor concentration and the free EL concentration can be discussed, but it looks reasonable and not absurd. For example, it is well known that the dopamine concentration is significantly larger in striatum than in extrastriatal regions. It is important to note that the linearity between B′max and Fen results directly from the linearity observed experimentally (or assumed) between B′max and KdVRest. Should a more detailed study lead to a more complex correlation (for example, (KdVR)est = a + f(B′max), where f is a mathematical function), the relationship between B′max and Fen would be simultaneously corrected (Fen = (1/a)Kdenf(B′max) in the previous example). In this article linearity will be assumed, because it is the simplest mathematical function and because this assumption does not contradict the available experimental data.
Equation 7 triggers the deduction of a new property of the B′max versus KdVRest correlation. In this relationship, all the parameters are related to the receptor sites and to the endogenous neurotransmitter, except for the ratio b/a, the only parameter associated with the exogenous ligand. As a result, if a receptor type is studied with several different exogenous ligands, the coefficients a and b can be different for each ligand, but the ratio b/a must be a constant dependent only on the receptor type.
In practice, if a B′max versus KdVRest correlation is experimentally observed during a ligand-receptor interaction study, it is simple to estimate the two correlation coefficients a and b. From these two experimental data, the validation of this present approach should enable us to deduce the following results:
the unbiased value of KdVR from the a value,
the free EL concentration Fen from Eq. 7, if the affinity of the EL (Kden) is known,
the percentage of receptor sites occupied by the EL at basal level, estimated from the following relationship (obtained by starting from the neurotransmitter Scatchard equilibrium equation and by substituting Fen using Eq. 7):
This percentage of occupied receptor sites can be estimated without knowledge of the EL affinity, because it depends only on B′max and b/a.
MATERIALS AND METHODS
Mathematical simulations of endogenous and exogenous ligand kinetics
To estimate the influence of the endogenous neurotransmitter on the exogenous ligand kinetics, simulations are performed using the mathematical model shown in Fig. 1. As the main example, the flumazenil kinetics parameters previously estimated for humans using the multiinjection approach (Delforge et al., 1995) are used. The experimental protocol included three injections: a tracer injection of [11C]-flumazenil (5.7 μg), followed after 39 minutes by a unlabeled flumazenil injection (0.65 mg) leading to a displacement, and after 69 minutes by a coinjection of [11C]-flumazenil (33.3 μg) and of flumazenil (6.5 mg). This experimental protocol was protocol 2 of Delforge et al. (1995). The input function was the unmetabolized flumazenil concentration in the plasma. The plasma concentration of the unlabeled ligand was calculated by simulation using the measured plasmatic labeled ligand concentration (at the same time for the coinjection and by using the initial tracer injection for the displacement, see Delforge et al., 1993, 1995, 1999).
The generic flumazenil kinetics parameters were k1 = 0.4/min, k2 = 0.6/min, kon/VR = 0.16 mL/(pmol.min), koff = 0.8/min. The receptor concentration B′max was variable (6 to 150 pmol/mL). The flumazenil model does not include nonspecific binding. For some simulations, the authors also used the exact values estimated for humans by the multiinjection approach (Delforge et al., 1995) in the occipital cortex (B′max = 88 pmol/mL, k1 = 0.41/min, k2 = 0.69/min, kon/VR = 0.068 mL/(pmol.min), koff = 0.81/min) and in the cerebellum (B′max = 21 pmol/mL, k1 = 0.34/min, k2 = 0.52/min, kon/VR = 0.110 mL/(pmol.min), koff = 0.72/min). The vascular fraction FV was set at 0.04.
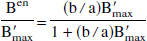
The endogenous neurotransmitter associated with benzodiazepine sites remains unknown. For the simulations, the EL parameters were set at konen = 0.25 mL/(pmol.min), koffen = 10/min, and thus Kden was set at 40 nmol/L. The concentration of the free EL (Fen) was set at 50 pmol/mL. The basic level of neurotransmitter bound to receptor sites was defined by the equilibrium Scatchard hypothesis. Therefore, at the time of the first ligand injection (time zero), the concentration of the bound EL (Ben(o)) is defined by:
From the parameter values, one deduces that Ben = 0.556 B′max at basal level—that is, 55.6% of the receptor sites are occupied by the neurotransmitter. This percentage is plausible because it has the same order of magnitude as the percentage obtained, for example, with the dopamine-D2 system (at least 25% to 40%).
All simulations were performed using a Runge–Kutta method in the MATLAB5 environment.
Reserpine-induced dopamine depletion on FLB 457 kinetics
Four PET experiments were carried out on male Papio anubis baboons (weighing about 15 kg) after pretreatment with intravenous reserpine (1 mg/kg over 10 minutes at least 2 days before) (Ginovart et al., 1997). Anesthesia was maintained with 1% isoflurane and a mixture of 66%/33% nitrous oxide/oxygen, controlled by a ventilator. The baboon's head was fixed in a head holder and positioned in the scanner gantry for axial plane acquisition. A transmission scan was recorded to correct for γ-ray attenuation. The experimental protocol was based on the three-injection approach: a tracer dose (about 0.5 mCi, 0.3 to 2.3 nmol) of [76Br] FLB 457; a coinjection of labeled (about 2 mCi, 0.6 to 4.6 nmol) and unlabeled FLB (30 to 48 nmol) after 100 minutes; and an injection of cold FLB 457 (137 to 217 nmol) after 200 minutes (displacement experiment). The overall duration of the experiment was 320 minutes.
The PET studies were performed on the ECAT EXACT HR+ positron tomograph (Siemens CTI, Knoxville, U.S.A.), which is capable of acquiring 63 continuous slices simultaneously. The resolution in the two-dimensional mode measured at 1 cm from center is 4.5 mm in the transverse direction and 4.1 mm in the axial direction. For each animal, an MRI examination was performed on a 1.5-Tesla unit (SIGNA, General Electric, Milwaukee, WI, U.S.A.). To obtain a set of MR images that could be superimposed on the PET images, contiguous axial T1-weighted slices were performed. Forty-four sequential PET scans were acquired, with the image acquisition durations varying from 2 to 10 minutes. For data analysis, regions of interest, selected on MRI slices, were drawn on selected PET images to involve the putamen, caudate, thalamus, cerebellum, and the occipital, temporal, and frontal cortices.
Concentrations of radioactivity in the different regions of interest were calculated for each sequential PET scan and plotted versus time. Radioactivity was measured in the selected cerebral structures after correction for 76Br decay and expressed as pmol/mL after normalization using the specific radioactivity measured at the time of injection. Correction of partial volume effects for a small structure like the putamen, caudate, or thalamus was performed from a phantom study (Bendriem et al., 1991). No correction was made in the other extrastriatal regions.
The input function was the unmetabolized FLB 457 concentration in plasma. During the PET acquisition, 60 arterial blood samples were withdrawn from the femoral artery at designated times. Blood and plasma radioactivity was measured in a γ-counter and the time-activity curves were corrected for [76Br] decay from the time of the injection. The amount of unchanged radiotracer in plasma was measured in selected samples with radio high-performance liquid chromatography similar to the technique described by Swahn et al. (1994). The amount of unchanged tracer was expressed as a percentage of total activity in plasma and used to calculate the arterial input function corrected for radiolabeled metabolites.
All animal use procedures were in strict accordance with the recommendations of the EEC (86/609-CEE) and the French National Committee (décret 87/848) for the care and use of laboratory animals.
RESULTS
Simulations of the EL kinetics
The ligand kinetics of the flumazenil was simulated with the three-injection protocol and the model parameters given above. The receptor concentration was set at 100 pmol/mL. The aim of these simulations was to provide an example of the competition between endogenous and exogenous ligands, which occurs only at the level of the receptor occupancy. These simulations also allowed to validate the possibility of considering the EL in an equilibrium state, despite the strong variations in its concentration.
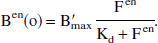
Figure 2 shows the labeled ligand kinetics. The concentration measured by PET is represented by the thick solid line; the free and bound ligands are respectively represented by the dotted and the thin solid line. After the initial tracer injection, most of the molecules were bound to the receptor sites. The injection of unlabeled ligand after 39 minutes caused a decrease in the bound ligand concentration, which remained higher than the free ligand concentration. After the coinjection performed after 69 minutes, most of the receptor sites were occupied by the unlabeled ligand, and the free ligand concentration became significantly higher than the bound ligand concentration, but with a quick decrease.
Simulation of a multiinjection experiment with flumazenil. Experimental protocol included three injections: a tracer injection of [11C]-flumazenil (5.7 μg), followed at 39 minutes by a unlabeled flumazenil injection (0.65 mg) leading to a displacement, and at 69 minutes by a coinjection of [11C]-flumazenil (33.3 μg) and flumazenil (6.5 mg). The concentration measured by positron emission tomography is represented by thick solid line; the dotted line and the thin solid line represent the free and the bound ligand, respectively.
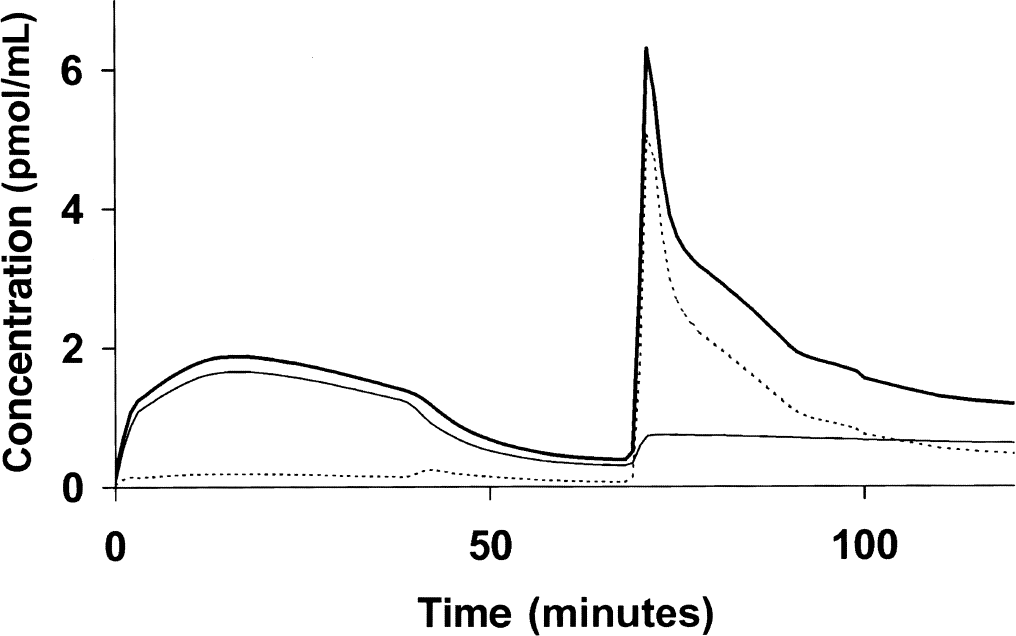
Figure 3 shows the occupancy of the receptor sites by the labeled ligand (solid line with triangles), of the unlabeled ligand (solid line with circles), and of the endogenous neurotransmitter (solid line without symbol). Before the initial ligand injection, the concentration of the bound EL Ben was defined by the equilibrium state (Ben(0) = 55.6 pmol/mL; see Eq. 9). After the initial tracer injection, the percentage of occupied ligand decreased very slowly (54.6% after 20 minutes), because the injected labeled ligand occupied less than 2% of the receptor sites. After the displacement injection (after 39 minutes), about 60% of the receptors were rapidly occupied by the unlabeled exogenous ligand, which led to a significant decrease of the percentage of receptor sites occupied by the endogenous neurotransmitter (21% after 50 minutes). This percentage increased as soon as the bound unlabeled ligand concentration decreased because of the natural dissociation phenomenon. After 69 minutes, a quasisaturation (98.2%) of the receptor sites resulted from the new injection of unlabeled ligand, which led to a very small percentage of receptor sites being occupied by the endogenous neurotransmitter (<1% of B′max at 71 minutes). However, this percentage increased as soon as the exogenous ligand was dissociated from the receptor sites. Throughout the experiment, the labeled ligand occupied less than 2% of the receptor sites.
Simulation of receptor site occupancy in the flumazenil multiinjection experiment by the endogenous ligand (solid line without symbol), the exogenous labeled ligand (solid line with triangles), and the exogenous unlabeled ligand (solid line with circles). The occupancy by the endogenous ligand has been calculated using two methods: first by the differential equation calculation (Eq. A1) and second by assuming an equilibrium state (Eq. A2). However, because these two curves are very close, they do not appear separate in this figure.
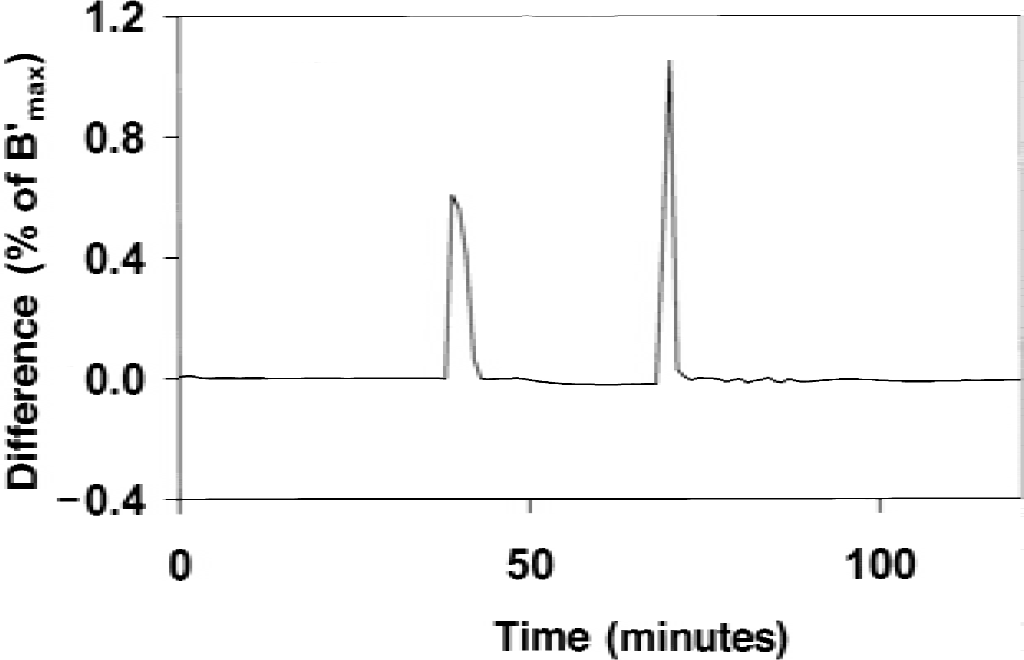
In Fig. 3, the determination of the percentage of receptor sites occupied by the EL is achieved by two methods: first, by the resolution of the differential equations using a numerical method (Eq. A1), and second, from the equilibrium state hypothesis (Eq. A2). However, the two curves represented in Fig. 3 by two solid lines without symbol are not distinguishable, the difference between these two curves being too small. Figure 4 shows this difference between the two estimates of Ben as a function of time. Each injection of labeled or unlabeled ligand led to a peak in this curve, but with different orders of magnitude. After the initial tracer injection, this difference was negligible; the maximum difference was less than 0.01% of B′max (that is, 0.01 pmol/mL, because B′max = 100 pmol/mL), but it decreased to approximately 0.001% after 10 minutes. The displacement injection led to a peak level of approximately 0.6% during the first 3 minutes, decreasing to less than 0.02% thereafter. The coinjection injection (after 69 minutes) led to the highest peak, with a value equal to 1.05% of B′max (that is, 1.05 pmol/mL) at 70 minutes, but was less than 0.01% after 72 minutes. These results show that the equilibrium state hypothesis of the neurotransmitter is valid, except during a short period of time after a dramatic variation of the free receptor sites. However, because the influence of the endogenous neurotransmitter on the exogenous ligand kinetics is related only to the occupancy of the receptor sites, it is obvious that an error of 1% during a short period has no significant effect on the EL kinetics.
Simulation of the B′max versus KdVRest correlation resulting from an uncertainty on the specific activity
The correlation between the estimated values of the receptor concentration and of the affinity has been observed by using the Scatchard approach with several molecules (Andreasen et al., 1988; Farde et al., 1995). In this framework, it has been suggested that this correlation may be produced by a common dependence of both B′max and KdVR estimates on the Scatchard plot uncertainties. For example, if an error on the specific activity moves the low specific activity points on the Scatchard plot, then both the intercept (B′max) and the slope (1/KdVR) are affected, which can lead to such a correlation. This explanation is clear for the Scatchard analysis and a similar common dependency of B′max and KdVRest cannot be excluded with the other methods.
Therefore, the impact of uncertainty on specific activity onto the model parameters was tested using the multiinjection approach. After simulating a PET curve without uncertainty using human flumazenil parameters and the exact specific activity value, this curve was fitted assuming an error on the specific activity value varying from −20% to +20%. Figure 5 shows the observed correlations between KdVRest and B′max in the occipital cortex (solid circles) and in the cerebellum (solid squares). These are very similar to the correlations observed using the Scatchard approach, with the extrapolated straight lines passing through the axis origin. In fact, the effect of an uncertainty on specific activity is probably similar whatever the method used, and this result is not surprising. In the same figure, the global B′max versus KdVRest correlation pointed out for humans (Delforge et al., 1995) is identified by the dashed line. This correlation does not pass through the axis origin (the intercept with the y-axis is equal to 4.56 nmol/L;Fig. 6).
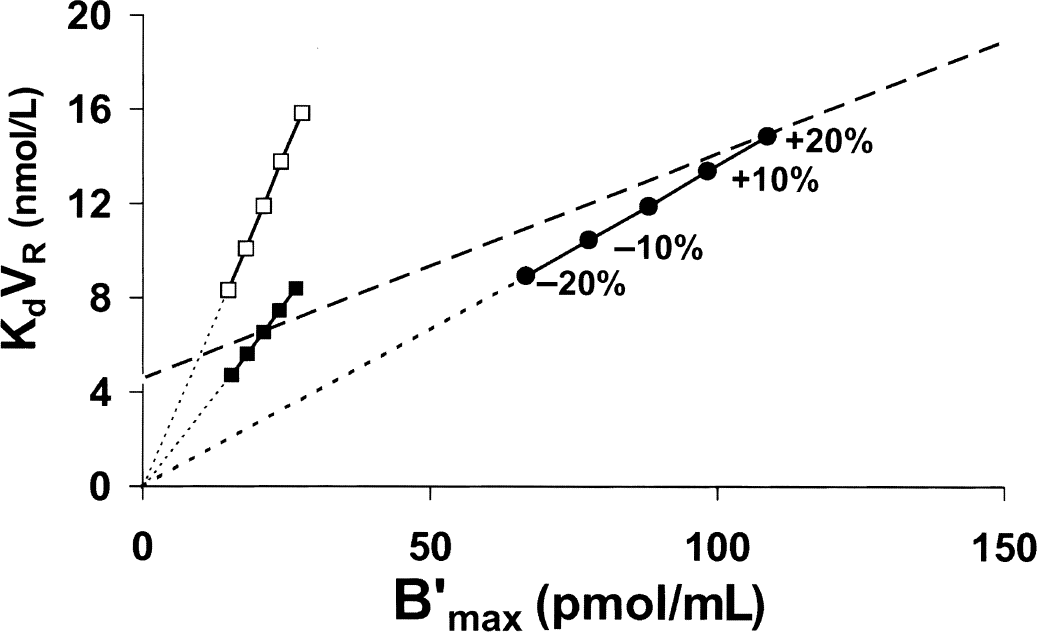
Simulation of the effect of the uncertainty on specific activity on the receptor concentration and the apparent affinity estimates obtained with the flumazenil multiinjection experiment (corresponding to Figs. 2 and 3). After simulating a positron emission tomography curve without uncertainty and the exact specific activity value, this curve was fitted assuming an error on the specific activity value varying from −20% to +20%. This figure shows the effect of this specific activity error in the occipital cortex (circles) and in the cerebellum (solid squares). The model parameters used for these simulations were the parameters previously estimated in humans (Delforge et al., 1995). Open squares show the results obtained in the cerebellum, assuming that the affinity is similar to the occipital affinity. Dashed line represents the correlation B′max versus KdVRest obtained in humans by Delforge et al. (1995).
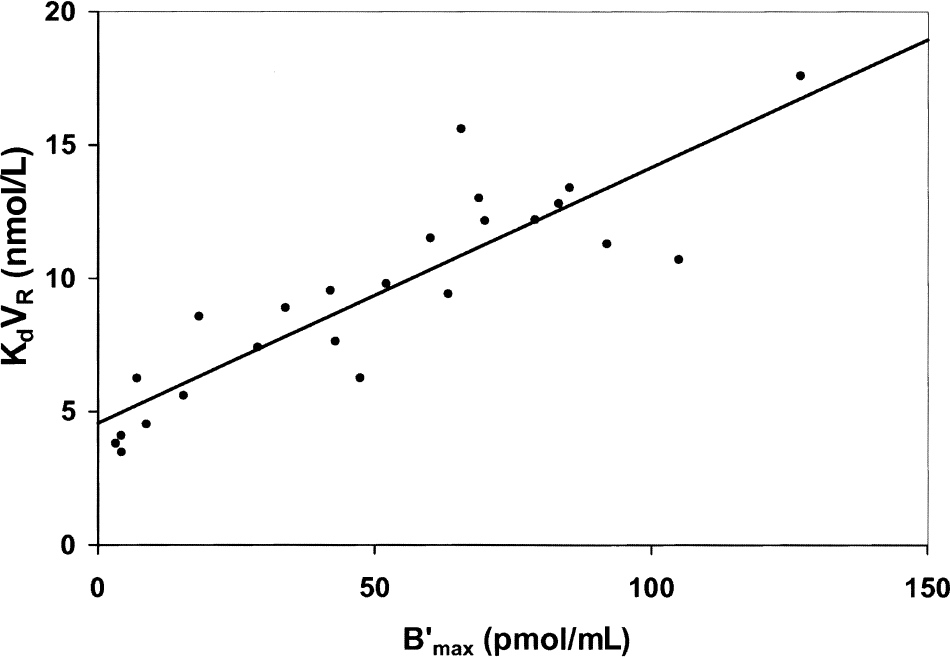
Correlation between the benzodiazepine receptor concentration and the flumazenil affinity obtained with humans from the data previously published in Delforge et al. (1995). Coefficients of the correlation: a = 4.56 nmol/L, b = 0.096 (r = 0.88, P = 0.01).
The previous simulations were performed again for the cerebellum, but by using the association and dissociation constants estimated in the occipital cortex (open squares in Fig. 5). The uncertainties on the specific activity led again to a linear correlation passing through the axis origin, but the estimated KdVR values were similar to the corresponding values of the occipital cortex (and thus were higher than the value estimated from true cerebellum data). For example, a 20% overestimate of the specific activity led to an estimated KdVR value of 15.8 pmol/mL in the cerebellum and 14.9 in the occipital cortex—that is, an overestimate of 33% and 26%, respectively. Similarly, a 20% underestimate led to a similar underestimate in the occipital cortex (25% with KdVRest = 8.9 pmol/mL) and in the cerebellum (30% with KdVRest = 8.3 pmol/mL). In conclusion, it is true that the uncertainty on the specific activity leads to a local B′max versus KdVRest correlation for a given receptor concentration, but this bias cannot explain the global correlation between B′max and KdVRest.
Two examples of EL quantification from the B′max versus KdVRest correlation
Most of the commonly used quantification methods are based only on relative indexes (for example, uptakes, Patlak plot, Logan plot, or distribution volume); therefore, few published studies have provided separate estimates of B′max and KdVR (usually denoted by Kd in the publications). The two following examples have been obtained using the multiinjection approach.
The correlation between flumazenil affinity and benzodiazepine receptor sites has been reported in many publications using several modeling approaches. Figure 6 shows the data obtained with normal volunteers (Delforge et al., 1995). From this correlation, one immediately deduced the 2 experimental parameters, a = 4.56 nmol/L and b = 0.096, which led to the following results:
the unbiased estimate of the flumazenil/benzodiazepine receptor affinity was KdVR = 4.56 nmol/L.
because the EL in unknown, there is no estimate of its affinity Kden. As a result, it can only be deduced that the free ligand concentration Fen was given by Fen = 0.021 Kden B′max.
by using Eq. 8, it was found that about 64% of the benzodiazepine receptor was occupied by an EL in the occipital cortex (B′max = 88 pmol/mL), whereas this percentage was only 9% in the pons (B′max = 4.7 pmol/mL).
Recently, a study of the interactions between the D2 receptor sites and [76Br]FLB 457 was performed in baboons (Delforge et al., 1999). This molecule has many advantages, because its very high affinity for the D2 receptor sites allows an estimate of the receptor concentration in the striatal regions (B′max = 44 pmol/mL) and also in the extrastriatal regions, where the receptor concentration is 10 to 100 times smaller (B′max = 4 pmol/mL in the thalamus and about 0.4 pmol/mL in the cerebellum and in the temporal and frontal cortices). However, the kinetics of [76Br]FLB 457 was very slow, and little kinetic information was obtained despite the length of the experiment (5 hours), which led to large standard deviations (Fig. 7). Nevertheless, a significant difference was found between the FLB 457/D2 affinity in the striatal and extrastriatal regions (KdVRest = 0.40 ± 0.13 nmol/L and 0.19 ± 0.08 nmol/L, respectively). More detailed results are given in Table 1 and in Delforge et al. (1999). From these results, one immediately deduced the two experimental parameters of the B′max versus KdVRest correlation: a = 0.161 nmol/L and b = 0.0046, which led to the following results:
the unbiased estimate of the FLB 457/D2 affinity was KdVR = 0.16 nmol/L.
by using the dopamine affinity estimate, Kden = 100 nmol/L (Fisher et al., 1995), one deduced that Fen = 2.8 B′max.
from Eq. 8, one found that approximately 53% of the D2 receptor sites were occupied by dopamine in the striatum, 12% in the thalamus, and only 1.1% in the cerebellum.
Estimates of the D2 receptor concentration (B′max in pmol/mL) and of the apparent FLB 457 affinity (KdVR est in nmol/L) for baboons, without and with reserpine-induced depletion of synaptic dopamine
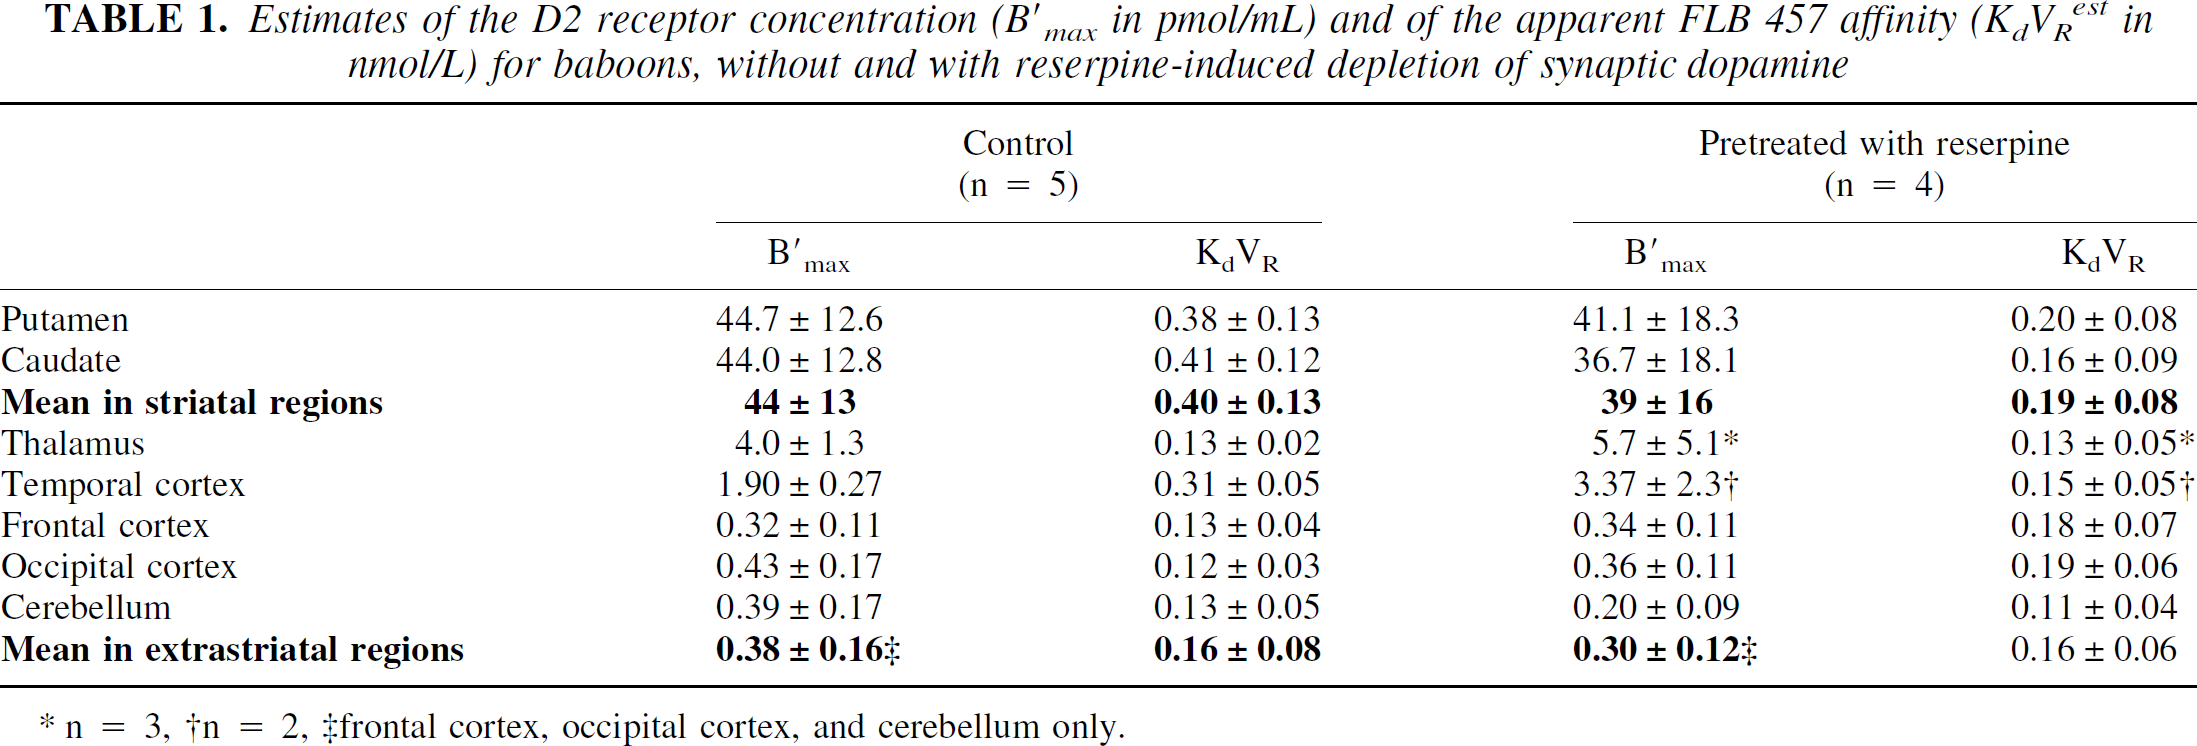
n = 3,
n = 2,
frontal cortex, occipital cortex, and cerebellum only.
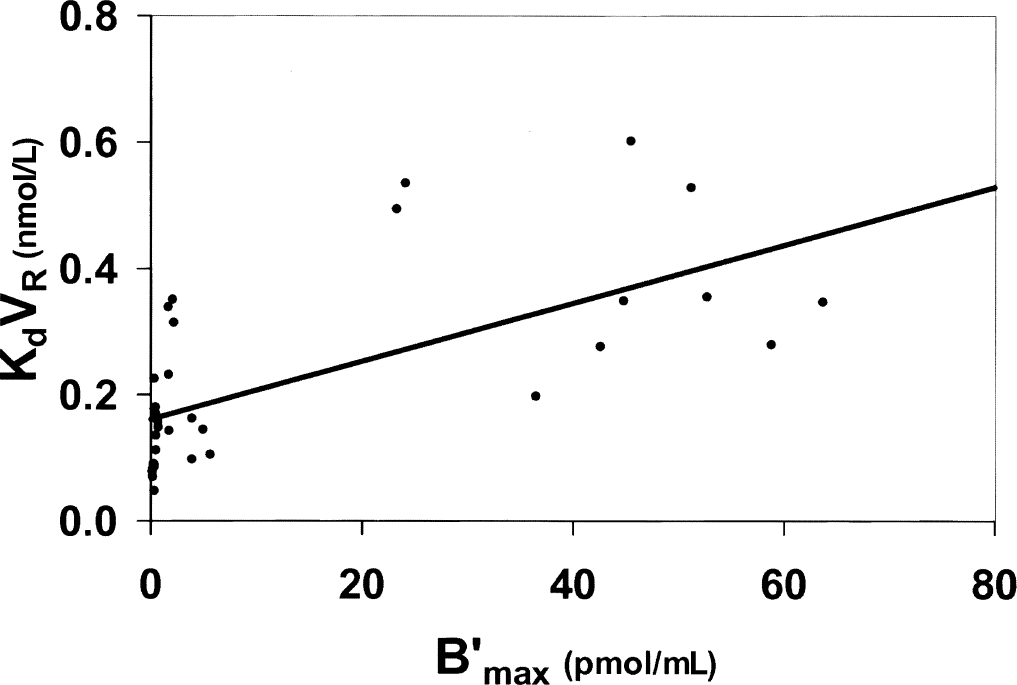
Relationship between the D2 receptor concentration and the FLB 457 affinity from the experimental data obtained with normal baboons and published in Delforge et al. (1999). Despite the large variability (resulting from the poor kinetic information obtained with this molecule), a positive correlation can be deduced. Coefficients of the correlation: a = 0.161 nmol/L, b = 0.0046 (r = 0.67, P = 0.04).
The correlation obtained with FLB 457 (Fig. 7) is noisier than the correlation obtained with flumazenil (Fig. 6). However, the main advantage of FLB 457 is that the D2 EL (the dopamine) is well known and that its concentration can be modified by a pharmacologic action.
Effect of reserpine-induced dopamine depletion on FLB 457 parameters
The basic assumption of this proposed approach is to relate the B′max versus KdVRest correlation with a bias resulting from the EL. A strong argument in favor of this theory should be obtained if it can be shown that this correlation disappears when the effect of the EL is suppressed.
Thus, the effect of the synaptic dopamine depletion on the model parameters describing the [76Br]FLB 457 kinetics in the baboon was studied. This depletion was induced by pretreatment with reserpine (Ginovart et al., 1997). Figure 8 and Table 1 present the results obtained from four experiments. These values are compared with the results obtained with untreated baboons (Delforge et al., 1999).
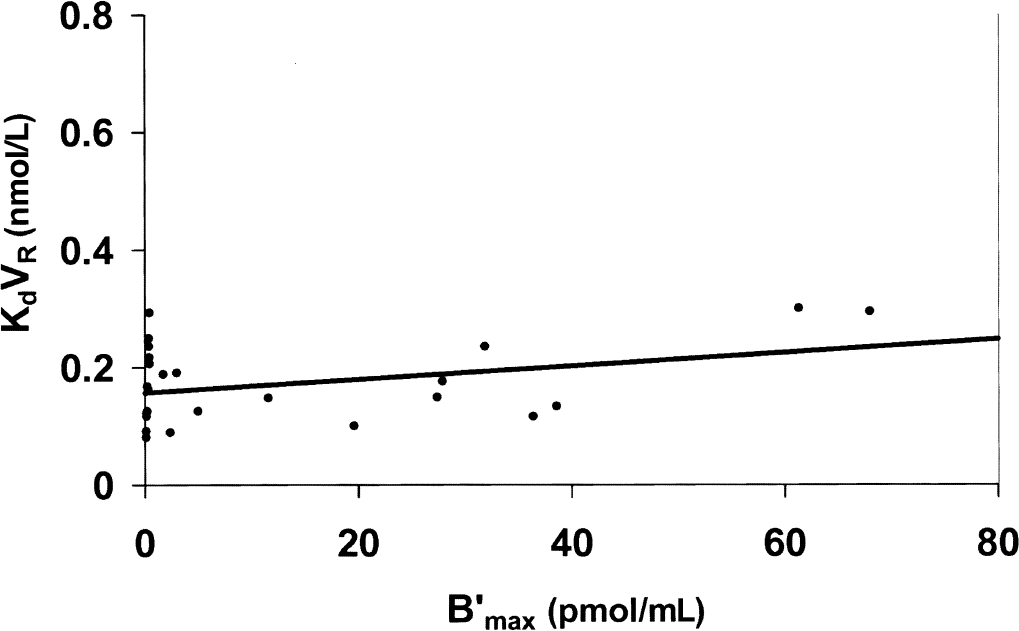
Relationship between D2 receptor concentration and FLB 457 affinity after reserpine-induced depletion of synaptic dopamine. Compared with the untreated baboons (Fig. 7), this figure shows that the dopamine depletion led to a decrease of the KdVRest value in the receptor-rich regions, whereas this parameter was not modified in the receptor-poor regions. Coefficients of the correlation: a = 0.156 nmol/L, b = 0.0012 (r = 0.32, P = 0.23).
Despite the small decrease in the receptor concentration in the striatum (12%, which can be explained by the parameter variability), these results showed that the receptor concentration was not significantly modified by the reserpine-induced depletion of synaptic dopamine. This result is in agreement with the theoretical projections (Eq. 2).
Concerning the apparent FLB 457/D2 affinity, a significant decrease in the striatal KdVRest value was found (0.19 ± 0.08 nmol/L vs. 0.40 ± 0.13 nmol/L). The use of the multiinjection approach enabled to show that koff is not modified by reserpine pretreatment (0.022 ± 0.07 vs. 0.023 ± 0.06/min), and therefore that the affinity variation resulted from the increase of the kon/VR value (0.13 ± 0.04 versus 0.06 ± 0.03 mL/(pmol.min)). In contrast, these results showed that the affinity in the extrastriatal regions was not modified by a reserpine-induced dopamine depletion (KdVRest = 0.16 ± 0.08 nmol/L vs. 0.16 ± 0.06 nmol/L).
Because experiments were performed using FLB 457 both with and without reserpine pretreatment, it should be interesting to estimate the receptor occupancy by comparing the binding potentials in the two cases (Ginovart et al., 1997; Laruelle et al., 1997a). However, this approach is not possible because the estimation of the free ligand concentration from the reference region (cerebellum) is not valid with FLB 457 (Delforge et al., 1999).
DISCUSSION
Assumptions on the EL kinetics
The difficulty of the EL modeling results from an inability to include in the mathematical model the various phenomena related to the neurotransmitter kinetics, such as the release from the vesicles, the reuptake, and the diffusion or the metabolization of this endogenous molecule; all these phenomena are complex and not quantifiable based on current knowledge. However, it is possible to assume that all these phenomena are very rapid compared with the duration of the PET images. Therefore, the fast and large variations of the free neurotransmitter concentration associated with the neuronal activity (Fisher et al., 1995) are assumed to have no influence on the mean concentration of this value (Fen) that must be introduced in the mathematical model.
In the model shown in Fig. 1, EL kinetics was simulated only between the free and the bound neurotransmitter compartments; as a result, the inputs and the outputs are not simulated and not quantified. Therefore, it is necessary to make an assumption about the amount of the EL present in the model. The first assumption, suggested by Logan et al. (1991), consists of assuming that the amount of neurotransmitter is constant (that is, to assume Fen(t) + Ben(t) = Cst). However, with this assumption, an injection of a large amount of unlabeled ligand leads to a very large (3 to 10 times in the example shown in Fig. 2) and durable (>1 hour in Fig. 2) increase in concentration of free EL. Because of the regulation phenomenon (decrease of the EL release and/or increase of the reuptake and other elimination phenomena, which are very fast), this large and durable increase of the free neurotransmitter concentration seems unrealistic from a biologic viewpoint. It is more likely that the Fen increase resulting from the displacement by the exogenous ligand is quickly eliminated by the regulation processes. Therefore, it can be assumed that without perturbations related to activation processes or pharmacologically induced neurotransmitter variations, the free ligand concentration Fen is a constant throughout the experiment.
The second important assumption about the EL kinetics is the Scatchard equilibrium state. This assumption, used in most of the studies (Endres et al., 1997; Logan et al., 1991; Morris et al., 1995), looks acceptable because the kinetics of the EL (which occurs mainly in the synaptic cleft) is much faster than the kinetics of the exogenous ligand (which occurs in all the tissue). Because of the possibly significant occupancy of the receptor sites by the neurotransmitter (see the dopamine example) and also because of the injection of large amounts of exogenous ligand in the multiinjection approach, the assumed equilibrium state is defined by the Scatchard equation with a Ben/Fen ratio variable as a function of the receptor occupancy (Eq. A2). The numeric simulations showed that this Scatchard equilibrium hypothesis is valid, despite the Ben(t) variations, if the exchanges between the free and the bound neurotransmitter compartments are very fast compared with these variations. This property is similar to the validity of the Scatchard equation despite a variation of B(t) if the exchanges between the free and the bound ligand compartments are very fast. This property has been validated for example with flumazenil (Delforge et al., 1993) and used for the partial saturation approach (Delforge et al., 1997).
The model used in this study belongs to the category of classical occupancy models with a pure competitive interaction between the endogenous and exogenous ligands for occupancy of receptor sites. In a recent review, Laruelle (2000) showed that the occupancy might be limited in its ability to account for all the experimental data and proposed instead the internalization model, in which agonist-induced internalization changes the affinities and affects the radioligand binding. This internalization process results mainly from the agonist molecule effects and thus can have an important influence in the studies that include activation or pharmacologically induced variations of the endogenous neurotransmitter concentration. However, the usual occupancy model is relevant to the current study because the proposed method is based on the use of antagonist molecules and does not need a modification of the neurotransmit−ter concentration.
Influence of EL on model parameter quantification
The results of recent studies have shown the significant influence of neurotransmitter variations on PET data, at least for some ligand-receptor systems (Laruelle, 2000). Because this phenomenon resulted from the competition between endogenous and exogenous ligands for occupancy of the receptor sites, this means that the occupancy percentage of these receptor sites by the neurotransmitter was sufficiently high to have a significant effect on the exogenous ligand kinetics. Therefore, the first absolute estimates of this percentage obtained using invasive methods—for example, with the dopamine-D2 system (at least 25% to 40%)—were not surprising, and the presence of significant biases on the model parameters (which are usually estimated using a model without simulation of the EL kinetics) was expected.
By assuming that the neurotransmitter is in an equilibrium state, but no assumption is made on the exogenous ligand kinetics, the analytic calculations described in the appendix provide the relationships between the true (unbiased) and the estimated parameters. It appears that kon/VR is the only parameter that is biased by the neurotransmitter influence (the dissociation parameter koff is found unbiased). The current results are an extension of the known in vitro relationship and of the results obtained by Endres et al. (1997) by assuming the equilibrium state of the exogenous ligand.
The fact that significant occupancy of the receptor sites by EL does not modify the receptor concentration estimate can be surprising. This result has been observed in some data (Ginovart et al., 1997) and reported in some publications (Laruelle, 2000), but with unclear reasoning. The usual explanation of the “prime” in B′max appears finally not justified. However, the presence of this prime remains justified because other reasons can explain that only part of the receptor sites are available for binding. For example, it is possible that a part of the receptor sites is not accessible by the exogenous ligand (see the concept of the reaction volume, Delforge et al., 1996).
The appendix gives the mathematical proof (based on the equilibrium state of the neurotransmitter), but the intuitive explanation is not obvious. This property results indeed from the competition phenomenon with a displacement of the EL by the exogenous one. Such displacements depend on the respective receptor occupancies and not only on the respective affinities as usually indicated (at the equilibrium state, the occupancy depends both on the affinity and on the free molecule concentration). It is well known that the separate estimate of B′max and KdVR is possible only with approaches where the experimental protocols lead to a significant percentage of receptor sites being occupied by the exogenous ligand during part of the experiment (Delforge et al., 1990). During this time, because it can be assumed that the receptor sites are significantly occupied both by endogenous and exogenous ligands, the kinetics of these two molecules are simultaneously perturbed by the variation of the free receptor site concentration (see Appendix). For example, the displacement of the labeled ligand by an injection of large amounts of unlabeled ligand reflects simultaneously the displacement of the endogenous neurotransmitter (Figs. 2 and 3). Therefore, the intuitive idea regarding inaccessibility of the occupied receptor sites relates only to the case of irreversible EL. This case is not realistic and is therefore excluded here, since a fast neurotransmitter kinetics is assumed.
In most of the studies, the relative variations of the neurotransmitter concentration have been studied using variations of different indexes relating to the binding (Laruelle, 2000), such as binding potential B/F. At the equilibrium state and after a tracer injection, it can be deduced from Eqs. 2 and 4 that:
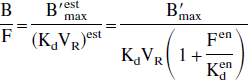
Two explanations of the B/F variations are possible. The intuitive idea is to consider that the endogenous neurotransmitter occupies part of the receptor sites, resulting in a variation of the binding potential that corresponds to a B′max variation (B′max = B′max (Kden/(Kden + Fen)), the affinity being assumed to be a constant (Laruelle et al. 1997a; Seeman et al., 1989). However, the valid interpretation is an unbiased receptor concentration and a variable apparent affinity ((KdVR)est = KdVR(1 + Fen/Kden)).
Correlation between B′max and KdVRest
The correlation between the receptor concentration and the apparent affinity was first observed by studying the interactions between flumazenil affinity and the benzodiazepine receptor density using the multiinjection approach (Delforge et al., 1993). This correlation was surprising at first, because the authors usually considered that the parameter KdVR (usually denoted by Kd) estimated in vivo using PET is a constant independent from the receptor concentration. No dependence between receptor concentration and affinity has been observed in in vitro studies and would anyhow be difficult to explain. However, this surprising correlation appeared consistent with the other published results on the flumazenil/benzodiazepine receptor interactions. A positive linear correlation between B′max and KdVRest has been tested with all the sets of published data (12 data sets;Delforge et al., 1995). The probabilities that such a correlation was randomly obtained were less than 6% for eight data sets and less than 0.5% for all the studies including more than 14 couples of values [B′max, KdVR].
Such a positive B′max versus KdVRest correlation has also been reported in the study of D2 receptors, both by Farde et al. using raclopride as a ligand (r = 0.7) and by Wong et al. using methylspiperone (r = 0.7 to 0.8; see Andreasen et al., 1988 for these two molecules), but without detailed results. A significant positive correlation (r = 0.71, P < 0.01) between the D2 receptor concentration and the raclopride affinity, obtained with 20 human subjects and using a Scatchard analysis, has also been recently published (Farde et al., 1995).
Explanation of the B′max versus KdVRest correlation by uncertainty on the specific activity
Most of these results have been presented as an artifact resulting from the effect of uncertainties on the specific radioactivity in the Scatchard method (Andreasen et al., 1988; Farde et al., 1995). The simulation study (Fig. 5) shows that this explanation allows to explain a local correlation resulting from the effect of uncertainty on a specific activity on the parameters estimated in one region (with one value of B′max and KdVR). However, this reason is not sufficient to explain a global correlation (valid for all B′max and KdVR values), such as the correlation experimentally observed with flumazenil. For example, in Fig. 5, the effect of the uncertainty on specific activity is stimulated by assuming that the flumazenil affinity is the same (11.9 nmol/L) in the occipital cortex (solid circles) and cerebellum (open squares). An error in the specific activity led to biases on the estimated affinities, but because the specific activity error is the same whatever the region (all data were acquired during the same experiment), the biases were very similar in all regions. As a result, the uncertainty on specific activity cannot explain the differences between the apparent affinities estimated in the occipital cortex and in the cerebellum.
Another strong argument against this explanation is that the B′max versus KdVRest correlation has also been observed with the multiinjection approach in each subject, from data acquired during a single experiment and thus with the same specific activity (Delforge et al., 1993). The best examples are the correlations observed with the parametric imaging approach using the multiinjection approach (Millet et al., 1995) or the partial saturation approach (Delforge et al., 1997). In these approaches, the parameters were estimated pixel by pixel from a single experiment, and the large number of the regions enabled validation of this correlation with a very high probability (P < 0.0005 with the multiinjection approach).
Surprisingly, Fig. 5 shows that the global B′max versus KdVRest correlation (dashed line) is very close in the receptor-rich regions to the local B′max versus KdVRest correlation resulting from a specific activity uncertainty (solid circles), the main difference being that only the second correlation passes though the axis origin. This similarity opens the possibility of explaining the recent results of Farde et al. (1995) in two different ways. These authors published a good correlation obtained in 20 subjects between the D2 receptor concentration and the apparent raclopride affinity (B′max = 2.33 + 0.25 KdVRest, r = 0.71, P < 0.01) estimated from a five-point Scatchard analysis using a saturation method to estimate the free ligand concentration. A similar correlation was observed from the same PET data but treated by using a five-point Scatchard analysis (B′max = 3.62 + 0.206 KdVRest, r = 0.75, P < 0.01) and a two-point Scatchard analysis (B′max = 2.64 + 0.230 KdVRest, r = 0.82, P < 0.01), the free ligand concentration being estimated in the cerebellum. Farde et al. explained these correlations by the effect of uncertainty on the specific activity. As previously simulated (Fig. 5), this explanation is acceptable, but a second possibility cannot be excluded: it is possible that the differences in the receptor concentrations (17 to 40 pmol/mL) resulted mainly from the biologic variability, and that the differences in the affinity estimates were due to a global B′max versus KdVRest correlation. Several strong arguments support this second explanation:
The uncertainty on the specific activity measurement (±40% for the extreme values) needed to justify the specific activity assumption looks too large with respect to the usual uncertainty on this measure.
The nonnull intercepts of the correlations with the affinity axis (2.33, 3.32, and 2.64 nmol/L, respectively) are not in agreement with the theoretical null value (see the simulations in Fig. 5).
The B′max versus KdVRest correlations obtained by using the two-point and the five-point Scatchard approaches were similar with the same parameter variabilities, whereas the five-point approach should significantly reduce this variability because the five experiments (and thus the specific activities) were independent from each other.
Other possible explanations of the B′max versus KdVRest correlation
Obviously, this B′max versus KdVRest correlation can result from any assumption introduced in the parameter estimation methods. The interest in studying this correlation in the flumazenil/benzodiazepine receptor interactions, is that flumazenil has been used by many groups with various modeling approaches. All methods used in the studies reported in Delforge et al. (1995) were different, with various assumptions related to the ligand kinetics (for example, equilibrium state, reference region method, full saturation method). The multiinjection approach does not require these assumptions but uses another assumption: the ability to estimate the plasma concentration of the unlabeled ligand Ca(t) from the measured concentration of the labeled ligand Ca*(t). The simulations show that uncertainties on Ca(t) have little influence on the parameter estimates (the fitting procedure concerns only the labeled ligand concentration curves), and therefore such uncertainties cannot explain the B′max versus KdVRest correlation. In conclusion, the only assumption that is common to all approaches and may explain a common bias is the structure of the model.
There are no limits to possible modifications of the model structure. The most classic problem related to the model structure is the presence or absence of a nonspecific binding. If a nonspecific binding compartment is in an equilibrium state with the free ligand compartment, it is well known that the two compartments can be lumped together in a single compartment (denoted by F + ns). In this case, the effect of the nonspecific binding is usually described by a parameter identified as f2, which is the fraction of the true free ligand within the combined F + ns compartment. The results of a previous study showed that this parameter can be included in the reaction volume concept and thus in the parameter VR (Delforge et al., 1996). Therefore, the B′max versus KdVRest correlation can be explained by an increase of the reaction volume VR (or of the usual parameter f2) within the receptor concentration. However, by assuming the equilibrium state and the same distribution volume (k1/k2) whatever the region (which are common assumptions and hold true with flumazenil), it is known that the true free ligand concentration is similar in all regions. Therefore, in the combined F + ns compartment, a significant increase of free fraction can be obtained only through a significant decrease in the nonspecific bound ligand concentration, which leads to a significant decrease in the overall concentration. For instance, f2 is multiplied by a factor of 3 only if the total concentration in the F + ns compartment is divided by a factor of 3. Such significant variations, which should lead to large variations of the apparent k1/k2 ratios estimated from the data, have not been observed in the past, and this nonspecific assumption is clearly not valid for flumazenil (Delforge et al., 1993, 1995). In short, a nonspecific binding, unidentifiable from the PET data, cannot explain the B′max versus KdVRest correlation.
Another possible explanation of the B′max versus KdVRest correlation is that the receptor sites may exist in several states, with different affinities for the neurotransmitter, and that the proportion for each state is different as a function of the region. For example, the D2 receptors are configured in states of high and low affinity for agonist, with approximately 50% of the receptors contributing to each state in the striatum (Fisher et al., 1995; Laruelle, 2000). However, this assumption is not valid for the D2 receptor sites, because raclopride is an antagonist that binds with equal affinity to both states (Seeman et al., 1994).
In the usual studies, the ligand-receptor model does not include simulation of the EL. Because it is known that the neurotransmitter can have significant effects on the ligand kinetics, this model structure imperfection is a possible explanation for the B′max versus KdVRest correlation. By assuming that Fen is a constant independent from the region, the analytic calculations (see Appendix) show that the bias is independent of the receptor concentration and thus cannot explain the correlation. However, the linear B′max versus KdVRest correlation can be simulated by assuming that the concentration of the free EL is proportional to the receptor concentration. This is the first assumption and the first calculations that enable a correct simulation of the linear B′max versus KdVRest correlation.
The heterogeneity of the neurotransmitter concentration in the brain and its relationship with the receptor concentration represent an acceptable assumption, because it is known, for instance, that the dopamine concentration is significantly larger in the striatal regions than in the cortex. The linearity between Fen and B′max is used in this article because it is the simplest mathematic function. Moreover, this assumption appears to be validated by the linear B′max versus KdVRest correlation observed with flumazenil (Delforge et al., 1995; Millet et al., 1995). In the case of the dopamine system, the receptor concentrations are limited to two concentration sets (in the striatal and in the extrastriatal regions), and consequently the B′max versus KdVRest correlation is reduced to two points, which is not enough to validate linearity. However, the explanations of the linear B′max versus KdVRest correlation by an EL effect obtained in 20 subjects by Farde et al. (1995) could open the possibility of validating linearity by using the biologic variability.
The main assumption of this proposed approach, which relates the B′max versus KdVRest correlation to the EL effect, can be validated if one experimentally proves that this correlation is modified by the variations of the EL and disappears if the EL concentration is dramatically reduced. Unfortunately, such a study is not currently possible with flumazenil because the EL associated with the benzodiazepine receptor is not known, notwithstanding several studies (Guidotti et al., 1983; Klotz, 1991). Therefore, the first validation study was performed using FLB 457, an antagonist of the D2 receptor sites.
Effect of reserpine-induced depletion of dopamine on FLB 457 kinetics
The main advantage of [76Br]FLB 457 is its very high affinity, which makes it possible to estimate the D2 receptor concentration in both striatal and extrastriatal regions. The main difficulty lies in the slow kinetics of this ligand, which explains why the parameter standard deviations ranged from 20% to 50% despite the length of the experiment. However, the FLB 457 affinity estimated for untreated baboons was found to be significantly different in extrastriatal (KdVRest = 0.16 ± 0.07 pmol/mL) and striatal regions (KdVRest = 0.39 ± 0.02 pmol/mL) (Delforge et al., 1999).
In the current study, the baboons were pretreated with a single dose of reserpine, per the method previously used by Ginovart et al. (1997). Reserpine, a cathecholamine-depleting agent, reduces striatal dopamine concentration. A single injection of reserpine (2.5 mg/kg) to the rat reduces striatal dopamine by more than 90% (Kuczenski and Segal, 1977). The reserpine-induced dopamine depletion is long-lasting, more than 60 days in the rat (Naudon et al., 1995) and more than 20 days with baboons (Ginovart et al., 1997).
The current results show that the large depletion of the synaptic dopamine resulting from reserpine pretreatment triggered no significant effect on the receptor site concentration, as anticipated from the theory (Table 1). Instead, a significant decrease of the striatal KdVRest value (0.19 ± 0.08 nmol/L vs. 0.40 ± 0.13 nmol/L) was found. This result is very similar to the KdVRest value decrease obtained by Ginovart et al. (1997) with raclopride (a decrease of 42% vs. 53% in the current study). However, these authors estimated only the KdVR value (because they used a Scatchard method), whereas the multiinjection approach permits a separate estimate of kon/VR and koff. As anticipated from the theory, the current results showed that koff was not significantly modified (0.022 ± 0.07 vs. 0.023 ± 0.06 per minute) and that the affinity variation resulted from the increase of the kon/VR value (0.13 ± 0.04 vs. 0.06 ± 0.03 mL/(pmol/min)).
Another new result is that the affinity in the extrastriatal regions was not modified by a reserpine-induced depletion of synaptic dopamine (KdVRest = 0.16 ± 0.08 nmol/L vs. 0.16 ± 0.06 nmol/L). This result shows that the bias related to the EL is negligible in receptor-poor regions. The low neurotransmitter concentration in these regions is in agreement with the assumed linear relationship between Fen and B′max (Eq. 7). This result also validates Eq. 6, where it was assumed that the intercept of the correlation with the y-axis represents the KdVR value unbiased by the EL.
In conclusion, the disappearance of the B′max versus KdVRest correlation by the reserpine-induced depletion of synaptic dopamine is a strong argument in favor of the authors' main assumption, which relates this correlation to an EL effect. Moreover, the alignment of the properties of the numeric results with the theoretical projections is a strong argument in favor of the other assumptions, such as the Scatchard equilibrium of the EL and the time-independent value of the free neurotransmitter concentration.
Estimate of free and bound dopamine concentrations
One of the main interests of this approach lies in the possibility of deducing the percentage of receptor sites occupied by the EL. Indeed, Eq. 8 permits an estimate to be made of this percentage, even without prior knowledge of the EL, through direct inference from the two parameters a and b deduced from the experimental B′max versus KdVRest correlation.
From the results of the FLB 457 study previously performed on baboons without reserpine pretreatment (Delforge et al., 1999), the correlation values can be deduced: a = 0.161 nmol/L and b = 0.0046 (Fig. 7). By using Eq. 8, it is found that about 53% of the D2 receptor sites are occupied by dopamine in the striatum. This result is close to the percentage (50%) estimated by Fisher et al. (1995) from neurophysiology data and is higher but has the same order of magnitude as results previously published using a reserpine-induced dopamine depletion: more than 30% in Dewey et al. (1992), at least 25% in Laruelle et al. (1997a), and about 36% in Ginovart et al. (1997). However, it is possible that the action of reserpine may have been incomplete, and as a result, there might have been a small residual dopamine concentration. In the dopamine-depletion experiments (Fig. 8), the fact that the slope of the B′max versus KdVRest correlation was significantly decreased by the reserpine effect (b = 0.0012 vs. 0.0046) but was not completely null could also stem from an incomplete action of the reserpine. Therefore, the D2 receptor in basal conditions deduced by comparing the binding potential with and without a pharmacologically induced dopamine depletion is only a minimum estimate. This may explain why the current results (which are deduced from the B′max vs. KdVRest correlation and thus are independent of the reserpine effect) are somewhat higher.
Another interesting possibility is the relationship between the B′max versus KdVRest correlation observed by Farde et al. (1995) using raclopride which may help estimate the percentage of D2 receptor occupied by dopamine. For example, by using the correlation obtained with the five-point Scatchard analysis and the reference region method, this occupancy comes to 62% by using Eq. 8. If one disregards one observation that is significantly different from all others (KdVRest = 15.0 nmol/L, whereas the other 19 values range from 6.4 to 11.7), the new correlation (B′max = 4.66 + 0.162 KdVRest, r = 0.78, P < 0.01) points to a 51% occupancy of the D2 receptor sites in basal conditions. Moreover, despite different values for the correlation parameters (a = 0.161 and 4.66 nmol/L, respectively, and b = 0.0046 and 0.162, respectively), the ratio b/a is interestingly similar for FLB 457 and raclopride (b/a = 0.028 and 0.035, respectively). This similarity is in line with the theoretical property related to the study of a receptor type using several different ligands (see Theory section). All these acceptable quantified results show again that the EL explanation of the B′max versus KdVRest correlation observed by Farde et al. (1995) cannot be ruled out.
The estimate of the occupied receptor site percentage as obtained using Eq. 8 is smaller in the extrastriatal than in the striatal regions. This percentage is estimated to be about 10% in the thalamus and only 1.1% in the cerebellum. These results are also surprising. However, they cannot be compared with other published data because they are the first in vivo estimates of the dopamine occupancy in the extrastriatal regions, to the authors' knowledge.
From the B′max versus KdVRest correlation, we can also deduce the free dopamine concentration in basal conditions if the neurotransmitter affinity is known (Eq. 7). By using the dopamine affinity set at Kden = 100 nmol/L (a rough average of the value for high-and low-affinity stage;Fisher et al., 1995; Ross and Jackson, 1989), and the parameters a and b estimated from the correlation observed on untreated baboons (Fig. 7), one can deduce that Fen = 2.8 B′max. For instance, the free dopamine concentration is found to be 123 pmol/mL in the striatum (B′max = 44 pmol/mL) and only 1.1 pmol/mL in the cerebellum (B′max = 0.39 pmol/mL). The ratio between the free dopamine concentration and the receptor concentration is similar to the value previously obtained by Ginovart et al. (1997) with a reserpine-induced dopamine depletion (2.8 vs. 1.8). The striatal value is very close to the dopamine concentration, estimated at 72 ± 40 pmol/mL in humans by Laruelle et al. (1997a) using alpha-methyl-para-tyrosine (AMPT)-induced dopamine depletion, and to the average dopamine concentration, estimated at 100 pmol/mL by Fisher et al. (1995) using neurophysiologic and biochemical data. These values are also close to those previously estimated by Ross (1991) using mice (40 to 60 pmol/mL), by Garris and Wightman (1994) using rats (89.3 ± 23.3 pmol/mL), and by Kawagoe et al. (1992), with strong variations from 200 to 6 pmol/mL and a temporal average of about 100 pmol/mL.
The proposed approach, which involves studying the B′max versus KdVRest correlation as deduced from striatal and extrastriatal data obtained during a single experiment without pretreatment, differs from the methods previously used to obtain an absolute quantification of the dopamine, through a comparison between striatal binding potential obtained from experiments with and without dopamine depletion. Similarities between the numeric results deduced by these two different methods are unlikely to be attributable to mere chance; therefore, these similarities are strong arguments in favor of the validity of the proposed approach.
Conclusions
One of the most important results recently obtained by PET is the significant effect of the EL on the exogenous ligand kinetics, at least for some receptor types. This raises an important question: is it possible to obtain an absolute quantification of the EL from PET data with a method that can be used in patients? This article attempted to answer that question.
The main difficulties are related to the complexity of the neurotransmitter regulation phenomena and the current ignorance thereof, making it impossible to model the EL kinetics completely. Therefore, it is necessary to use simplifying assumptions that may obviously be open to criticism. The best strategy is to deduce all theoretical outcomes from these assumptions and compare them with experimental data. The alignment between theoretical projections and experimental data provide strong circumstantial evidence in support of the initial assumptions.
Theoretical considerations showed that a noninvasive approach designed to obtain an absolute quantification of the EL is necessarily based both on the apparent affinity measurement and on a multiregional approach. The B′max versus KdVRest correlation previously observed in some ligand-receptor systems verifies these two conditions; therefore, it was logical to come up with the idea of testing a possible relationship between this correlation and the EL effect. The first results obtained by studying the effect of reserpine-induced dopamine depletion on D2-FLB 457 interactions provided strong arguments in favor of this assumption. The proposed method permits one to estimate the percentage of receptor sites occupied by the EL based on this B′max versus KdVRest correlation, and, if its affinity is known, of the concentration of free EL. Its main advantage over the other methods available is that it can be used with patients, because the B′max versus KdVRest correlation is obtained from a single experiment without invasive modification of the EL.
Obviously, notwithstanding these positive results, it is necessary to remain prudent and test this theory with other ligand-receptor interaction systems. The strong conditions needed to use this method in practice, related both to physiologic (a significant percentage of receptor sites must be occupied by the EL) or methodologic conditions (the need for a modeling approach allowing a separate estimation of B′max and KdVR), could make the use of the approach difficult.
However, despite these difficulties, it is important to continue these studies, because EL quantification could open a large framework for new approaches to normal or pathologic neurotransmission studies. The study of the variation of the EL concentration, which reflects neuronal activity, could be an important tool to understand and quantify the neuronal connection and activation processes. Moreover, many brain diseases are probably related to anomalies in the neurotransmitter concentration, and the ability to measure this concentration in a patient could open new ways of research to understand these diseases.