
Abstract
The multi-injection approach has been used to study in baboon the in vivo interactions between the D2 receptor sites and FLB 457, a ligand with a very high affinity for these receptors. The model structure was composed of four compartments (plasma, free ligand, and specifically and unspecifically bound ligands) and seven parameters (including the D2 receptor site density). The arterial plasma concentration, after correction for metabolites, was used as the input function, The experimental protocol, which consisted of three injections of labeled and/or unlabeled ligand, allowed the evaluation of all model parameters from a single positron emission tomography experiment In particular, the concentration of receptor sites available for binding (B'max) and the apparent in vivo FLB 457 affinity were estimated in seven brain regions, including the cerebellum and several cortex regions, in which these parameters are estimated in vivo for the first time (B'max is estimated to be 4,0 ± 1.3 pmol/mL in the thalamus and from 0.32 to 1.90 pmol/mL in the cortex), A low receptor density was found in the cerebellum (B'max = 0.39 ± 0.17 pmol/mL), whereas the cerebellum is usually used as a reference region assumed to be devoid of D2 receptor sites, In spite of this very small concentration (1 % of the striatal concentration), and because of the high affinity of the ligand, we demonstrated that after a tracer injection, most of the PET-measured radioactivity in the cerebellum results from the labeled ligand bound to receptor sites, The estimation of all the model parameters allowed simulations that led to a precise knowledge of the FLB 457 kinetics in all brain regions and gave the possibility of testing the equilibrium hypotheses and estimating the biases introduced by the usual simplified approaches.
Research on dopamine D2 receptors has been considerably developed in vivo using positron emission tomography (PET) because of the availability of several selective antagonist neuroleptics. For example, [11C]raclopride has been extensively used for the visualization and quantification of the striatal D2 receptors (Farde et al., 1986, 1989). However, experimental results suggest that extrastriatal dopamine receptor sites are involved in the medication of antipsychotic drug effects (Janowski et al., 1992; Deutch and Duman, 1996). The potential of PET for determination of D2 receptor concentration in extrastriatal regions has been limited in the past, because of the low density of these receptor sites and insufficient affinity for extrastriatal dopamine receptors of the most widely used radioligands.
The purpose of this study was to quantify in vivo the extrastriatal dopamine D2 receptor density. The use of both a multi-injection approach and a ligand with a very high affinity (FLB 457) made it possible to do so.
The multi-injection approach has proved to be a method well adapted to estimate the low receptor concentrations, because the effects of noisy data are reduced by the use of complex protocols including several injections with different specific activities. For example, the benzodiazepine receptors in the pons (which was usually assumed to be devoid of receptor sites) have been quantified for the first time by PET using this approach and flumazenil as a ligand (Delforge et al., 1995).
The compound FLB 457 is a ligand with a very high affinity (20 pmol/L in vitro) for D2 dopamine receptors.
This ligand has been labeled both with 11C (a short half-life isotope, 20.4 minutes) by Halldin et al. (1995) and with 76Br (a long half-life isotope, 16.2 hours) by Loc'h et al. (1996). Because carbon and bromine atoms are parts of the FLB molecule, [11C]FLB 457 and [76Br]FLB 457 have the same chemical formulas and thus have the same binding characteristics. The interest of this double radiolabeling is that it opens the possibility of performing both long experiments in animals with the radiobrominated ligand and simplified protocols applicable in patients with the radiocarbonated one.
In the current article, all the values of the model parameters describing the interactions between the FLB 457 and the D2 receptor sites are estimated in baboon, in both the striatal and extrastriatal regions. In particular, a non-negligible receptor concentration has been found and quantified in the cerebellum, which is usually assumed to be devoid of receptor sites. The estimation of all model parameters allowed simulations that led to a precise knowledge of the FLB 457 kinetics in all compartments and in all regions. Simulations gave also the possibility of testing the equilibrium hypotheses and studying the biases introduced by the usual simplified approaches.
METHODS
Radiopharmaceutical preparation
Bromine 76 was prepared in our facilities by irradiation of an arsenic target with a beam of 30 MeV 3He ions provided by the cyclotron. The preparation of [76Br]FLB 457 was previously described (Loc'h et al., 1996). Briefly, tributyltin-FLB 457 was reacted with no-carrier-added [76Br]BrNH4 and a mixture of concentrated acetic acid and 30% hydrogen peroxide for 30 minutes. The purification of the radiotracer was carried out by semipreparative normal phase high-performance liquid chromatography (HPLC) using a mixture of chloroform, methanol, water, and ethylamine as eluent with a total radiochemical yield of 80%. Radiochemical and chemical purities of [76Br]FLB 457 analyzed by radiographic thin-layer chromatography and HPLC were 99% with a specific radioactivity ranging from 20 to 40 GBq/µmol. For injection in animals, the radiobrominated ligand was dissolved in saline and filtered through a 0.22 µm sterile membrane (Millex-FG, Millipore Products, Bedford, MA, U.S.A.).
The ligand-receptor model
The compartmental model used in this study, and shown in Fig. 1, is based on the usual nonequilibrium nonlinear model (Syrota et al., 1984; Mintun et al., 1984; Huang et al., 1986; Delforge et al., 1993). It includes four compartments and seven parameters.
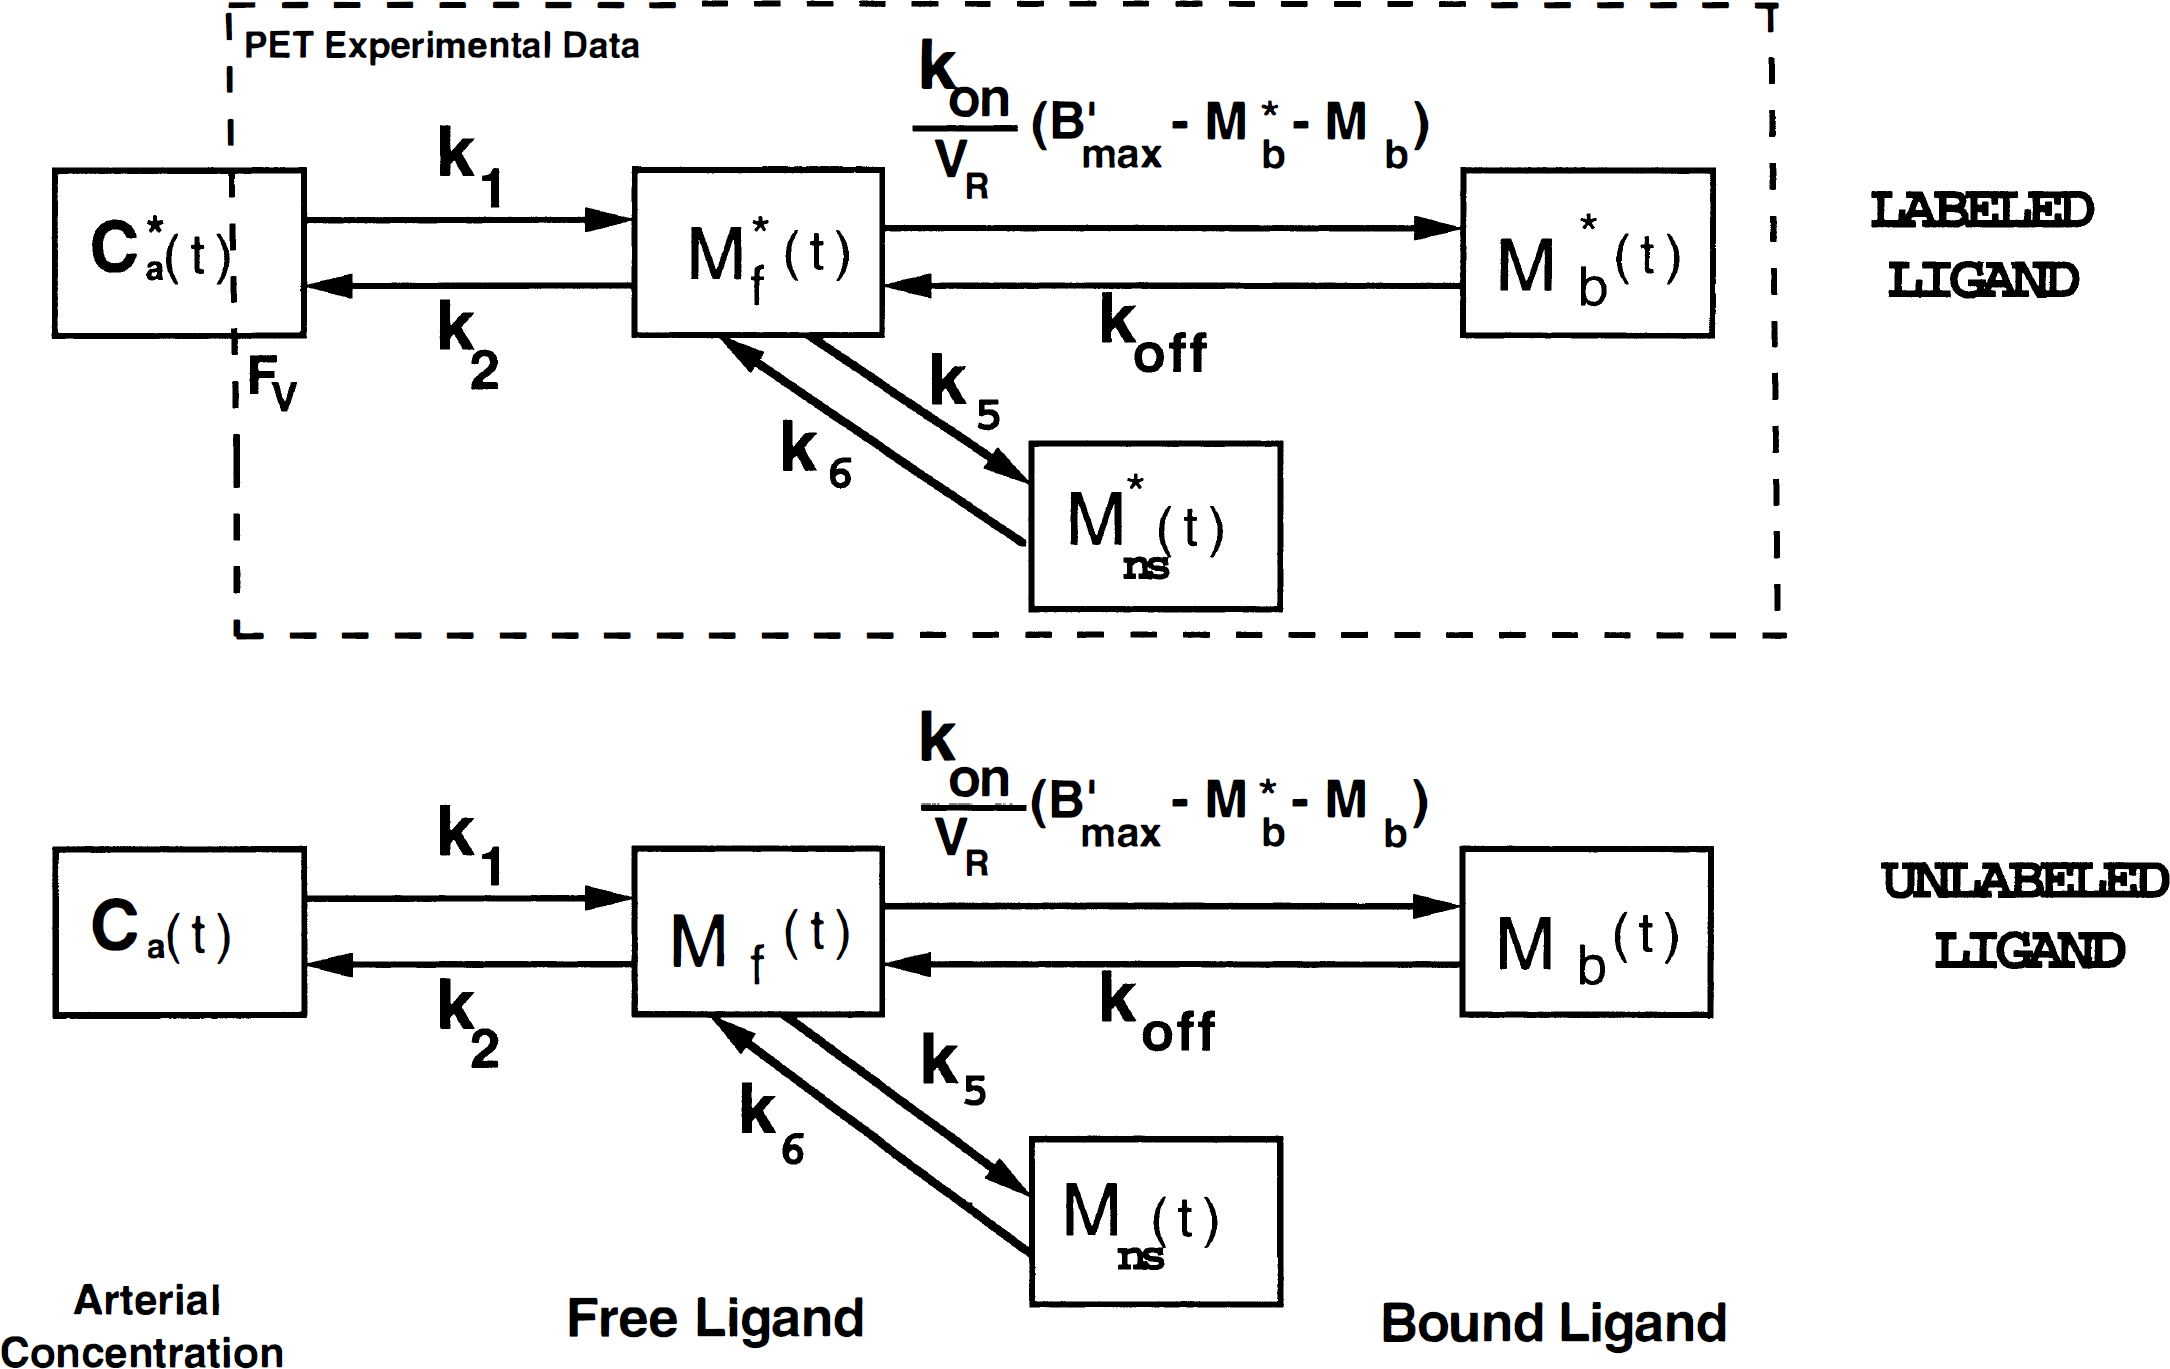
Four-compartment ligand-receptor model used in the analysis of FLB 457 time-concentration curves obtained with PET. All transfer probabilities of ligand between compartments are linear, except the binding probability, which depends on the local association rate constant (kon), the local free ligand concentration (M*f(t)/VR), and the local concentration of unoccupied receptor sites (B'max – M*b(t)–Mb(t)). The PET experimental data correspond to the sum of the labeled ligand in the three tissue compartments and of a fraction Fv of the blood concentration. The unlabeled ligand compartments are not directly observable from PET data, but the concentration of the specifically bound ligand (Mb(t)) has an effect on the local concentration of unoccupied receptor sites, and consequently on the binding probability of the free labeled ligand.
The flux of nonmetabolized free ligand from the plasma compartment to the free ligand compartment is given by k1C*a(t) (as picomole per minute per milliliter of tissue), where C*a(t) is the plasma concentration of nonmetabolized FLB 457.
The quantity of free labeled ligand present in 1 mL of the tissue volume delineated by PET is denoted by M*f(t). However, because of the obvious heterogeneity of the tissue, this concentration can be heterogeneous in the PET volume. For example, the local concentration of the free ligand in the vicinity of the receptor sites (which is the concentration to take into account in the ligand-receptor interactions) may be different from M*f(t) (which, by definition, represents the mean concentration in the unit volume measured by PET). To take into account this heterogeneity, we have previously introduced the concept of the reaction volume denoted by VR (as milliliter of tissue per milliliter of tissue). By definition, the value of VR is such that M*f(t)/VR is equal to the local free ligand concentration in the vicinity of the receptor sites (Delforge et al., 1996). The free ligand can bind directly to an unoccupied specific receptor site or to a nonspecific site or escape back to the blood circulation with a rate constant k2.
The specific binding is a saturable reaction that depends on a bimolecular association rate constant kon, the free ligand concentration in the vicinity of the receptor sites M*f(t)/VR, and the quantity of free receptor sites in 1 mL of tissue. This last quantity is equal to B'max – M*b(t), where B'max is the total receptor site concentration available for binding and M*b(t) is the quantity of receptor sites in 1 mL of tissue already occupied by the ligand. The rate constant for the dissociation of the specifically bound ligand is denoted by koff. The in vivo equilibrium dissociation rate constant is denoted by KdVR, where Kd is the ratio koff/kon.
The nonspecific binding is a nonsaturable phenomenon whose rate constants are usually denoted by k5 and k6 (Fig. 1). The amount of the nonspecifically bound ligand is denoted by M*ns(t).
The multi-injection protocols include injections of unlabeled ligand. Because the kinetics of the unlabeled ligand affect the concentration of free receptor sites (and thus the binding probability of the labeled free ligand), it is necessary to simulate these kinetics, which are assumed to be similar to those of the labeled ligand. Thus, the two parts of the model shown in Fig. 1, associated with the labeled and unlabeled ligand kinetics, respectively, have the same structure and the same parameters. The plasma concentration of the unlabeled and unmetabolized ligand (denoted by Ca(t)) was estimated using the curve C*a(t) corresponding to the labeled ligand.
In Fig. 1, B'max, k1, k2, kon/VR, koff, k5, and k6 are the model parameters to be identified. The two parameters kon and VR cannot be separately estimated because they always appear together in model equations (Delforge et al., 1996). In PET studies, the experimental data (denoted by M*T(ti)) acquired between two times (denoted by ti–1 and ti) are given by the following integral relationship:
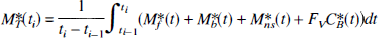
where C*B(t) is the whole blood time-concentration curve and Fv represents the vascular volume that is the fraction of blood present in the tissue volume. In this study, Fv is fixed at 0.03 (Perlmutter et al., 1986; Farde et al., 1989; Koeppe et al., 1991).
The model parameters are identified through a minimization of the usual weighted least-square cost function, and the estimation of the standard errors relies on a sensitivity analysis and on the covariance matrix (Beck and Arnold, 1977; Carson, 1986; Delforge et al., 1989). Comparisons between model structures are based on the use of the Akaike information criterion (Akaike, 1974) and of the F test (Landaw and Di Stefano, 1984; Carson, 1986).
Experimental protocol
Five PET experiments were carried out on five different male Papio anubis baboons weighing approximately 15 kg. Anesthesia was maintained with 1% isoflurane and a mixture of 66% nitrous oxide, 33% oxygen, controlled by a ventilator. The baboon's head was fixed in a headholder and positioned in the scanner gantry for axial plane acquisition. A transmission scan was recorded to correct for γ-ray attenuation.
The protocol was based on the multi-injection approach, which consists of several injections of labeled and/or unlabeled ligand, distributed throughout the study. In this study, the experimental protocol included three injections:
A tracer dose (about 0.5 mCi, from 1 to 6 nmol) of [76Br] FLB 457. A coinjection of labeled (about 2 mCi, from 2 to 12 nmol) and unlabeled FLB 457 (from 15 to 35 nmol) at 100 minutes. An injection of cold FLB 457 (from 120 to 155 nmol) at 200 minutes (displacement experiment).
The overall duration of the experiment was 320 minutes. The compound needed for the two injections of [76Br]FLB 457 was produced during a single synthesis. The detail of the doses administered are given in Table 1.
Numerical values of the protocol parameters corresponding to the five experiments.
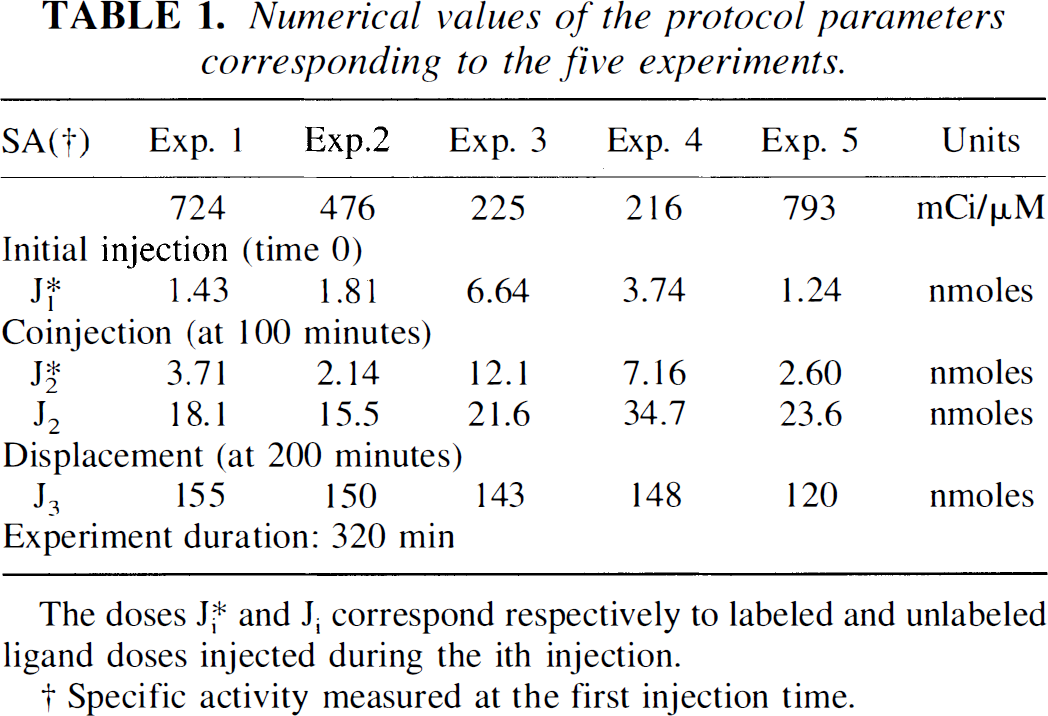
The doses J*i and Ji correspond respectively to labeled and unlabeled ligand doses injected during the ith injection.
Specific activity measured at the first injection time.
All animal use procedures were in strict accordance with the recommendations of EEC (86/609-CEE) and the French National Committee (décret 87/848) for the care and use of laboratory animals.
Input function and metabolite studies
The input function was the unmetabolized FLB 457 concentration in plasma. During PET acquisition, 60 arterial blood samples were withdrawn from the femoral artery at designated times. The time interval between each sample varied: it ranged from 15 seconds during the 2 minutes after each injection of labeled FLB 457 to up to 10 minutes when the distribution phase was complete. Blood and plasma radioactivity was measured in a γ-counter and the time-activity curves were corrected for [76Br] decay from the time of the injection.
The amount of unchanged radiotracer in plasma was measured in selected samples (seven for the first two tracer injections and two late samples after the third injection) with radiographic HPLC as described in Swahn et al. 1994. After precipitation of the proteins 95% of the radioactivity in plasma was recovered in the supernatant and used for the analysis. The amount of unchanged tracer was expressed as a percentage of total activity in plasma and used for the calculation of the arterial input function corrected for metabolites.
PET measurements and data analysis
The PET studies were performed on the ECAT EXACT HR+ positron tomograph (Siemens-CTI, Knoxville, TN U.S.A.) which is capable of acquiring 63 continuous slices simultaneously (Bendriem et al., 1996: Brix et al., 1997). The resolution in the two-dimensional mode measured at 1 cm from center is 4.5 mm in the transverse direction and 4.1 mm in the axial direction. For each animal, a magnetic resonance imaging (MRI) examination was performed on a 1.5-T unit (SIGNA, General Electric). To obtain a set of MR images superposable on the PET images, contiguous axial T1-weighted slices were performed.
Forty-four sequential PET scans were acquired, with the image acquisition durations varying from 2 to 10 minutes. For data analysis, regions of interest, selected on MRI slices, were drawn on selected PET images to involve the putamen, caudate, thalamus, cerebellum, and the occipital, temporal, and frontal cortices. Concentrations of radioactivity in the different regions of interest were calculated for each sequential PET scan and plotted versus time. Radioactivity was measured in the selected cerebral structures after correction for 76Br decay and expressed as picomoles per milliliter after normalization using the specific radioactivity measured at the time of injection.
Correction of partial volume effects for small structures such as putamen, caudate, and thalamus was performed from a phantom study. No correction was made in the other extrastriatal regions. The phantom consisted of several spheres of various volumes located inside a 20-cm cylinder. A dual-isotope experiment, with a homogeneous activity concentration of 76Br in the sphere and 18F in the cylinder was conducted. The analysis of data after a dynamic scan provided two factors, one for the quantitation loss in the sphere, one for the spillover from the cylinder to the sphere. The method is described in Bendriem et al. (1991). To apply a partial volume correction on baboon brain structure, the correction coefficients obtained from the sphere with the volume approximately equal to that of the structure were used. Although this method does not take into account the structure shape, it provides some significant corrections of the data.
RESULTS
Time-concentration curves
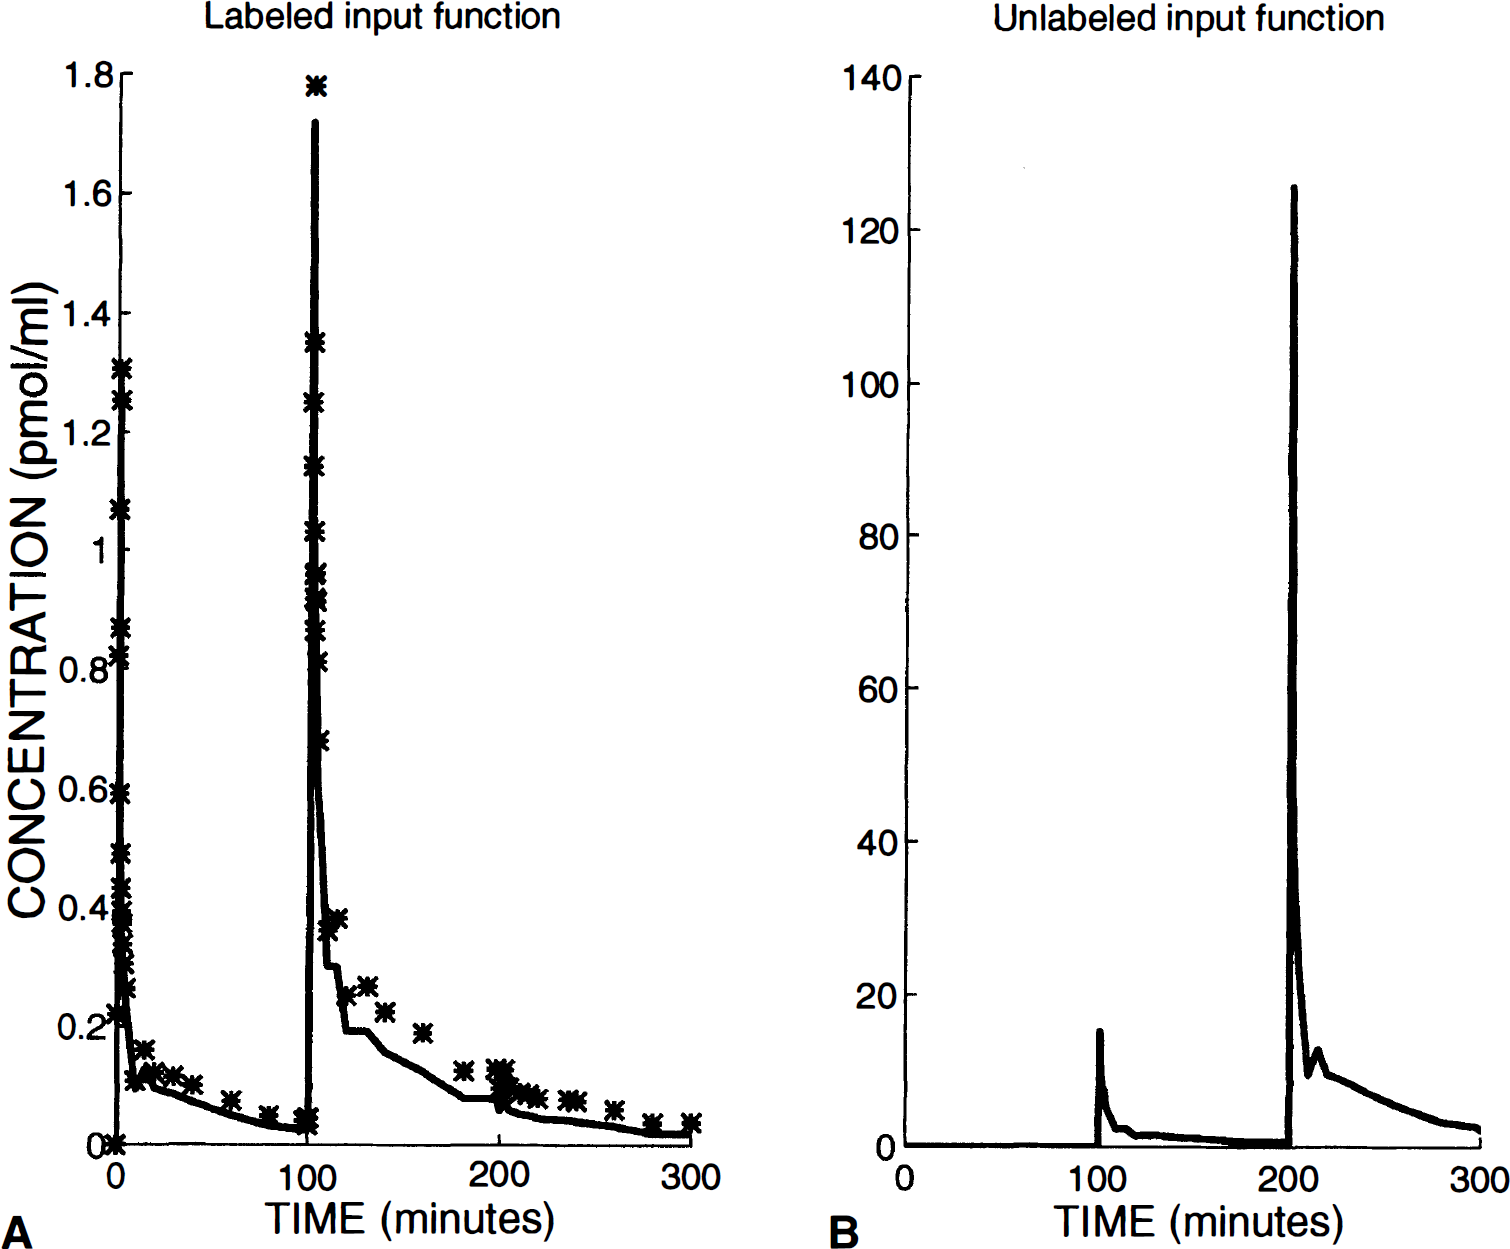
The input functions of experiment 5 (see timing and injected doses in Table 1) are shown in Fig. 2. The stars of Fig. 2A represent the experimental measures of the labeled ligand concentration in plasma, which are corrected for the metabolites to obtain C*a(t), the labeled input function (the solid line in Fig. 2A). [76Br]FLB 457 showed a high in vivo stability in plasma of P. anubis with, for example, still 72% of the compound unchanged 98 minutes after the first tracer application. Figure 2B shows the unlabeled input function (Ca(t), see Fig. 1), resulting from the unlabeled FLB 457 doses injected during the coinjection (at 100 minutes) and the cold FLB 457 injection (at 200 minutes).
Examples of labeled (
Figure 3 shows typical time-concentration curves observed with the multi-injection protocol in striatal (putamen) and extrastriatal (thalamus and cerebellum) regions. These curves were obtained during the same experiment (experiment 5, see exact doses in Table 1). After the first injection of [76Br]FLB 457 with high specific activity, the radioligand concentration in the striatum increased very slowly and reached a plateau about 80 minutes after the injection (circles in Fig. 3). A longer kinetic curve, acquired during a 5-hour experiment and previously published by Loc'h et al. (1996), showed that the plateau (or a very slow increase) lasted for a very long period. In contrast, the cerebellum time-concentration curve reached a maximum within the first minutes after the injection and then decreased slowly (plus symbols in Fig. 3). The thalamus time-concentration curve showed an intermediate shape, with a slow increase, a maximum reached about 40 minutes after the injection, followed by a slow decrease (stars in Fig. 3). At 100 minutes, the concentrations in the thalamus and cerebellum were 5 and 30 times smaller than in the striatum, respectively.
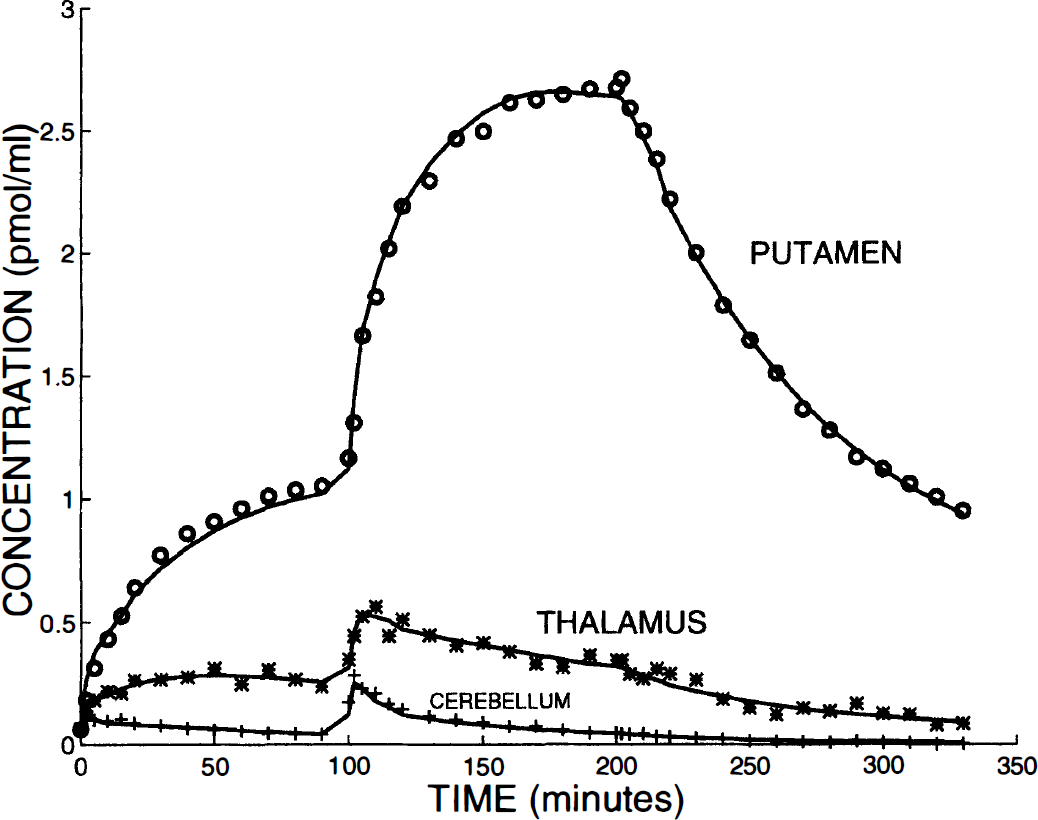
Examples of PET curves obtained in baboon using a multi-injection protocol. This figure shows the experimental data obtained in experiment 5 (see timing and injected doses in Table 1) in putamen (circles), thalamus (stars), and cerebellum (plus symbols). The solid lines are the simulated curves obtained from the estimated model parameters.
After the coinjection of labeled and unlabeled FLB 457 at 100 minutes, the shape of the striatal curve was very similar to that obtained after the initial tracer injection, but more rapidly reached the plateau (about 50 minutes after the coinjection). In the cerebellum, the coinjection produced a fast peak in the time-concentration curve, whereas the shape of the thalamus curve looked like the cerebellum curve observed after the initial tracer injection.
The injection of a large amount of unlabeled ligand, 200 minutes after the beginning of the experiment, resulted in complete saturation of the receptor sites. This led to a slow decrease in the striatum concentration, which can be explained by a slow dissociation of the labeled bound ligand. This displacement is far from being complete at the end of the experiment (2 hours after the displacement injection). In spite of the experimental uncertainties, a small displacement can be observed in the extrastriatal regions. The ratios of the striatum concentration to the thalamus and cerebellum concentrations increased during the experiment: 8 and 50 at 200 minutes, respectively, and 10 and 100 at the end of the experiment (320 minutes).
Model parameter estimates
The complete ligand-receptor model included seven parameters to be identified. Despite the use of a multi-injection protocol, and because of both the slow kinetics of FLB 457 (the maximum and the decreasing part of the PET curves cannot be observed in striatal regions after a tracer injection) and/or the significant variability observed in brain curves (mainly in extrastriatal regions), the estimations of all parameters were very difficult, with this large number of parameters resulting in too large standard errors. To avoid these difficulties, we have used the usual approach, which consists of including the minimum number of model parameters, and in particular, introducing only the necessary compartments.
Striatal regions. In the striatal regions (putamen and caudate), the quality of the fit obtained using the model without the nonspecific compartment (thus including only three compartments and five parameters) were satisfactory, as seen in the example given in Fig. 3 (circles and solid line). The first two columns of Table 2 give the parameter estimates in the putamen and caudate regions. In both regions, the receptor concentration is estimated to be 44 ± 12 pmol/mL and kdVR is 0.40 ± 0.12 nM.
Mean and standard deviations of the model parameters identified in seven regions of interest
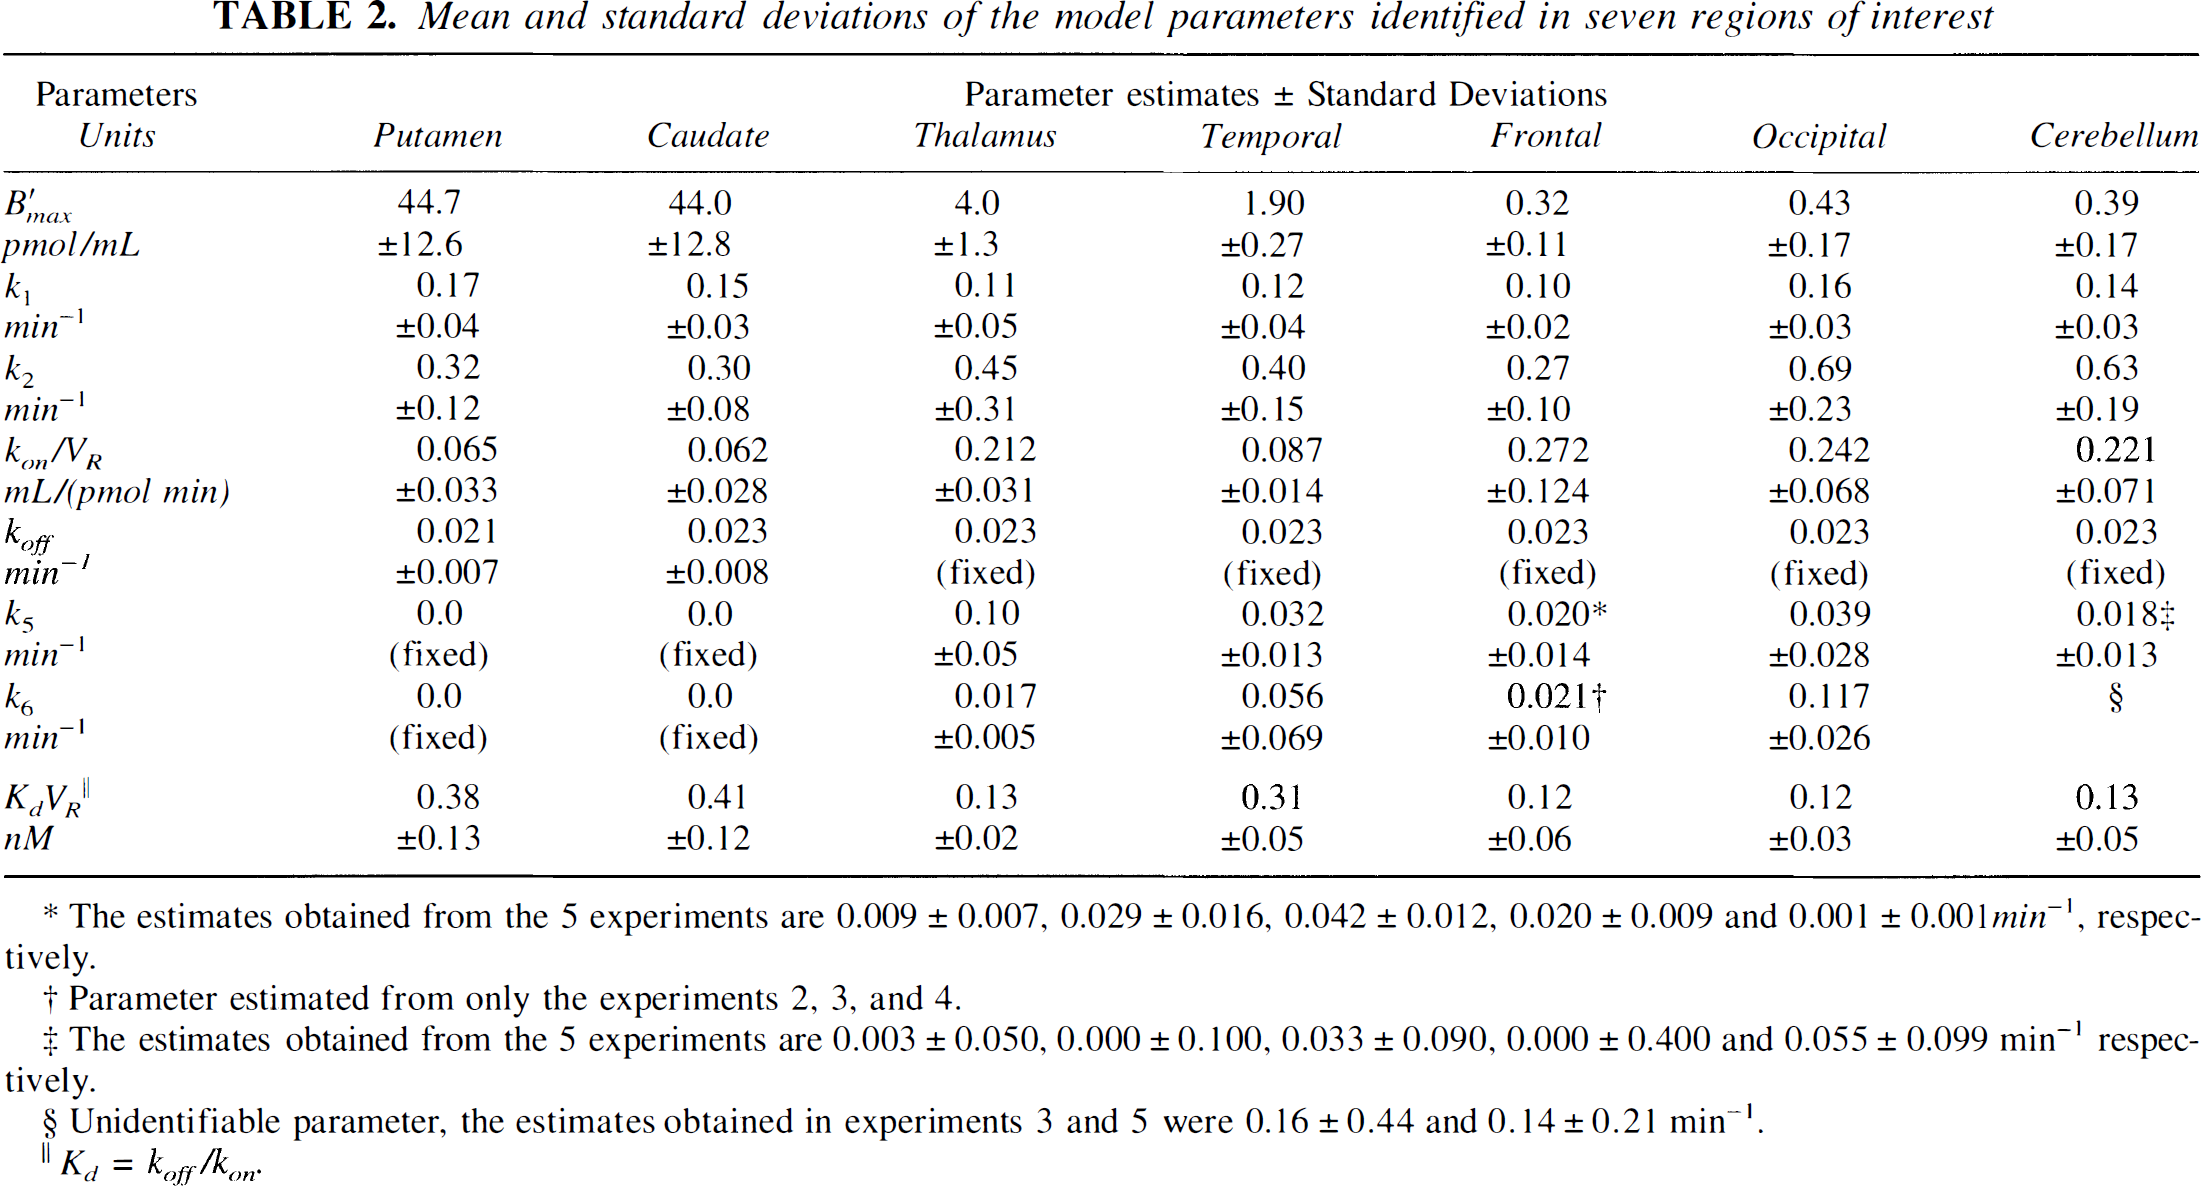
The estimates obtained from the 5 experiments are 0.009 ± 0.007, 0.029 ± 0.016, 0.042 ± 0.012, 0.020 ± 0.009 and 0.001 ± 0.001min−1, respectively.
Parameter estimated from only the experiments 2, 3, and 4.
The estimates obtained from the 5 experiments are 0.003 ± 0.050, 0.000 ± 0.100, 0.033 ± 0.090, 0.000 ± 0.400 and 0.055 ± 0.099 min−1 respectively.
Unidentifiable parameter, the estimates obtained in experiments 3 and 5 were 0.16 ± 0.44 and 0.14 ± 0.21 min−1.
kd = koff/kon.
We have tested the complete model including seven parameters, but the quality of the fit was not significantly improved (the residual distance was reduced with a percentage ranged from 0.05% to 2%). For example, the residual weighted distance between the experimental data and the simulated values was decreased only 0.1% for the putamen curve shown in Fig. 3. Moreover, the parameters k5 were found to be very small, and thus the nonspecific binding in the striatal regions represented a negligible percentage of the PET concentration. The use of the Akaike criterion and the F test showed clearly that the two nonspecific binding parameters were not statistically justified and, thus, that the nonspecific binding can be neglected in the striatal regions.
Extrastriatal regions. In the extrastriatal regions, the concentrations of receptor sites are small and thus the binding parameters should be more difficult to estimate. In a first attempt, and to reduce the number of parameters, we have tested the model structure with only two tissue compartments: the free ligand compartment and either the specific binding compartment or the nonspecific binding one. Because in these regions the amplitude of the displacements was small, the parameter koff was difficult to estimate. Thus, this parameter was set to 0.023 min−1, which is the parameter value estimated in the striatal regions.
We have first tested the model with only nonspecific binding (thus without specific binding). For all curves (25 curves, obtained in the five extrastriatal regions during the five experiments), the results of the fit were not acceptable because of the impossibility of simulating the respective levels of the PET concentrations before and after the coinjection (see the dashed lines in Fig. 4A and B). As a matter of fact, the PET concentrations were not proportional to the injected labeled doses, the level after the coinjection being proportionally from 30% to 50% smaller. This experimental observation proved the presence of a saturable phenomenon in the model structure and, thus, supported the presence of a small concentration of receptor sites (the smaller uptake after the coinjection being the consequence of the significant occupancy of these receptor sites by the large amount of coinjected unlabeled ligand).
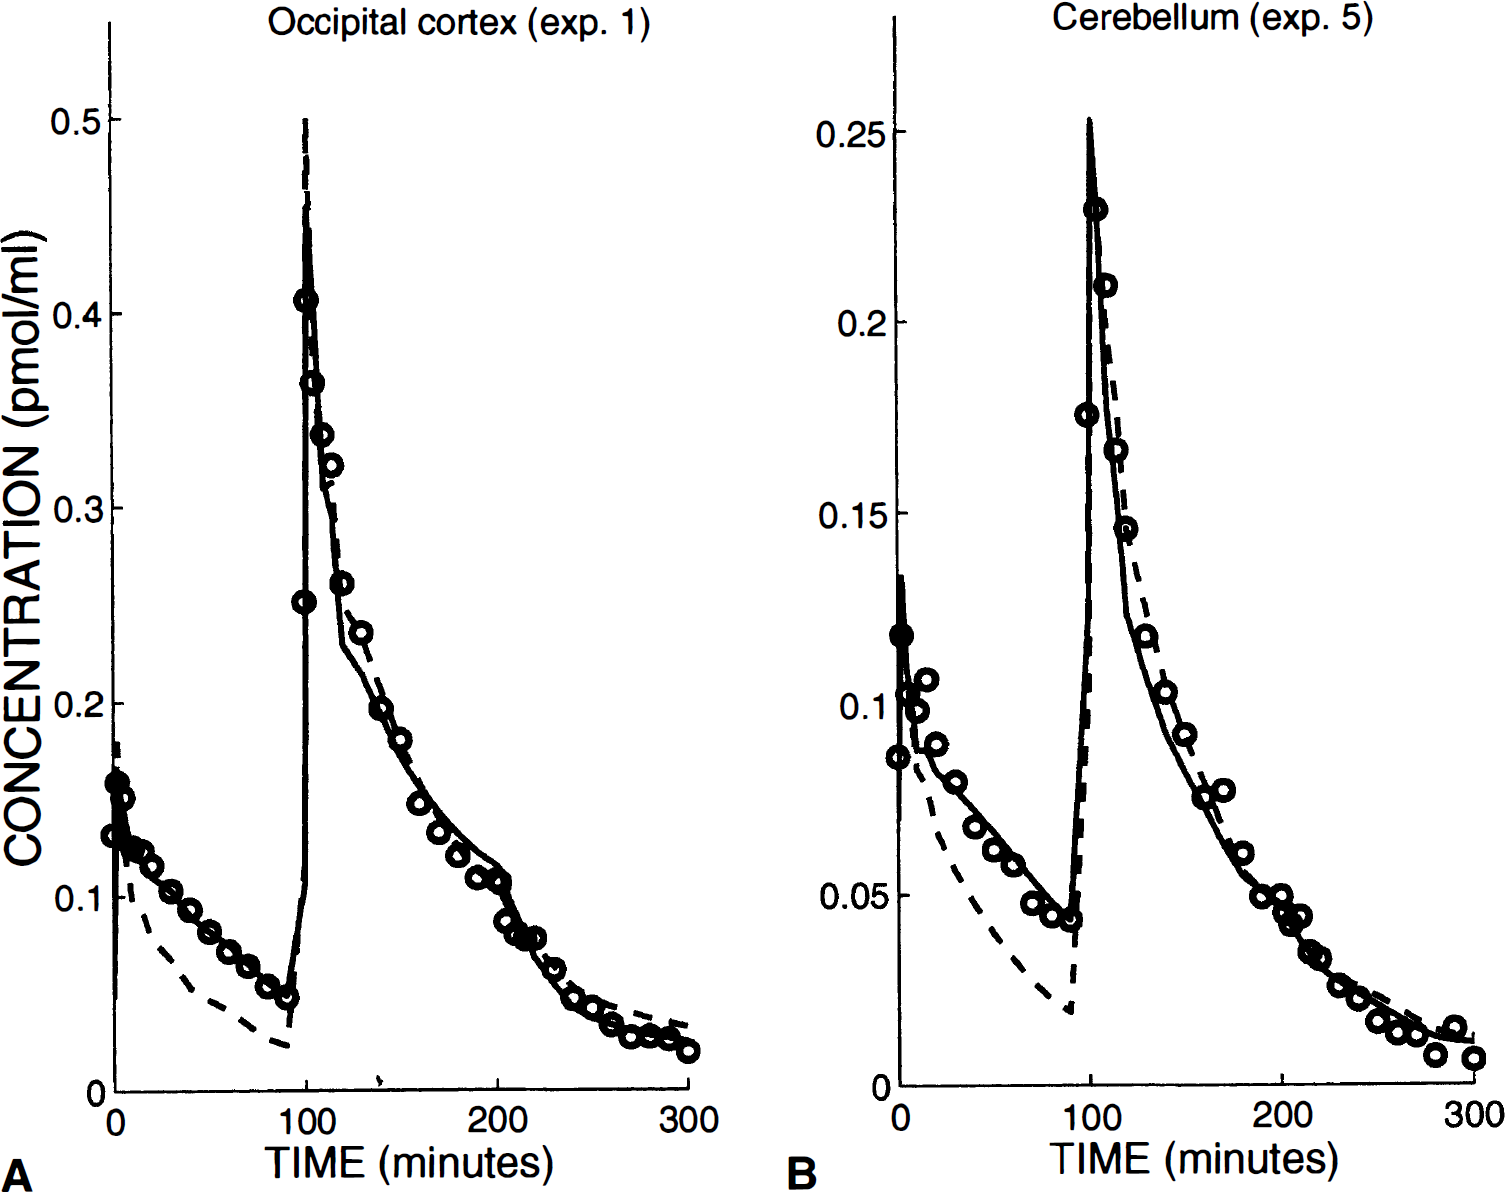
Examples of fits obtained with a three-compartment model from occipital cortex (
Indeed, when only a specific binding is taken into consideration, the fit seemed acceptable (see solid line in Fig. 4A). The residual distances between experimental data and model simulations were significantly decreased, since the ratios of the distances obtained using the two model structures ranged from 2 to 5 (3.2 in the example shown in Fig. 4A). Therefore, the specific binding model is significantly better, whatever the statistical tests used, because the number of parameters was the same in the two model structures.
However, in a large number of curves, a bias is observed at the time of displacement: the simulated concentrations were a little larger than the experimental data before the displacement time, whereas they were a little smaller after (see solid line, Fig. 4A). This too large amplitude of the displacement indicated that the specific binding was overestimated at the displacement time. This was an argument in favor of a small nonspecific binding (which was not displaceable, and thus reduced the displaceable part of the PET concentration). Therefore, we have tested the complete model including both specific and nonspecific binding. Compared with the results obtained with the specific binding model, the residual distances between experimental data and model simulations were significantly decreased, from 20% to 50% in most of the experiments. In these cases, the F test proved the statistical significance of the nonspecific binding parameters (for the example shown in Fig. 4A, the residual distance is reduced 29% and the calculated F value is 5.2 whereas the F0.05(2,36) value deduced from the usual table is 3.3). However, in some cases (for example, the frontal curves obtained in experiments 1 and 5, see Table 2), the decrease of the residual distance was negligible and the parameters k5 and k6 were not identifiable.
The means and the standard deviations of the parameters, estimated from the five experiments in the temporal, frontal, and occipital cortices, are given in Table 2 (columns 4 through 6). The receptor densities in these three regions were estimated to be 1.90 ± 0.27, 0.32 ± 0.11, and 0.43 ± 0.17 pmol/mL, respectively, which represents only from 1% to 5% striatal density. The order of magnitude of the nonspecific binding parameters was estimated (k5 ranged from 0.02 to 0.04 min−1 and k6 from 0.02 to 0.12 min−1), but the standard deviations of these parameters were very large (from 40% to 125%).
Thalamus is known to be a region with a significant FLB 457 uptake (Halldin et al., 1995; Loc'h et al., 1996), but mainly because of the small size of this region, the data are often noisy (see Fig. 3). Table 3 shows the detailed results (parameter estimates and standard errors calculated using the covariance matrix) obtained in the thalamus from the time-concentration curves acquired during the five experiments. The last column gives the average parameter values and the usual standard deviations calculated for the five experiment results. These standard deviations have the same order of magnitude as the standard errors deduced from the covariance matrix, the relative values ranging from 10% to 50%. The receptor concentration is estimated to be 4.0 ± 1.3 pmol/mL, which represents about 10% of the striatal density.
Individual model parameters identified in the thalamus during the five experiments
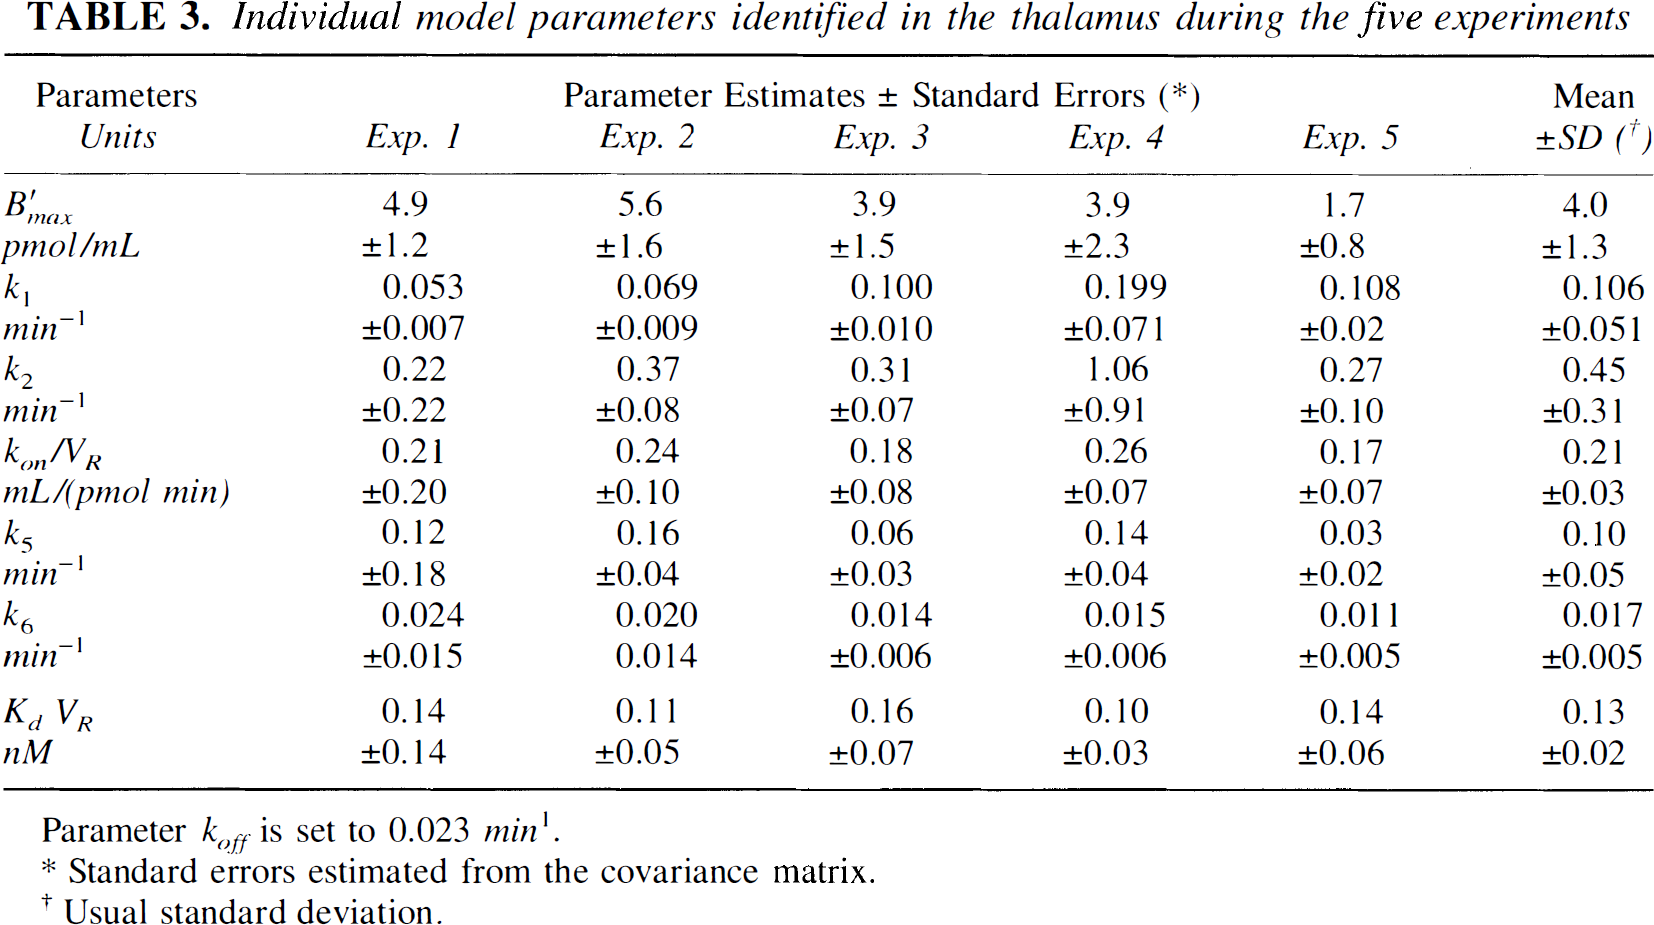
Parameter koff is set to 0.023 min1.
Standard errors estimated from the covariance matrix.
Usual standard deviation.
Cerebellum. The cerebellum is a region usually assumed to be devoid of D2 receptor sites. However, similarly to what was observed in the previous receptor-poor regions, the use of a model without specific binding led to unacceptable fits (see Fig. 4B, dashed line). Indeed, the ratio of the FLB 457 uptake level to the injected dose appeared smaller after the coinjection than after the initial tracer injection, and this phenomenon can be explained and simulated only by using a saturable reaction.
For example, in Fig. 4B, the PET concentration measured 30 minutes after the tracer injection 0.24 nmol of [76Br] FLB 457) was equal to 0.078 pmol/mL, which corresponds to 0.063 pmol/mL per nmol of injected [76Br] FLB 457. After the coinjection, it was necessary to take into account in the PET measure the concentration that resulted from the initial tracer injection: 30 minutes after the coinjection, this concentration can be estimated as approximately 0.035 ± 0.005 pmol/mL (by extrapolating the PET curve observed before the coinjection). Therefore, the labeled ligand concentration resulting only from the second injection (including 2.6 nmol of [76Br] FLB 457) and measured 30 minutes after this injection was estimated as 0.117 pmol/mL, that is to say approximately 0.031 pmol/mL per nmol of injected [76Br] FLB 457, about half of the similar value observed after the tracer injection.
This significant difference was observed in all cerebellum curves, which supported the presence of a significant saturable phenomenon and, thus, in the ligand-receptor interaction framework, the presence of a small but not negligible concentration of receptor sites. This density is estimated to be 0.39 ± 0.17 pmol/mL, approximately 1% of the striatal density only.
Detailed simulations of the FLB 457 kinetics
One of the interesting features of the multi-injection modeling approach (which leads to the identification of all the parameter values), is the possibility of simulating the time-concentration curves in all compartments. Because the FLB 457 kinetics were very different in the various interest regions, we have performed simulations of a multi-injection protocol in three typical regions: the putamen (Fig. 5A), the thalamus (Fig. 5B), and the cerebellum (Fig. 5C). These figures show the simulations of the free (plus symbols), the specifically bound (circles), and the nonspecifically bound (dotted line) labeled ligand concentrations, calculated using the experimental protocol and the input function of experiment 5 (see Table 1 and Fig. 2) and using the model parameters given in Table 2, The concentration measured by PET (shown in Fig. 5 by solid lines) was the sum of labeled FLB 457 concentrations in the three tissue compartments and of a fraction Fv (assumed to be equal to 3 %) of the blood labeled ligand concentration (not shown in Fig. 5).
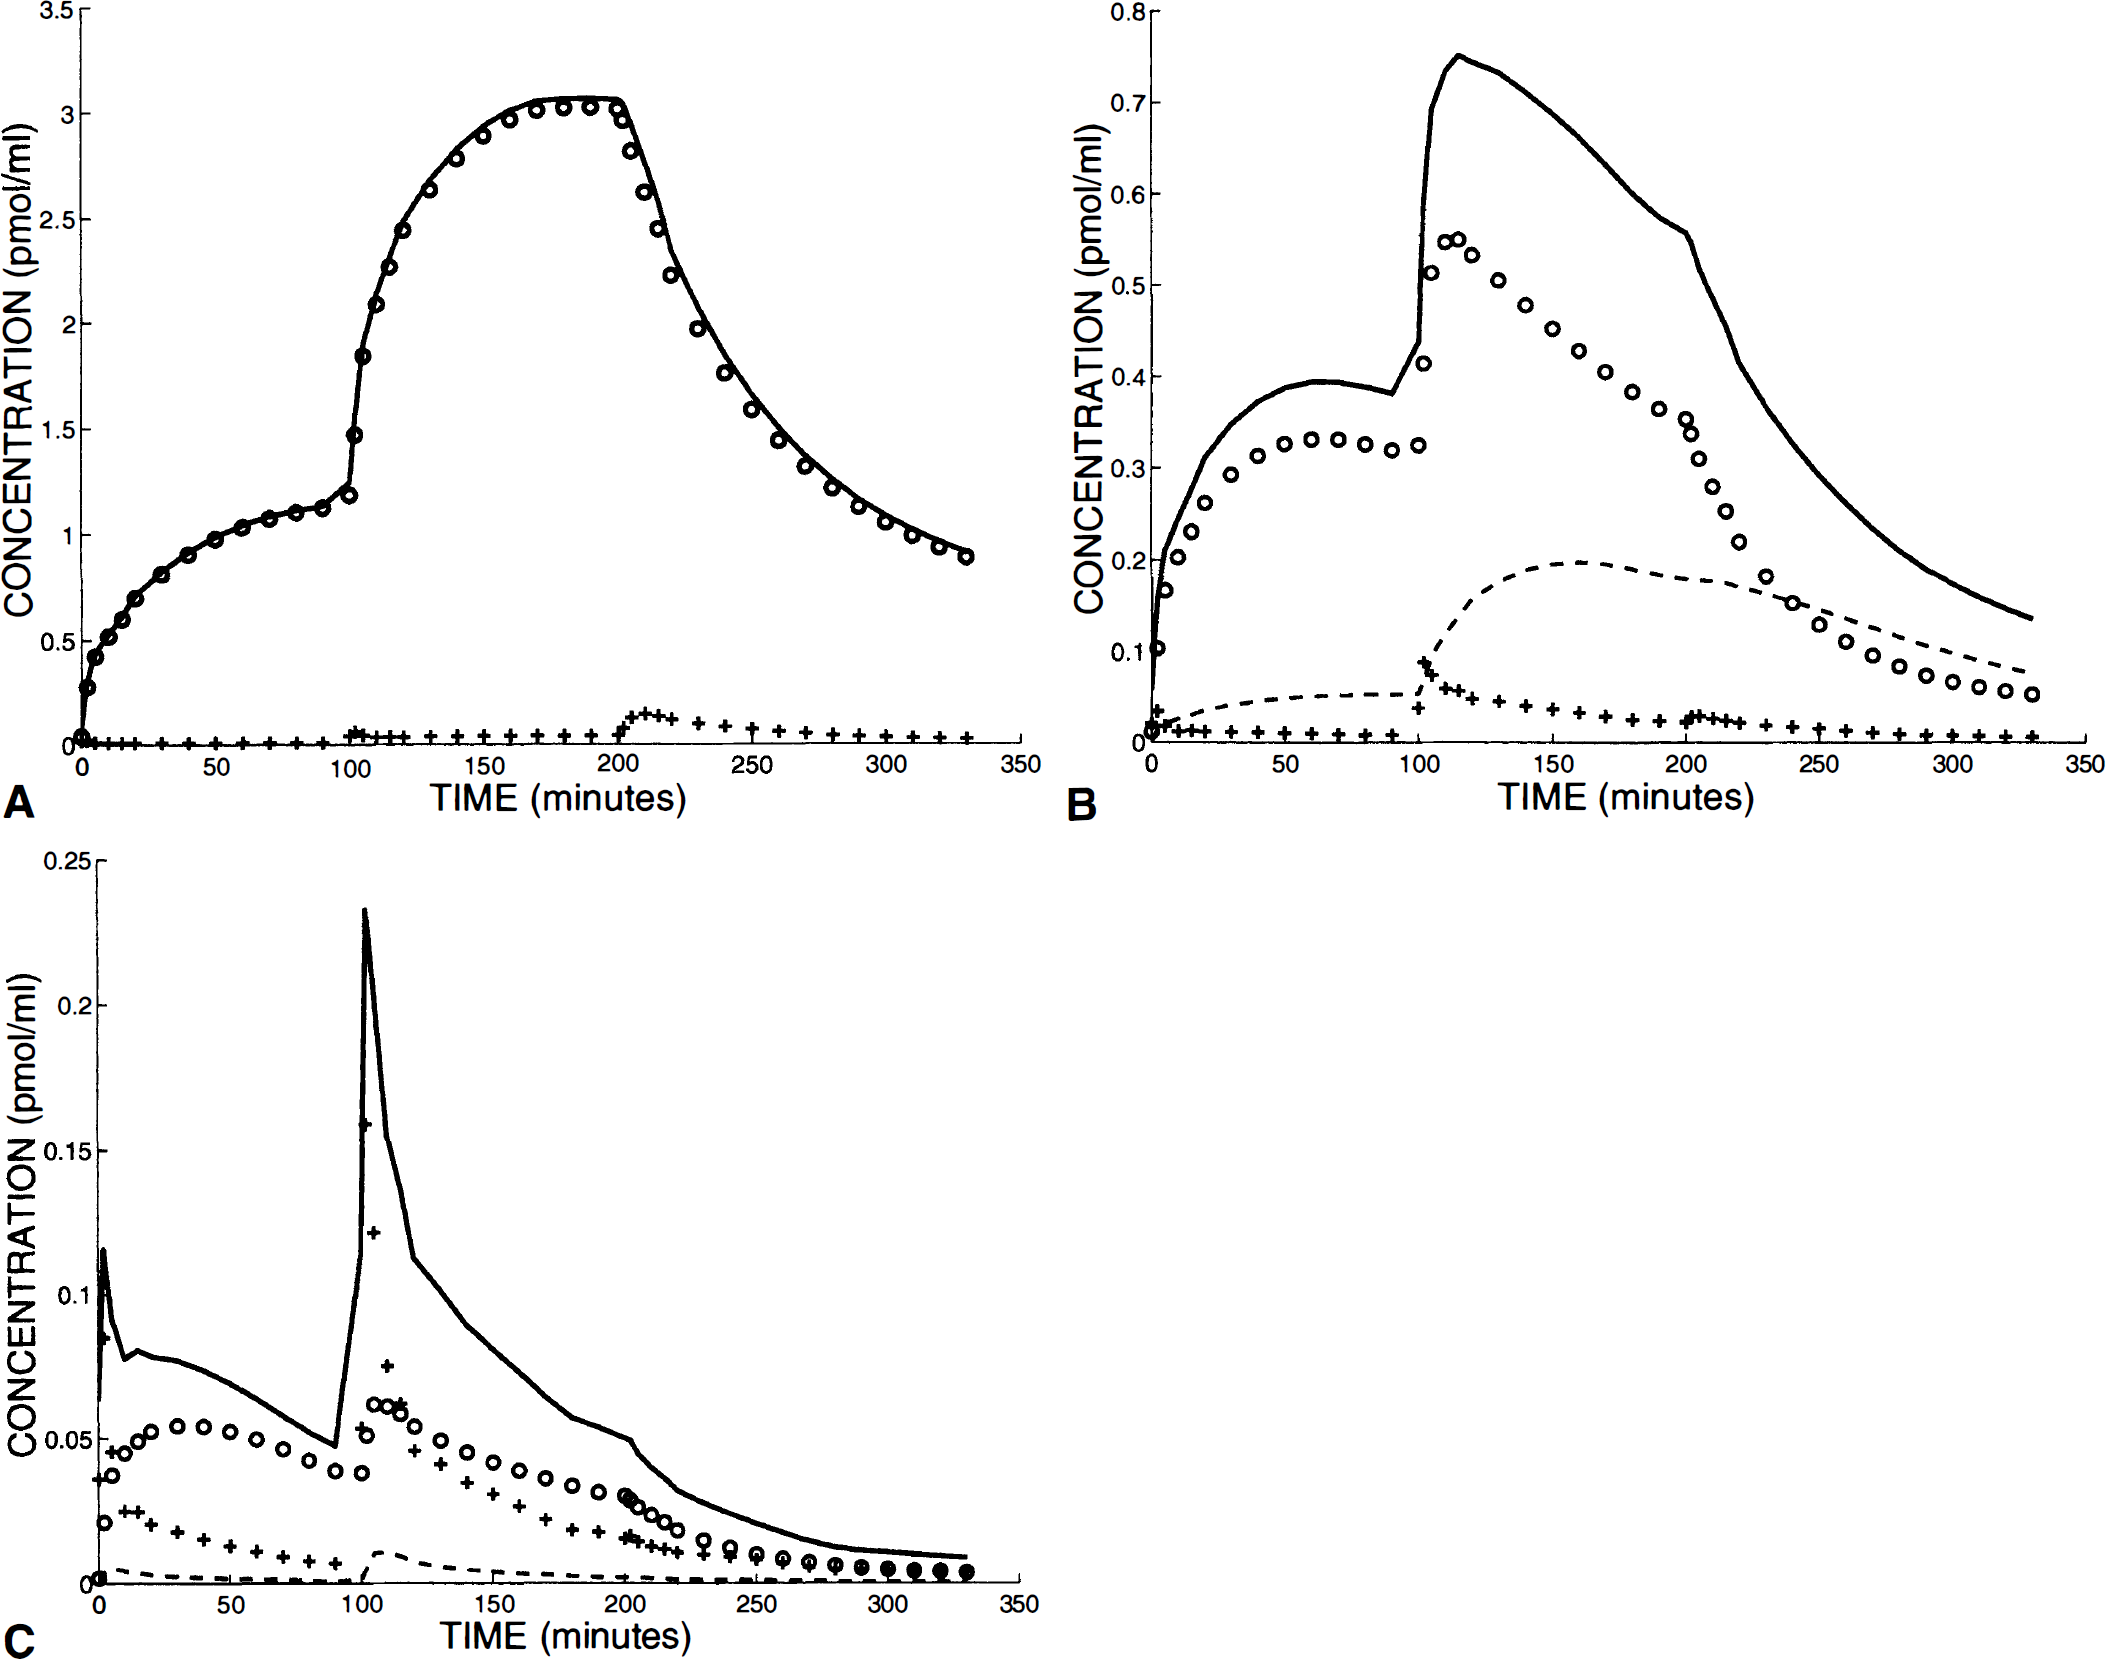
Examples of simulations of the FLB 457 kinetics during a multi-injection experiment. The regions of interest are the putamen (
In the putamen (Fig. 5A), most of the radioactivity measured by PET corresponded to labeled ligand bound to the receptor sites. Ten minutes after the initial tracer injection, the free ligand concentration was only 2% of the bound ligand concentration and was less than 1% after 50 minutes. The coinjection resulted in an increase of this percentage, which however remained less than 2%. Even after the displacement injection, the free ligand concentration represented only from 5% (10 min) to 3% (50 min) of the PET-measured concentration.
The simulations in the thalamus (Fig. 5B) were interesting, as this is the region that includes the largest nonspecific binding. After the tracer injection, the concentration of the nonspecifically bound labeled ligand represented 10% of the PET-measured concentration at 20 minutes and 14% at 100 minutes. This percentage was increased after the coinjection (28% and 34% at 150 and 200 minutes, respectively) and after the displacement injection (56% at the end of the experiment). The bound ligand concentration was preponderant during the experiment, except after the displacement injection (only 38% of the PET-measured concentration at the end of the experiment). The free ligand concentration remained low and often negligible during the entire experiment.
For the simulations in the cerebellum (Fig. 5C), the difficulty was the large uncertainties about the nonspecific binding amplitude because the corresponding parameters were estimated with large uncertainties (see Table 2). The simulations were performed with parameter k5 set at 0.018 min−1 (the mean value obtained in the five experiments) and parameter k6 set at 0.15 min−1 (which is the mean of the parameter estimates from experiments 3 and 5, see Table 2, comment 4). Each of the two labeled FLB 457 injections caused a temporary increase of the free ligand concentration, which was preponderant during a short period (approximately 5 minutes after the tracer injection and 15 minutes after the coinjection). However, in spite of the very low receptor site concentration (l % of the striatal concentration), the simulation showed that most of the labeled FLB 457 was bound to receptor sites after the initial tracer injection. The bound ligand concentration represented 70% and 78% of the PET-measured concentrations, 40 and 90 minutes after this injection, respectively. Fifteen minutes after the coinjection and after the displacement injection, the bound ligand concentration remained higher than the free ligand concentration, but with approximately the same order of magnitude.
Simulations of blood flow and receptor concentration variations
Solid lines in Fig. 6 show the PET time-concentration curves simulated during a long period (320 minutes) after a tracer injection (1.24 nmol of [76Br]FLB 457) in the putamen, the thalamus, and the cerebellum. This figure includes also the PET curves in the putamen and in the thalamus simulated with the same model parameters, except for one parameter, the receptor concentration (dashed lines) or the parameter k1 (bold dotted line), which were reduced by 20%.
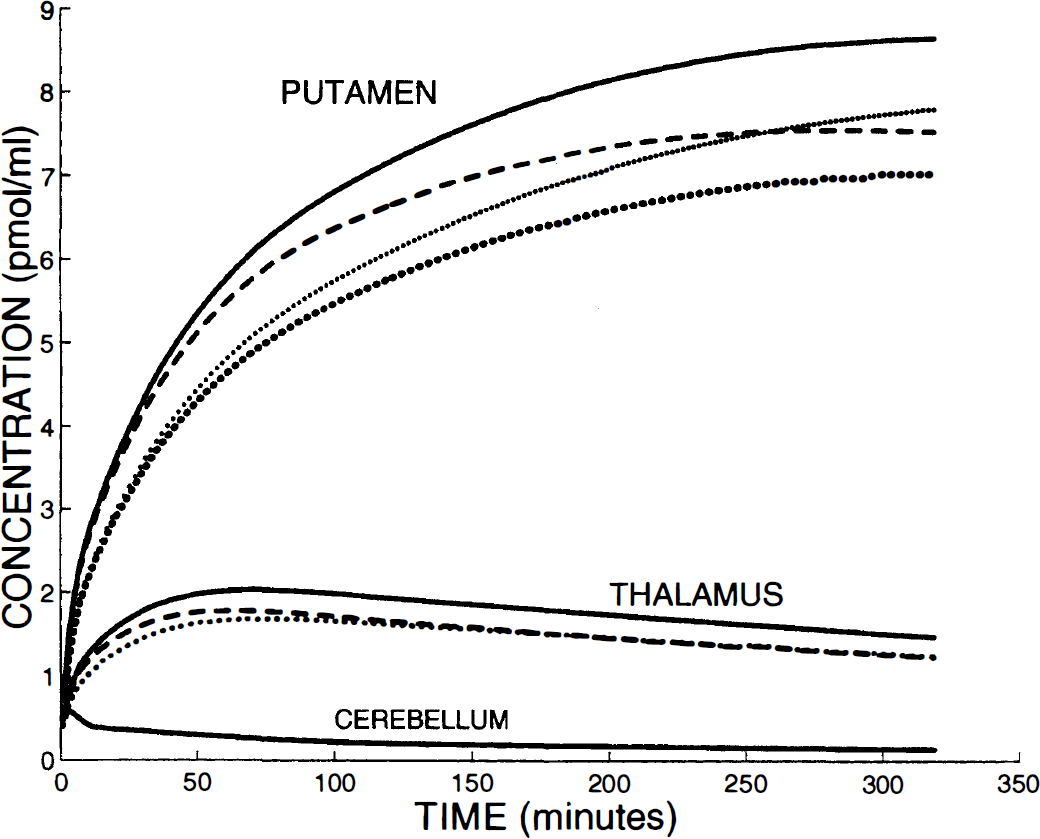
Simulations of the blood flow and receptor concentration variations. Solid lines show the PET time-concentration curves simulated during a long period (320 minutes) after a tracer injection (1.24 nmol) in the putamen, the thalamus, and the cerebellum. The dashed lines and bold dotted lines are the simulations obtained with the same model parameters, except for one parameter, the receptor concentration and parameter k1, respectively, which were reduced 20% (not shown for the cerebellum). For the putamen, the thin dotted line is the simulated PET curve obtained with a simultaneous k1 and k2 reduction of 20%. This figure demonstrates that the PET concentration is mainly flow dependent during the first 2 hours for the putamen and during the first 30 minutes for the thalamus.
The variation of parameter k1 is assumed to reflect a blood flow variation. However, some authors assumed that parameter k2 is also a function of the blood flow and, thus, that the ratio k1/k2 is a constant (the distribution volume) independent of the blood flow. This property has been observed with flumazenil, for example (Delforge et al., 1995). Therefore, we have also simulated a 20% decrease of the blood flow by reducing both parameters k1 and k2 of this percentage (shown in Fig. 6 only for the putamen by a thin dotted line).
In all regions (including the cerebellum, not shown in Fig. 6), the 20% decrease of parameter k1 alone led to PET concentrations reduced by approximately the same percentage. Compared with the latter, the simulated PET curves obtained with simultaneous reduction of k1 and k2 are larger, however, remaining very similar during the first hours (only shown for putamen in Fig. 6).
In contrast, during the first hours, the decrease of the PET-measured concentration in the putamen, resulting from the B'max variation, is smaller: only 3% and 4.7% at 20 and 60 minutes after the injection, respectively. This percentage reached 10% after 3 hours and only 13% at the end of the simulation (320 minutes). This result shows that the striatal PET curve is more sensitive to the blood flow variation than to the receptor density variation.
In the thalamus and the cerebellum, the results were similar but with reduced times. For example, 30 minutes after the injection, the PET concentrations in these two regions were 1.8 and 1.2 times, respectively, more sensitive to the blood flow variation than to the receptor concentration variation. The equilibrium state (20% variation of k1 and B'max led to a 20% variation in PET curves) is reached approximately 2 hours and 40 minutes after the tracer injection, respectively.
Studies of the equilibrium states
Using the long duration simulations shown in Fig. 6, we have studied the two most important equilibrium states: first, the capillary exchange equilibrium state (equilibrium between the plasma and the free ligand compartments), and second, the Scatchard equilibrium state (equilibrium between the free and the bound ligand compartments).
Because the transfers between the plasma and the free ligand compartments are linear, the equilibrium state between these two compartments is reached when the ratio of the two concentrations is a constant, equal to the ratio between the transfer rate constants (k1/k2). In Fig. 7, the ratio M*f(t)/C*a(t) (multiplied by 100) in the putamen is represented by the dash-dot line. It shows that the capillary exchange equilibrium state was not yet reached at the end of the simulation (320 minutes after the injection). In the thalamus and cerebellum, this first equilibrium state was reached approximately 1 hour and 15 minutes after the injection, respectively.
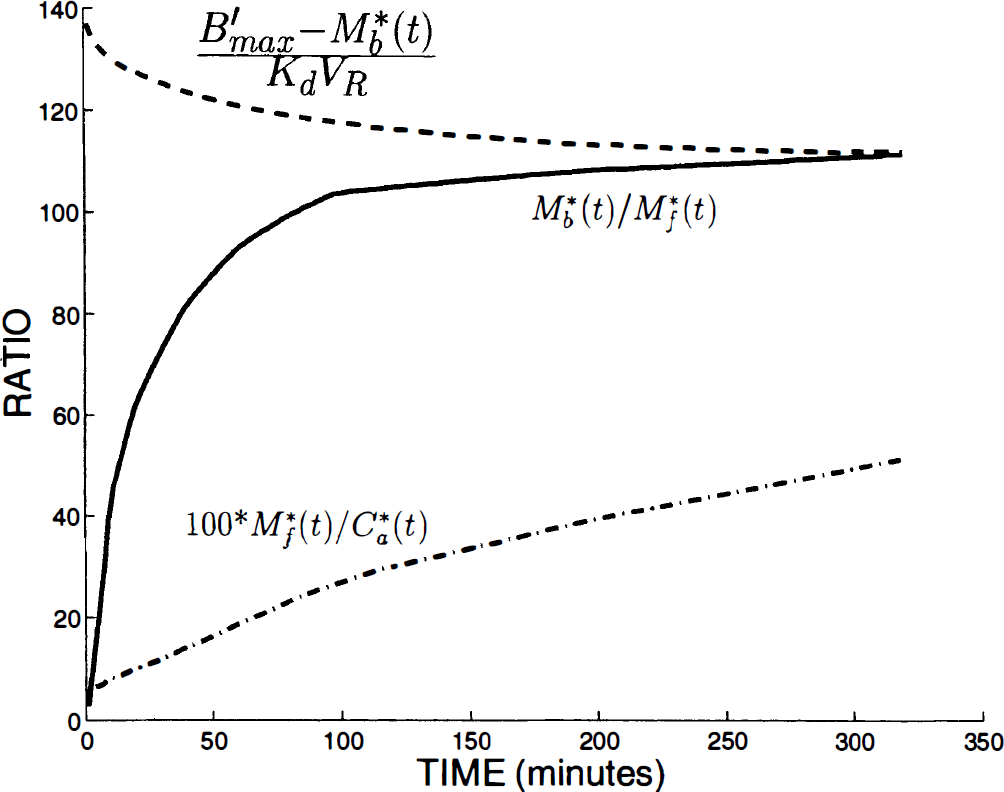
Study of the equilibrium states in the putamen. The dash-dot line represents the ratio M*f(t)/C*a(t) times 100. The continuous increase of this curve shows that the equilibrium state between the plasma and the free ligand compartments is not reached in spite of the long experiment duration. The solid line and the dashed line correspond to the two parts of the Scatchard equation (M*b/M*f and (kon/VR)(B'max – M*b)/koff), respectively) estimated from the known parameters (kon/VR, B'max, and koff) and the corresponding simulations (M*b(t) and M*f(t). The equilibrium state between the free and the bound ligand compartments is valid when these two curves are close. This figure shows that this Scatchard equilibrium state is reached only several hours after a tracer injection.
Figure 7 shows the Scatchard equilibrium state in the putamen by plotting the two parts of the Scatchard equation (M*b/M*f and (kon/VR)(B'max – M*b)koff), respectively) estimated from the known parameters (kon/VR, B'max and koff) and the corresponding simulations (M*b(t) and M*f(t)). The Scatchard equilibrium state is reached if these two parts of the Scatchard equation are approximately equal.
The right part of the Scatchard equation ((B'max – M*b)/kd VR) was a function of the unoccupied receptor site concentrations (B'max – M*b(t), and thus it was first decreasing because M*b(t) was first increasing (see the putamen example, dashed line in Fig. 7). After the time corresponding to the maximum value of M*b(t) concentrations (which is close to the maximum PET concentration time), the right part of the Scatchard equation was slowly increasing in the thalamus and the cerebellum (not showed), whereas this ratio remained slowly decreasing in the striatum because the PET curve was still increasing. Figure 7 demonstrates that in the putamen, the Scatchard equilibrium state was reached only 5 hours after a tracer injection. Similar to the capillary exchange equilibrium, this time is smaller in the thalamus and in the cerebellum (approximately 2 hours and 40 minutes, respectively).
DISCUSSION
The experimental protocol
The aim of the multi-injection modeling approach is to estimate all the model parameters from a single experiment. A three-injection protocol (tracer injection, followed by a cold injection and by a coinjection) had previously been successfully used for examples with MQNB and flumazenil, which are two molecules with high dissociation rate constants (0.34 min−1 in dog heart and 0.5 min−1 in baboon brain, respectively, see Delforge et al., 1990, 1995). This high level of koff allowed us to observe fast displacements. Another consequence was that the unlabeled ligand injected for the displacement experiment (second injection) was rapidly dissociated from the receptor sites, and thus we had to inject a new cold ligand dose during the third injection to reduce again the number of free receptor sites.
The situation is very different in the FLB 457 case. The ligand kinetics are slower and the parameter koff is about 20 times smaller than the flumazenil dissociation rate constant. Thus, after an injection of a large amount of FLB 457 leading to a significant displacement, the ligand remains bound to receptor sites during a long period because of this very small dissociation rate constant. Since we wanted to study the brain uptake in a partial saturation condition, it was necessary to invert the order of the last two injections. Therefore, we used a protocol including a tracer injection, followed by a coinjection and then by the displacement injection, with doses such that only a few percent, from 50% to 70%, and approximately 95% of the receptor sites are occupied, respectively.
Another difficulty is that the regions of interest under study have very different receptor site concentrations. If the unlabeled dose of the coinjection is chosen such that approximately 60% of the receptor sites are occupied in the striatum, this dose leads to a complete saturation of the receptor sites in the extrastriatal regions. Consequently, it is impossible to choose injected ligand doses that are optimized for all regions. The main interest in using FLB 457 is the possibility of estimating the receptor site concentration in the extrastriatal regions, but in this study, it was also necessary to validate the method by comparing the results obtained in striatal regions with those obtained by previously published methods. Therefore, we have chosen mean doses that still allow estimations in all brain regions. For example, with the doses used in experiment 5 (Table I) and in the simulation studies (Fig. 5), the percentage of occupied receptor sites in the striatum was less than 3% after the tracer injection, it slowly increased from 3% to 40% after the coinjection, and rapidly reached 95% after the displacement injection. In the thalamus, the percentage of receptor sites occupied after the tracer injection slowly increased from 0 to 8%. After the coinjection, it rapidly increased to 77%, and it was larger than 98% after the displacement. In the cerebellum, the maximum percentages of occupied receptor sites were 9%, 83%, and 99%, respectively. Thus, for future studies on extrastriatal regions only, it will be preferable to reduce the unlabeled FLB 457 doses.
A drawback of this protocol is that after the coinjection, a significant number of the receptor sites are already occupied in the extrastriatal regions, which reduces the amplitude of the displacement resulting from the third injection. Although a small displacement is usually observed (Fig. 3), it is not sufficient to estimate the dissociation rate constant, which explains why this parameter had to be fixed in the receptor-poor regions. It is important to note that the presence of receptor sites in the receptor-poor regions has been pointed out and quantified, not from the displacement experiment (injection 3), but mainly from comparison of the PET curves after the two first injections (Fig. 4 and results).
Another difficulty with FLB 457 is the slow kinetics. In the striatum, the maximum of the PET curve is not reached after the two labeled injections. Consequently, we have no information on the maximum concentration and the decreasing part of the curves (which often gives information about the equilibrium state). This explains why, in spite of the long experiment duration, the parameter standard deviations ranged from 20% to 50% in the striatum. In contrast, the equilibrium state is reached in the extrastriatal regions after each injection, and thus, in spite of the small concentration of receptor sites (which leads to a larger data variability), the relative standard deviations of the model parameters are similar in magnitude to those of the striatal parameters.
The specific binding parameters
The quantity of receptor sites available for in vivo binding, B'max, is very similar in the putamen and the caudate (about 44 ± 13 pmol/mL). This value is very close to the values previously obtained in baboon with bromolisuride using an equilibrium approach, 30 to 40 pmol/mL (Mazière et al., 1990), but smaller than the value obtained with the same molecule using a multi-injection approach, 73 ± II pmol/mL (Delforge et al., 1991). In human, the receptor concentration has been estimated by many groups using raclopride and a Scatchard method (from 28 to 37 pmol/mL [Farde et al., 1989], from 25 to 44 pmol/mL as a function of age [Rinne et al., 1993], 34.5 pmol/mL [Blomqvist et al., 1990]) or with a kinetics approach (from 22 to 38 pmol/mL [Farde et al., 1989], 39.6 ± 2.3 [Blomqvist et al., 1990]). The agreement between our estimates of the D2 striatal receptor concentration with these previously published results supports the validity of our method.
To the best of our knowledge, no in vivo estimate of the D2 receptor density in the extrastriatal regions is available. The presence of receptor sites in thalamus and temporal cortex has been recently pointed out by the decrease of the [11C]raclopride and [11C]FLB 457 binding after a pretreatment with haloperidol (Farde et al., 1997). The observed decrease is larger in the thalamus than in the temporal cortex, which is consistent with our estimates of the D2 receptor concentrations (4.0 and 1.9 pmol/mL, respectively). The receptor densities found in cerebellum and frontal and occipital cortices are very close (from 0.32 to 0.43 pmol/mL) and very small (1 % of the striatal concentration). These results are coherent with the very similar PET curves and with the close in vitro results: from 1.1% to 2.1% of the striatal concentration according to Kessler et al. (1993), and from 0.068% to 0.17% according to Martres et al. (1985).
The comparison between the in vivo and in vitro density estimates shows that the values are different but with a constant ratio. From the in vitro results of Kessler et al. (1993), the ratio between the in vivo and in vitro receptor concentrations is 2.7, both in the putamen and in the caudate, and 4.3, 5.2, and 1.6 in the thalamus and the temporal and frontal cortices, respectively. These differences can be easily explained by the differences in tissue state in the two methods. Moreover, the concentration ratios obtained in the various brain regions have the same order of magnitude in in vivo and in vitro studies. For example, the concentration ratio of putamen versus thalamus is 11 in our PET results and 18 in the in vitro results of Kessler et al. (1993). Similarly, the ratios obtained by comparing the putamen and the frontal cortex are 139 and 92, respectively. All these results are strong arguments on favor of the validity of our in vivo estimates of the receptor density in the extrastriatal regions.
The question of the presence of receptor sites in the cerebellum is very important as this region is usually assumed to be devoid of receptor sites and thus is used as a reference region. Farde et al. (1997) found no effect of haloperidol on the uptake in the cerebellum, and thus deduced that it is an argument that supports the use of cerebellum as a reference region. However, the presence of a saturable phenomenon is proved in our PET data by the influence of the specific radioactivity on the FLB 457 curves. After the coinjection (which corresponds to a low specific radioactivity injection), the shape of the PET curves appeared different, with a more visible initial peak, and the FLB 457 uptakes were significantly smaller than the FLB 457 uptake after the tracer dose (from 30% to 50%, see results). This significant difference is also proved by our unsuccessful attempts to fit the PET curves with a model including a nonspecific binding only (Fig. 4A and B). Moreover, a low but detectable density of D2 receptor sites in the cerebellum has been observed in vitro and has been estimated to be from 1 % (Martes et al., 1985) to 0.1% (Hall et al., 1996) of the putamen density, which corresponds to the same order of magnitude as our in vivo estimate (0.87% of the putamen density, Table 2).
The FLB 457 affinity estimates are very homogeneous for all extrastriatal (KdVR = 0.16 ± 0.07 nmol/L) and striatal regions (KdVR = 0.39 ± 0.02 nmol/L), but with a significant difference (a ratio of 2.4) between the two groups. This smaller KdVR value in the receptor-poor regions has already been observed with other molecules (see the flumazenil example in Delforge et al., 1995). However, the in vitro studies showed that Kd is approximately constant regardless of the regions (Kessler et al., 1993). Therefore, the observed differences in the KdVR values should be explained only by a variation of the reaction volume VR. By using the in vitro Kd value estimated in humans by Kessler et al. (1993), 0.024 nmol/L, the reaction volume VR is estimated in baboons to be approximately 16 mL/mL in the striatum and 7 mL/mL in the extrastriatal regions. A correlation between the reaction volume and the ligand lipophilicity has been pointed out recently (Delforge et al., 1996). In spite of the mixture of human and baboon results, these VR estimates are higher, but within the same order of magnitude, than the value estimated from this correlation by using the FLB 457 lipophilicity (log(P) = 1.89, Loc'h et al., 1996).
The nonspecific binding
In most PET studies, the nonspecific binding is assumed to be lumped in with the free ligand compartment. This hypothesis is justified if the equilibrium between the free and the nonspecific compartments is quickly reached (in this case, the presence of two distinct compartments cannot be observed from the PET data). However, if all nonspecific binding (or a part) has association-dissociation rate constants that are not large enough, an equilibrium state cannot be rapidly reached and thus it may be necessary to introduce a compartment that represents the nonspecific binding concentration (or a part).
In this study, the need of a nonspecific binding compartment is pointed out in the thalamus and in the temporal. In the other extrastriatal regions (cerebellum and frontal and occipital cortices), this nonspecific binding compartment is suggested because it allows us to improve the fits (see results section), but only the order of magnitude of the k5 and k6 parameters can be estimated. Because of the small values of these parameters (from 0.02 to 0.10 min−1 for k5 and from 0.02 to 0.12 min−1 for k6), the equilibrium state between the free and the nonspecific compartment is reached only from 20 to 100 minutes after the injection, which explains the need to introduce this last compartment.
In all regions, the concentration of the nonspecific binding compartment is low after a tracer injection. In thalamus, the region with the highest nonspecific binding, parameter k5 is equal to 0.1 min−1, whereas specific binding parameter k3 (given after a tracer injection by the product (kon/VR) × B'max) is 0.85 min−1. Therefore the probability for a free ligand to be specifically bound is 8.5 times higher than the probability of being nonspecifically bound, and at the equilibrium state, the nonspecifically bound ligand concentration represents only 12% of the PET concentration. This percentage is smaller in the other regions: 6% in the temporal cortex, 5% in the occipital cortex, and less than 2% in the cerebellum.
In the striatal regions, the specific binding parameter is very large (k3 = (kon/VR) × B'max = 2.9 min−1) compared with the nonspecific binding one, estimated in the extrastriatal regions (from 0.02 to 0.10 min−1). The percentage of the nonspecific binding in the PET measures simulated in the striatum, using the mean parameters k5 and k6 obtained in the extrastriatal regions (0.04 and 0.05, respectively), is estimated to be less than 0.6%. Therefore, the influence of the nonspecific binding on the striatal PET data can be considered as negligible, and thus, because of the experimental uncertainties, the nonspecific binding parameters are not identifiable. This explains why the striatal nonspecific binding parameters are set to zero in this study.
On the use of cerebellum as a reference region
In the last several years, many methods have been proposed to estimate the receptor site concentration using an experimental protocol applicable to patients. These methods are often based on simplified hypotheses. One of the most popular is the use of a reference region in which the free ligand concentration is estimated from the PET measurements in a region assumed to be devoid of receptor sites (usually the cerebellum in the D2-receptor studies). Several hypotheses are also implicit, such as a k2/k1 ratio identical in all regions (including the reference region), a negligible nonspecific binding in the reference region, and no significant effect of the specific binding on the free ligand concentration in the target region. We can evaluate all these hypotheses and estimate the biases introduced by the various approximations. However, because the current reference region for the study of D2 receptors is the cerebellum, the larger difficulty of the reference region method with FLB 457 is obvious: there is the significant concentration of the bound ligand in the cerebellum, which we have pointed out in this study. At the equilibrium state, the bound ligand concentration represents about 77% of the PET-measured concentration (the percentages of free ligand and nonspecifically bound ligand concentrations being 20% and 3%, respectively). This large percentage of bound ligand is obtained in spite of the very small receptor concentration (1% of the striatum concentration) because of the very high affinity of FLB 457. Thus, the free ligand concentration estimated from the PET concentration in the cerebellum is overestimated by a multiplicative factor of approximately 3 to 4, which leads to very large biases in the estimates of the receptor concentration and affinity.
This result is not in contradiction with previous studies using ligands with more usual affinity. Indeed, the use of the cerebellum as a reference region can be justified with some ligands in spite of the small receptor site concentration. For example, considering the KdVR value of raclopride (about 8 nmol/L, 60 times higher than the FLB 457 KdVR value), and our cerebellum B'max estimate (0.39 pmol/mL), the M*b/M*f ratio is equal to 0.048 in the cerebellum at the equilibrium state (this value has been estimated from the binding potential B'max/KdVR). Therefore, the bound ligand concentration represents only 5% of the PET concentration (whereas the free ligand and the unspecifically ligand concentrations represent 85% and 10%, respectively), and thus in this case, the bias introduced by the small concentration of receptor sites in the cerebellum can be assumed to be negligible.
CONCLUSION
The multi-injection approach has been used for the in vivo study of FLB 457 kinetics. Because of its very high affinity, this molecule allowed us to quantify the D2 receptor density not only in striatal regions, but also in extrastriatal regions in which the receptor concentration is from 10 to 100 times smaller. In particular, the receptor concentrations have been estimated in vivo for the first time in the cerebellum and in the cortex.
If the very high affinity of the FLB 457 is a great advantage for the receptor quantification, we have pointed out that the consequences of this property is the difficulty of rapidly reaching the equilibrium state (especially in the striatal regions) and the impossibility of using the cerebellum as a reference region. Similar difficulties should be met with all ligands having a very high affinity. Because of the similarity between the molecules and the kinetics, most of the conclusions of this study are probably valid for epidepride, another well-known D2 ligand.
We have pointed out that the PET curves obtained after tracer injection of [76Br]FLB 457 are more sensitive to blood flow variation than to receptor concentration variation. Thus, care must be taken in clinical studies, mainly for the interpretation of the differences between patients and normal PET curves. The risk is that small blood flow variations (whether related or not to the disease) have similar, or more important, effects on PET measures than the PET concentration variations resulting from a significant modification of the receptor site density related to the disease.
We think that the particular kinetics of this molecule, resulting from the very high affinity, can be used to point out new quantification methods to estimate the receptor concentration both in striatal and extrastriatal regions. We are presently working on such approaches, which do not use blood sampling, and thus, will open the possibility of studying the extrastriatal receptor site density in routine patient examinations.
Footnotes
Abbreviations used
Acknowledgments
The authors thank the cyclotron and radiochemistry staff of the Service Hospitalier Frédéric Joliot, V. Brulon, P. Merceron, and M. Crouzel, for their technical assistance.