
Abstract
The NT2.D1 cell line is one of the most well-documented embryocarcinoma cell lines, and can be differentiated into neurons and astrocytes. Great focus has also been placed on defining the electrophysiological properties of the neuronal cells, and more recently we have investigated the functional properties of their associated astrocytes. We now show for the first time that human stem cell-derived astrocytes produce glycogen and that co-cultures of these cells demonstrate a functional astrocyte-neuron lactate shuttle (ANLS). The ANLS hypothesis proposes that during neuronal activity, glutamate released into the synaptic cleft is taken up by astrocytes and triggers glucose uptake, which is converted into lactate and released via monocarboxylate transporters for neuronal use. Using mixed cultures of NT2-derived neurons and astrocytes, we have shown that these cells modulate their glucose uptake in response to glutamate. Additionally, we demonstrate that in response to increased neuronal activity and under hypoglycaemic conditions, co-cultures modulate glycogen turnover and increase lactate production. Similar results were also shown after treatment with glutamate, potassium, isoproterenol, and dbcAMP. Together, these results demonstrate for the first time a functional ANLS in a human stem cell-derived co-culture.
INTRODUCTION
Neurons and astrocytes form complex relationships that actively support brain function. Recently, the concept of the tripartite synapse 1 has replaced the traditional neurocentric view of the brain. This hypothesis acknowledges that astrocytes not only conduct housekeeping functions but that they also sense neuronal synaptic transmitter release and in turn can modulate neuronal activity through the release of gliotransmitters.
Astrocytes also have a vital role in neurovascular and neurometabolic coupling. 2 Their anatomic position between blood vessels and neurons make them an ideal interface for effective glucose uptake from blood. 3 They also extend numerous processes that connect via end-feet, blood vessels to the neurons and the extracellular space. 4 Some of these processes ensheath neurons while others are interconnected with other astrocytes via gap junctions to form astrocytic syncitia. 5
The astrocyte-neuron lactate shuttle hypothesis (ANLS), 6 has profoundly altered our understanding of brain metabolism. The ANLS hypothesis postulates that during neuronal activity, astrocytes respond to glutamatergic activation by increasing glucose utilization, enhancing glycolysis and lactate release. 6 This lactate is then taken up by neurons via MCT2 transporters and is converted to pyruvate for adenosine triphosphate generation by the tricarboxylic acid cycle. 7
During prolonged activity, astrocytes may also rely upon their reserves of glycogen.8,9 Glycogenolysis has been shown to be essential in rat hippocampal learning 10 and chick bead discrimination tests. 11
These metabolic roles in the brain have fundamental implications within the context of stem cell-derived neuronal networks. The NT2.D1 embryocarcinoma cell line is a well-characterized cell line that has been shown to generate both neuronal (NT2.N) and astrocytic (NT2.A) cells.12,13 The neurophysiological properties of the neuronal cells derived from these cells have been well characterized. Within the NT2.N population, heterogenous sub-populations are produced such as dopaminergic, cholinergic, GABAergic, and glutamatergic neurons.14–17 NT2.N cells have been found to generate action potentials on depolarization.18,19 In addition, they also express the high-voltage-activated calcium channels, pharmacologically classified as L, N, P/Q, and R,
20
as well as calcium-activated BK channels, which are involved in neuronal hyperpolarisation after action potential firing.
21
We have recently demonstrated that NT2.D1 cell-derived neuron and astrocyte (NT2.N/A) networks can communicate and so have the potential to interact with each other as observed
In this study, we utilized mixed cultures of NT2.N/A cells to investigate the metabolic properties of these cells and measured the response of the astrocytic network to well-characterized neuromodulators. We demonstrate NT2.N/A cells express the main tenets of the ANLS model and display functional characteristics consistent with their neuron-astrocyte metabolic coupling. We also found for the first time that human stem cell-derived astrocytes store glycogen and that neuromodulators such as glutamate, potassium, and noradrenaline can modulate its turnover. This study establishes that stem cell-derived astrocytes provide metabolic support to their neuronal counterparts, thus demonstrating a tractable human model, which will facilitate the study of the metabolic coupling between neurons and astrocytes and its relationship with CNS functional issues ranging from plasticity to neurodegeneration.
MATERIALS AND METHODS
Cell Culture
Human teratocarcinoma NT2.D1 cells used in this study were kindly donated by Professor Andrews (University of Sheffield, UK). NT2.D1 cells were cultured in Dulbecco’s modified Eagle medium high glucose with GlutaMAX, with pyruvate (Invitrogen, Paisley, UK) containing 10% heat-inactivated fetal bovine serum (Invitrogen), 100 units/mL penicillin, and 100 μg/mL streptomycin. NT2.D1 cells were differentiated to produce mixed cultures of neurons and astrocytes using the method described by Woehrling
Cultures of NT2 astrocytes were isolated from co-cultures according to the method developed by Woehrling
Real Time Polymerase Chain Reaction
Total RNA was extracted using Trizol Reagent (Invitrogen), quantified by spectrophotometry, and treated with DNase and an RNase inhibitor (Qiagen, Manchester, UK). One microgram of total RNA was reverse transcribed using the Nanoscript reverse transcriptase kit (Primer Design, Southampton, UK) and oligo dT15 primers (Primer Design). Real-time PCR: cDNAs were amplified in a standard 40-cycle SYBR green real-time PCR reaction using optimized sequence specific primers for GLUT1, GLUT3, MCT2, MCT4, MCT1, GLT-1, GLAST, and GLUL according to the manufacturer’s instructions. The housekeeping genes UBC, B2M, EIF4A2, and C14orf133 (supplied by Primer Design) were assayed under the same conditions as above. The expression of UBC was found to be unchanged under the conditions imposed and was therefore used in the normalization of qRT-CR data. Cycling conditions were as follows: 10 minutes at 95°C, 15 seconds at 95°C, and 1 minute at 60°C for 40 cycles, 30 seconds at 95°C, 30 seconds at 55°C, and 30 seconds at 95°C. The following formula was used to calculate the relative amount of the transcripts in differentiated (treat) and the undifferentiated samples (control), both of which were normalized to the endogenous controls. ΔΔCT = ΔCT (treat)—ΔCT (control) for biologic RNA samples or ΔΔCT = ΔCT (HBRR) — ΔCT (UHRR) for reference RNA samples. ΔCT is the difference in CT between the target gene and endogenous controls by subtracting the average CT of controls from each replicate. The fold change for each treated sample (relative to the control sample (or UHRR) = 2 −ΔΔCT. Fold changes in gene expression using the comparative CT method and statistical analysis were determined using the freely available Relative Expression Software Tool (REST 2009, http://www.qiagen.com). Fold changes > 2 fold were considered significant.
Immunohistochemistry
Cells cultured on PDL/Laminin coverslips (BD Biosciences, Oxford, UK) were washed with PBS and fixed for 10 minutes with 4% paraformaldehyde. After fixation, coverslips were washed twice with PBS and permeabilized with 0.2% Triton/PBS. Subsequently, cells were incubated in 2% BSA/0.2% Triton/PBS for 1 hour to avoid non-specific binding of antibody. Subsequently, cells were incubated for 1 hour at room temperature with either mouse anti-glial fibrillary acidic protein (clone GA5 Millipore, Watford, UK, 1:500) or rabbit anti-β-tubulin-III (Abcam, Cambridge, UK, 1:500). After incubation, coverslips were washed three times in 2% BSA/0.2% Triton/PBS and then incubated with donkey antimouse Rhodamine (1:200, Jackson ImmunoResearch, Suffolk, UK) and goat anti-rabbit FITC (1:200; Jackson Immunoresearch).
After washing, the nuclei were visualized by Hoechst staining (Invitrogen) and mounted with ProLong Gold Antifade Reagent (Invitrogen). The cells were examined using a Leica DM14000 B (Leica Microsystems, Milton, Keynes, UK).
Glycogen Staining
Cytologic localization of glycogen was determined using the periodic acid-Schiff method. 25 Briefly, the cells cultured on coverslips were washed with ice-cold PBS and fixed for 5 minutes at room temperature in methanol. After fixation, coverslips were washed three times with 70% (vol/vol) ethanol. Subsequently, the cells were incubated for 30 minutes at room temperature with 1% (wt/vol) periodic acid dissolved in 70% ethanol. After incubation, cells were washed three times with 70% ethanol and stained for 60 minutes at room temperature with 0.5% (wt/vol) basic fuchsin (Sigma-Aldrich, Dorset, UK) dissolved in acid ethanol (ethanol/water/concentrated HCl, 80:19:1). Finally, cells were washed three times with 70% ethanol.
Determination of Glycogen Levels
The method used to determine levels of glycogen in biologic samples was first described in. 26 After the treatment, cells were washed three times with ice-cold PBS and then scraped in 300 μl of 30 mmol/L ice-cold HCl. Subsequently, samples were sonicated for 15 seconds and both glycogen and protein content was determination. Ten microliter aliquots of cell lysate were sampled. To the first aliquot, 30 μl of acetate buffer (0.1 mol/L, pH 4.65) was added. To the second 30 μl of 0.1 mg/mL of amyloglucosidase in acetate buffer was added. Both samples were incubated for 30 minutes at room temperature. After incubation, 200 μL of Tris-HCl buffer (0.1 mol/L, pH 8.1) containing MgCl2 (3.3 mmol/L), adenosine triphosphate (0.33 mmol/L), nicotinamide adenine dinucleotide phosphate (38 μmol/L), hexokinase (4 μg/mL), and glucose 6-phosphate dehydrogenase (2 μg/mL) were added to both aliquots and incubated for 30 minutes at room temperature. Standards were prepared using a solution of glucose (1 mg/mL) and 1:2 serially diluted using acetate buffer to provide standards ranging from 500 μg/ml and 3.9 μg/ml. Standards were incubated with acetate buffer for 30 minutes at room temperature and then with hexokinase and glucose 6-phosphate dehydrogenase for 30 minutes at room temperature. Fluorescence of the NADPH formed in the final reaction (excitation: 340 nm; emission: 450 nm) was obtained using SpectraMAX GeminiXS microplate luminometer (Molecular Devices, Berkshire, UK) and SoftMaxPro software. The first aliquot provides the sum of glucose and glucose 6-phosphate, and the second corresponds to total NADPH derived from glycogen, glucose, and glucose 6-phosphate. One mole of glycogen corresponds to 1 mol of glycosyl units originating from glycogen. The remaining 10 μl sample was used to determine protein content using BCA assay reagent kit from (Thermofisher, Loughborough, UK) and read at 590 nm using a Thermo multiscan EX 96 well plate reader (Thermofisher).
6-NBDG Uptake Assay
Uptake of the glucose analog 6-NBDG (Invitrogen) in NT2.N/A and NT2.A cultures was investigated using methods described by Waiza et al. 27 Briefly, before measurement, culture medium was removed and the cells were washed with Krebs-Ringer HEPES buffer supplemented with 5 mmol/L glucose. Glucose in the medium was reduced to 0.5 mmol/L and the cells were incubated for 5 minutes. Subsequently, the buffer in each well was replaced with Krebs-Ringer HEPES buffer containing 0.5 mmol/L glucose and 300 μmol/L 6-NBDG. Cultures were excited at 488 nm and imaged at 505 to 550 nm emission at 60 minutes, 180 minutes, and 360 minutes. Absorbance was measured using SpectraMAX GeminiXS microplate luminometer (Molecular Devices).
Determination of Lactate Levels
Lactate was measured using the Fluorescent Lactate Assay Kit (Abcam). Briefly, the assay was carried out in a 96 well microplate. Fifty microlitersof media samples were used and well mixed with 50 μl reaction mix containing 46 μl lactate assay buffer, 2 μl probe, and 2 μl enzyme mix. Fifty microliters of lactate standards prepared at 0, 0.2, 0.4, 0.6, 0.8, and 1.0 nmol/well and 50 μl reaction mix. The reaction was incubated at room temperature for 30 minutes (protected from light) and absorbance at 570 nm was obtained using a Thermo multiscan EX 96 well plate reader. All readings were corrected for background.
Stimulation Protocol
NT2.D1 cultures were synaptically stimulated using a computer controlled constant current isolated-stimulator (STG1002, Multichannel Systems, Reutligen, Germany) and bipolar electrodes, which were placed within close proximity to cells.
Statistics
Results were expressed as the mean of three samples±s.e. of the mean. Comparisons between treatments were performed using analysis of variance followed by Dunnett’s or Turkey’s post test or Student’s
RESULTS
NT2.D1-derived neurons (NT2.N) and astrocytes (NT2.A) were identified visually by their characteristic morphology. NT2.A cells were identified by their flat phase dark appearance, while NT2. Ns were typically phase bright and often observed on top of the astrocytic monolayer. These cells were further identified using immunohistochemistry for the specific markers glial fibrillary acidic protein and β-tubulin (Figure 1). To determine the localization of glycogen in NT2.D1-derived cultures, the periodic acid — Schiff method was used. 26 Glycogen was found to co-localize with glial fibrillary acidic protein-positive cells (Figure 1G).
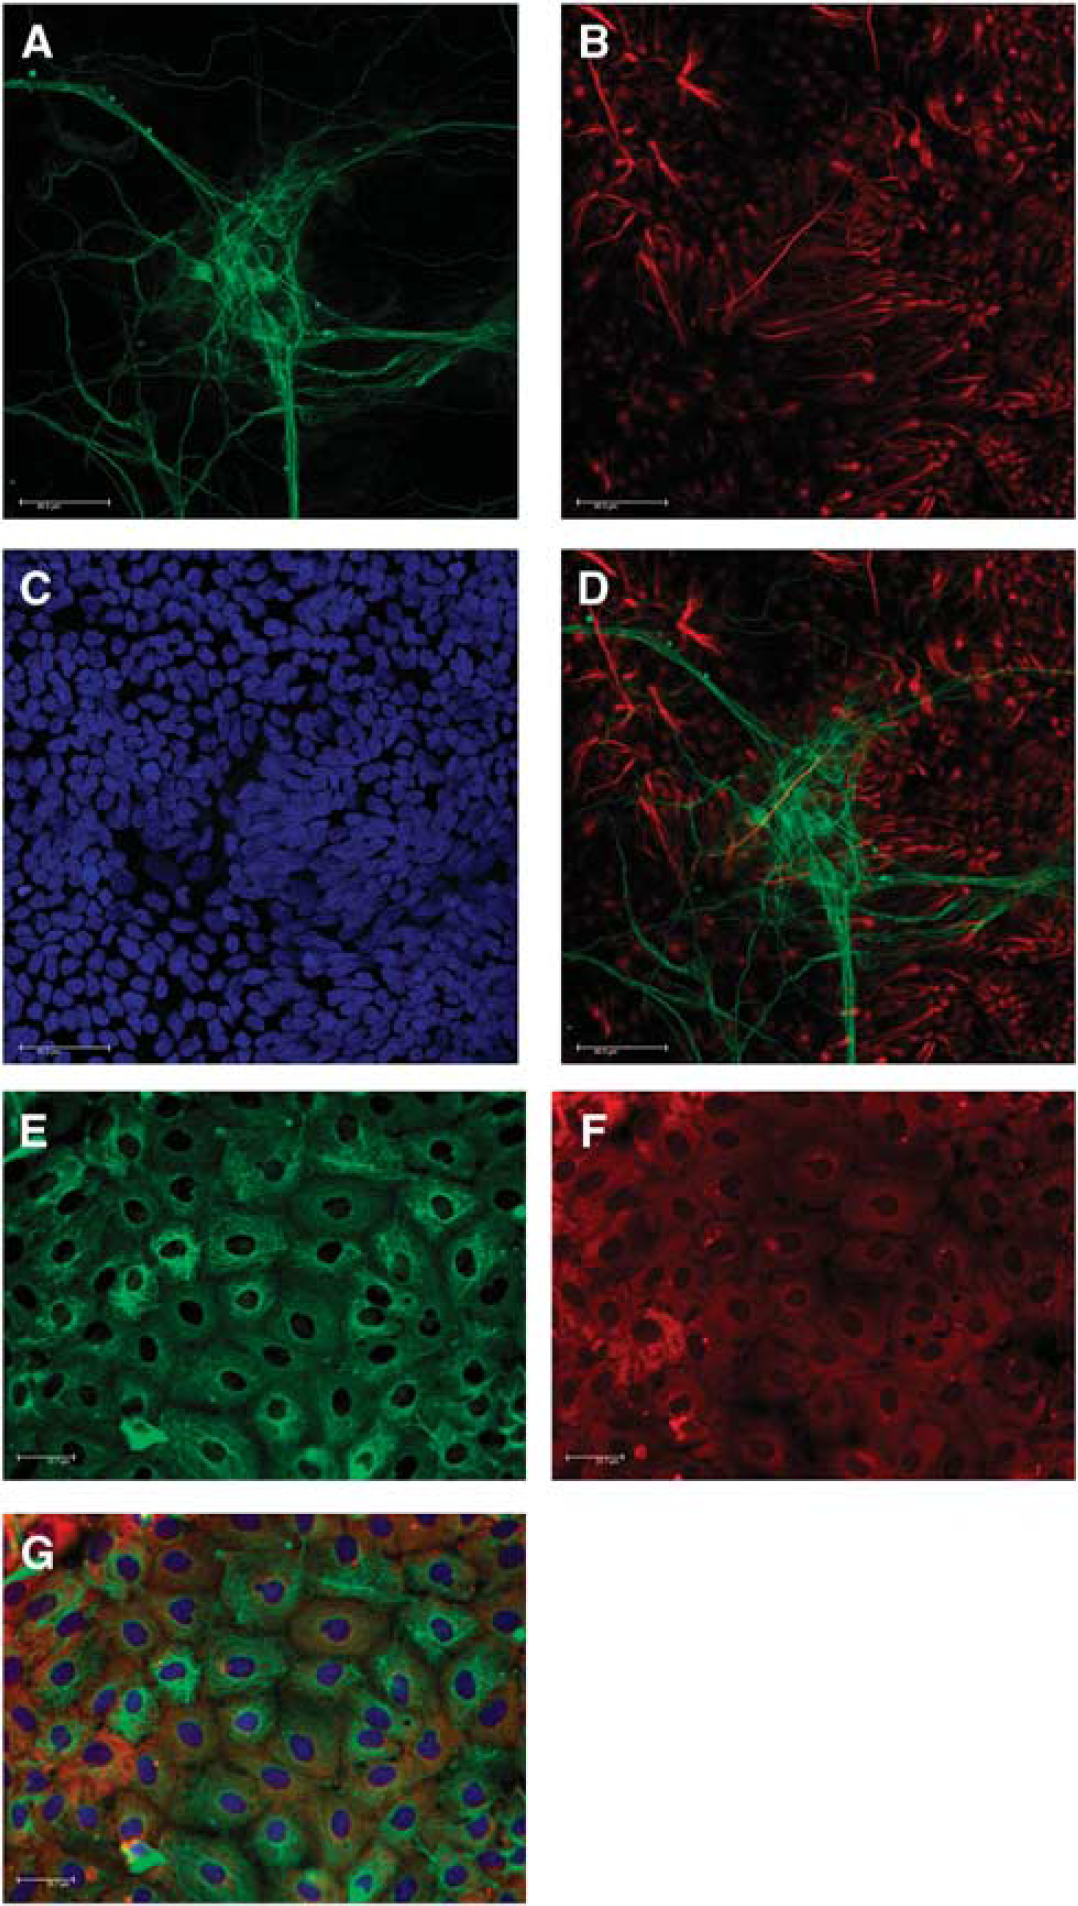
Immunofluorescent image of NT2.N/A. Images showing (
Using real-time qRT-PCR, cultures were also characterized for the expression of genes involved in the ANLS after differentiation. Genes included glucose transporters (GLUT1 and GLUT3), monocarboxylate transporters (MCT1, MCT2, and MCT4), glutamate transporters (GLT1 and GLAST) and glutamine synthase (GLUL). A comparison of undifferentiated NT2.D1 cells with differentiated co-cultures showed an upregulation of glutamate transporters (GLAST and GLT1) and a downregulation of GLUT1, MCT1, and GLUT3, while other genes remained unchanged (MCT4/2 and GLUL); (Figure 2B). However, Ct values for all genes tested were relatively low (<30) suggesting a high-to-moderate expression of these genes (Figure 2C).
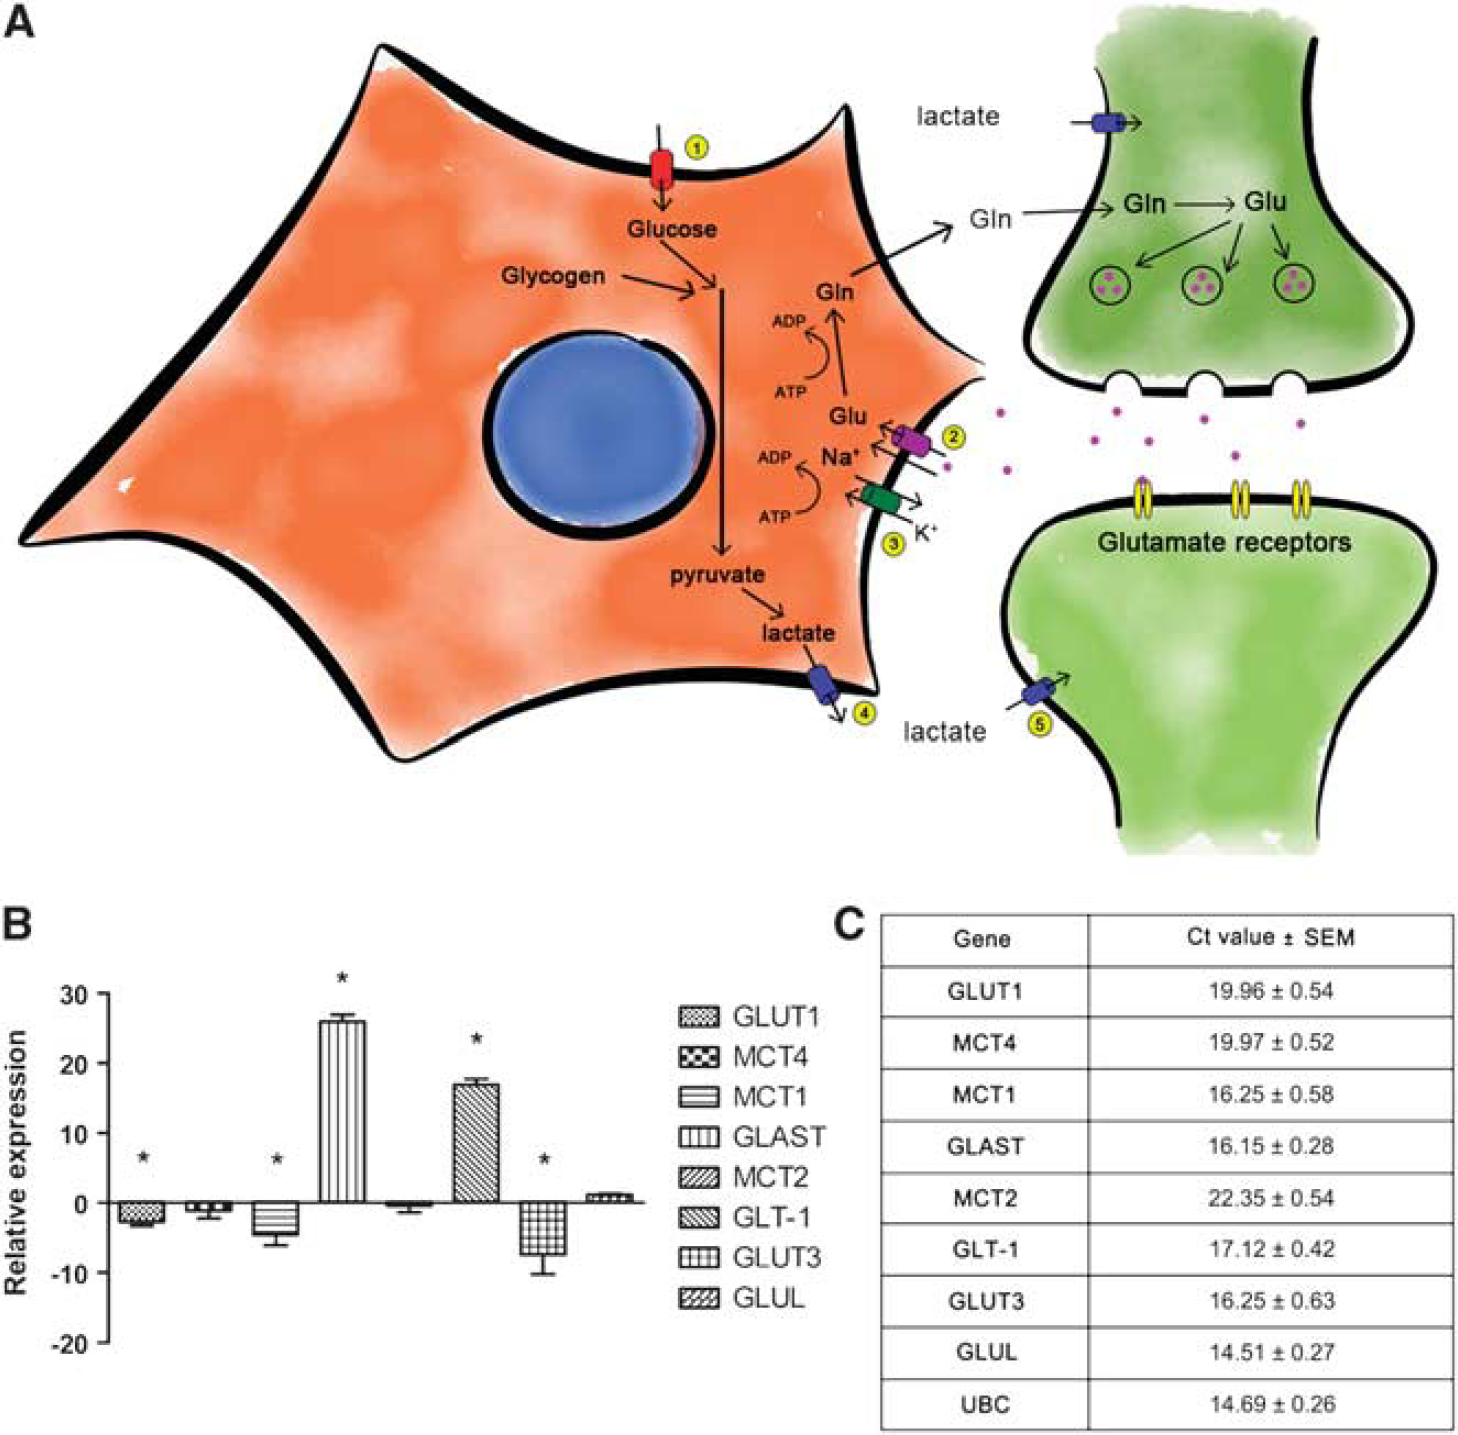
Characterization of ANLS components in NT2.N/A after differentiation. (
Glutamate Stimulates Uptake of Fluorescent Glucose Analog 6-NBDG in NT2.N/A Cultures
Utilization of glucose in NT2.N/A and NT2.A cultures was monitored using the fluorescent glucose analog 6-NBDG. In control, cultures dye accumulated 1.68-fold ± 0.165 s.e.m. over 360 minutes from 0 minute. After the treatment of the cultures with glutamate for 180 minutes, 6-NBDG uptake in co-cultures increased 2.09 fold ± 0.144 s.e.m. (
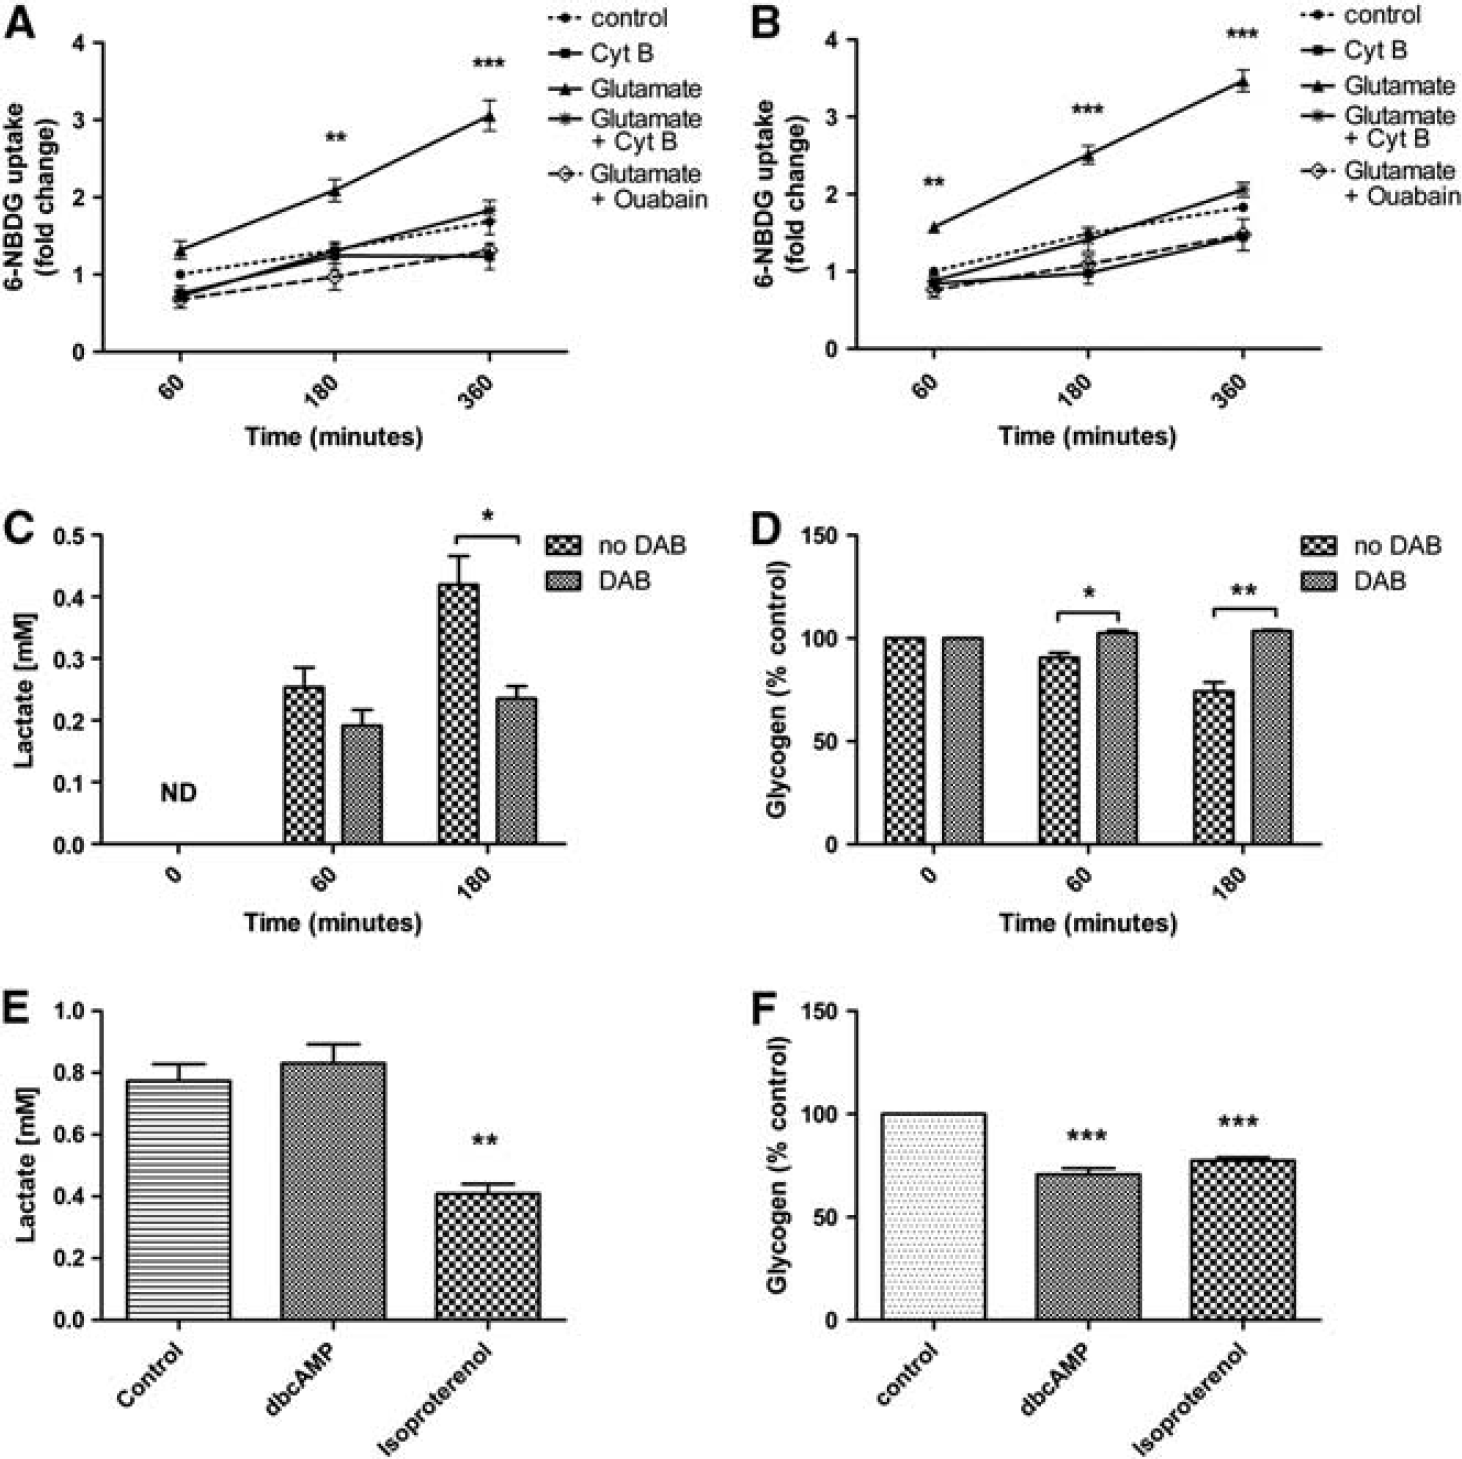
Effects of glutamate, hypoglycemia, and neuromodulators on 6-NBDG uptake, lactate production, and glycogen breakdown in NT2.D1-derived cultures. Uptake was measured in the presence of glutamate with and without ouabain or cytochalasin B in, (
Hypoglycemic and Neuromodulators Stimulate Turnover of Glycogen and Production of Lactate
Lactate release and glycogen levels were measured in KREBS-ringer HEPES buffer containing no glucose. In order to block glycogen breakdown, cells were also treated with 1,4-dideoxy-1,4- imino-d-arabinitol, a selective inhibitor of glycogen phosphorylase. Under hypoglycaemic conditions (Figure 3C), cultures released significant amounts of lactate (0.42 ± 0.05 mmol/L at 180 minutes,
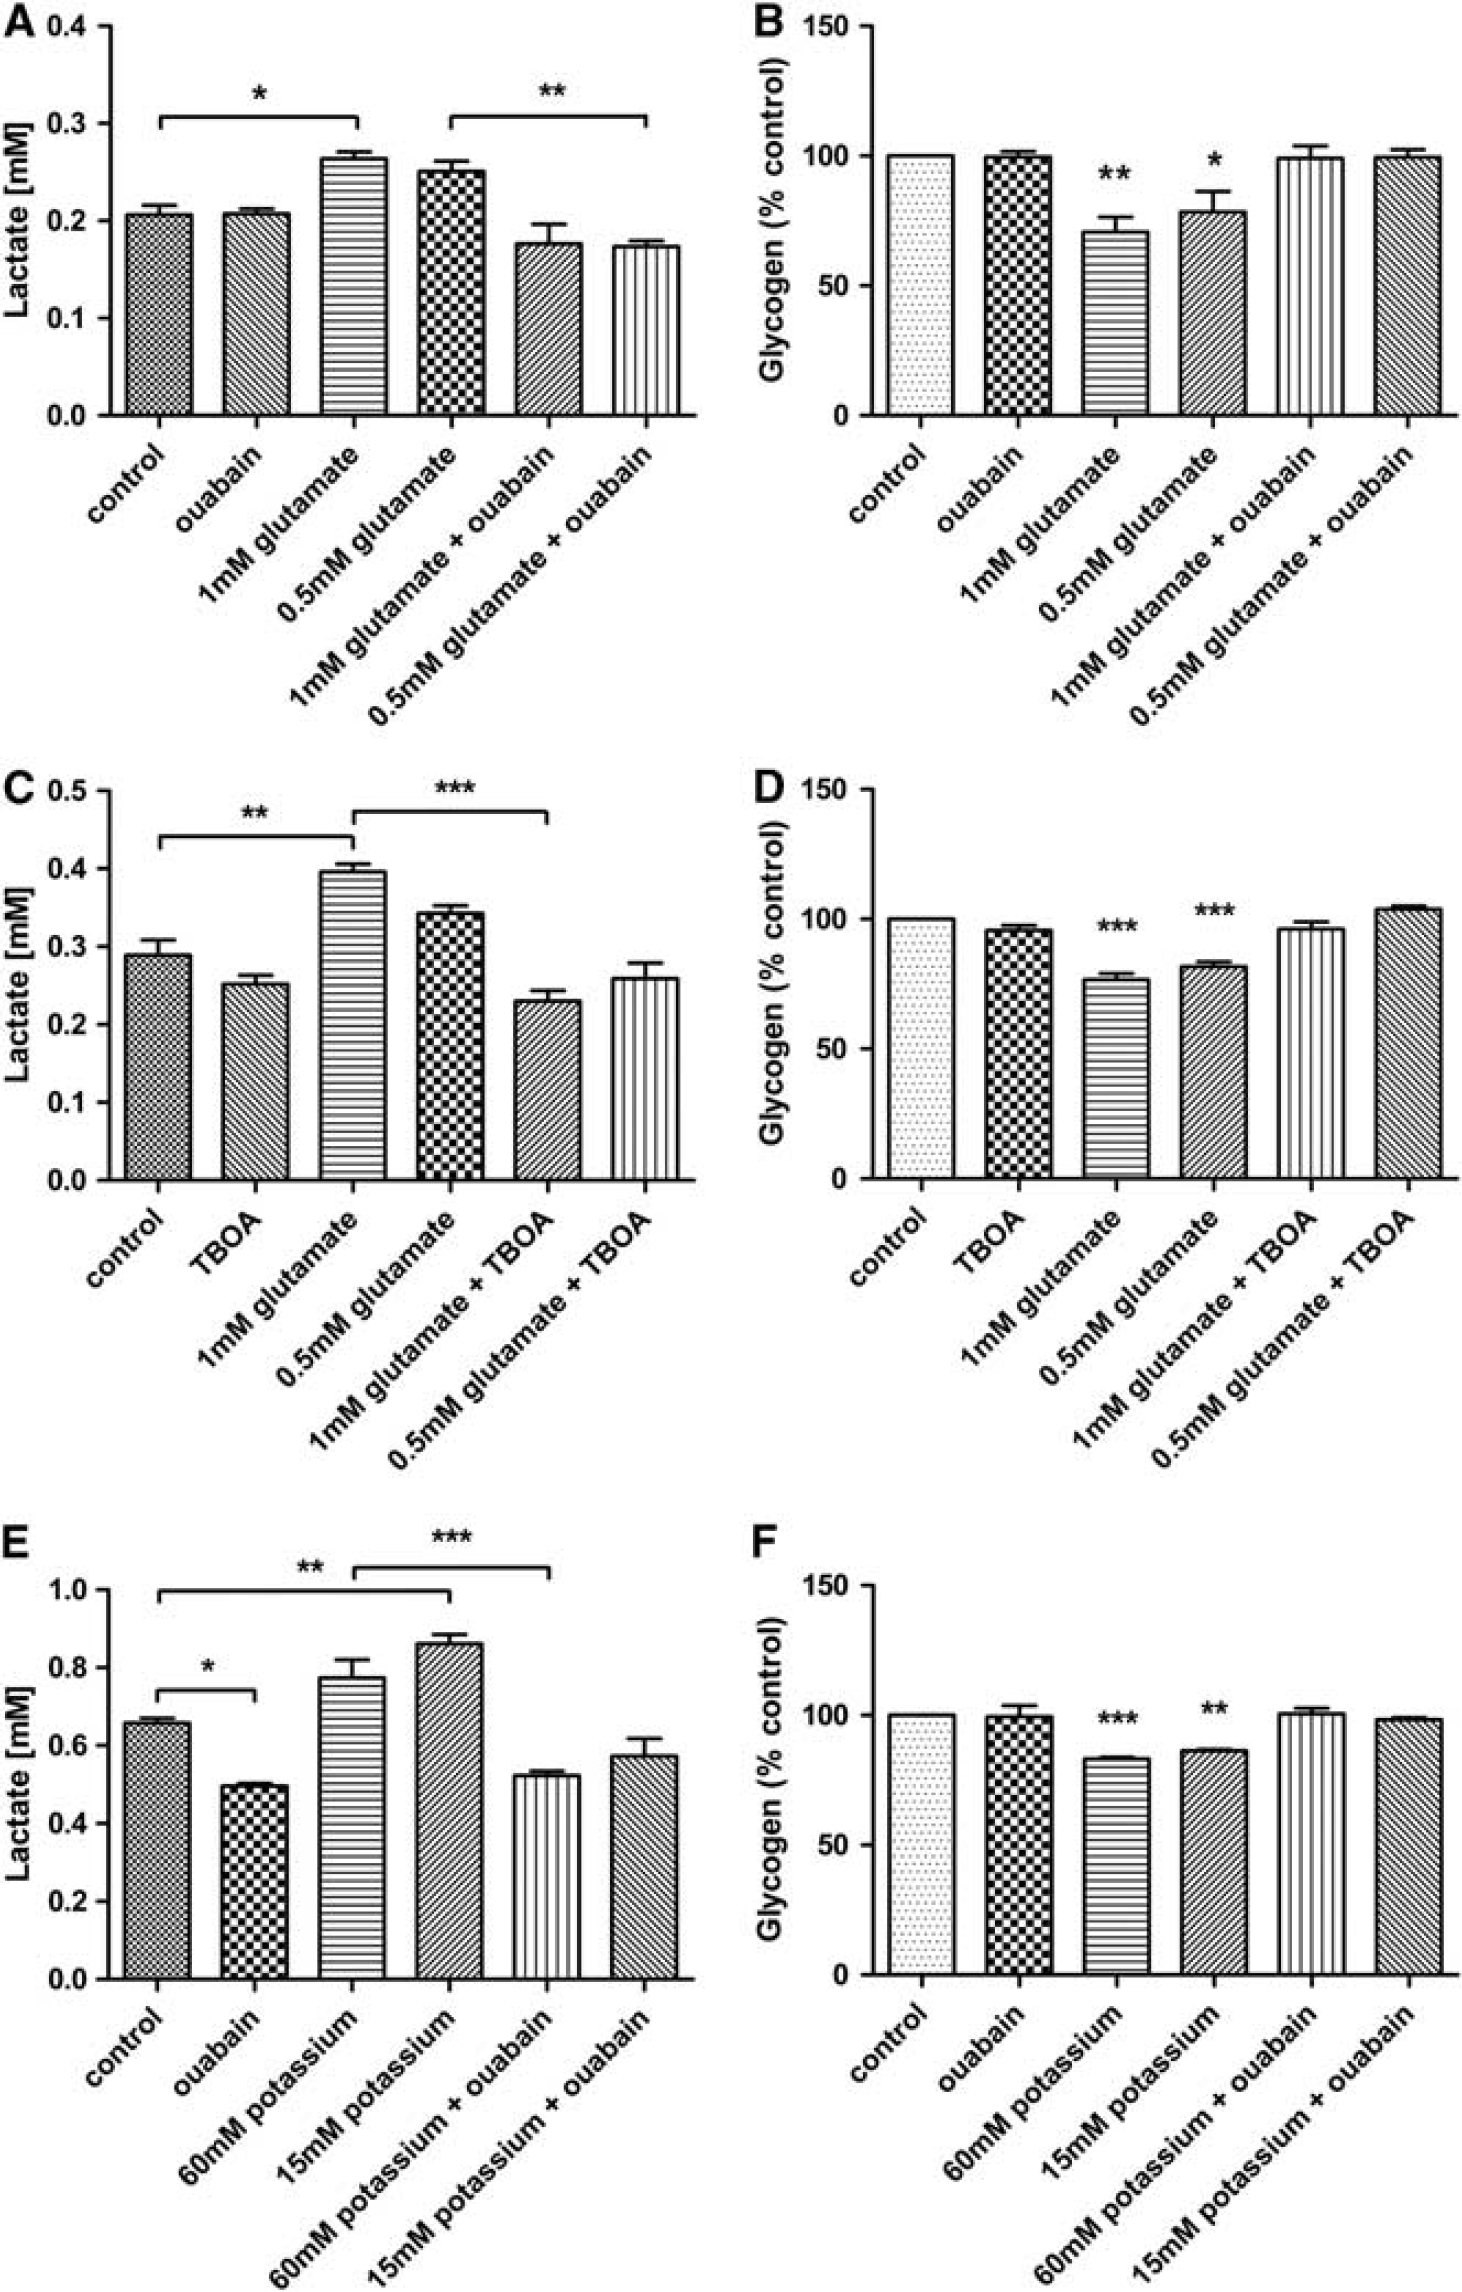
Effects of glutamate and potassium on neuron and astrocytes co-cultures. (
Glutamate and Potassium Stimulate Glycogen Breakdown and Lactate Production in NT2.N/A Co-Cultures
In order to test activation of the Na+/K+ ATPase by glutamate, cultures were exposed to glutamate both in the presence and absence of ouabain (Figures 4A and 4B). The treatment of the cultures with glutamate significantly increased the lactate levels (1 mmol/L glutamate: 0.26 ± 0.01 mmol/L,
To determine whether the effect seen in NT2.N/A cultures was mediated by glutamate transporters and not glutamate receptors, 6 cells were exposed to glutamate in the presence of DL-threo-β-benzyloxyaspartic acid (TBOA), a potent glutamate transport inhibitor. Results demonstrated that TBOA treatment blocks both the release of lactate (control: 0.29 ± 0.02 mmol/L, TBOA and 1 mmol/L glutamate: 0.23 ± 0.01 mmol/L) as well as glycogen breakdown in response to glutamate (TBOA and 1 mmol/L glutamate: 96.16 ± 2.83% of non-treated control) (Figures 4C and 4D).
Potassium has also been shown to directly activate the Na+/K+ ATPase.
28
The levels of lactate after treatment with ouabain alone actually decreased, suggesting a block of basal Na+/K+ ATPase activity (Figure 4E). Treatment with potassium at both 15 and 60 mmol/L triggered a significant increase in lactate (60 mmol/L potassium: 0.77 ± 0.05 mmol/L,
NT2.N/A Network Activity Induces Glycogen Turnover and Lactate Production
In order to test whether neuronal activity triggers the lactate shuttle in NT2.N/A cultures, the cells were stimulated electrically for 30 minutes using a computer controlled constant current isolated stimulator and bipolar electrodes in the presence and absence of TBOA (Figure 5). After electrical stimulation, the levels of lactate in the media were significantly increased (0.67 ± 0.04 mmol/L
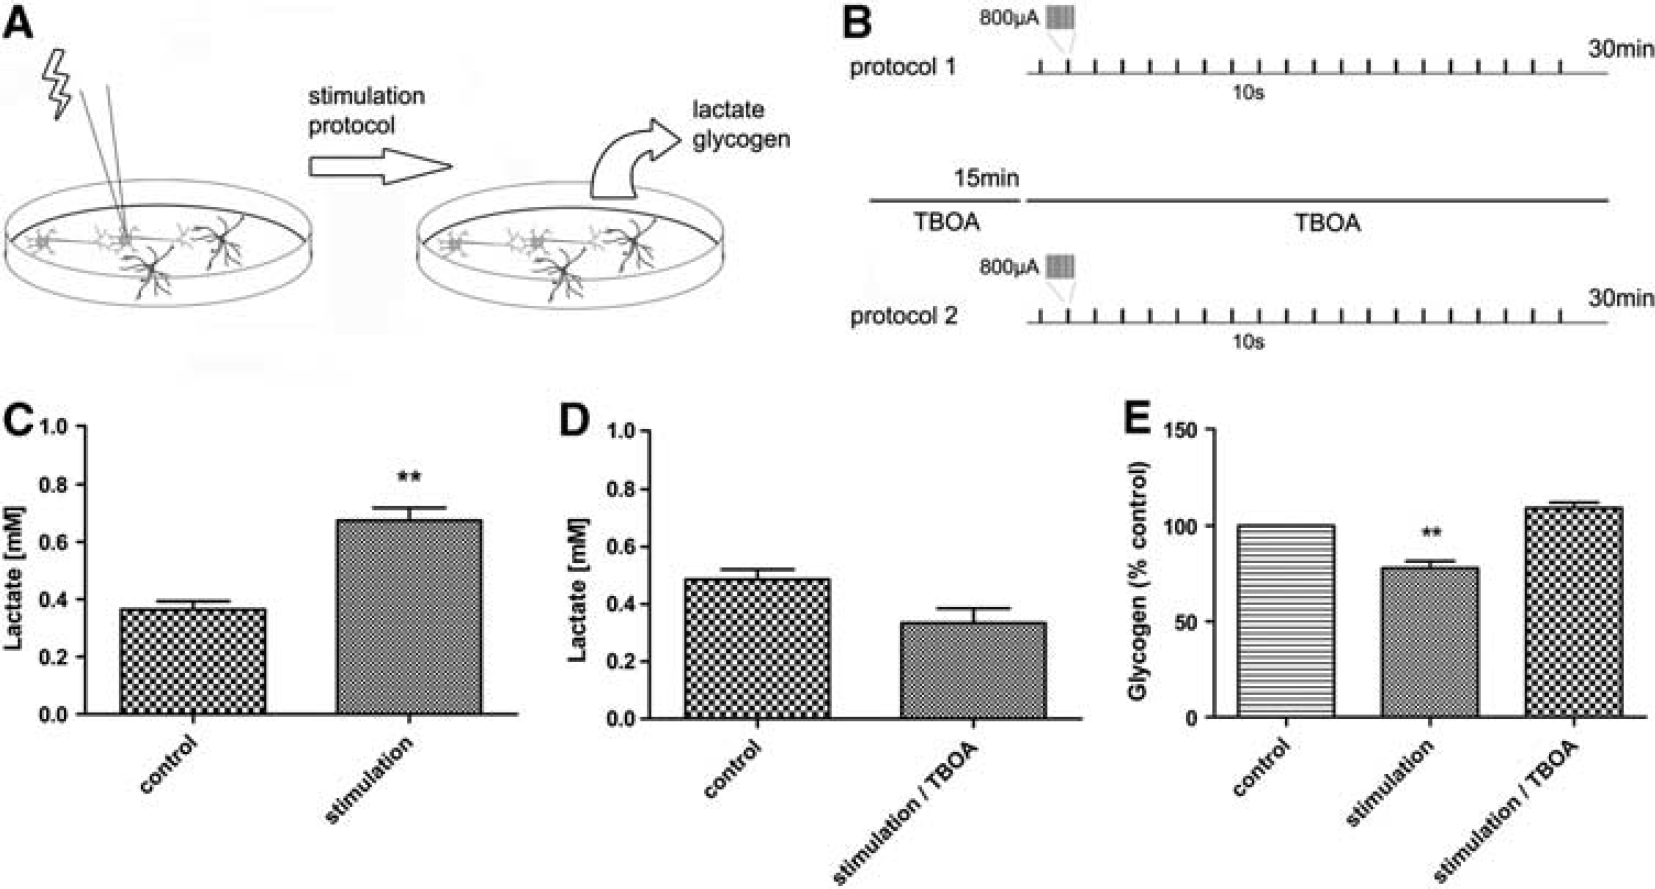
Effects of induced NT2.N/A network activity on glycogen turnover and lactate production. (
DISCUSSION
The ANLS was first proposed by Pellerin and Magistretti
6
and has since been extensively studied. Experiments supporting the ANLS have been carried out using brain slices, cultured primary neurons, and astrocytes as well as isolated nerves and sympathetic ganglia from rat, mouse, and chick.
29
In addition, a number of studies have used
13
C-NMR spectroscopy to comprehensibly investigate cerebral metabolism both
We have previously demonstrated that neuronal networks derived from NT2.D1 cells signal to astrocytes, and that astrocytic networks communicate via gap junction-mediated and gliotransmitter signaling. 22 We now demonstrate for the first time that human stem cell-derived astrocytes synthesize glycogen as well as markers associated with its metabolism, suggesting that these cells are well differentiated and resemble mature astrocytes. 32 Co-cultures also respond to neuromodulators and neuronal activity by enhancing glucose uptake as well as inducing glycogenesis and glycogenolysis. While postmitotic co-cultures derived from NT2.D1 cells are widely accepted as a model of the human CNS, some studies have suggested that NT2.NA resemble human fetal primary cells. 33 As such, caution in the interpretation of NT2-derived cultures to adult cells should be taken.
Our results support the hypothesis that astrocytes respond to glutamate and potassium, by inducing glucose uptake and aerobic glycolysis, resulting in lactate production via activation of Na+/K+ ATPase (an effect that was blocked by cytochalasin B, TBOA, and ouabain). We also demonstrate that lactate production and glycogen breakdown occur in astrocytes after neuronal activation and hypoglycemia and is blocked using 1,4-dideoxy-1,4-imino-d-arabinitol.34–37
These results, together with glycogen staining, suggest that NT2.A cells possess the machinery required for glycogen synthesis and glycogen breakdown. The decrease in glycogen levels and subsequent increase in lactate suggest that NT2.A respond to glutamate and potassium, not only by increasing glucose uptake, but also by degrading glycogen as demonstrated
Treatments of co-cultures with dbcAMP and the β1 and β2-adrenoreceptor agonist isoproterenol-induced glycogenolysis within astrocytes. dbcAMP activates glycogen phosphorylase through activation of protein kinase A leading to glycogen breakdown 39 while isoproterenol in turn acts by elevating levels of cyclic AMP. 40 Interestingly, although isoproterenol increased glycogen turnover in these cultures, there was a decrease in the level of lactate in the media. However, it has previously been shown that norepinephrine enhances the expression of MCT2 and subsequent lactate uptake in cortical neurons. 41
The effect of neuronal activity on glycolysis and glycogenolysis was also investigated using electrical stimulation. After 30 minutes, glycogen levels dropped significantly, while lactate levels increased. Stimulation-induced glycogen breakdown and lactate release were inhibited by TBOA suggesting that neuronal glutamate release and subsequent astrocytic uptake directly induced glycolysis and glycogeneolysis in these cultures.
While the majority of lactate produced in these co-cultures is predicted to be derived from astrocytes, it cannot be unambiguously proved that neurons do not produce lactate in these cultures. As such, future experiments will aim to determine metabolic flux from both cell types in monocultures. In addition, more sensitive methods such as 13 C-NMR flux analysis could be used to comprehensively analyze energy metabolism in these cultures.
Glycolysis and glycogenolysis are important processes in normal functioning of the brain but also in a number of disease processes such as ischemia, hypoglycemia, and Alzheimer’s. The focus of this report demonstrates the metabolic coupling of neurons and astrocytes for the first time in a human-derived stem cell model. This has important implications in the study of memory formation, plasticity, and neurodegeneration
DISCLOSURE/CONFLICT OF INTEREST
The authors declare no conflict of interests.