
Abstract
Adenosine is an important neuromodulator. Basic cerebral effects of adenosine are exerted by the A1 adenosine receptor (A1AR), which is accessible in vivo by the novel ligand [18F]8-cyclopentyl-3-(3-fluoropropyl)-1-propylxanthine ([18F]CPFPX) and positron emission tomography (PET). The present study investigates the applicability of kinetic models to describe the cerebral kinetics of [18F]CPFPX in order to quantify A1AR density in vivo. Six healthy volunteers underwent dynamic PET scanning and arterial blood sampling after bolus injection of [18F]CPFPX. For quantitative analysis, a standard two-tissue compartment model (2TCM) was compared with a one-tissue compartment model (1TCM) and Logan's graphical analysis (GA). The 2TCM described the cerebral kinetics of [18F]CPFPX significantly better than the 1TCM (in all regions and subjects examined). The estimated values of the regional total distribution volumes (DVt) correlated strongly between the 2TCM and GA (linear regression r2 = 0.99, slope: 1.007). The DVt correlation between the 2TCM and the 1TCM was comparably high, but there was a significant bias towards lower DVt estimates given by the 1TCM (r2: 0.99, slope: 0.929). It is concluded that a 2TCM satisfactorily accounts for the cerebral kinetics of [18F]CPFPX. GA represents an attractive alternative method of analysis.
The purine adenosine is an important neuromodulator, beside its central role in cellular energy metabolism and genetic encoding. Four adenosine receptors (A1, A2A, A2B, and A3) have been cloned and expressed (Dunwiddie and Masino, 2001; Fredholm et al., 2001). The Gi/o protein coupled A1 adenosine receptor (A1AR) is pre- and postsynaptically localized and expressed throughout the human brain with a dense and heterogeneous distribution (Fastbom et al. 1987a; Svenningsson et al., 1997; Bauer et al., 2003a). It acts through a number of effectors that inhibit adenylate cyclase activity, reduce Ca2+ influx and promote a hyperpolarizing outward K+ current. Collectively, these actions are tonically neuromodulatory and reduce neurotransmitter release and neuronal exciility.
There are numerous reports on chronic alterations of A1AR density in neurological and psychiatric disorders (for review see Dunwiddie and Masino, 2001). A1AR activation is postulated to be protective against glutamate excitotoxicity, as extracellular adenosine levels increase during hypoxia, ischemia, and excessive neuronal activity (Dunwiddie and Masino, 2001; Haas and Selbach, 2000). A1AR density is reduced in the temporal cortex of patients with temporal lobe epilepsy (Glass et al., 1996) as well as in the hippocampus of patients suffering from dementia (Ulas et al., 1993; Deckert et al., 1998). Thus, its wide distribution and involvement in a variety of physiological and pathological conditions make the A1AR an attractive target for in vivo imaging and quantification.
The fluorine-18 labeled A1AR antagonist [18F]8-cyclopentyl-3-(3-fluoropropyl)-1-propylxanthine ([18F]CPFPX) was recently developed as a PET ligand for in vivo imaging of cerebral A1ARs (Holschbach et al., 1998; Holschbach et al., 2002). [18F]CPFPX shows nanomolar in vitro affinity to cloned human A1ARs (KD = 1.26 nmol/L) and a high A1AR selectivity over other cerebral receptors including the A2AAR (KD = 940 nmol/L). [18F]CPFPX can be synthesized with high radiochemical yield (45%), purity (> 98%) and specific radioactivity (> 270 GBq/μmol [> 7.3 Ci/μmol]) (Holschbach et al., 2002). The cerebral distribution of [18F]CPFPX found ex vivo in mice (Holschbach et al., 2002) and rats (Bauer et al., 2003b) as well as in in vivo PET studies in baboons (Boy et al., 1998) corresponded to the known distribution of A1ARs. In mice, rats, baboons, and humans, at least two polar, species-specific metabolites are rapidly formed, which are highly unlikely to the cross the blood-brain barrier due to their polarity. In fact, brain homogenate extracts from mice (60 minutes post-injection) demonstrated >98% unchanged ligand (Holschbach et al., 2002). The first A1AR PET study in humans showed a cerebral distri-bution pattern of [18F]CPFPX that is in agreement with human post mortem A1AR autoradiography (Bauer et al., 2003a).
The present study is intended to evaluate the use of PET kinetic compartment models (one- and two-tissue compartment model) (Mintun et al., 1984) and of Logan's graphical analysis method (Logan et al., 1990) to describe the cerebral kinetics of [18F]CPFPX and to derive quantitative measures of A1AR density after a single bolus injection of [18F]CPFPX.
MATERIALS AND METHODS
Subjects
All procedures were approved by the Ethics Committee of the Medical Faculty of the University of Düsseldorf, Germany, and the German Federal Office for Radiation Protection. Six healthy male volunteers (mean age = 31.89 ± 8.46 years, range = 21.9–40.5 years) were included after giving written informed consent. Volunteers were screened for history of neurological and psychiatric diseases, head injury, alcohol and substance abuse. A review of current medications excluded the intake of substances interfering with the adenosinergic system (e.g., theophylline). Volunteers avoided caffeine intake for at least 24 hours prior to the PET studies.
To exclude structural brain abnormalities and to define regions of interest (ROI), individual high-resolution magnetic resonance imaging (MRI) data sets were acquired (Magnetom VISION 1.5 T, Siemens, Erlangen, Germany) using a 3D T1-weighted magnetization-prepared rapid-acquisition gradient-echo sequence (voxel size = 1×1×1 mm3).
PET Acquisition
Radiosynthesis and formulation of [18F]CPFPX was performed as previously described (Holschbach et al., 2002). At time of injection the mean specific radioactivity was 72.17 ± 58.74 GBq/μmol (range = 18.66–159.80 GBq/μmol) (1.950 ± 1.587 Ci/μmol [range = 0.504 ± 4.319 Ci/μmol]).
All PET measurements were performed in 3D mode on a Siemens ECAT EXACT HR+ scanner (Siemens-CTI, Knoxville, TN, USA) equipped with a circular lead shield (Neuroinsert) to reduce scatter radiation from outside the field of view. Scanning took place as the subjects laid supine in a quiet ambience with their heads immobilized in canthomeatal orientation by means of polyurethane foam. A 10 minutes 68Ge/68Ga-transmission scan was acquired to correct for attenuation. Sixty-three slices of 2.425 mm slice thickness (pixel size = 2 × 2 mm2) were reconstructed per time frame by filtered back-projection (Shepp filter, filter width = 2.5 mm) after FORE rebinning (Defrise et al., 1997) into 2D sinograms. Data sets were fully corrected for random coincidences, scatter radiation and attenuation. Head positions were permanently monitored and, if necessary, manually corrected using a video system and reference skin marks.
A venous catheter in a forearm vein served for tracer injection. An arterial catheter was inserted into the left distal radial artery under local anesthesia and used for arterial blood sampling. Dynamic PET acquisition (90 minutes) in list mode began with injection of [18F]CPFPX over 20 seconds. Mean injected radioactivity was 273.5 ± 12.0 MBq (range = 251.6 −284.9 MBq) (7.39 ± 0.32 mCi [range = 6.80–7.70 mCi]) in a volume of 10 mL sterile saline. The mass of injected CPFPX was 6.54 ± 4.76 nmol (range = 1.69–14.7 nmol, equal to 0.54–4.73 μg CPFPX). During the first 90 seconds after [18F]CPFPX injection, heparinized arterial blood samples (4 mL) were withdrawn every 6 seconds. Thereafter, blood samples were collected at 1:45, 2, 3, 4, 6, 8, 10, 15, 20, 30, 45, 60, 75 and 90 minutes post-injection. An additional blood sample was taken before [18F]CPFPX administration to assess the fraction of free (unbound to plasma proteins) [18F]CPFPX in plasma (denoted by f1), the extraction fraction of pure [18F]CPFPX (E0) and the plasma caffeine level. List mode data was reframed into a dynamic sequence of 6 × 10 seconds, 3 × 20 seconds, 3 × 30 seconds, 4 × 60 seconds, 3 × 150 seconds, and 15 × 300 seconds frames.
Metabolite Analysis
Centrifugation (1000 × g, 3 minutes) separated plasma from whole blood. Radioactivity in whole blood and plasma samples (500 μL), respectively, was measured in an automated gamma counter (1480 WIZARD, Wallac-ADL GmbH, Freiburg, Germany), that is weekly cross-calibrated with the PET scanner using a 68Ge/68Ga-phantom. Whole blood and plasma time-activity curves were decay-corrected for the time of injection.
Metabolite analyses were performed in arterial plasma samples taken at 1 minute, 2 minutes and all sampling times thereafter. Aliquots (0.1 mL) of plasma samples were diluted with methanol / acetonitrile (50/50, v/v, 0.1 mL), vortexed for 20 seconds at room temperature, and centrifuged for 1 minute at 20,000 × g. Aliquots (5 μL) of the clear supernatant were spotted onto thin-layer chromatography (TLC) plates (SIL G-25 UV254 glass plates, Macherey-Nagel, Düren, Germany) and developed with ethyl acetate / hexane 75 / 25 (v / v). An InstantImager (Canberra-Packard GmbH, Dreieich, Germany) was used for TLC analysis.
The total radioactivity extraction fraction of each plasma sample (Ei) was determined by spotting 5 μL (in triplicate) of the clear supernatant and of the untreated plasma onto a TLC plate, which was read out with the same system. The same procedure was applied to plasma samples obtained before tracer injection to assess the extraction fraction of added [18F]CPFPX (E0).
The time course of the fraction of total plasma activity representing the intact ligand (LTLC(t)) was described by fitting the parameters p1 to p4 in Eq. 1 (modified from Watabe et al. (2000)) to the fraction of intact [18F]CPFPX in the plasma samples given by TLC:
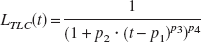
For all t <p1, LTLC(t) was set to 1 (i.e., 100% unchanged ligand in plasma, usually during the first 1–2 minutes). The additional inclusion of the delay parameter p1 (restricted to p1 > 0 minute) and a variable p3 instead of using a fixed value (as done by Watabe et al. (2000) for [11C]MDL100,907) led to a considerably improved fit of the TLC data in case of [18F]CPFPX.
There was a only slight decrease of the total radioactivity extraction fraction over time (falling from virtually 100% to approximately 85–90% at 90 minutes), which precluded to identify all four parameters when fitting Eq. 1 to the time course of the ratio Ei/E0 (Fig. 1). Thus, parameters p1 and p3 were empirically set constant (p1 = 0 minute and p3 = 2), which allowed reasonably good fits (see Fig. 1). To correct the TLC data for the time dependent decrease in extraction efficiency, the fits of the TLC data were multiplied with the respective fits to the Ei/E0 ratio. The product was subsequently used to generate metabolite corrected plasma input functions.
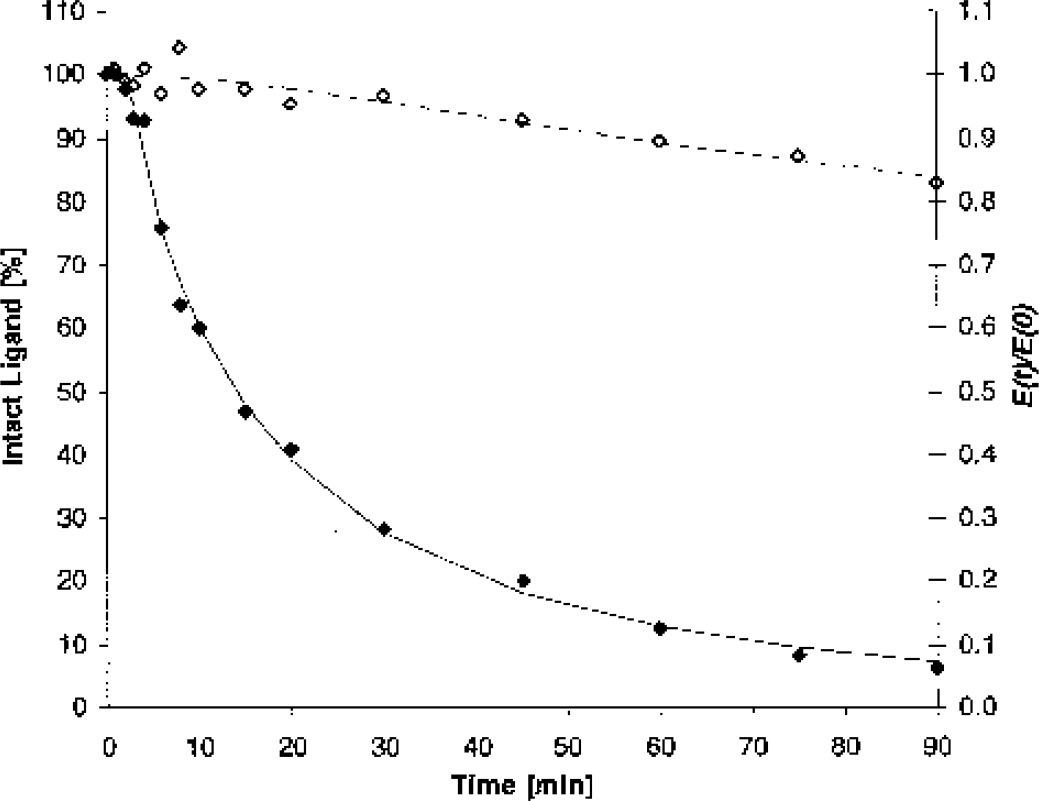
Representative Metabolite Analysis. Closed diamonds (left y-axis) show the time course of the fraction of the intact [18F]CPFPX measured by thin-layer chromatography in arterial plasma of a representative healthy volunteer (same subject as in Fig. 2, Fig. 3 and Fig. 4). The solid line represents the respective non-linear regression fit. Open diamonds (right y-axis) denote the corresponding total radioactivity extraction at each time point in relation to the total radioactivity extraction in a blood sample, which was in vitro incubated with [18F]CPFPX. The broken line represents the respective non-linear regression fit. The time course of intact ligand in arterial plasma, corrected for the slight decrease in extraction efficacy, is given by the product of both fits.
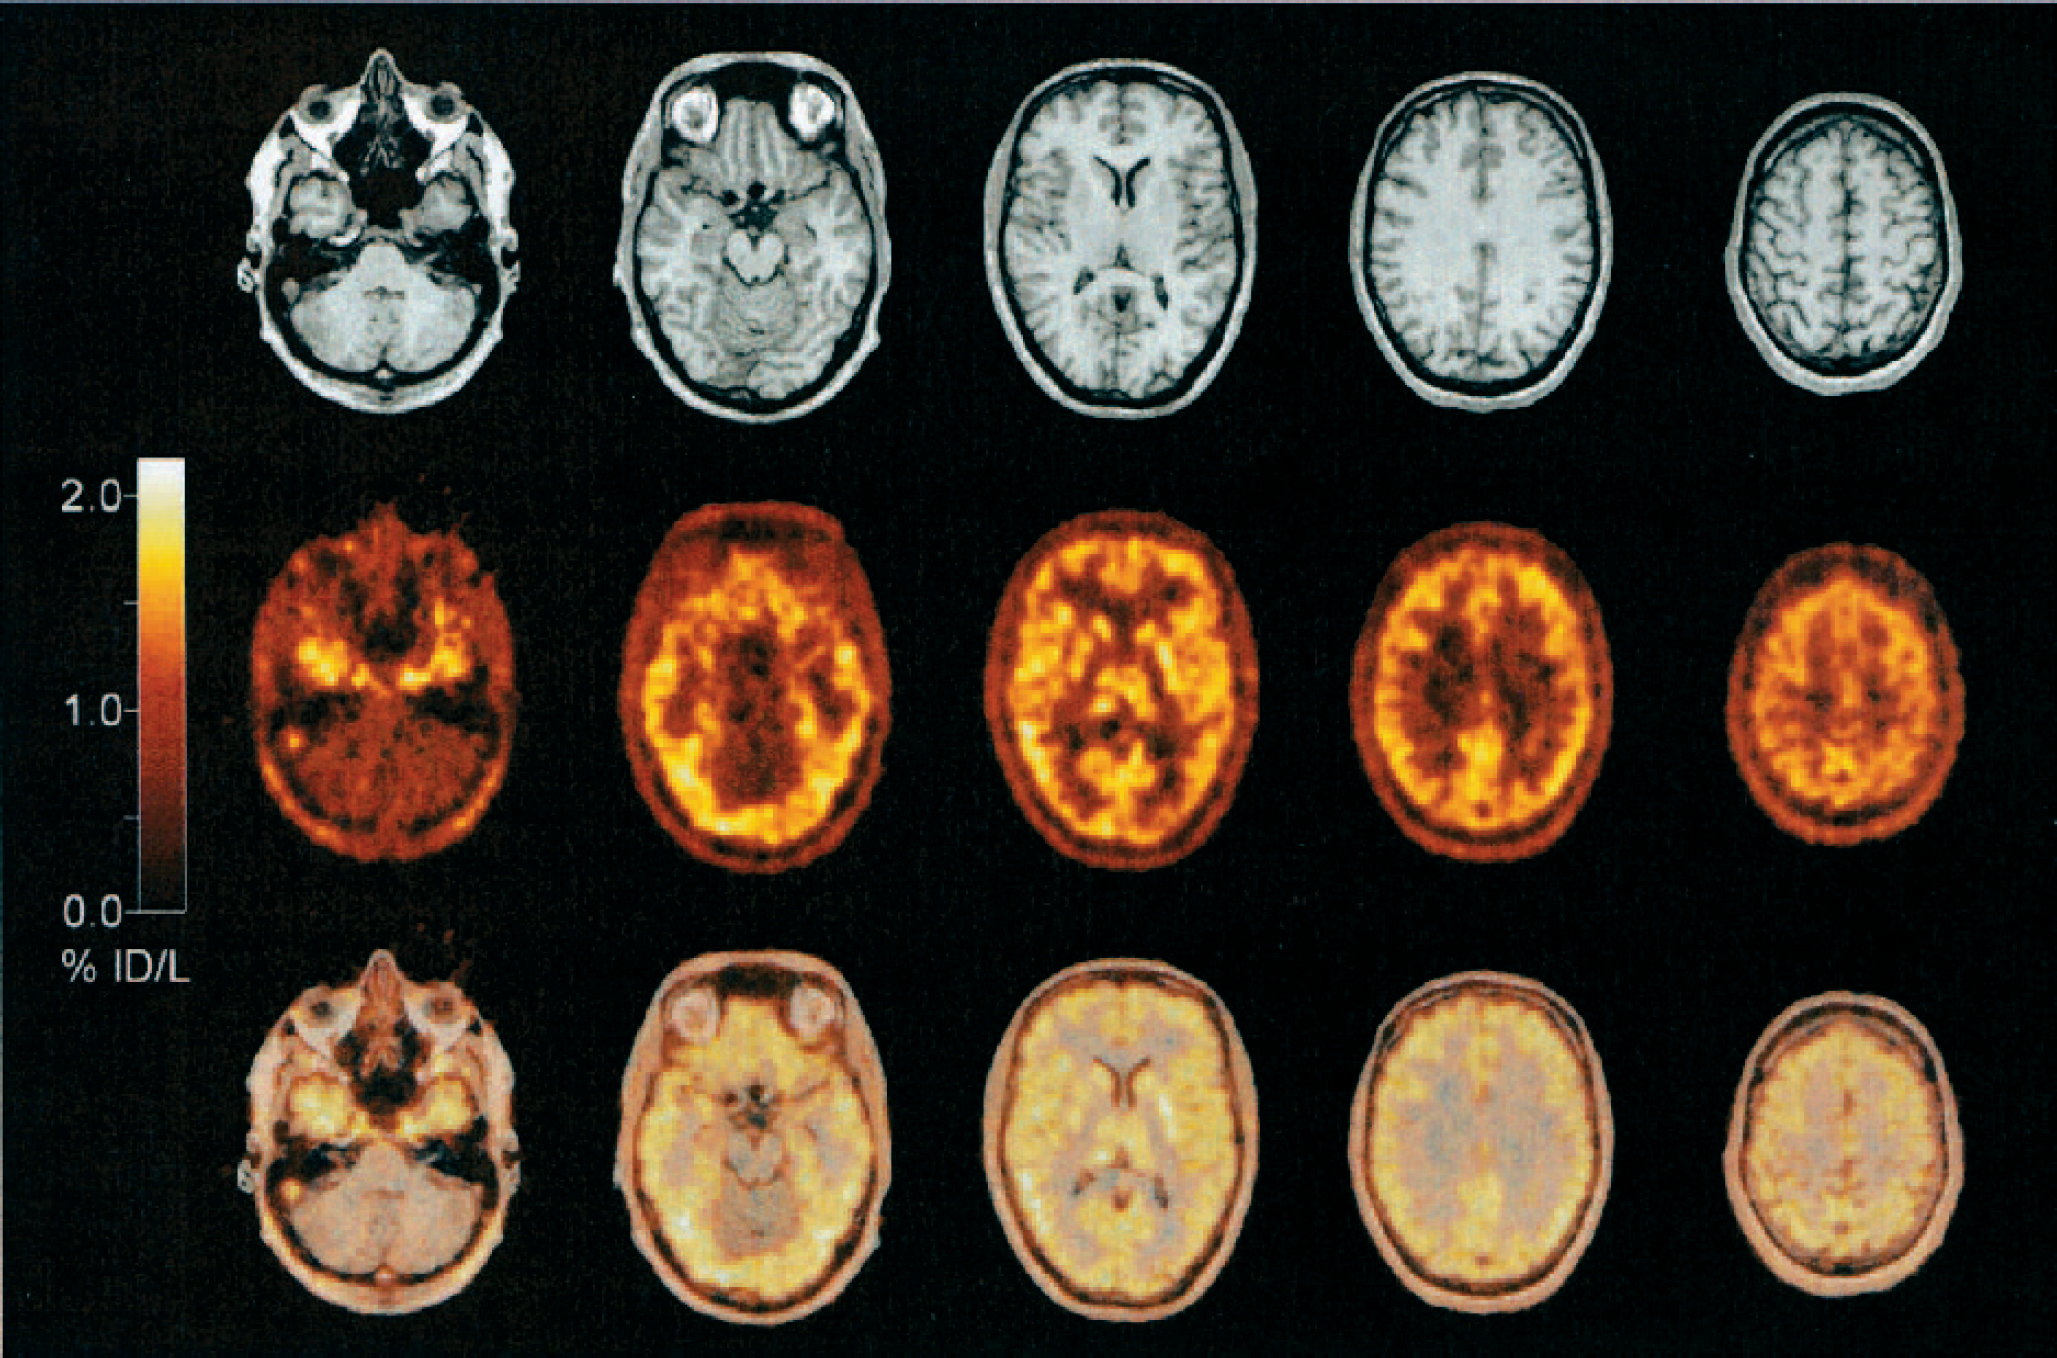
Cerebral Distribution of [18F]CPFPX in Vivo. Individual MRI (upper panel), summed PET (5.5–60 minutes post-injection, accumulated activity in percent injected dose per liter) (middle panel) and PET-MRI-overlay (lower panel) of a representative healthy volunteer (same subject as shown in Fig. 1, Fig. 3, and Fig. 4). The five representative transaxial slices depict the high [18F]CPFPX accumulation in cortical and subcortical grey matter regions. Note the low accumulation of [18F]CPFPX in cerebellum, brainstem and white matter. (%ID/L, percent injected dose per liter)
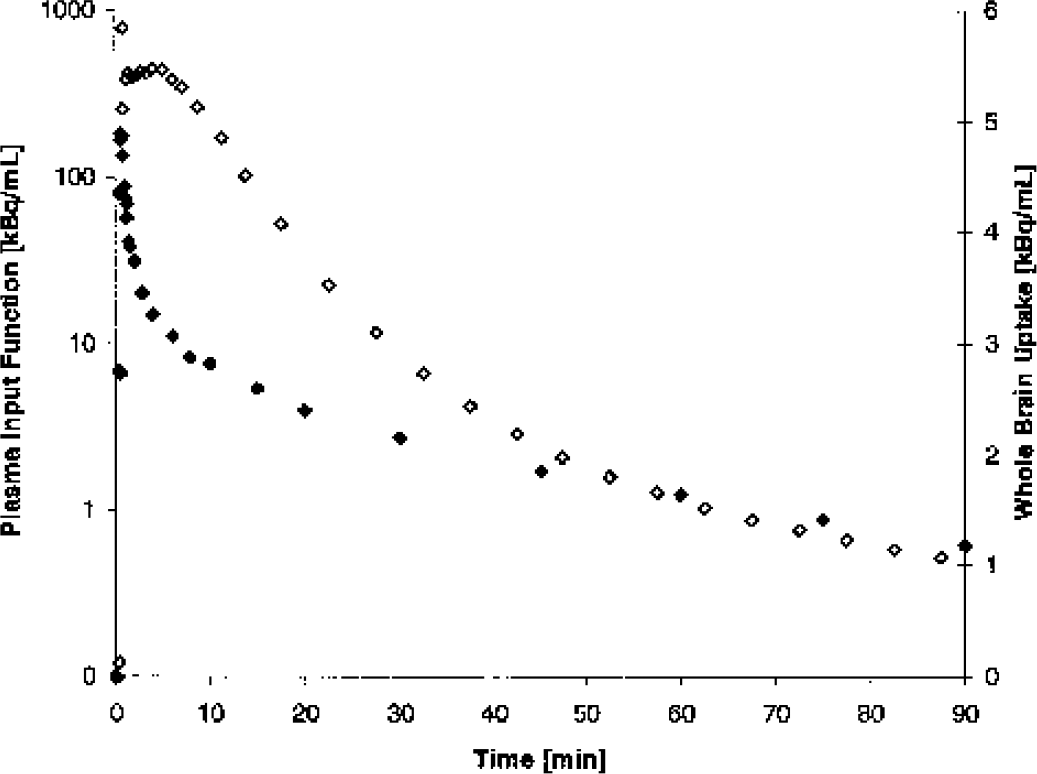
Plasma input function and whole brain uptake of [18F]CPFPX. Closed diamonds (left y-axis, logarithmic scale) denote the metabolite corrected arterial plasma input function of [18F]CPFPX in a representative healthy volunteer (same subject as in Fig. 1, Fig. 2 and Fig. 4). Open diamonds (right y-axis) show the corresponding time course of the whole brain [18F]CPFPX uptake (not corrected for blood volume).
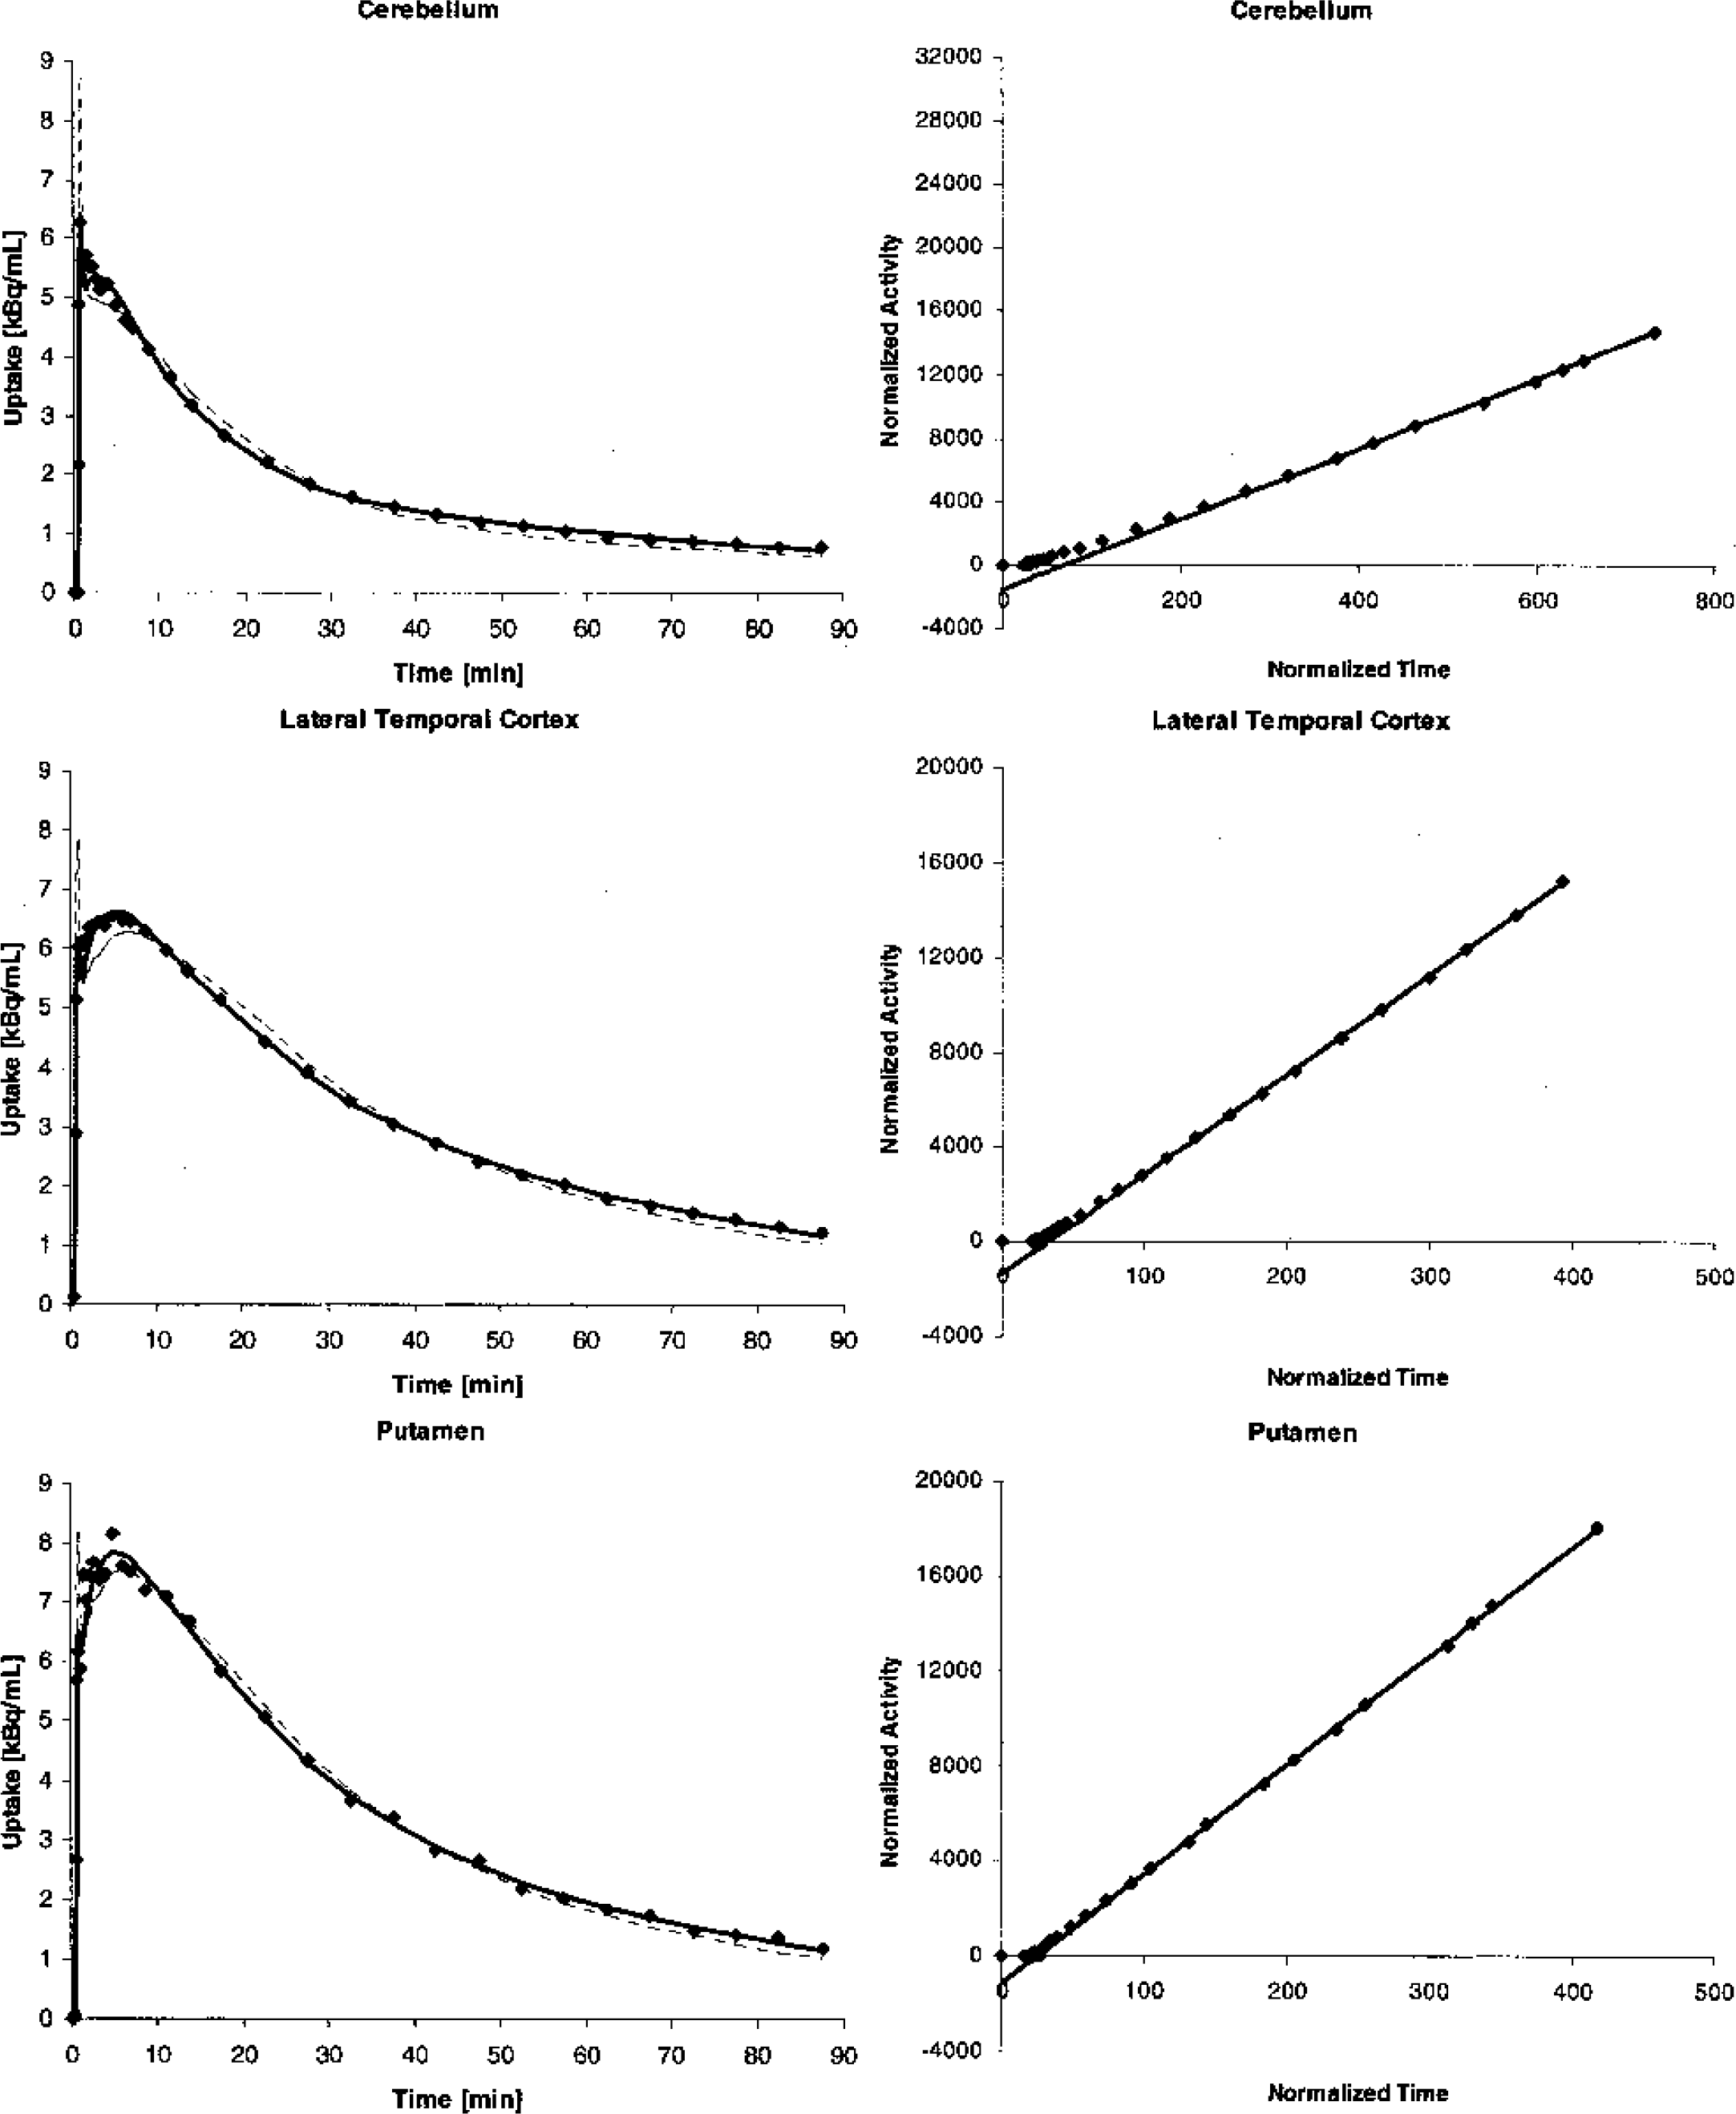
Representative Time-Activity Curves, Compartment Model Fits and Graphical Analyses Plots. Scatter plots on the left depict the time-activity curves (without blood volume correction) for cerebellum (top), lateral temporal cortex (middle) and putamen (bottom) of a representative healthy volunteer (same subject as in Fig. 1, Fig. 2 and Fig. 3). The broken line represents the curve fit given by a one-tissue compartment model, the solid line represents the curve fit of the two-tissue compartment model. Plots on the right show the corresponding graphical analyses. The slopes of the linear regression lines equal the total distribution volume of [18F]CPFPX in the respective region (after blood volume correction assuming a fractional blood volume of 5%).
Plasma caffeine levels were assessed by HPLC (in triplicate). Individual f1 values were determined by ultrafiltration (in triplicate).
Image Analyses
An interactive three-dimensional image registration software (MPI-Tool version 3.35, ATV, Erftstadt, Germany) (Pietrzyk et al., 1994) was used to align the individual MRI data sets according to the anterior commissure/posterior commissure line. In each subject, a summed PET image (5.5 to 60 minutes post-injection) was manually co-registered to the realigned MRI. Registration parameters were subsequently applied to each dynamic frame. Errors of manual co-registration using the MPI-Tool software were reported to be below 2 mm (Pietrzyk et al., 1994), which compares favorable with the spatial resolution of the employed PET scanner (6 mm FWHM). Volumes of interest (VOI) were defined by freehand drawing of polygonal ROI onto the individual MR images and subsequently superimposed onto the PET frames using a dedicated software package (PMOD, version 2.45, PMOD Group, Zurich, Switzerland, www.pmod.com) (Burger and Buck, 1997; Mikolajczyk et al., 1998). Side-averaged, decay-corrected time-activity curves were generated for the following cerebral regions: dorsal prefrontal cortex (mean total volume of left and right side = 188.9 ± 22.7 mL), oribitofrontal cortex (40.4 ± 6.5 mL), lateral temporal cortex (129.2 ± 14.7 mL), mesial temporal lobe including amygdala, hippocampus and mesial temporal cortex (19.4 ± 2.0 mL), parietal cortex (87.9 ± 8.1 mL), occipital cortex (94.5 ± 9.9mL), precentral gyrus (35.0 ± 3.7 mL), postcentral gyrus (30.5 ± 3.2 mL), cingulate gyrus (32.0 ± 2.7mL), insula (18.6 ± 2.5 mL), thalamus (10.7 ± 0.6 mL), putamen (8.2 ± 0.8 mL), caudate nucleus (7.9 ± 0.7 mL), cerebellum (112.3 ± 15.6 mL), pons (14.9 ± 1.9 mL) and whole brain (1431.7 ± 88.9 mL).
Kinetic analyses
Compartmental analyses
Two-tissue compartment model
A standard two-tissue compartment model (2TCM) was used for the kinetic analyses of [18F]CPFPX binding to cerebral A1ARs after a single bolus injection. The compartment model consists of an arterial plasma input function Cp and two tissue compartments. The first tissue compartment represents the combined compartment of the free and the non-specifically bound ligand, which are assumed to equilibrate rapidly so that they can be treated as a single compartment Cf+ns (Mintun et al., 1984). The second tissue compartment Cs consists of the ligand specifically bound to A1ARs. The unidirectional first-order rate constants K1 [mL·mL−1·min−1] and k2 [min−1] describe the transfer from Cp to Cf+ns and backwards, respectively. Likewise, k3 [min−1] and k4 [min−1] describe the transfer from Cf+ns to Cs and backwards, respectively. Eqs. 2 and 3 define k3 and k4:
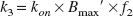

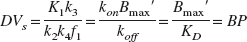
Parameters kon [(nmol/L)−1·min−1] and koff [min−1] are the association and dissociation constants of the ligand-receptor complex, respectively. Bmax′ [nmol/L] is the maximum concentration of available receptors (non-occupied) and f2 [unitless] is the fraction of free ligand in the tissue (Mintun et al., 1984; Laruelle et al., 1994). The regional activity concentration measured by PET (CPET) summarizes both tissue compartments and a fractional blood volume (VB) component. This can be expressed as a function of time by:

Ca(t) represents the activity concentration in arterial whole blood at a time t. Differential equations (5) and (6) describe the change of ligand concentrations over time in the tissue compartments (Mintun et al., 1984):

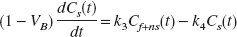
At time of equilibrium te, i.e., when net transfer between compartments equals zero, the left hand terms of Eq. 5 and Eq. 6 equal zero. Rearrangement of Eqs. 5 and 6 gives the following relationships between the compartmental rate constants and the equilibrium volumes of distribution of both tissue compartments Cf+ns (DVf+ns) and Cs(DVs) (Laruelle et al., 1994):
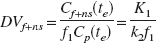
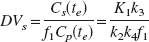
The sum of DVf+ns and DVs is equal to the total volume of distribution of the ligand in tissue (DVt). Parameter f1 denotes the fraction of free ligand in plasma.
With f2 being equal DV−1f+ns (Abi-Dargham et al., 1994), insertion of Eqs. 2, 3 and 7 into Eq. 8 yields the definition of the binding potential (BP), which represents the ratio of Bmax' to the equilibrium dissociation rate constant of the ligand-receptor complex (KD [nmol/L]) (Mintun et al., 1984):
Using the regional time-activity curves, the metabolite-corrected arterial plasma input curve, and the arterial whole blood time-activity curve, the individual rate constants K1, k2, k3, and k4 and the regional VB-term were fitted by weighted non-linear regression analyses for each VOI in each subject using the Levenberg-Marquart least squares minimization algorithm as implemented in the PMOD software. The residuals were weighted by the inverse of the variance of the total count rate in each frame. The variance was calculated as the squared standard deviation of the total number of trues within the respective sinogram. The standard deviation of the count rate in each frame i (SD(Ri)) was calculated according to the following formula (Eq. 10) (Lammertsma, 2003), which incorporates an appropriate decay correction factor (Fi) as decay-corrected data was fitted:
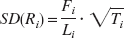
where Ti represents the total number of trues in a frame of the length Li.
Before fitting the individual rate constants, a term for the delay of the arterial input function relative to the tissue response was fitted for the respective subject's whole brain time-activity curve and kept constant throughout the following analyses. Parameter estimates generated by fitting each subject's whole brain data were used as an initial parameter set for the fitting of the regional data. It was found, that the fitting algorithm converged very reproducibly to the same or a very closely related parameter set, even if, for instance, k2 and k3 were varied inversely by one order of magnitude. The standard error of each parameter at convergence (taken from the respective diagonal of the covariance matrix, multiplied by the square root of the degree of freedom adjusted chi square), was taken as a measure of the precision of the estimate and expressed as percentage of the mean (coefficient of variation, %CV). Since the concentration of the total (bound and free) ligand in arterial plasma was used as an input function, binding measures not corrected for the plasma protein bound fraction of the ligand were gained (BP′ and DVt′). BP and DVt were calculated by dividing BP′ and DVt′, respectively, by f1.
One-tissue compartment model
Cf+ns and Cs may be kinetically indistinguishable if rapid equilibration occurs between both compartments (Koeppe et al., 1991). Thus, from an analytical point of view the 2TCM collapses into an one-tissue compartment model (1TCM) containing free, non-specifically and specifically bound ligand in a single tissue compartment. Under this condition, the rate constants k2, k3, and k4 can be lumped together to form a composite rate constant (k2′ [min−1]) (Koeppe et al., 1991):
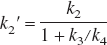
Thus, DVt can be calculated as:

As for the 2TCM, the individual rate constants K1 and k2′ and the VB-term were fitted for each VOI in each subject using the PMOD software.
Graphical analysis
In addition to the compartment analyses Logan's graphical analysis (GA) (Logan et al., 1990) was used to determine DVt. In GA, the DVt is given by the slope of the linear part of the following equation, which describes the dynamic of reversible ligand binding:
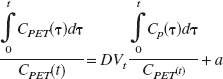
with Cp(t) being the input function of the free ligand (accounting for f1) in arterial plasma. The time t∗ determines the time lag after which the intercept term a becomes constant and the relationship between the left hand and the right hand fractional expression linear. t∗ was determined for each region in each volunteer separately. Prior to GA regional time-activity curves were corrected for the fractional blood volume within each VOI assuming a VB of 5% (Leenders et al., 1990).
Comparison of the different analyses
The goodness of fit achieved by the 2TCM and the 1TCM was compared by calculating the Akaike Information Criterion (AIC) (Akaike, 1974) and an F-test as described by Landaw and DiStefano (1984). The DVt values provided by the 2TCM, 1TCM and GA were compared by linear regression analyses. A possible association between the regional binding estimates (DVt' and DVt) and mass of injected CPFPX and plasma caffeine levels, respectively, was explored by Spearman's non-parametric correlation coefficient.
RESULTS
Metabolite analyses
Fig. 1 shows a representative example of the time course of the [18F]CPFPX degradation as given by TLC analysis of arterial plasma samples. Subjects' metabolite data could all be well fitted by Eq. 1, the mean parameter being:p1 = 2.1 ± 0.9 minute, p2 = 0.07 ± 0.02, p3 = 0.98 ± 0.28, and p4 = 1.78 ± 1.03. The Ei/E0 ratio fell slightly during the 90 minute scan to 0.87 ± 0.03 (Fig 1). The time course of the Ei/ E0 ratio could also be well fitted by Eq. 1 with p1 and p3 being constrained to 0 minute and 2, respectively, the mean parameters being:p2 = 0.0014 ± 0.0011 and p4 = 0.054 ± 0.014. The mean fraction of intact ligand in arterial plasma was 50% at approximately 11 mintues post-injection and less than 10% after approximately 60 minutes. The average f1 value was 1.18 ± 0.28%.
Cerebral uptake and distribution of [18F]CPFPX
Fig. 2 depicts the typical distribution of [18F]CPFPX in the human brain (summed image, 5.5–60 minutes post-injection), which is in agreement with the known in vitro distribution of cerebral A1ARs (Fastbom et al. 1987a; Svenningsson et al., 1997; Bauer et al., 2003a). Fig. 3 shows a representative whole brain time-activity curve and the corresponding arterial input function. [18F]CPFPX showed a rapid brain uptake reaching a maximum of 2.3 ± 0.4% of the injected dose (%ID) (1.6 ± 0.22%ID/L) at 4.2 ± 1.1 minutes post-injection (corrected for an assumed cerebral blood volume of 5%). Depending on the regional A1AR density, regional time-activity curves (VB corrected) peaked approximately 2 to 8 minutes post-injection (later in regions with higher A1AR densities), followed by a rapid washout (Fig. 4).
Kinetic analyses
Two-tissue compartment model
The results of the 2TCM are summarized in Table 1, representative curve fits are given in Fig. 4. The regional distribution and magnitude of VB are in good agreement with the known distribution of the regional cerebral blood volume in healthy subjects (Leenders et al., 1990). The average %CV of the regional VB estimates range 7 to 12% in cortical structures, being higher in the smaller subcortical nuclei (18–20%; exceeding 20% only in five subcortical regions). Similarly, the regional distribution of K1 values is in good agreement with the regional cerebral perfusion pattern in healthy controls (Leenders et al., 1990). The average %CV of the K1 and k2 estimates range 2–7% (highest in pons; exceeding 10% in no single region) and 7–12%, respectively. Particularly k2 was less precisely defined in subcortical structures (average %CV = 14–17%; exceeding 20% 4 times in subcortical regions and 3 times in cortical regions [insula and mesiotemporal]).
Results of the two-tissue compartment model (2TCM) analyses
FRO-D, dorsal frontal cortex; FRO-O, orbitofrontal cortex; TEMP-L, lateral temporal cortex; PAR, parietal cortex; OCC, occipital cortex; TEMP-M, mesiotemporal region; PREC/POSTC, pre-/postcentral gyrus; CING, cingulate gyrus; INS, insula; PUT, putamen; NCD, caudate nucleus; THAL, thalamus; CBL, cerebellum; PONS, pons; VB, fractional blood volume [%}; %CV, coefficient of variation of the parameter estimate [%]; AIC, Akaike Information Criterion [unitless]. For definition of K1 mL · mL−1 · min−1], k2 [min−1], k3 [min−1], and k4 [min−1], BP′ [unitless], DV′ t [unitless], BP [unitless], DVt [unitless] see text. All values are given as mean ± standard deviation.
The parameter estimations of k4 and particularly k3 suffer from low to very low precision (average %CV ranging 16 to 32% and 24 to 59%, respectively), being worst defined in subcortical structures. Neither does k3 reflect the distribution of cerebral A1ARs, nor is the magnitude of k4 homogeneous across different regions, as might be expected based on their postulated physiological meaning (see Eq. 2 and 3). Similarly, the macro parameter BP′ is associated with a high %CV, being on average 9 to 15% in cortical structures (exceeding 20% twice in the insula and once in the mesiotemporal region) and 20 to 24% in subcortical nuclei (exceeding 20% in 7 cases, but remaining always below 40%). The regional BP (and BP′) estimates show no clear relationship to the distribution of cerebral A1ARs. In fact, the BP (being equivalent to DVs) accounts for only 25 − 38% (mean = 29%) of the DVt.
In contrast, the %CV of an individual DVt′ never exceeds 5% except in one case (pons, 9%), mostly ranging from 1–3%. Furthermore, the mean regional estimates of DVt′ (and consequently DVt) correspond to the known distribution of cerebral A1ARs.
One-tissue compartment model
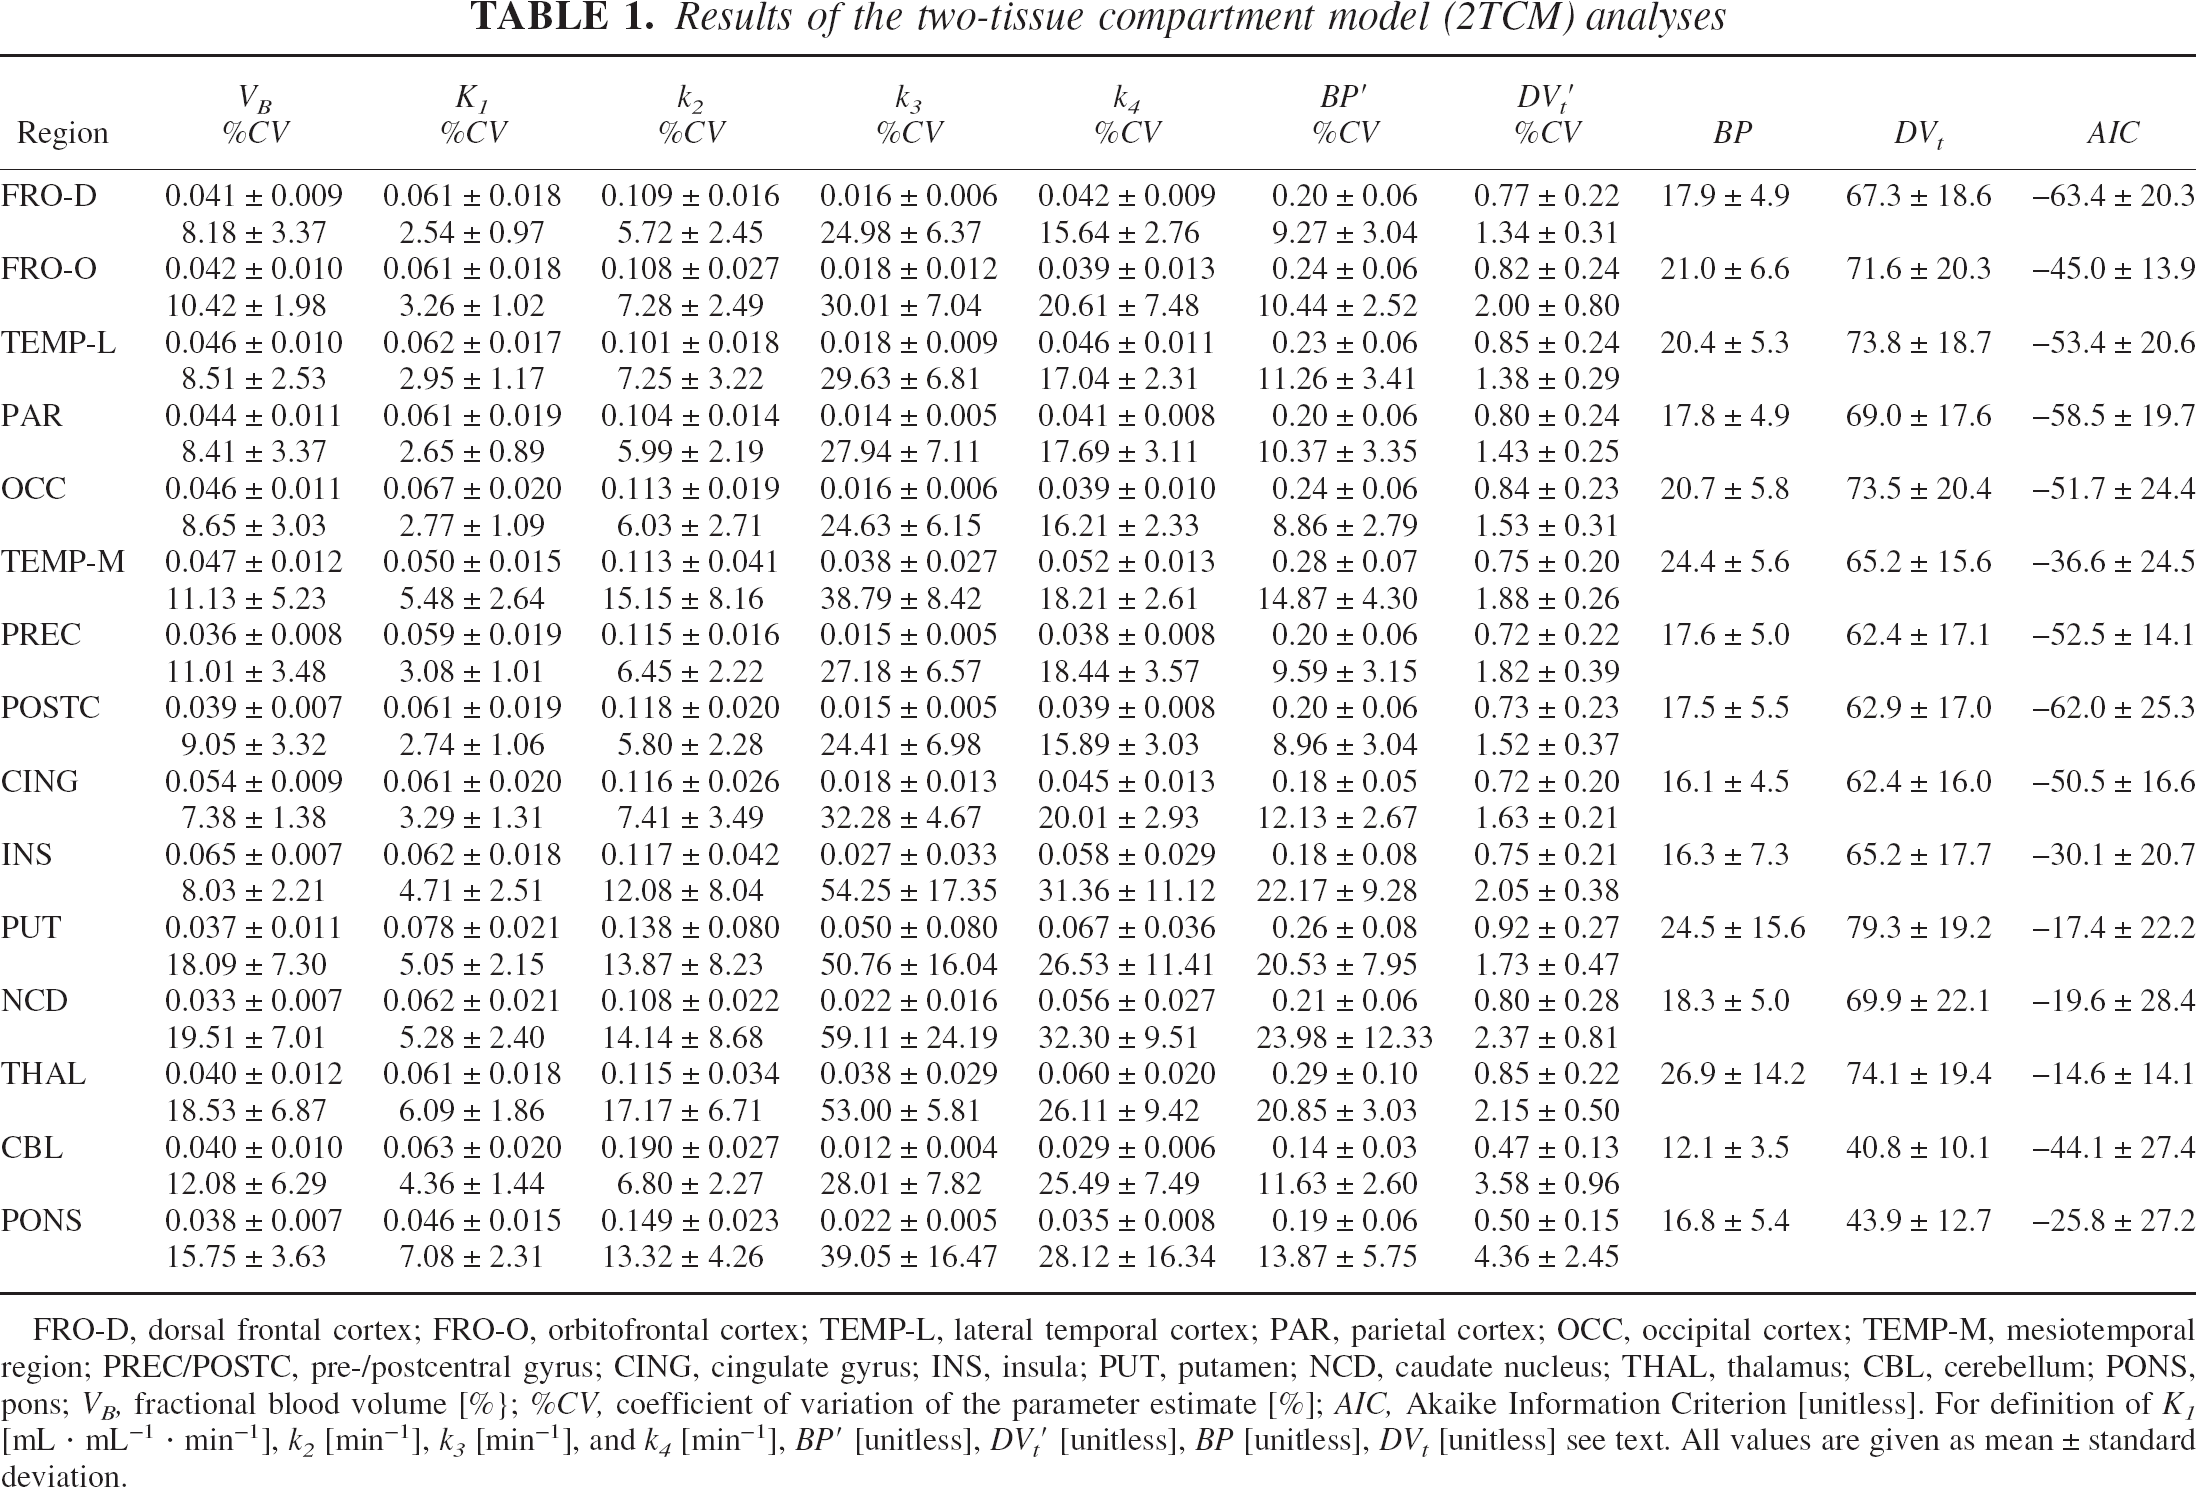
The results of the 1TCM are given in Table 2, representative curve fits are displayed in Fig. 4. The regional distribution of K1 and VB values is in good agreement with the known distribution of regional cerebral perfusion and regional cerebral blood volume (Leenders et al., 1990). In absolute terms, VB (ranging 6–8%) was found to be higher than expected (5%). There is a strong correlation between the 1TCM and the 2TCM in regard of the regional K1 (linear regression: slope = 0.86, intercept = −0.003, r2 = 0.96) and VB values (linear regression: slope = 0.94, intercept = 0.023, r2 = 0.83). However, the regional K1 and VB values yielded from the 1TCM are on average 19.3 ± 5.2% lower and 51.5 ± 19.4% higher, respectively, than the corresponding values given by the 2TCM. The individual estimates of VB given by the 1TCM are associated with a comparable %CV as in the 2TCM (on average ranging 8–13% in cortical regions and 14–16% in subcortical regions, never exceeding 20% in any region). The average %CV of the K1 and k2′ estimates range from 3 to 6% and from 3 to 7% (always below 10%, exceeding 5% only in cerebellum and pons), respectively. Likewise, the estimates of the DVt' are associated with high estimate precision (%CV always below 5%, exceeding 3% only in cerebellum and pons).
Results of the one-tissue compartment model (1TCM) analyses
For abbreviations see Table 1.
Graphical analysis
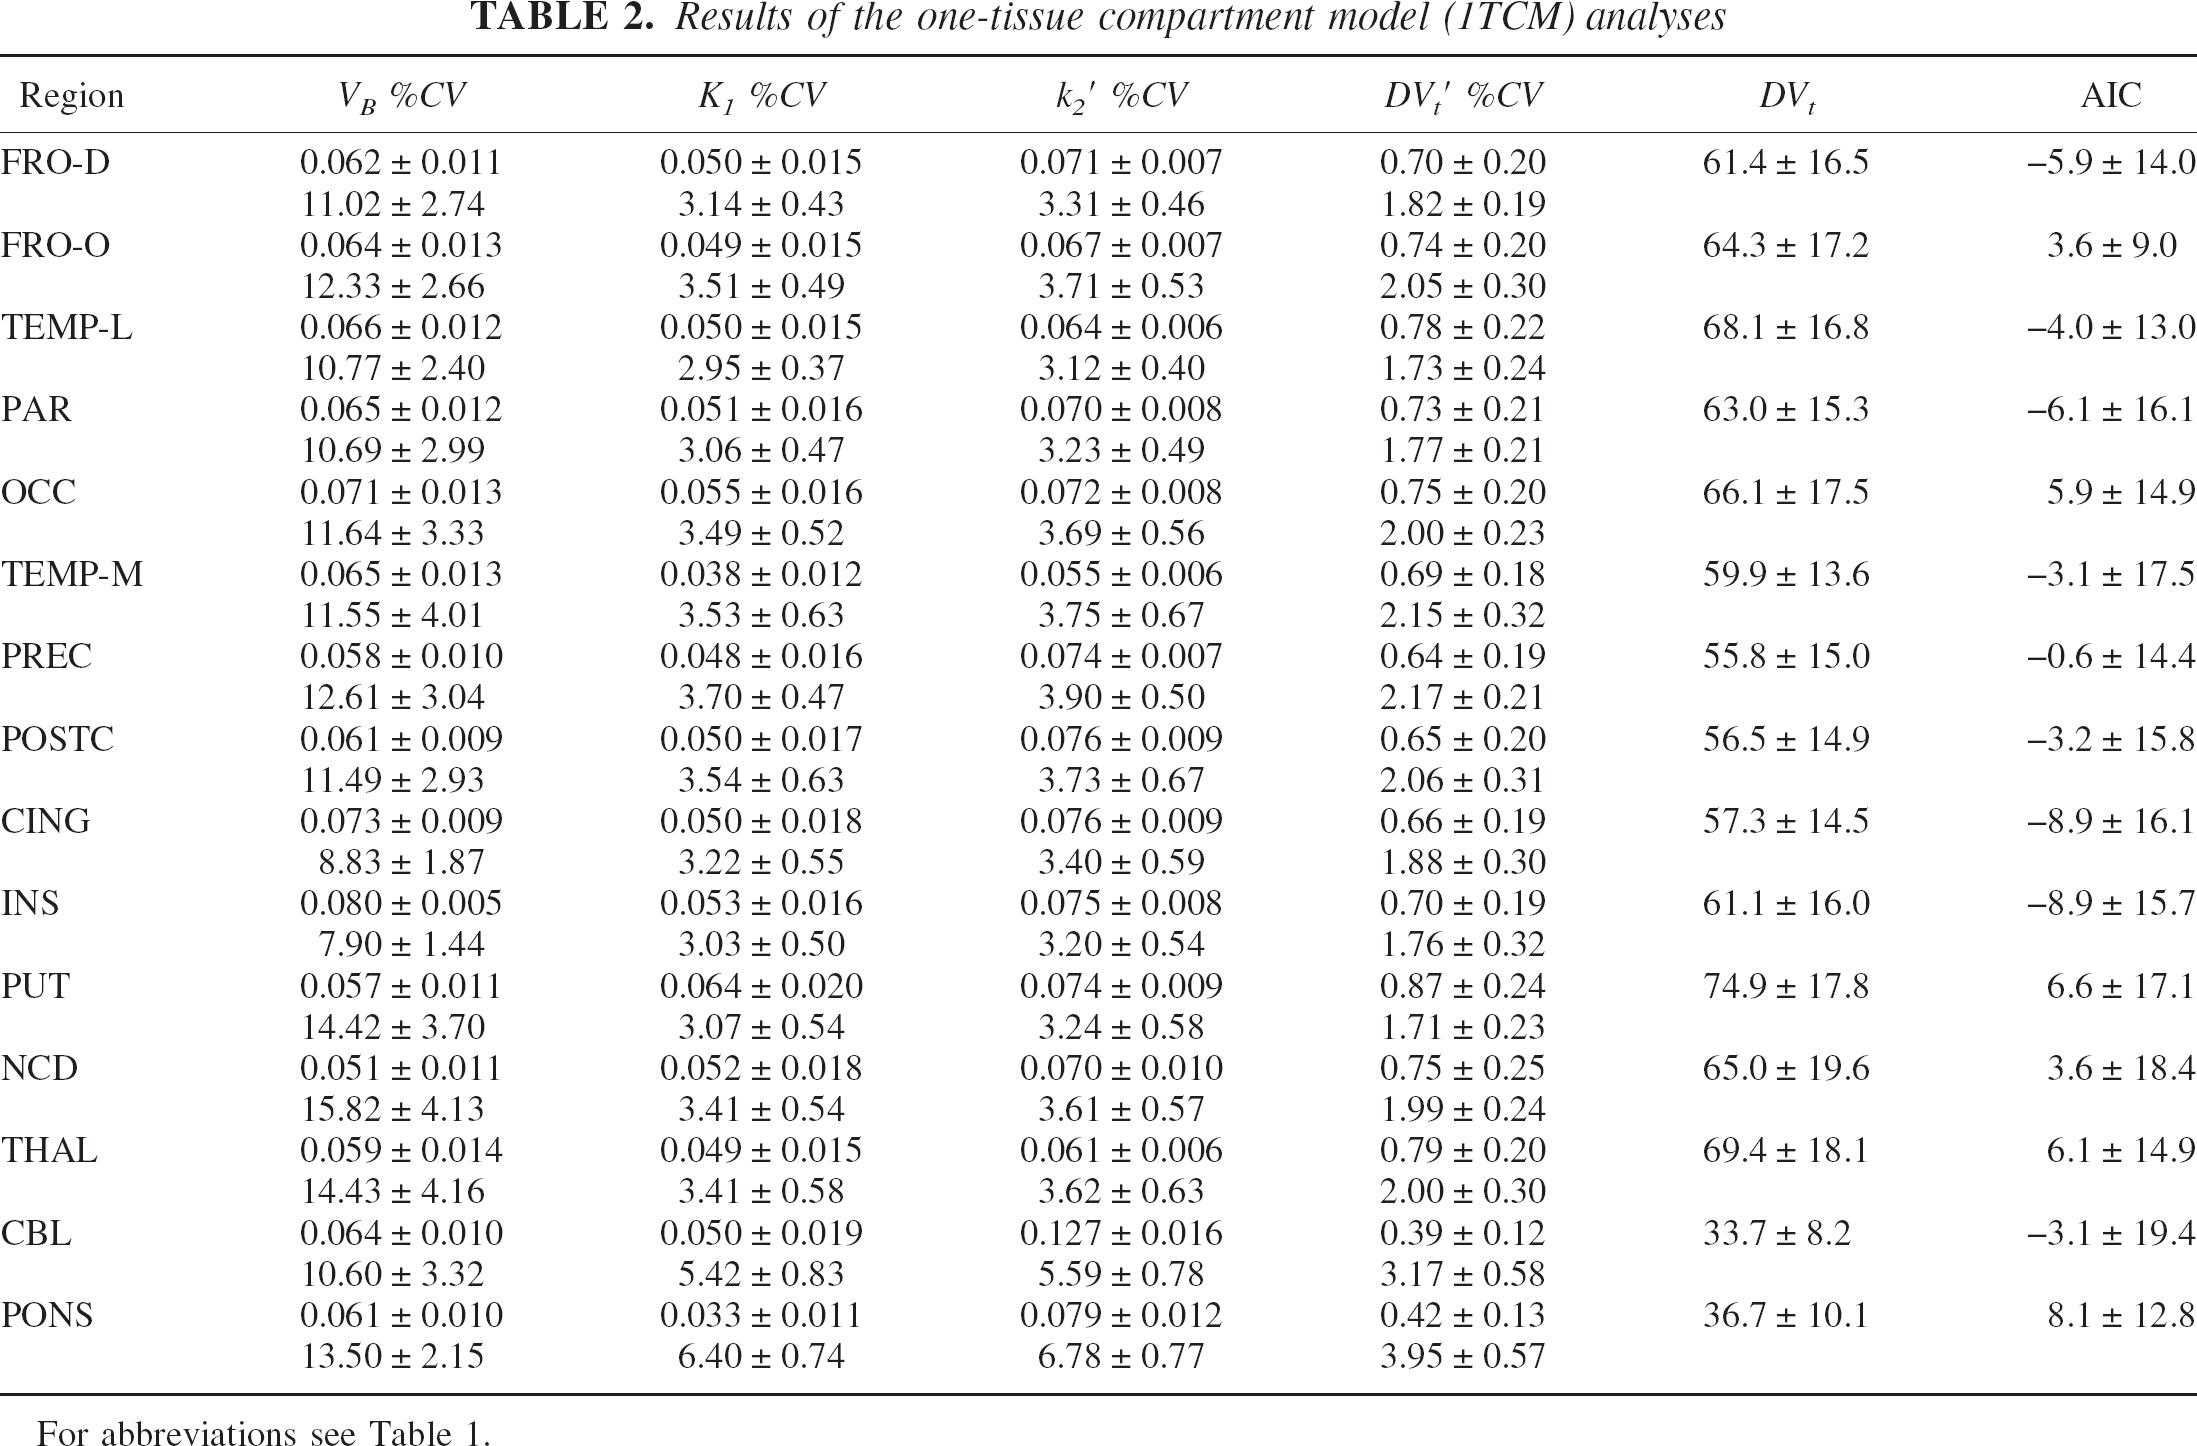
The results of the GA are summarized in Table 3, representative GA plots are shown in Fig. 4. The time lag t∗ after which the Logan plot turned linear ranged between 25 and 35 minutes, except in the cerebellum where t∗ was 40 minutes in one case and in the caudate nucleus where t∗ always fell between 15 and 25 minutes.
Results of the graphical analyses (GA)
For abbreviations see Table 1; t∗, start of linear segment of the GA plot [min].
Comparison between different kinetic analyses
As shown by the AIC (Table 1 and Table 2) and in Fig. 4, the 2TCM fits the cerebral kinetics of [18F]CPFPX considerably better than the 1TCM. Of 90 VOI tested (6 subjects × 15 VOI per subject), this difference is significant in all regions (F test, all p < 0.001, except insula VOI in one volunteer: p < 0.003).
The results of the linear regression analyses between the individual DVt′ and DVt values, respectively, given by the different analyses are summarized in Table 4. As shown in Fig. 5, the 1TCM analysis considerably underestimates DVt′ (and consequently DVt) compared to the 2TCM. Depending on the absolute value of DVt′ and DVt, the mean regional underestimation ranges between 5.4% (putamen; mean absolute DVt underestimation = 4.4) and 17.5% (cerebellum; mean absolute DVt underestimation = 7.2). In contrast, the linear regression fits between the DVt′ and DVt values, respectively, given by the GA and the 2TCM show only a minimal deviation from the line of identity (see Table 4: barely significantly y-axis intercept in the regression DVt GA vs. DVt 2TCM, while the regression slope is not different from 1). Consequently, the maximum mean regional deviations between the DVt values given by the GA and the 2TCM are rather small, ranging between −5.9% [-2.5 DVt units] in the pons and 3.3% [2.1 DVt units] in the insula.
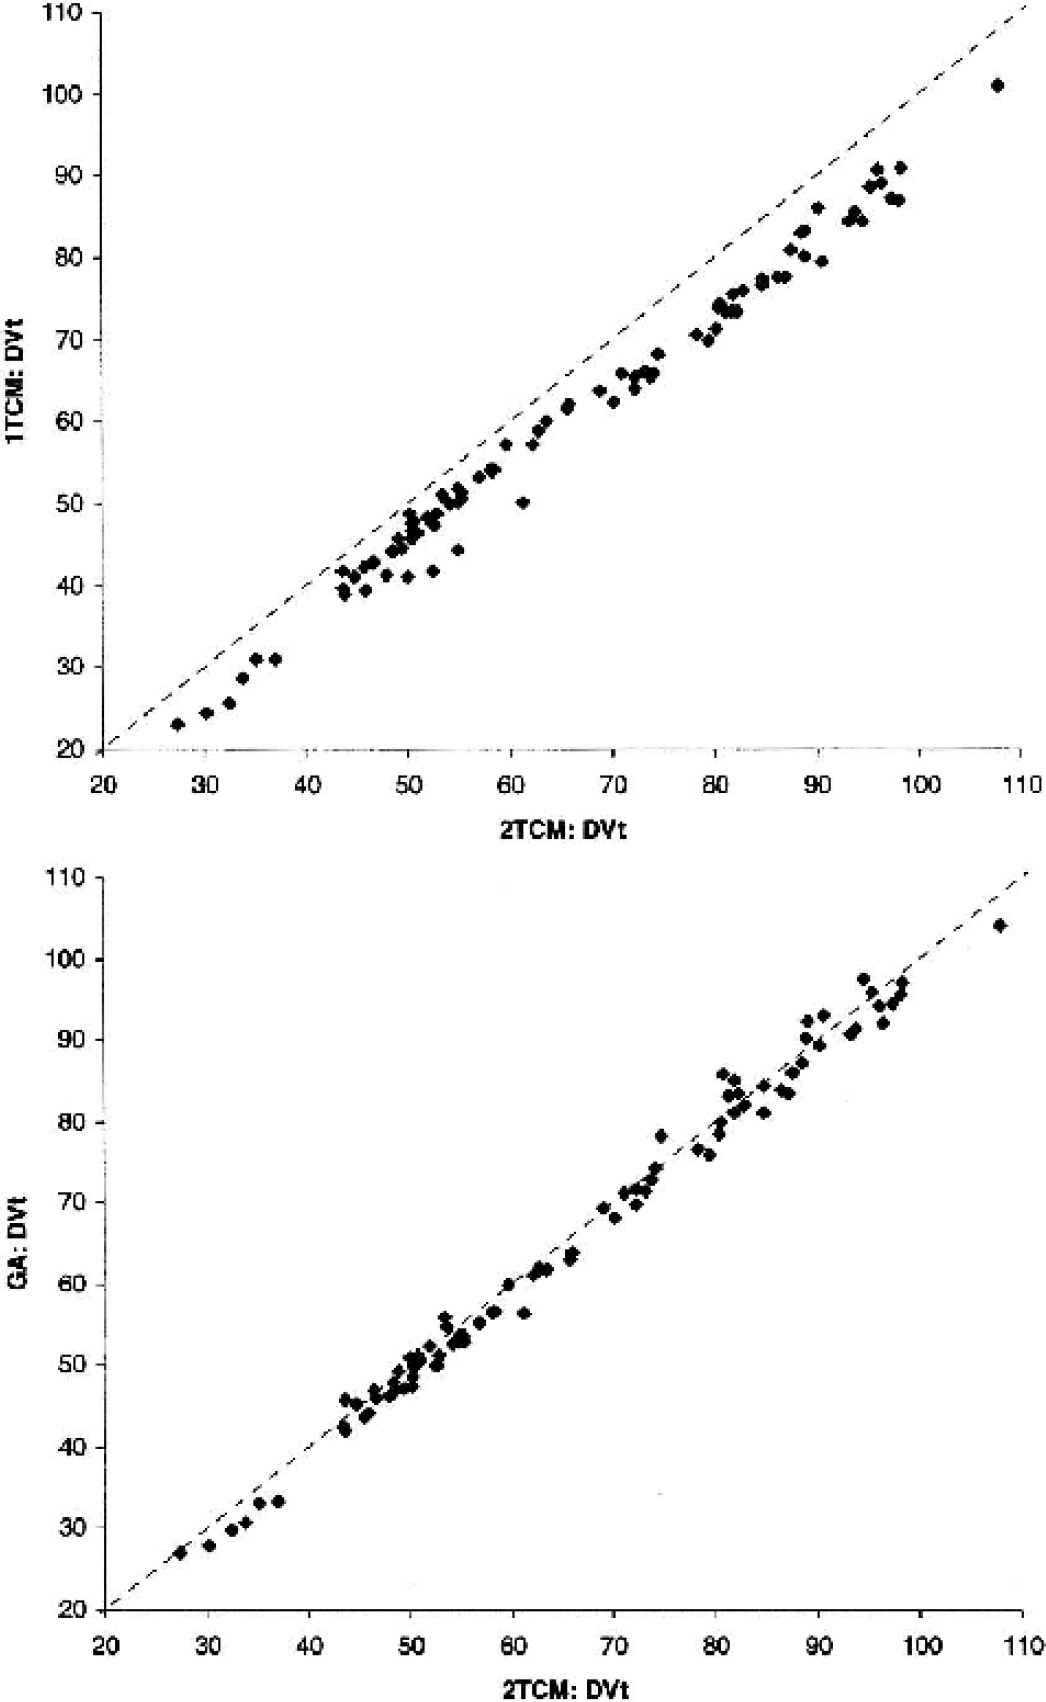
Correlation Between DVt Values Provided by 2TCM, 1TCM and GA. The scatter plot at the top shows the correlation between for the DVt values provided by the 1TCM and the 2TCM analysis. The corresponding correlation between GA and 2TCM is shown below. The dotted lines represent unity. For regression parameters see Table 4.
Results of the linear regression analyses between different kinetic analyses
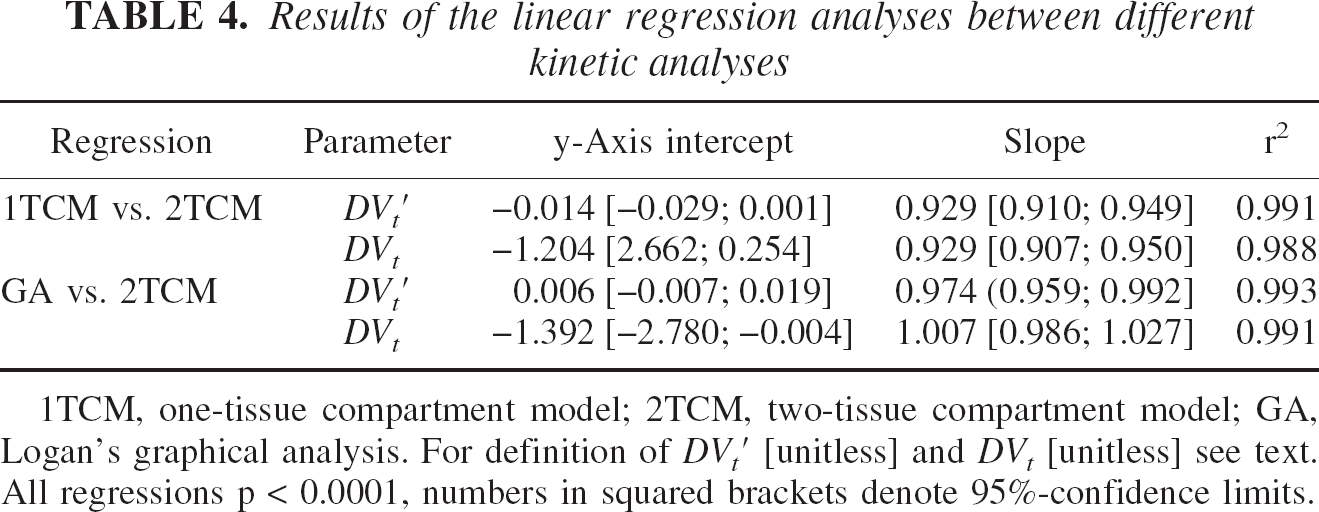
1TCM, one-tissue compartment model; 2TCM, two-tissue compartment model; GA, Logan's graphical analysis. For definition of DV′t [unitless] and DVt [unitless] see text. All regressions p < 0.0001, numbers in squared brackets denote 95%-confidence limits.
The mass of injected CPFPX had no effect on the regional binding parameters DVt ′ and DVt, neither in any region nor in any analysis method. The average plasma caffeine level of the included normal volunteers after requested 24h caffeine abstinence was 0.26 ± 0.14 mg/L (range: 0.13–0.44 mg/L) (for comparison: resorption of 100 mg caffeine, corresponding to one cup of coffee, would lead to a peak plasma caffeine level of approximately 2.5 mg/L). No correlation was found between plasma caffeine levels and binding parameters.
DISCUSSION
The present study is intended to evaluate the applicability of standard compartment models (1TCM and 2TCM) and of Logan's GA (Logan et al., 1990) to quantitatively describe the cerebral kinetics of [18F]CPFPX. [18F]CPFPX is the first PET ligand that has successfully been applied to image A1ARs in the human brain in vivo (Bauer et al., 2003a). It shows several characteristics that make it a promising ligand for the quantitative assessment of cerebral A1ARs: Its cerebral uptake is reversible, peaks rapidly and is in accordance with the in vitro distribution of A1ARs (Fastbom et al. 1987a; Svenningsson et al., 1997; Bauer et al., 2003a). [18F]CPFPX metabolites are considerably more polar and highly unlikely to cross the blood-brain barrier. Brain homogenate extracts in mice demonstrated >98% unchanged ligand at 60 minutes post-injection (Holschbach et al., 2002). The maximum brain uptake of [18F]CPFPX, approximately 2.3%ID, permits dynamic PET studies with adequate image characteristics. The long physical half-life of fluorine-18 (110 minutes) allows a reliable determination of the metabolite-corrected plasma input function at later time points.
The 2TCM fitted the experimental data significantly better than the 1TCM in all regions of all subjects examined. However, due to the high correlation between individual rate constants the 2TCM suffered from high standard errors of the individual parameter estimates, particularly with regard to k3 and k4, and the derived macro parameter BP′. The relative long scan duration of 90 minutes as compared to 60 minutes and the application of residual weighting had only a moderate beneficial impact on estimate precision. A common method to improve the identifiability of individual parameters is to constrain parameters (e.g., k4 (=koff) or the ratio K1/ k2, equal to f1DVf+ns) in all brain regions to a reasonable constant value, assuming that they are homogenous throughout the brain. Since at this stage there is no reliable estimate of k4, the 2TCM cannot be constrained by using a fixed k4.
In vitro animal studies in commonly used laboratory animals (Fastbom et al. 1987b) and PET studies in primates using the A1AR ligands [18F]CPFPX (Boy et al., 1998) and [11C]KF15372 (Wakabayashi et al., 2000) showed a high cerebellar A1AR density. In contrast, human post mortem autoradiographic studies (Fastbom et al. 1987a; Svenningsson et al., 1997; Bauer et al., 2003a) and PET studies (Bauer et al., 2003a) displayed an overall considerably lower density of A1ARs in the cerebellum. Nevertheless, own preliminary bolus/infusion displacement studies in humans showed a specific [18F]CPFPX binding even in regions with lowest binding, which is in agreement with A1AR PET studies in monkeys and cats using [11C]KF15372 (Wakabayashi et al., 2000) and [11C]MDPX (Shimada et al., 2002), respectively. From these studies it can estimated that 25–30% of the cerebellar DVt constitutes specific binding. Under similar circumstances, Watabe et al. (2000) were able to successfully quantify the binding of [11C]MDL100,907 to 5-HT2A receptors by using a constrained 2TCM (called 2T′ in their study), in which the K1/ k2 ratio was constrained to the estimate of the DVf+ns of the cerebellum. The latter estimate has been generated by fitting a 2TCM to the data of the cerebellum, where a low level of displaceable binding was found. In case of [18F]CPFPX, DVf+ns′ (=K1/ k2) accounted for approximately 70% of the cerebellar DVt′ (Table 1), which could be in accordance with our preliminary displacement studies. However, this finding does most likely not reflect a reliable estimate of the cerebellar DVf+ns′, since a relationship of approximately 30:70 of specific:non-specific binding was given by the 2TCM in merely all regions, regardless of the known regional A1AR density. This clearly indicates that the BP′ estimates and the derived BP value do not reflect the amount of specific binding. Alternative approaches to achieve a quantification of the BP include a dual-injection protocol with subsequent injections of high and low specific radioactivities and a bolus/infusion protocol with displacement. The pharmacological and radiochemical characteristics of [18F]CPFPX appear to be particularly well suited to the latter approach.
The 2TCM analyses resulted in highly precise estimates of the DVt′ (and consequently DVt). The same was true for the 1TCM, which, however, gave significantly negatively biased estimates due to its poor fit. In contrast, the GA provided DVt values, that were least biased in comparison to the 2TCM. The largest mean regional deviations occurred in pons (−5.9%) and insula (+3.3%). This might be explained by two reasons. Firstly, all regions were corrected for an assumed homogenous VB component of 5%, which differs from the invasive estimates of 3.8% for pons and 6.5% for insula. Thus, the data of pons and insula might be slightly over- and under-corrected, respectively. Neglecting VB in GA leads to an overestimation of the DVt compared to the 2TCM of approximately 5–12% (depending on regional VB and DVt). Region-specific VB values could be assumed in order to minimize this bias. Secondly, it is well recognized that the Logan's GA method itself is affected by a negative bias in regions with high noise levels (Logan et al., 2001; Slifstein et al., 2000), which additionally might explain the negative bias in small and/or low-binding regions (e.g., pons: −5.9%, cerebellum: −4.3%, caudate nucleus: −3.5%). Several attempt have been made to minimize this bias (Logan et al., 2001; Ichise et al., 2002). Despite these limitations, GA (or a less biased method (Logan et al., 2001; Ichise et al., 2002) is the favored approach because it is computational simple and also applicable on a pixel-level, which allows it to generate parametric images that are amenable to pixel-by-pixel statistical mapping.
At this stage, DVt appears to be the most valid measure to assess the A1AR density in vivo with [18F]CPFPX PET. Because DVt summarizes both specific and non-specific binding, it reflects relative changes of the A1AR density in an attenuated manner, whereby the degree of attenuation is proportional to the regional DVs/ DVt ratio. Preliminary [18F]CPFPX displacement studies in humans demonstrate that specific binding accounts for at least 60% of the total cortical binding. A 10% change of receptor density would then translate into a 6% change of DVt.
Theoretically, DVt is superior to DVt′ as an outcome measure, because of its independence from between-subject or between-condition f1 variations. However, the determination of f1 in the magnitude of 1–2% (as in case of [18F]CPFPX) is technically challenging and threatened by a significant measurement inaccuracy. Therefore, at this stage it is difficult to infer, if a f1 correction is advantageously, e.g. in a diagnostic scenario: We found that there is a weak relationship between DVt′ and f1 in the present study group (r ≈ 0.45–0.59) which leads to a slight decrease of the variation of the regional DVt compared to DVt′ (2TCM, mean regional coefficient of variation, DVt′: 29.0%, DVt: 26.8%). This does not necessarily imply, that the slightly lower variation of the DVt enables a better discrimination between two subject groups with different A1AR densities. In fact, the higher variation of the DVt′ might reflect the true variation caused by unknown factors more closely. Thus the exploration of confounding variables as for example age and caffeine consumption might help to decide, whether a f1 correction is favorably, since the A1AR density can be expected to vary with both age (Cheng et al., 2000; Cunha et al., 2001) and chronic caffeine consumption (Shi and Daly, 1999).
Moreover, the use of DVt′ and DV for inter-individual comparisons relies on the assumption, that DVf+ns is reasonably constant across subjects. Although this can be hardly verified in every subject studied, it can be shown by representative pre-blocking or displacement studies.
In conclusion, [18F]CPFPX shows promising in vivo characteristics as a PET ligand for quantification of cerebral A1ARs. A 2TCM satisfactorily accounts for the cerebral kinetics of [18F]CPFPX, although individual tissue compartments could not be separated using a standard 2TCM. Logan's GA is an attractive alternative method of analysis.
Footnotes
Acknowledgments
The authors gratefully acknowledge the excellent technical assistance of Lutz Tellmann, Elisabeth Theelen, Suzanne Schaden, Hans Herzog, Markus Lang, Barbara Elghahwagi, and Jon Shah (Research Center Juelich) and the valuable advice of Cyrill Burger (PMOD Group, Department of Nuclear Medicine, Universitaetsspital Zurich, Switzerland) on the use of the PMOD software package.