
Abstract
Dopamine transmission in the ventral striatum (VST), a structure which includes the nucleus accumbens, ventral caudate, and ventral putamen, plays a critical role in the pathophysiology of psychotic states and in the reinforcing effects of virtually all drugs of abuse. The aim of this study was to assess the accuracy and precision of measurements of D2 receptor availability in the VST obtained with positron emission tomography on the high-resolution ECAT EXACT HR+ scanner (Siemens Medical Systems, Knoxville, TN, U.S.A.). A method was developed for identification of the boundaries of the VST on coregistered high-resolution magnetic resonance imaging scans. Specific-to-nonspecific partition coefficient (V3″) and binding potential (BP) of [11C]raclopride were measured twice in 10 subjects, using the bolus plus constant infusion method. [11C]Raclopride V3″ in the VST (1.86 ± 0.29) was significantly lower than in the dorsal caudate (DCA, 2.33 ± 0.28) and dorsal putamen (DPU, 2.99 ± 0.26), an observation consistent with postmortem studies. The reproducibility of V3″ and BP were appropriate and similar in VST (V3″ test–retest variability of 8.2% ± 6.2%, intraclass correlation coefficient = 0.83), DCA (7.7% ± 5.1%, 0.77), DPU (6.0% ± 4.1%, 0.71), and striatum as a whole (6.3% ± 4.1%, 0.78). Partial volume effects analysis revealed that activities in the VST were significantly contaminated by counts spilling over from the adjacent DCA and DPU: 70% ± 5% of the specific binding measured in the VST originated from D2 receptors located in the VST, whereas 12% ± 3% and 18% ± 3% were contributed by D2 receptors in the DCA and DPU, respectively. Thus, accuracy of D2 receptor measurement is improved by correction for partial voluming effects. The demonstration of an appropriate accuracy and precision of D2 receptor measurement with [11C]raclopride in the VST is the first critical step toward the use of this ligand in the study of synaptic dopamine transmission at D2 receptors in the VST using endogenous competition techniques.
Dopaminergic mesencephalic projections originating in the midbrain are classically divided into nigrostriatal, mesolimbic, and mesocortical systems (Lindvall and Bjorklund, 1978). The nigrostriatal system projects from the substantia nigra to the dorsal striatum and is involved in sensorimotor coordination and initiation of movement. The mesolimbic system projects from the ventral tegmental area (VTA) to limbic structures such as nucleus the accumbens, hippocampus, and amygdala. The mesocortical system projects from the VTA to cortical regions (mainly medial prefrontal and cingulate cortices). The mesolimbic and mesocortical systems are involved in the regulation of attention, motivation, and drive (Mogenson et al., 1980). Dopaminergic transmission in the nucleus accumbens is centrally involved in the rewarding effects of alcohol and other drugs of abuse (Koob, 1992; Di Chiara, 1995). The therapeutic effects of antipsychotic drugs appear to be related to their ability to block dopamine D2 receptors in the nucleus accumbens (Deutch et al., 1991). Therefore, alterations of dopamine D2 receptor transmission is believed to be involved in a range of neuropsychiatric conditions.
In rodents, the striatum is divided into anatomically well-delineated structures—the nucleus accumbens (“limbic striatum”) and the caudate-putamen (“sensori-motor” striatum). In primates, cortical and subcortical inputs related to the limbic system (limbic lobe and amygdala) project not only to the accumbens, but also to the ventral caudate nucleus and the ventral putamen (Lynd-Balta and Haber, 1994). Thus, in primates, the critical functional organization opposes the limbic-related “ventral striatum” (VST, which includes accumbens, ventral caudate and ventral putamen) and the “dorsal” striatum (dorsal caudate [DCA] and dorsal putamen [DPU]). Until recently, positron emission tomography (PET) and single photon emission computed tomography (SPECT) imaging of striatal D2 receptors has been limited to the striatum as a whole. Because the sizes of the dorsal caudate and putamen are much larger than the size of the VST, the dorsal striatum contributes to the majority of the “striatal signal” when the striatum is analyzed as a whole.
Recent progress in the resolution of PET cameras might allow quantification of radioactive signal from the VST. For example, Drevets et al. (1999, 2001) recently reported that amphetamine-induced displacement of the D2 receptor radiotracer, [11C]raclopride, was larger in the anteroventral striatum compared with the dorsal caudate in baboons and humans, an observation consistent with microdialysis studies showing larger amphetamine-induced dopamine release in the accumbens compared with the caudate-putamen in rodents (Di Chiara et al., 1993). The ability to quantify D2 receptors in the human VST would be extremely valuable in understanding the role of meso-limbic D2 receptor transmission in health and disease.
As a first step toward this goal, the current study evaluated the reproducibility of D2 receptor binding potential (BP) measurements with [11C]raclopride in the VST, DCA, and DPU in 10 healthy volunteers studied twice. The authors used the [11C]raclopride bolus plus constant infusion method as refined by Watabe et al. (2000). [11C]Raclopride was administered as a bolus plus constant infusion for 90 minutes. This infusion protocol allows the establishment of an equilibrium state, generally achieved as early as 40 minutes after initiation of the procedure. Emission data were collected with the high-resolution ECAT EXACT HR+ PET scanner, and data from 40 to 90 minutes were used to calculate distribution volumes in striatal subregions. After a 30-to 60-minute resting period, the experiment was repeated, and the reproducibility of the measurement was evaluated. Because partial volume effects (PVE) were expected to result in significant contamination of activities in the VST by activities originating in the DCA and DPU, PVE correction was applied to the data according to a model of the point spread function of the scanner used in these experiments.
D2 receptor concentration is much less in extrastriatal compared with striatal regions, and [11C]raclopride is generally considered inappropriate for the measurement of extrastriatal D2 receptors. However, given the well-established sensitivity of [11C]raclopride to competition by endogenous dopamine (Volkow et al., 1994; Carson et al., 1997), the authors also investigated the displaceability and reproducibility of thalamic [11C]raclopride uptake in this data set, to assess the feasibility of measuring changes in endogenous dopamine concentration in the thalamus using [11C]raclopride (Volkow et al., 1997).
MATERIALS AND METHODS
Subjects
The authors report here the results of 23 experiments in 13 healthy volunteers. Ten healthy volunteers (4 males, 6 females, aged 33 ± 13 years, range 22 to 59, with these and subsequent values given as mean ± SD) participated in the test–retest study. Subjects were scanned twice on the same day to evaluate the reproducibility of the outcome measures (20 scans). These 20 experiments were acquired successively, and all experiments acquired were included in the analysis, to provide a representative and unbiased estimate of the reproducibility of the measurements. In addition, 3 subjects (27 ± 2.8 years; 1 male and 2 females) participated in an experiment designed to assess the displaceability of [11C]raclopride brain uptake in the thalamus. These subjects underwent one scanning session during which haloperidol was administered after establishment of equilibrium.
The absence of medical, neurologic, and psychiatric history (including alcohol and drug abuse) was assessed by history, review of systems, physical examination, routine blood tests, pregnancy test, urine toxicology, and electrocardiogram. The study was approved by the Columbia Presbyterian Medical Center and New York State Psychiatric Institute Institutional Review Boards, and subjects provided written informed consent after receiving an explanation of the study.
Radiochemistry
O-desmethyl raclopride hydrobromide, precursor for the preparation of [11C]raclopride, was generously provided by the Astra Arcus Pharmaceutical Company (Sodertalje, Sweden). [11C]Methyl triflate was produced by passing [11C]methyl iodide through a silver triflate furnace according to Jewett's procedure (Jewett, 1992). Briefly, 11CO2 was bubbled into a tetrahydrofuran (THF) solution of lithium aluminum hydride. Concentrated hydrogen iodide was added, and [11C]methyl iodide was distilled through a stream of argon through a silver triflate furnace (195°C) to yield [11C]methyl triflate, which was trapped in a solution of O-desmethyl raclopride hydrobromide and sodium hydroxide in dimethylsulfoxide. After a 5-minute reaction at 90°C, the crude product was purified by high pressure liquid chrotomatography (HPLC) (column: Phenomenex C18, 10 micron, 25 × 1 cm; solvent: 30% acetonitrile and 70% 0.1 mol/L ammonium formate-0.5% acetic acid; flow rate: 10 mL/min). The product fraction was diluted with water and passed through a classic C18 Sep-Pak (Waters, Milford, MA, U.S.A.). The final product was recovered from the Sep-Pak using 1 mL ethanol. The ethanol solution was mixed with saline and filtered through a 0.22-micron filter and collected in a sterile vial.
Mean specific activity at the time of injection was 2117 ± 652 Ci/mmol for the test–retest studies (n = 20). No significant differences were observed in the specific activities of the test (2237 ± 717 Ci/mmol, n = 10) and retest (1996 ± 593 Ci/mmol, n =10) studies (paired t-test, P = 0.40). Mean specific activity for the haloperidol experiments was 2600 ± 815 Ci/mmol (n = 3).
Positron emission tomography protocol
Subject preparation included placement of two venous catheters (one for radiotracer infusion and one for blood sampling). Head movement was prevented with a polyurethane head immobilizer system (Soule Medical, Tampa, FL, U.S.A.) molded around the subject's head (Mawlawi et al., 1999).
Test–retest studies.
Positron emission tomography imaging was performed with the ECAT EXACT HR+ PET scanner (Siemens/CTI). In three-dimensional mode, this camera provides an inplane resolution of 4.3 mm, 4.5 mm, 5.4 mm, and 8.0 mm full width at half maximum (FWHM) at a distance of 0, 1, 10, and 20 cm from the center of the field of view (FOV), respectively (Brix et al., 1997). Slice spacing is 2.46 mm, and axial resolution in three-dimensional mode is 4.1, 5.1, and 7.8 mm FWHM at 0, 10, and 20 cm of the FOV. A 15-minute transmission scan was obtained before radiotracer injection for attenuation correction.
[11C]Raclopride was delivered in a 60-mL syringe and administered by a computer-operated pump (IMED pump; Gemini PC-1, San Diego, CA, U.S.A.). At time 0, a bolus dose of 30 mL was given over 3 minutes. At 3 minutes, the rate of infusion was decreased to 0.28 mL min−1 and this rate was maintained for the remaining 87 minutes. The bolus to infusion rate ratio (Kbol) was 1.75 hours (or 105 minutes). This ratio was selected based on the optimization procedure published by Watabe et al. (2000).
Mean activity available in the 60 mL syringe at the time of the initiation of the injection was 18.9 ± 6.5 mCi. Accounting for the decay, mean activity effectively injected was 12.7 ± 4.5 mCi. Activities available for test (19.5 ± 5.9 mCi) and retest studies (18.3 ± 7.4 mCi) were not significantly different (paired t-test, P = 0.58). The injected mass for test (3.3 ± 1.52 μg) and retest (3.26 ± 1.28 μg) studies were not significantly different (P = 0.89). Emission data were collected in the three-dimensional mode for 90 minutes as 24 successive frames of increasing duration (3 * 20 seconds, 2 * 1 min, 2 * 2 min, 1 * 3 min, 16 * 5 min). Reconstruction was performed using a model-based scatter correction technique (Watson et al., 1996), attenuation correction based on transmission data, and a Shepp filter with a cutoff of 0.5 cycles/projection rays.
Haloperidol experiments.
The PET procedure was identical to the one used for the test–retest studies, with the following exceptions: (1) studies were acquired on the ECAT EXACT 47 (three-dimensional in plane and axial resolutions of 6 mm and 4.6 mm FWHM, respectively, at the center of the FOV, slice spacing of 3.375 mm, (Wienhard et al., 1992);(2) total duration of the experiment was 120 minutes (bolus volume of 25.6 mL over 3 minutes; infusion rate of 0.25 mL min−1 for 117 minutes; Kbol of 105 minutes); (3) haloperidol was injected IV over 1 minute at 60 minutes at a dose of 0.2 mg kg−1 (n = 1) or 0.3 mg kg−1 (n = 2). Accounting for the decay, the mean activity effectively injected into the subjects was 14.7 ± 4.9 mCi.
Plasma analysis
[11C]Raclopride plasma concentration was measured in 5 venous samples (40, 50, 60, 70, and 80 minutes). After centrifugation (10 minutes at 1,800 g), plasma activity was measured in a sodium iodide well counter (Wallac 1480 Wizard 3M Automatic Gamma Counter, Gaithersburg, MD, U.S.A.). The parent fraction was measured as follows: plasma (0.5 mL) was pipetted into a centrifuge tube with 0.7 mL of acetonitrile. The tube was mixed and centrifuged (3.5 minutes at 15,000 g). The liquid phase was separated from the precipitate and injected into the HPLC. The HPLC eluate was fraction-collected in 5 counting tubes (4.4 mL each). The precipitate, the 0.1 mL solution, and the HPLC fractions then were counted by a gamma counter. The HPLC system comprised a Waters 510 isocratic pump, a Rheodyne injector equipped with a 2-mL sample loop, a C18 analytical column (Phenomenex, Torrance, CA, U.S.A.; 10 micron, 4.6 × 250 mm), a Bioscan Flow Cell gamma detector (Bioscan, Washington, DC, U.S.A.), and a fraction collector. The column was eluted with a mixture of acetonitrile (33%) and aqueous 0.1 mol/L ammonium formate with 0.5% acetic acid (67%) at a flow rate of 2 mL/min. Before plasma sample analysis, the retention time of the parent tracer was established using the Bioscan gamma counter. The retention times of the metabolites and the parent compound were 2 and 8 minutes, respectively. The parent fraction was calculated as the ratio of the fractions containing the parent to the total amount collected.
Plasma parent concentration at time t was obtained by calculating the product of total plasma activity and the fraction of activity corresponding to the parent compound as measured with HPLC. Plasma parent steady-state concentration (CSS, μCi mL−1) was calculated as the average of the five determinations of plasma parent concentration. Clearance of the parent compound (L h−1) was calculated as the ratio of the infusion rate (mCi h−1) to CSS (Rowland and Tozer, 1989; Abi-Dargham et al., 1994).
For the determination of the plasma free fraction (f1), triplicate 200 μL aliquots of plasma collected before tracer injection were mixed with radiotracer, pipetted into ultrafiltration units (Centrifree, Amicon, Danvers, MA, U.S.A.), and centrifuged at room temperature (20 minutes at 4000 g) (Gandelman et al., 1994). Plasma and ultrafiltrate activities were counted, and f1 was calculated as the ratio of ultrafiltrate activity to total plasma activity. Triplicate aliquots of tracer in pH 7.4 Tris-buffer also were processed to determine the filter retention of free [11C]raclopride.
Magnetic resonance imaging protocol
Magnetic resonance images were acquired on a GE 1.5 T Signa Advantage system. After a sagittal scout (localizer), performed to identify the anterior commissure–posterior commissure (AC-PC) plane (1 minute), a transaxial T1-weighted sequence with 1.5-mm slice thickness was acquired in a coronal plane orthogonal to the AC-PC plane over the whole brain with the following parameters: 3-dimensional SPGR (spoiled gradient recalled acquisition in the steady state); repetition time = 34 milliseconds; echo time = 5 milliseconds; flip angle = 45°; slice thickness = 1.5 mm and zero gap; 124 slices; FOV 22 × 16 cm; 256 × 192 matrix, reformatted to 256 × 256, yielding a voxel size of 1.5 mm × 0.85 mm × 0.85 mm; time of acquisition was 11 minutes.
Regions of interest
Image analysis was performed within MEDx (version 2.11; Sensor Systems, Sterling, VA, U.S.A.). Regions of interest (ROIs) boundaries were traced on MRI slices oriented in the coronal plane. The following ROIs were drawn: VST, DCA, DPU, and thalamus. The cerebellum, a structure devoid of D2 and D3 receptors in humans, was used as the region of reference. The whole striatal region (STR) was calculated as the pixelwise weighted sum of VST, DCA, and DPU.
The following criteria were developed to draw the striatal subregions, according to the atlas of Mai et al. (1997). The boundary between the VST (inferiorly), DCA, and DPU (superiorly) was defined by a line joining (a) the intersection between the outer edge of the putamen with a vertical line going through the most superior and lateral point of the internal capsule (point a, Fig. 1); and (b) the center of the portion of the AC transaxial plane overlying the striatum (point b, Fig. 1). This line was extended to the internal edge of the caudate (point c, Fig. 1). The other boundaries of the VST were visually determined by its dense gray signal and were easily distinguishable from the adjacent structures. The VST was sampled from the anterior boundary of the striatum to the level of the AC coronal plane (Fig. 2). The DCA also was sampled from its anterior boundary to the AC coronal plane. Thus, for the DCA, the sampled region included the dorsal part of the head of the caudate and the anterior third of the body of the caudate. The DPU was sampled from its anterior to posterior boundaries. In slices posterior to the AC plane, the medial boundary of the DPU was the globus pallidus.
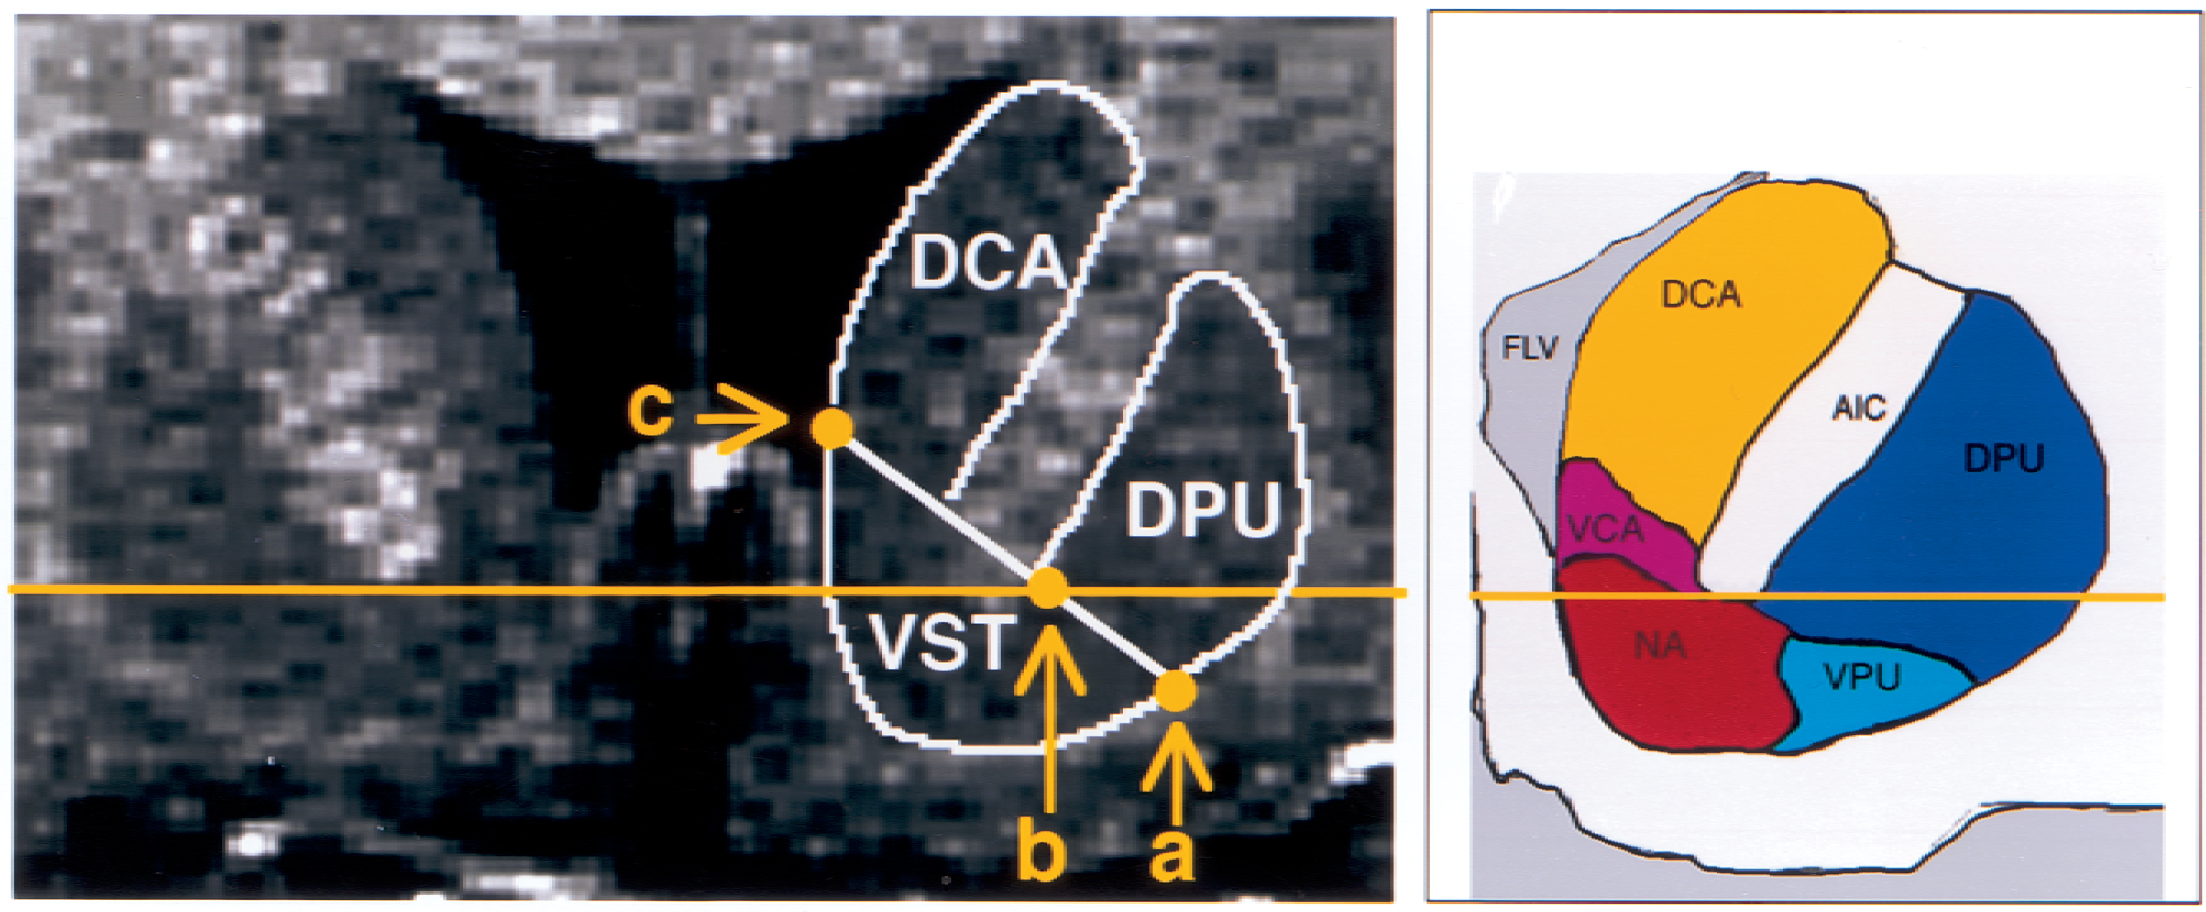
Coronal slice of a spoiled gradient recalled acquisition magnetic resonance image in a human subject, at the level corresponding to 7 mm anterior to the coronal plane of the anterior commissure, showing ventral striatum (VST), dorsal caudate (DCA), and dorsal putamen (DPU) regions of interest. Horizontal solid line identifies the transaxial anterior commissure–posterior commissure plane. See text for boundary criteria (a, b, c). FLV, frontal horn lateral ventricle; AIC, anterior internal capsule; VPU, ventral putamen; VCA, ventral caudate, NA, nucleus accumbens.
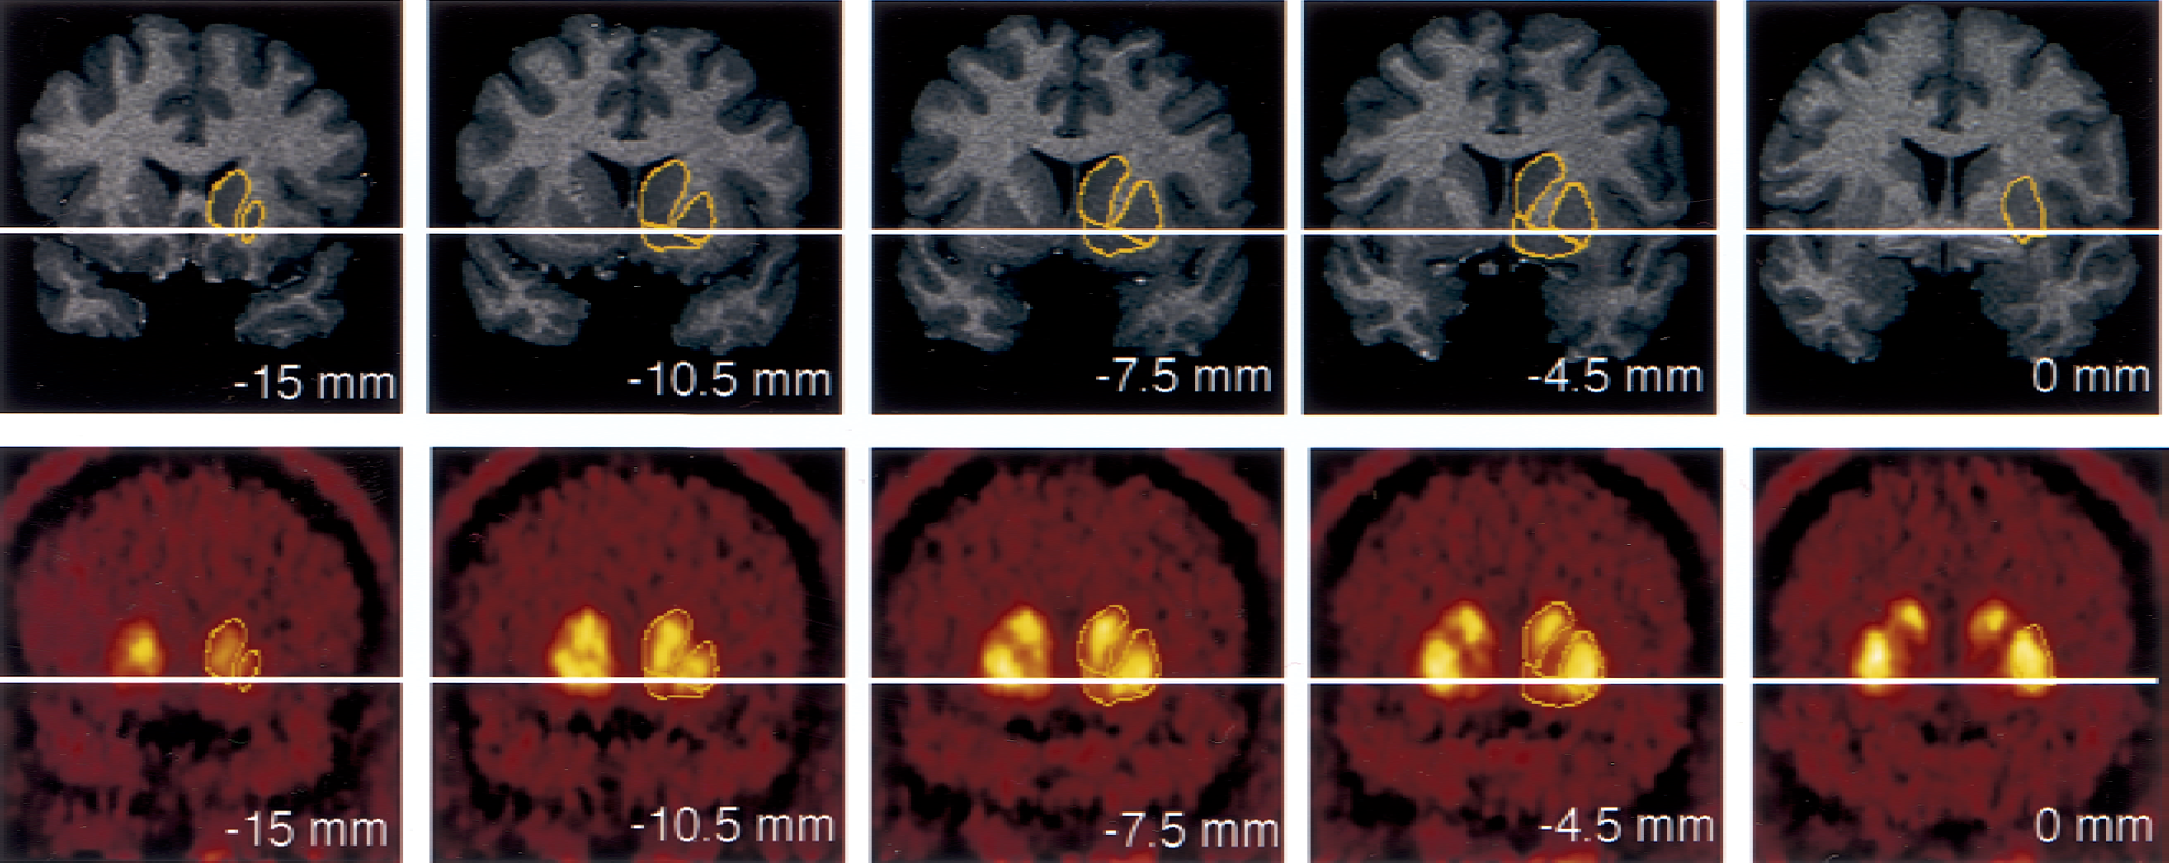
Coregistered coronal sections of magnetic resonance imaging (MRI) and positron emission tomography (PET) [11C]raclopride scans, encompassing the anterior striatal region. Columns represent coronal sections at levels −15.0, −10.5, −7.5, −4.5, and 0 mm anterior to the plane of the anterior commissure (levels anterior to AC level are denoted by negative numbers). Horizontal solid line identifies the transaxial anterior commissure–posterior commissure plane. The superior and medial region of interest (ROI) is the head of the caudate, sampled from its appearance (level −15 mm) to the level of the anterior commissure (level 0 is the first level at which the caudate is not sampled). The most lateral ROI is the putamen, sampled in its entirety from −15 mm to +15 mm (not shown). The most ventral ROI is the ventral striatum, depicted on levels −10.5, −7.5, and −4.5 mm. Boundaries between the three regions were traced on the MRI, according to criteria described in Fig. 1, and pasted on the registered PET. As the interslice spacing of the MRI was 1.5 mm, 10 coronal sections were analyzed in this interval, 5 are represented in the figure.
Image registration
Correction for PET frame misalignment caused by head movement was performed using the within modality Automatic Image Registration (AIR) algorithm (Woods et al., 1992, 1998) as implemented in MEDx. Because a poor signal-to-noise ratio introduces errors in the AIR process (Woods et al., 1992), PET frames were first denoised using a level 2, order 5 Battle-Lemarie wavelet. These functions form an orthogonal wavelet basis and are symmetric, which makes them suitable for noise reduction (Battle, 1987; Lemarie, 1988; Mallat, 1998). The detail images then were set to zero using a hard threshold, and the resultant images were inverse wavelet transformed back to the spatial domain. To address the problem of image boundaries during the application of the forward wavelet transformation, the authors mirrored the boundary pixel values with the image edge acting as a pivot. Denoised frames were registered to a denoised frame of reference and the resultant transformation matrix (TM1) was saved. The frame of reference was chosen as the frame with the highest noise equivalent counts (NEC), calculated as T2/(T+S+R), where T, S, and R are true, scatter, and random counts recorded over the frame duration, respectively (Strother et al., 1990). This frame corresponded to the first 5-minute frame (10 to 15 minutes). The effectiveness of the within modality registration on denoised images was assessed by comparing time-activity curves before and after frame realignment.
The denoised frame of reference (10 to 15 minutes) was coregistered to the MRI, using the between-modality AIR procedure (Woods et al., 1993). The resulting transformation matrix (TM2) was saved. TM1 and TM2 then were applied consecutively to each of the original PET frames.
For every frame but the first 5-minute frame (15 to 90 minutes, i = 1 to 15), the length of the spatial vector characterizing the spatial shift of the brain location in frame (i) relative to the previous frame (i-1) was estimated by the translocation imposed by the spatial registration on 9 pixels, corresponding to the center of each ROI (n = 8) and the cerebellum. The Euclidean distance between the location of each of these pixels in frame (i) and (i-1) was computed. The average length of the translocation vectors at the nine pixels was used as a global index of brain spatial shift between frames (i) and (i-1). This measure provided an estimate of the magnitude of head motion during frame acquisition and was used to calculate the image blurring introduced by head motion. Motion-related blurring then was taken into account for the estimations of PVE affecting the images.
Outcome measures
[11C]Raclopride was assumed to be at equilibrium during the 40-to 90-minute interval. The quality of the equilibrium was evaluated by measuring the change over time of regional activities during the 40-to 90-minute interval. The slope of the regression of activities over time was expressed as a percentage of the mean value during the interval. The noise in the brain measurement was estimated by the SD of the regional activities in the 10 frames of the 40-to 90-minute interval (5-minute frames) and was expressed as percentage of the mean value (%CV).
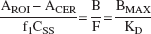
Specifically bound radioligand concentration (B, μCi/mL) in each ROI was derived as the difference between the activity in the ROI (AROI) and the region of reference (AREF, cerebellum). Right and left regions were averaged. The relation between equilibrium values of B, the intracerebral free radioligand (F), the equilibrium dissociation constant (KD), and the maximum number of available binding sites (Bmax) is given by the Michaelis–Menten equation:

At tracer dose, F is negligible relative to KD, and Eq. 1 simplifies to

The concentration of the intracerebral free radioligand (F) is not directly measurable. Assuming that at equilibrium, the free radiotracer equilibrates on both sides of the blood–brain barrier, F is equal to the free radiotracer concentration in the plasma at steady state, given by the product of the plasma free fraction (f1) and the steady-state concentration of the radiotracer (CSS, μCi/mL)
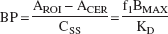
Whereas the outcome measure derived in Eq. 3 is the only expression of the Bmax/KD ratio that depends exclusively on receptor parameters and corresponds to the original definition of the binding potential (Mintun et al., 1984), the use of this outcome measure requires the measurement of the plasma free fraction (f1). Because this measurement is often found unreliable for radiotracers with free fractions less than 10%, other more practical and reproducible outcome measures have been introduced. Here, the term binding potential (BP; mL of plasma per g of brain tissue, assuming a brain tissue density of 1) is used to denote the equilibrium ratio between the specific binding and the plasma CSS:
Another outcome measure, the specific-to-nonspecific equilibrium partition coefficient, is given by the equilibrium ratio between the specific binding and the activity in the reference region, which includes both free and nonspecific binding, with f2 being the free fraction in the region of reference. V3″ is used to denote this ratio:
The equality between free [11C]raclopride concentrations on both sides of the blood–brain barrier at equilibrium can be written as

from which it follows that the distribution volume of the cerebellum relative to the Css, V2, is equal to the f1/f2 ratio.

Thus, the use of BP (as defined here) as an outcome measure for between-subject comparison implies the assumption of no between-subject differences in nonspecific binding to plasma proteins (f1). The use of V3″ as an outcome measure for between-subject comparison implies the assumption of no between-subject differences in nonspecific binding in the brain (f2).
For equilibrium analysis, the specific-to-nonspecific ratio at time t, R(t), was calculated for each frame from 40 to 90 minutes (n = 10) as (AROI − ACER)/ACER. V3″ was derived as the average R(t) for this sampling interval. Binding potential was calculated as the average specific binding during that interval over the average of the five plasma measurements—that is, (AROI − ACER)/CSS. Equilibrium analyzes were performed with and without correction for activity present in the brain vasculature. The contribution of the blood activity in the vasculature to the regional activity was calculated assuming a 5% blood volume (Mintun et al., 1984) and a cell-to-plasma [11C]raclopride partition coefficient of 1.
Regional V3″ was also derived with kinetic modeling using the simplified reference tissue method (SRTM;Lammertsma and Hume, 1996) implemented in MATLAB (The Math Works, South Natick, MA, U.S.A.). This analysis derives three parameters from the observed relation between a reference region and an ROI, based upon an assumed relation between the reference region and the arterial input function. These are R1, the ratio of K1 in the ROI relative to cerebellar K1 (where K1, mL min−1 g−1, is the regional blood flow times the extraction), the parameter k2 (min−1, rate of diffusion of the tracer out of the brain), and V3″. No smothing was applied to the data before the SRTM fit. Equal weight was given to each frame in the SRTM fit.
Test–retest variability was calculated as the absolute value of the difference between the test and retest divided by the average of the test and retest values. The reliability of the measurements was assessed by the intraclass correlation coefficient (ICC), calculated as (Kirk, 1982):
where BSMSS is the mean sum of squares between subjects, WSMSS is the mean sum of squares within subjects, and n is the number of repeated observations (n = 2 in this study). This coefficient estimates the reliability of the measurement and assumes values from −1 (no reliability, that is, BSMSS = 0) to 1 (maximum reliability, achieved in the case of identity between test and retest, that is, WSMSS = 0).
For haloperidol experiments, the haloperidol-induced decrease in [11C]raclopride V3″ was calculated by comparing the posthaloperidol measurement of V3″ (90- to 120-minute interval) to the baseline V3″ (40- to 60-minute interval).
Partial volume effect analysis
The relatively small size of the VST and its proximity to other regions with high [11C]raclopride uptake (DPU and DCA) raised concerns about the recovery of true activities captured in the VST region of interest measurements and about the contamination of VST measurements by activity spilled over from the DPU and DCA. These effects were evaluated by assuming uniform activity distribution within each region, forming the geometric transfer matrix (GTM) (Rousset et al., 1998; Slifstein et al., 2000), calculating true activity in each region, and estimating recovery and contamination associated with uncorrected images.
The first step of this analysis was to form the GTM. Because of the limited resolution of the camera, a fraction of the counts originating in a given region spill out into surrounding regions. Conversely, counts measured in a given region include counts spilled in from surrounding regions. The GTM describes the contribution of each source region to the measured regional activities. The GTM is a R × R matrix, where R is the number of regions and the ij element is the spillover from region j into region i. In the GTM, the spillover is described as the average fraction of the true activity in the source region j (Tj) present in the voxels of the measured region i. Note that the diagonal of GTM represents the contribution of a region to itself, that is, the activity recovery.
The GTM was formed by analysis of the MRI images by using routines implemented in MATLAB. Because the resolution of the PET camera varies with the location of the voxel in the FOV, the position of the brain relative to the FOV during the PET scan was taken into account. From the MRI, R binary image sets were formed, with voxel values equal to 1 in the source region and 0 elsewhere. Nine regions were considered: left and right DCA, DPU, VST, thalamus, and brain tissue not included in these regions (background region). Note that the background region included the rest of the brain, and that the measured cerebellar activity was used as the measured activity for the background region. This choice neglected possible regional differences in nonspecific binding, even lower activity levels in the adjacent lateral ventricles, and the presence of a low density of D2 receptors in the external pallidum (Joyce et al., 1991; Hall et al., 1996). These nine binary image sets were resampled into the original orientation (transaxial), location, and resolution of the PET images. Resampled binary images were smoothed with a model point spread function (PSF) designed to simulate the characteristics of the PSF of the PET scanner, creating 9 blurred image sets with voxel values between 1 and 0. The PSF used elliptical gaussian kernels. After the smoothing process, the ij element of the GTM was measured by summing voxel values in region i on the smoothed images of source region j, then dividing by the sum of the number of voxels in region i. Because the location of the brain relative to the FOV varied between test and retest, this operation was performed for both test and retest studies, yielding a total of 180 smoothed binary image sets and 20 GTMs.
The second step was to calculate true activities in each region. The measured activity in the ith region (mi) equals a weighted sum of the true values in all source regions, with the weights appearing in the ith row of GTM.

from which it can be seen that the measured activity mi depends both on the geometric relations between region i and the other regions (as embodied in GTMij) and the relative values of the true activity levels in the source regions (Tj). Estimates of the true activities T = [T1, T2, … TR]′ were obtained by multiplying the vector of measured activities m = [m1, m2 … mR]′ by the inverse of the GTM.

The third step was to calculate for each region the fraction of measured specific binding corresponding to specific binding to D2 receptors located in the region itself (“authentic” specific binding). For this analysis, background activity was subtracted from T in all regions to form TS (vector of true regional specific binding), and a specific binding matrix (SBM) was calculated as SBMij = GTMij * TSj. The ij element of the SBM represented the fraction of binding measured in a target region i contributed by binding located in a source region j. The contribution of each source region j then was expressed as a percentage of measured binding in target region i. This analysis allowed the assessment of the regional fidelity of measured D2 receptor BP in the absence of PVE corrections. Note that the diagonal of SBM represents the percentage of specific binding in a given region that is contributed by the region itself, that is, the specific binding recovery. Conversely, the off-diagonal values represent the percentage of specific binding in a given region contributed by the specific binding in another region, the sum of which is the specific binding contamination.
These analyzes were completed at three levels of resolution—system resolution, realistic image resolution, and “worst case scenario” resolution.
The first analysis (system resolution) was performed at the system resolution level of the camera. The inplane FWHM varied linearly in the radial direction from 4.3 mm at the center of the FOV to 8.15 mm at 20 cm from the center of the FOV. The tangential FWHM varied from 4.3 mm to 5 mm. In the axial direction, the FWHM varied from 4.1 mm at the transverse center of the FOV to 8.1 mm at 20 cm. These numbers were obtained by measuring the resolution of the camera used in these studies and are consistent with published specifications for the HR+ scanner (Brix et al., 1997). This analysis provided estimates of PVE at a theoretical upper limit of resolution.
The second analysis (realistic image resolution) was performed at the resolution level of the image, to account for additional blurring introduced by the reconstruction filter (Shepp 0.5 filter) and by average head motion. The FWHM of the Shepp 0.5 filter is 2.48 mm. The average head motion during frame acquisition was estimated by the length of the global brain translocation vector imposed by AIR during the PET frame realignment. For the second analysis, the value corresponding to the average length of this vector observed for frames included in the sampling interval (40 to 90 minutes) was used. This analysis provided estimates of PVE under realistic imaging conditions.
The third analysis (“worst case scenario” resolution) was performed using the average plus 2 SD value of the global brain translocation vectors observed for frames included in the sampling interval. This analysis provided estimates of PVE under conditions of significant head movement within a scan frame.
Global resolution (FWHMG) resulting from various sources of blurring (FWHMi) was calculated as
and applied in a spatially dependent manner in the radial, tangential, and axial directions.
Statistical analysis
Values were expressed as mean ± SD. Significant differences were assessed with factorial or repeated measures analysis of variance (ANOVA), as appropriate. Relations between continuous variables were analyzed with the Pearson product moment correlation coefficient. A two-tailed P = 0.05 was selected as the significance level.
RESULTS
Region of interest volumes
Volumes of VST were 2546 ± 754 mm3 (%CV of 29%), ranging from 1410 to 3960 mm3. Volumes of DCA were 4872 ± 501 mm3 (%CV of 10%), ranging from 4315 to 5788 mm3. Volumes of DPU were 7703 ± 491 mm3 (%CV of 6%), ranging from 6774 to 8779 mm3. The average volumetric contributions of DPU, DCA, and VST to the whole striatal region were 51%, 32%, and 17%, respectively.
Registration analysis
The length of between-frame spatial shift imposed by AIR increased from early to late frames; the total duration of scanning before frame i was predictive of the magnitude of spatial correction imposed by AIR occurring between frame i and frame i-1 (r2 = 0.75, P < 0.001, Fig. 3). There was no significant difference between average spatial shift during test (1.12 ± 0.41 mm) and retest (1.02 ± 0.39) conditions (paired t-tests, P = 0.64), suggesting that subjects did not move more during the second study of the day as compared with the first study. The authors observed significant between-subject differences in spatial shifts (P = 0.032), suggesting that some subjects moved more than others. The between-frame spatial shift imposed by AIR was used as an estimate of within-frame head movements. During the sampling interval, the average brain translocation per frame was 1.32 ± 0.36 mm. This value was used in the second PVE analysis. For each frame of the sampling interval, the authors also calculated the value corresponding to the average plus 2 SD of the brain translocation vector, to define an upper limit of the movement estimates. This analysis yielded a value of 3.31 ± 1.14 mm. This value was used in the third PVE analysis.
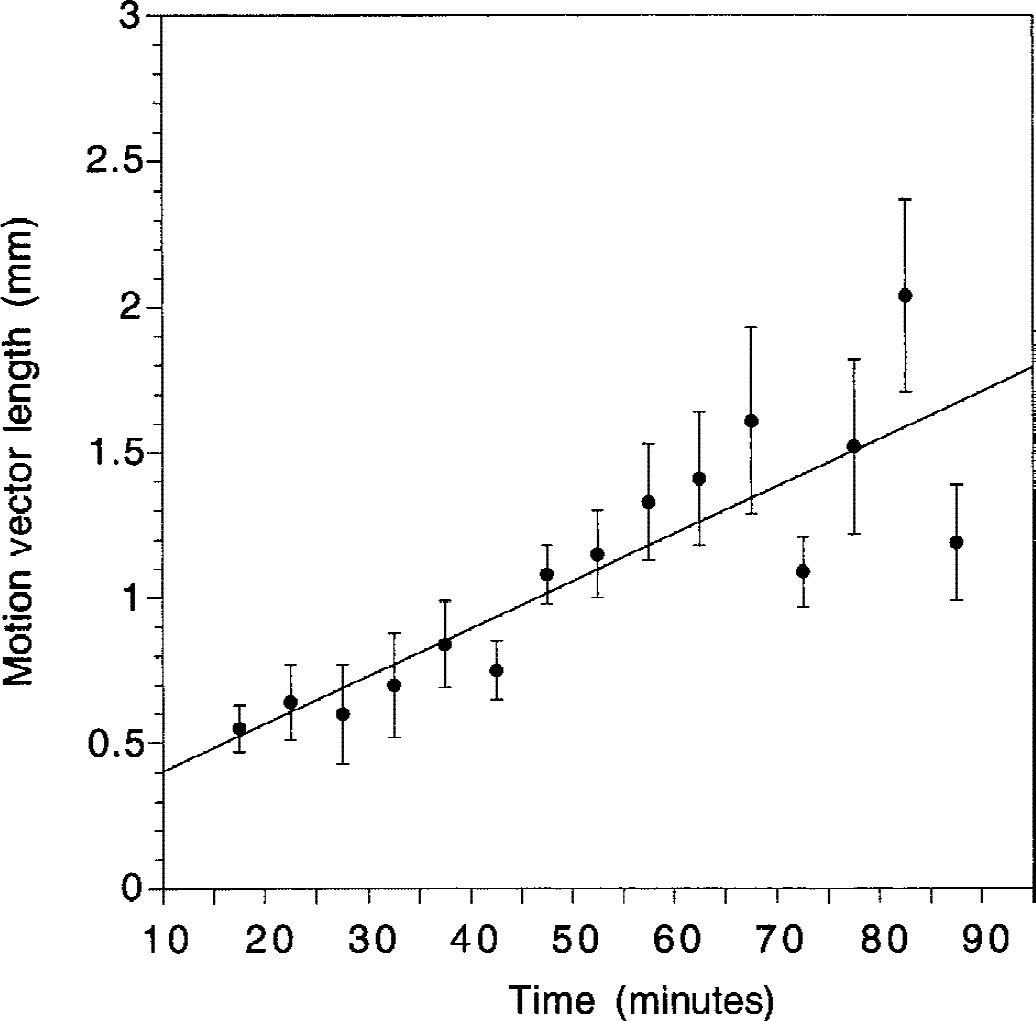
Average (±SEM) of global brain spatial shift imposed by the Automated Image Registration algorithm (AIR) during frame-to-frame realignment as a function of frame acquisition time relative to the beginning of the experiment. Values of the y-axis represent the spatial shift in brain position between each frame i and i-1. Global brain spatial shift was calculated as the average Euclidean distance between the positions of nine pixels (located at the center of the nine regions of interest) during frames i and i-1. A significant relation was found between time of frame acquisition and spatial shift from the preceding frame (r2 = 0.75, P < 0.001). The increased global brain spatial shift imposed by AIR for late frames compared with early frames might be because subjects move more at the end of the experiment, because the lower count rate of the later frames induces randomness in the AIR process, or some combination of both factors.
Stability of regional activities
Activity concentrated in all striatal subregions, with lower levels in VST compared with DCA and DPU (Fig. 4). All regions displayed relatively stable levels of activities during the predefined sampling interval (40 to 90 minutes, Fig. 5). Regional activities were normalized to mean activity in the sampling interval, and normalized regional activities were plotted over time. Normalized DPU regional activities over time for the 20 experiments are shown in Fig. 6, as well as the mean ± SD of the 20 experiments. In regions with negligible (CER) or low (thalamus) receptor density, activity peaked early (within 10 minutes) at 150% to 200% of equilibrium values. The activity then decreased rapidly and stabilized by 40 minutes. During the 40-to 90-minute interval, no decline was observed in CER (average change over time of 0.3% ± 11.9% per hour, n = 20, not significantly different from 0, 1 sample t-test) or thalamus (−4.4% ± 9.8% per hour, not significant). Normalized activities in DCA, DPU, and VST peaked later (15 to 25 minutes), and this peak was followed by a moderate decline. During the sampling interval, small but significant activity declines over time were noted in DCA (−12.9% ± 15.1% per hour, P < 0.01) and DPU (−8.5% ± 13.5% per hour, P < 0.01), but not in VST (−3.2% ± 13.9% per hour, not significant). Changes over time of regional activities were very reproducible (for example, the ICC of the change over time of normalized VST activities was 0.90).
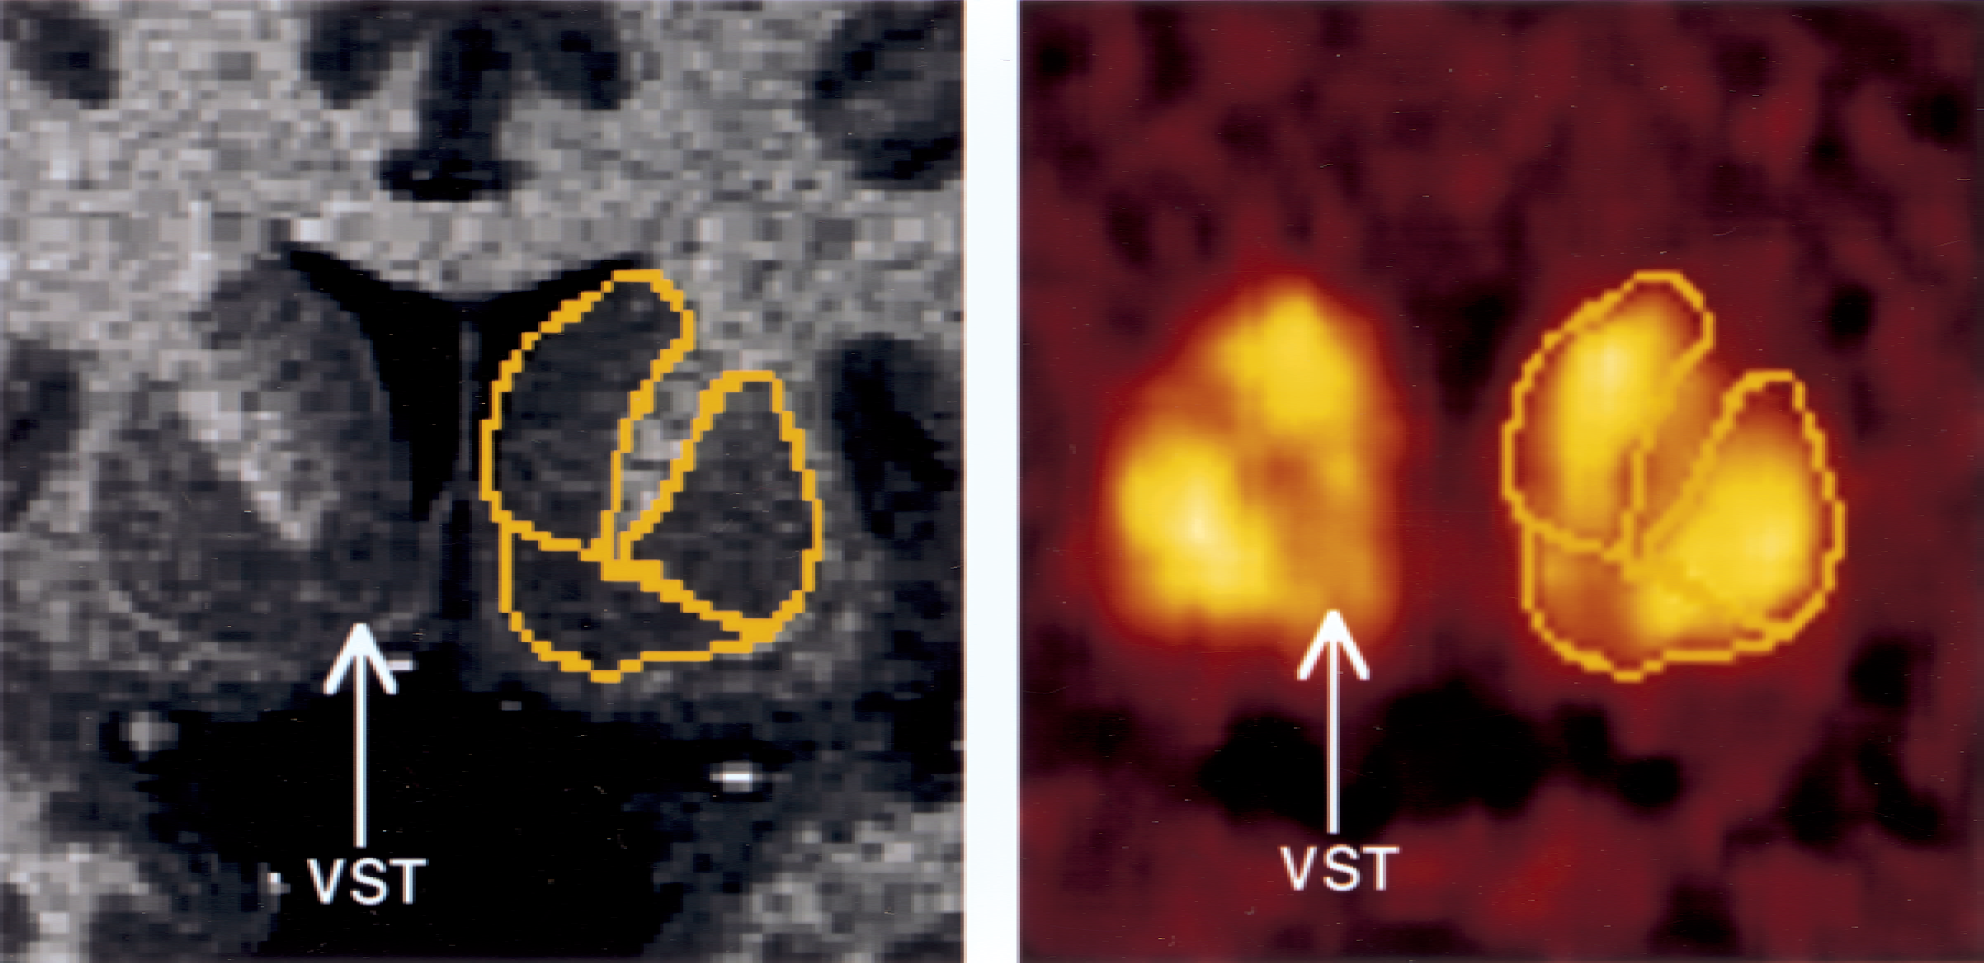
Activity distribution of [11C]raclopride at a level 4.5 mm anterior to the anterior commissure (enlargement of Fig. 2, column 4). Regions of interests (yellow boundaries) were manually traced on the magnetic resonance image (dorsal caudate [DCA], dorsal putamen [DPU], and ventral striatum [VST]) and were directly pasted on positron emission tomography images resliced and coregistered to the orientation of the magnetic resonance imaging. Lower activity levels in VST compared with DCA and DPU are noticeable.
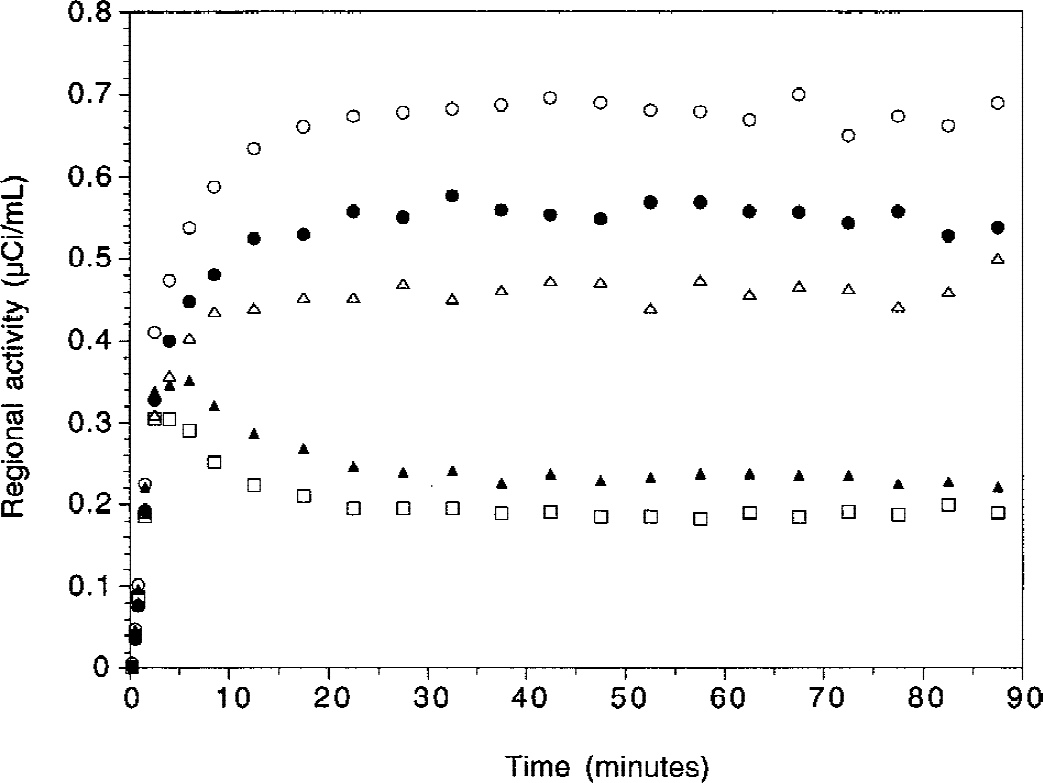
Time-activity curves in dorsal putamen (open circles), dorsal caudate (closed circles), ventral striatum (open triangles), thalamus (closed triangles), and cerebellum (open squares) in a human volunteer during [11C]raclopride bolus plus infusion study (bolus activity = 12.4 mCi; infusion activity, decay corrected = 7.1 mCi h−1 for 90 minutes; Kbol = 105 minutes; total dose administered, non-decay corrected = 15.8 mCi).
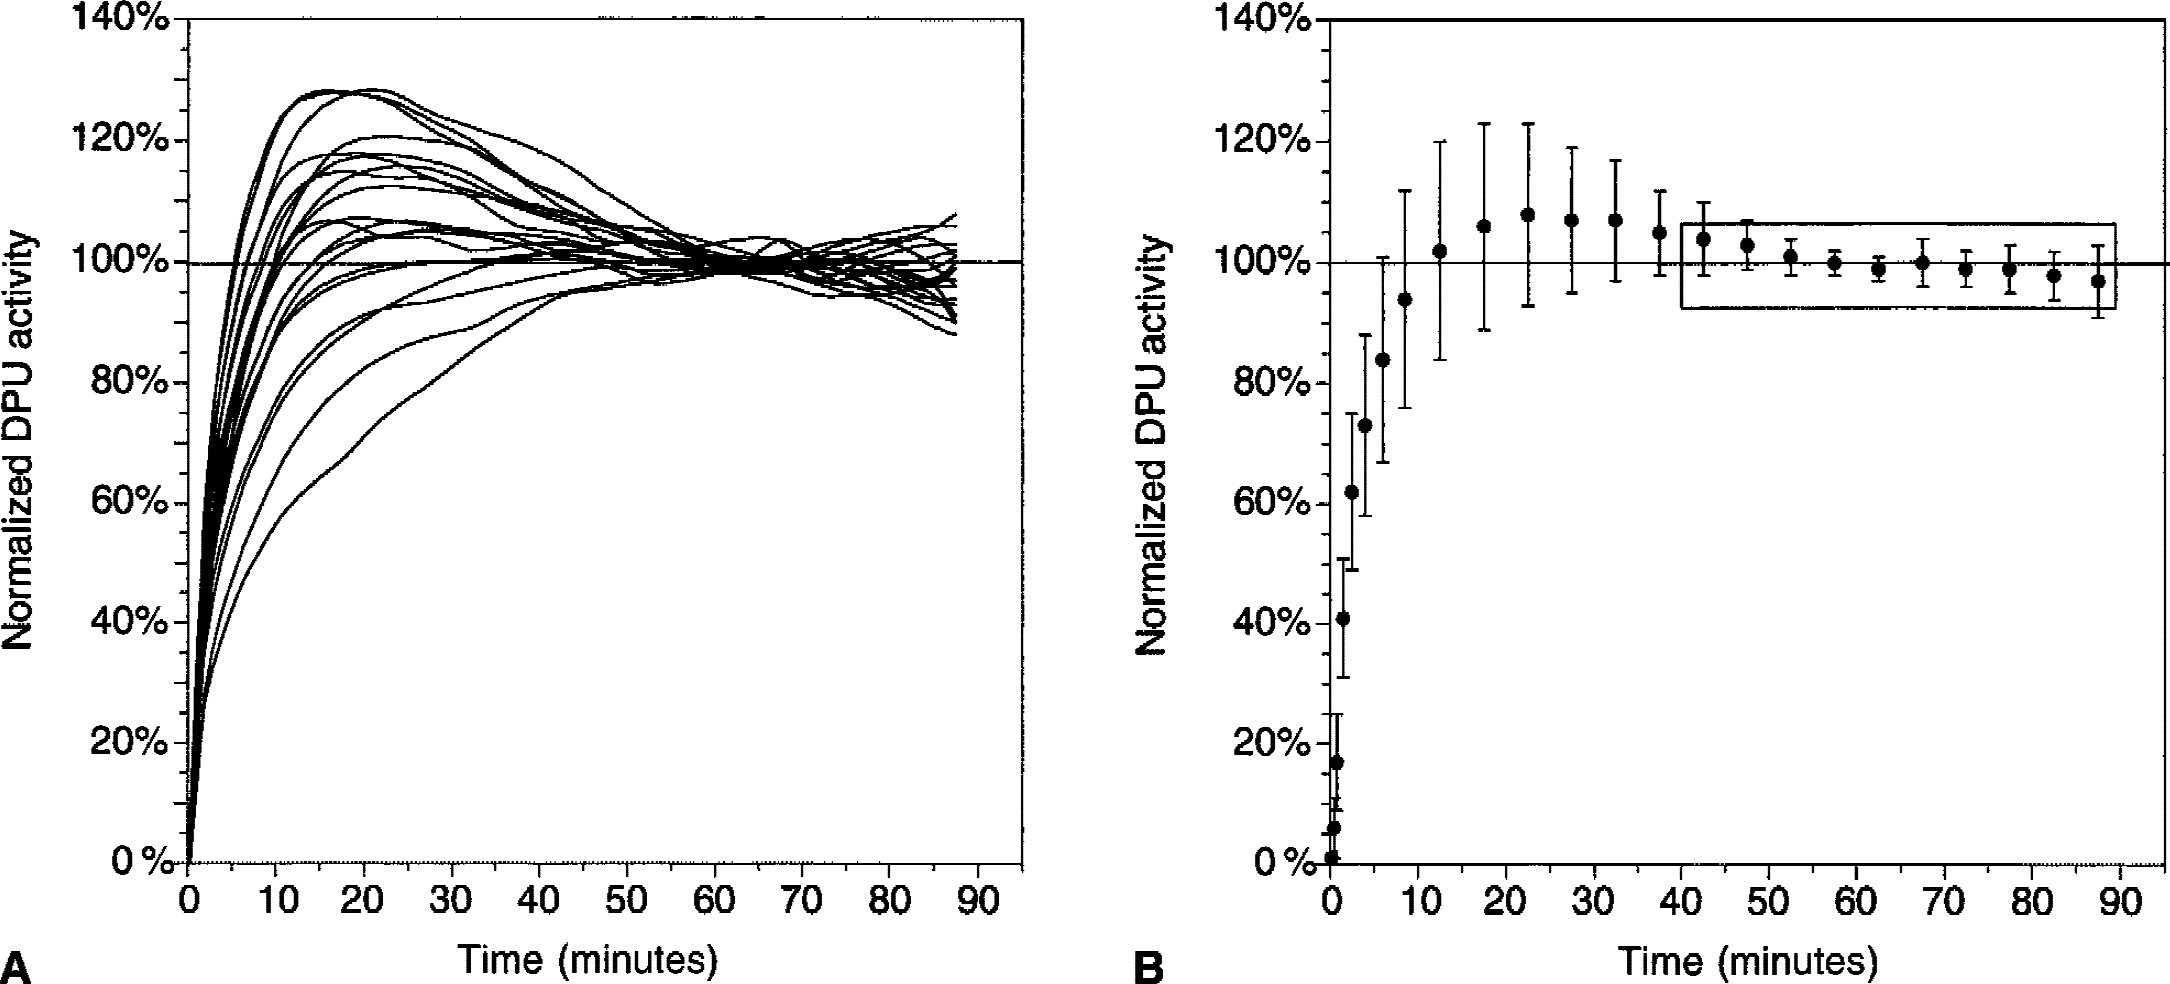
Time-activity curves in the dorsal putamen (DPU) in 20 [11C]raclopride bolus plus constant infusion experiments in 10 subjects (each subject studied twice). For each experiment, DPU activities were normalized to the mean activity recorded during the 40-to 90-minute interval.
Noise in regional activities
Noise in the regional activity measurements was estimated by the SD of the regional activities in the 10 frames during the 40-to 90-minute interval, and was expressed as percentage of the mean value (%CV). The between-frame %CV was 3.7% ± 1.9% in CER, 5.5% ± 3.1% in DCA, 4.1% ± 2.0% in DPU, 6.4% ± 3.1% in VST, 4.4% ± 1.9% in striatum as a whole, and 4.1% ± 2.3% in thalamus. Significant between-region differences in noise were observed (repeated measures ANOVA with regions as repeated factor, P < 0.001). Post hoc analysis revealed that the DCA and VST were significantly noisier than the other regions (P < 0.05), but not different from each other (P = 0.16). The frame-to-frame realignment by AIR was effective at reducing the noise in the VST data. Before within-frame coregistration using AIR, %CV of activity in VST was 9.0% ± 4.9%, a value significantly greater than the %CV observed after AIR realignment (6.4% ± 3.1%, repeated measures ANOVA, P = 0.001).
Equilibrium analysis
Stability of R(t) over time.
During the entire interval selected a priori (40 to 90 minutes), R(t) changed by −12.6% ± 13.8% in DCA, −7.2% ± 11.1% in DPU, and −7.6% ± 11.7% in thalamus; these values were significantly different from 0 (1 sample t-test, P < 0.05). No significant change over time was observed for R(t) in the VST (2.6% ± 13.8%, P = 0.41). In all ROIs, R(t) values were within ±10% of V3″ during the 40-to 90-minute interval.
Regional values.
Values during test and retest of V3″ calculated during the 40-to 90-minute interval are presented in Table 1. Significant differences in [11C]raclopride V3″ were noted between the three striatal subregions (repeated measures ANOVA with region as repeated factor, P < 0.001). The greatest density of D2 receptors was measured in the DPU (2.99 ± 0.26), followed by the DCA (2.33 ± 0.28) and the VST (1.86 ± 0.29). The thalamus showed low values of [11C]raclopride V3″ (0.37 ± 0.06).
Equilibrium analysis of [11 C] raclopride V3″ (40 to 90 minutes): reproducibility and reliability
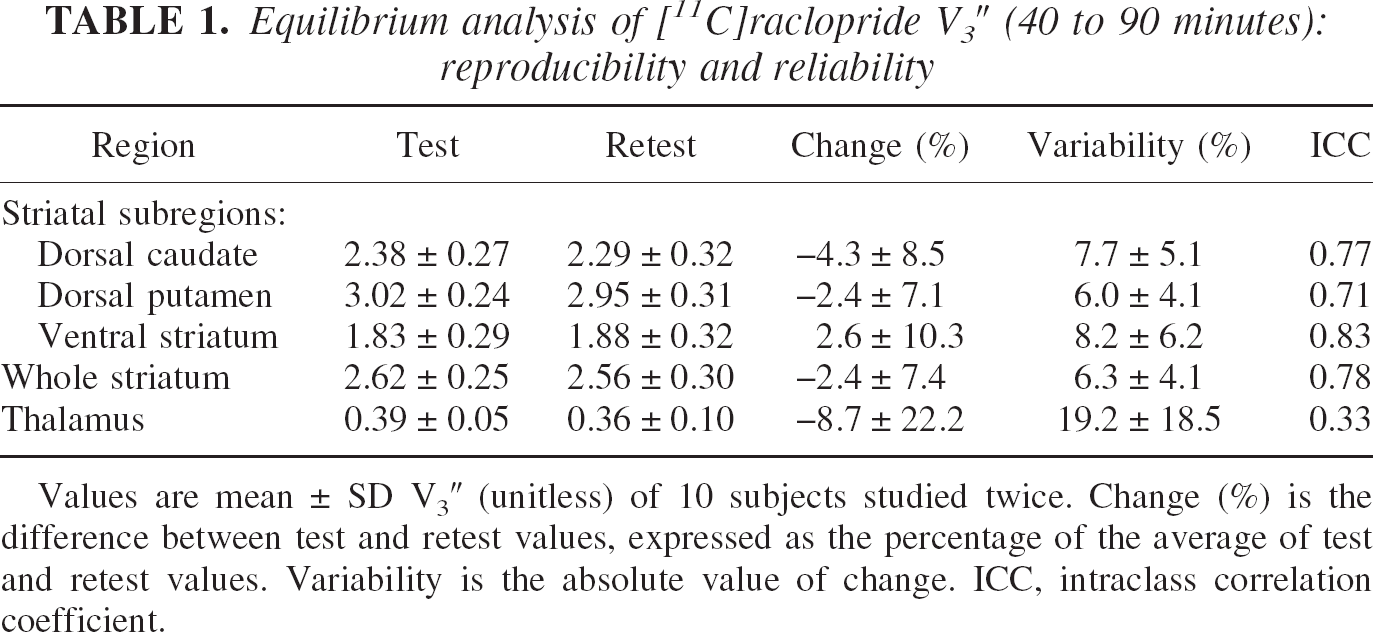
Values are mean ± SD V3″ (unitless) of 10 subjects studied twice. Change (%) is the difference between test and retest values, expressed as the percentage of the average of test and retest values. Variability is the absolute value of change. ICC, intraclass correlation coefficient.
Test–retest reproducibility.
None of the regions showed a significant change between the test and the retest V3″ values (repeated measures ANOVA, not significant, Table 1). The test–retest variability of the whole striatum V3″ was 6.3% ± 4.1%. The test–retest variability of V3″ in the DCA, DPU, and VST were 7.7% ± 5.1%, 6.0% ± 4.1%, and 8.2% ± 6.2%, respectively. No significant differences were observed in the test–retest variability of V3″ between the three striatal subregions (repeated measures ANOVA with regions as repeated measure, P = 0.36). Furthermore, the test–retest variability of the striatal subregion V3″ values were not statistically different from the test–retest variability of V3″ in the striatum as a whole (P > 0.05 for each subregion). V3″ ICC values were 0.78, 0.77, 0.71, and 0.83 for whole striatum, DCA, DPU, and VST, respectively, indicating that the measurement method detected true between-subject differences. In contrast, measurement of thalamic [11C]raclopride V3″ was affected by large within-subject variability (± 19% ± 18%) and a low ICC (0.33). The test–retest variability of thalamic V3″ was significantly greater than the variability of the striatal subregion V3″ values (repeated measures ANOVA, P = 0.011, followed by post hoc analysis with P < 0.05 for each thalamus to striatal subregion contrast).
Effectiveness of AIR.
Automatic Image Registration did not significantly improve the test–retest variability of V3″ in the DCA (from 8.9% ± 8.0% before AIR to 7.7% ± 5.1% after AIR, P = 0.68) or the DPU (from 7.4% ± 4.6% before AIR to 6.0% ± 4.1% after AIR, P = 0.43). However, AIR induced a significant reduction in the variability of V3″ in the VST (from 21.3% ± 16.9% before AIR to 8.2% ± 6.2% after AIR, P = 0.03). Regarding reliability, AIR provided dramatic improvements in the ICC in all regions examined. Figure 7 shows the change in test–retest variability of V3″ in DPU and VST provided by AIR in all ten subjects. Notably, the two subjects in which AIR did not improve test–retest variability of V3″ in VST are the two subjects with the least variability in the absence of AIR.
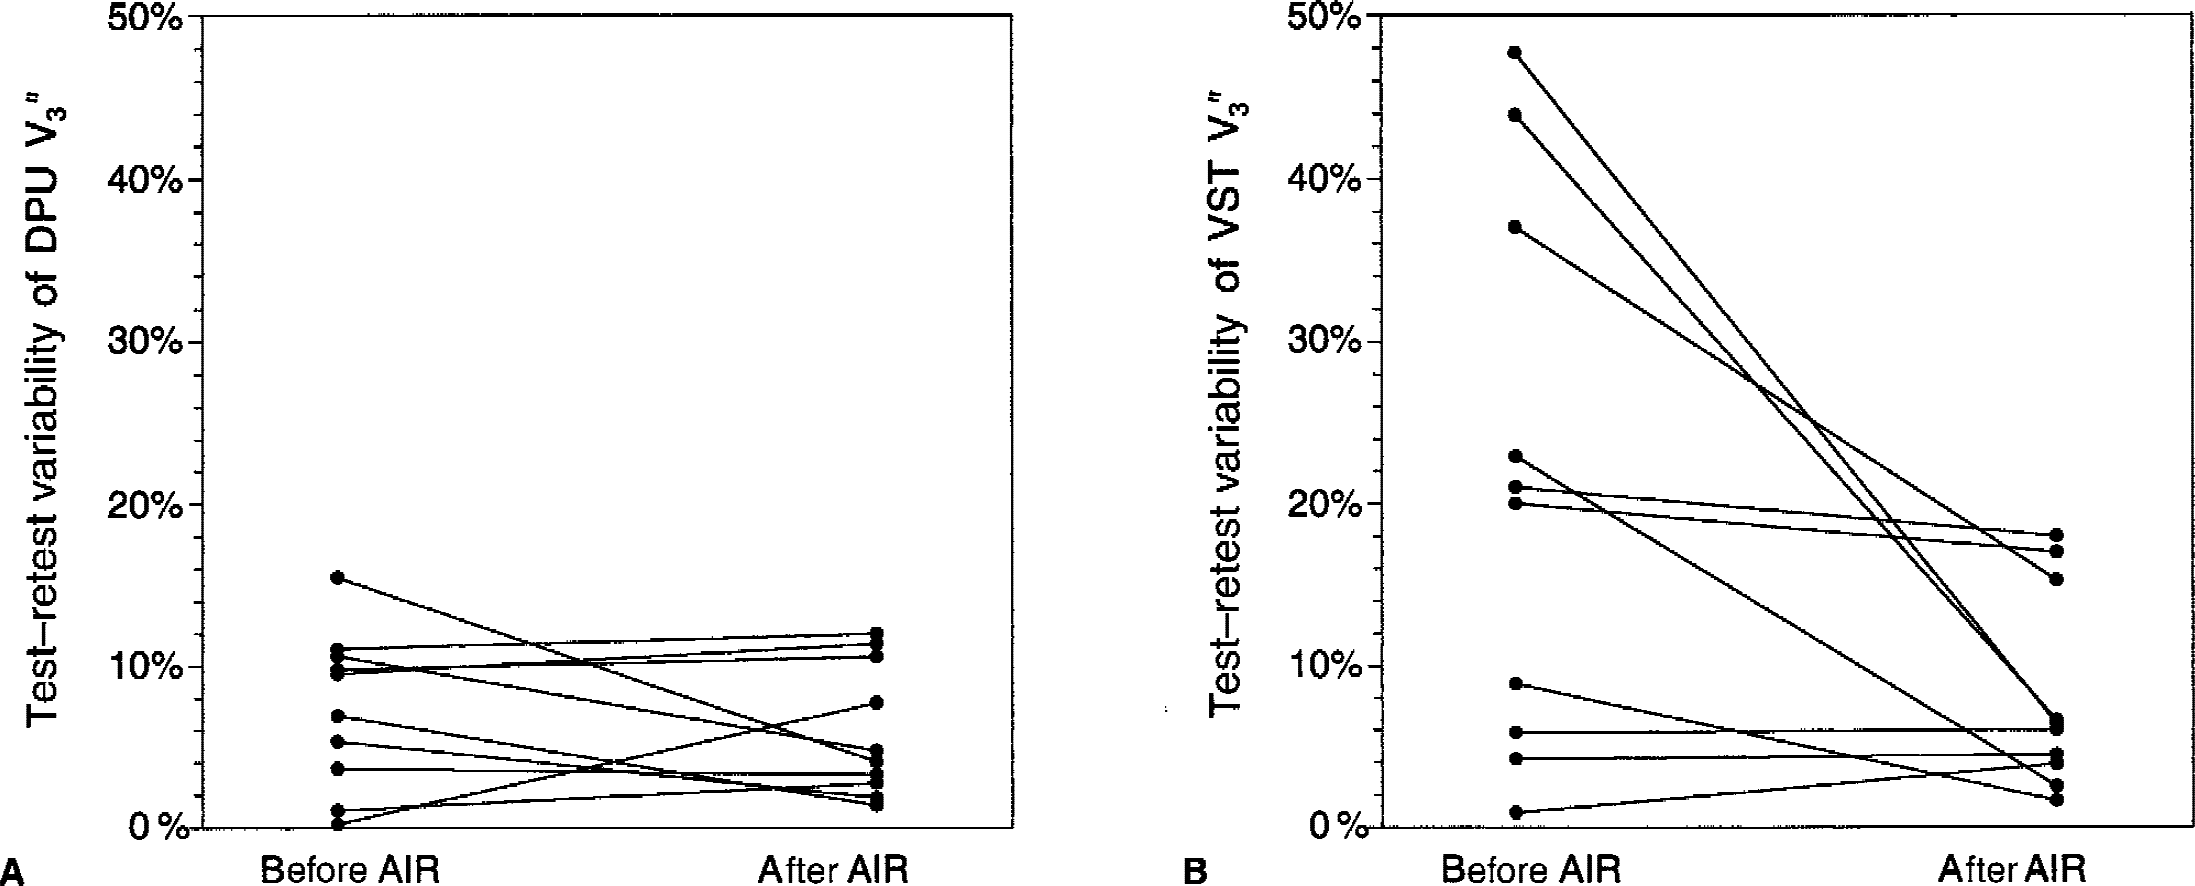
Effectiveness of Automatic Image Registration (AIR) frame-to-frame realignment in reducing test–retest variability of V3″ measurements in
Sampling interval and reproducibility.
The relation between Tend and reproducibility of V3″ measurements was investigated by comparing 9 sampling intervals, with Tstart fixed at 40 minutes and Tend increasing from 45 to 90 minutes in increments of 5 minutes (Fig. 8, upper row). Varying Tend had a significant effect on test–retest variability when all regions were analyzed together (repeated measures ANOVA with intervals as repeated factor, P < 0.001). When analyzing the regions separately, this effect reached significance in the DCA (P = 0.003) and DPU (0.007), but not in the VST (P = 0.60) or thalamus (P = 0.86). The best combined reproducibility of the 3 striatal subregions (lowest average test–retest variability of the 3 striatal subregions) was achieved with Tend of 80 minutes. Thus, the acquisition of the last two frames did not provide any observable improvement in measurement reproducibility.
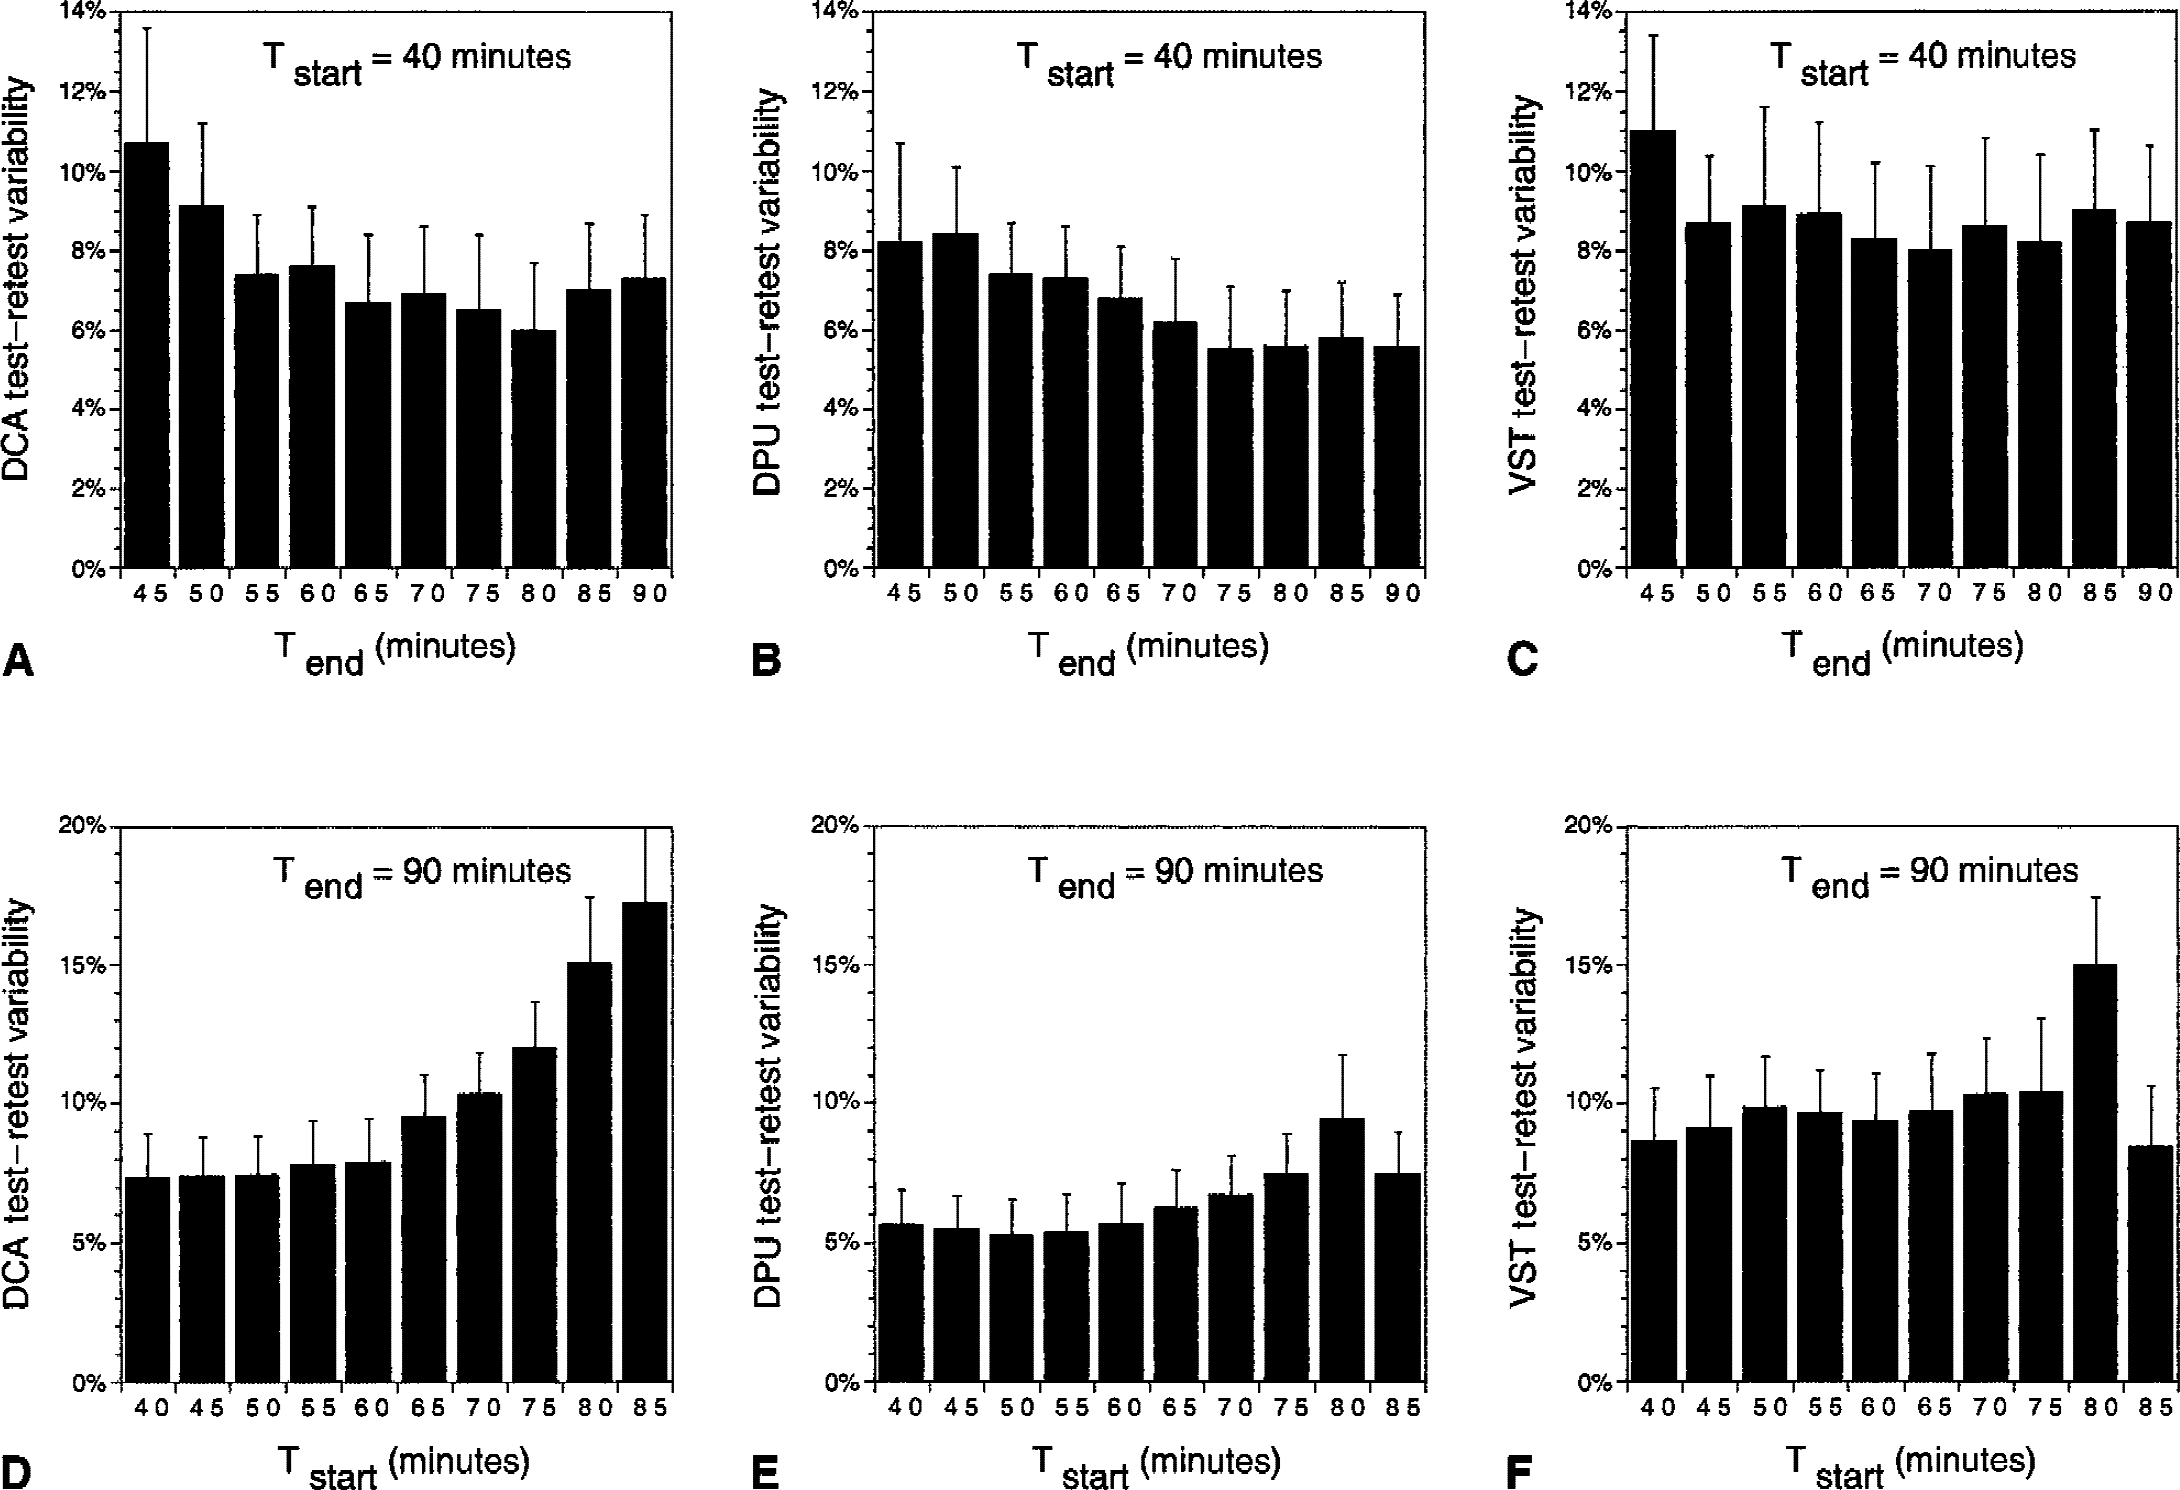
Changes in mean ± SD test–retest variabilities of V3″ in
The effect of Tstart on V3″ reproducibility was evaluated by measuring test–retest variability using 9 different sampling intervals with Tstart increasing from 40 to 85 minutes in increments of 5 minutes (Fig. 8, lower row) and Tend constrained to 90 minutes. Varying Tstart significantly affected variability when all regions were analyzed together (P < 0.001). In the analysis by subregion, this effect reached significance in the DCA (P < 0.001) and thalamus (P < 0.001), but not in the DPU (P = 0.09) and VST (P = 0.17). The best combined reproducibility of the 3 striatal subregions (lowest average test–retest variability of the 3 striatal subregions) was achieved with Tstart of 40 minutes.
The authors also studied the test–retest variability of V3″ for any combination of Tstart and Tend, with Tstart greater than 40 minutes. The best test–retest variability was observed in the 60-to 80-minute interval for the DCA (5.3%), 70-to 80-minute interval for the DPU (4.4%), and 45-to 70-minute interval for the VST (8.0%). The optimal interval for the average test–retest variability of the 3 regions was the 60-to 80-minute interval (6.4%).
Simplified reference tissue method analysis
Simplified reference tissue method V3″ values.
Simplified reference tissue method converged with positive values of R1, k2, and V3″ in all cases, except in the thalamus of one subject (SRTM returned negative R1 values for both the test and the retest studies). Values of V3″ in the DCA, DPU, VST, STR, and thalamus derived with SRTM (0 to 90 minutes) are presented in Table 2. Regional V3″ values derived with SRTM were perfectly correlated with equilibrium V3″ values (r2 = 0.99). The regression of SRTM V3″ to equilibrium V3″ had a negligible positive intercept (0.06, P = 0.22) and a slope close to unity (0.96). Simplified reference tissue method V3″ values were slightly, but significantly, less than the equilibrium V3″ values, by 2.1% ± 3.7% in the DCA (repeated measures ANOVA with method as repeated factor, P = 0.012), by 2.2% ± 3.8% in the DPU (repeated measures ANOVA with method as repeated factor, P = 0.017), and by 2.6% ± 3.8% in the VST (repeated measures ANOVA with method as repeated factor, P = 0.031). Simplified reference tissue method V3″ values were not different from equilibrium V3″ values in the thalamus (P = 0.65). Regional cerebral blood flow (rCBF) relative to the cerebellum (R1) values were significantly different across regions (DCA: 0.89 ± 0.07; DPU: 1.06 ± 0.09; VST: 0.98 ± 0.08; thalamus: 1.03 ± 0.10, repeated measures ANOVA, P < 0.0001).
SRTM analysis of [11C] raclopride V3″ (0 to 90 minutes): reproducibility and reliability
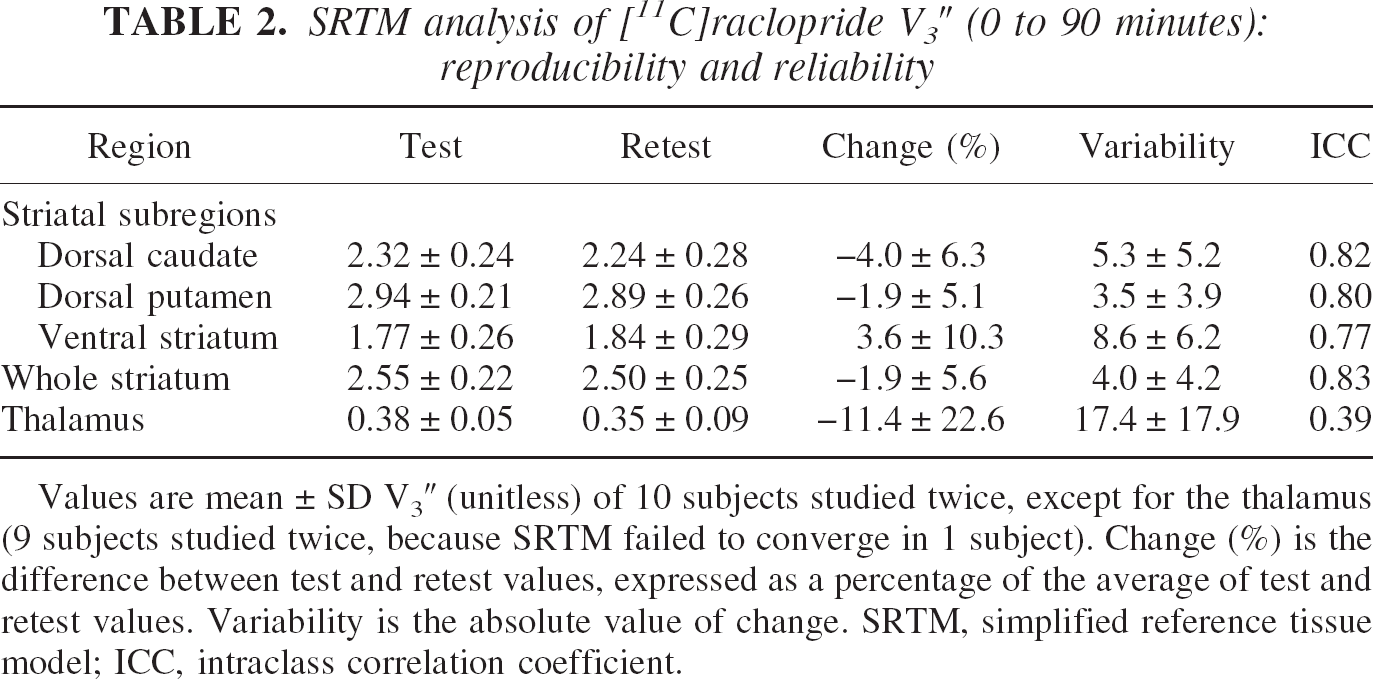
Values are mean ± SD V3″ (unitless) of 10 subjects studied twice, except for the thalamus (9 subjects studied twice, because SRTM failed to converge in 1 subject). Change (%) is the difference between test and retest values, expressed as a percentage of the average of test and retest values. Variability is the absolute value of change. SRTM, simplified reference tissue model; ICC, intraclass correlation coefficient.
Stability of simplified reference tissue method analysis over time.
The minimal scanning time needed to derive time-invariant estimates of regional V3″ by SRTM was defined by analyzing data with increasing Tend (increments of 5 minutes, from Tend = 10 minutes to Tend = 90 minutes) and keeping Tstart fixed at 0 minute. Results were expressed as a percentage of the reference value (Tend = 90 minutes). This analysis demonstrated the quasi absence of a timedependent bias in DCA and DPU for Tend > 20 minutes, whereas VST showed lower V3″ values for Tend < 60 minutes, and noisy results for Tend < 30 minutes (Fig. 9A to 9C).
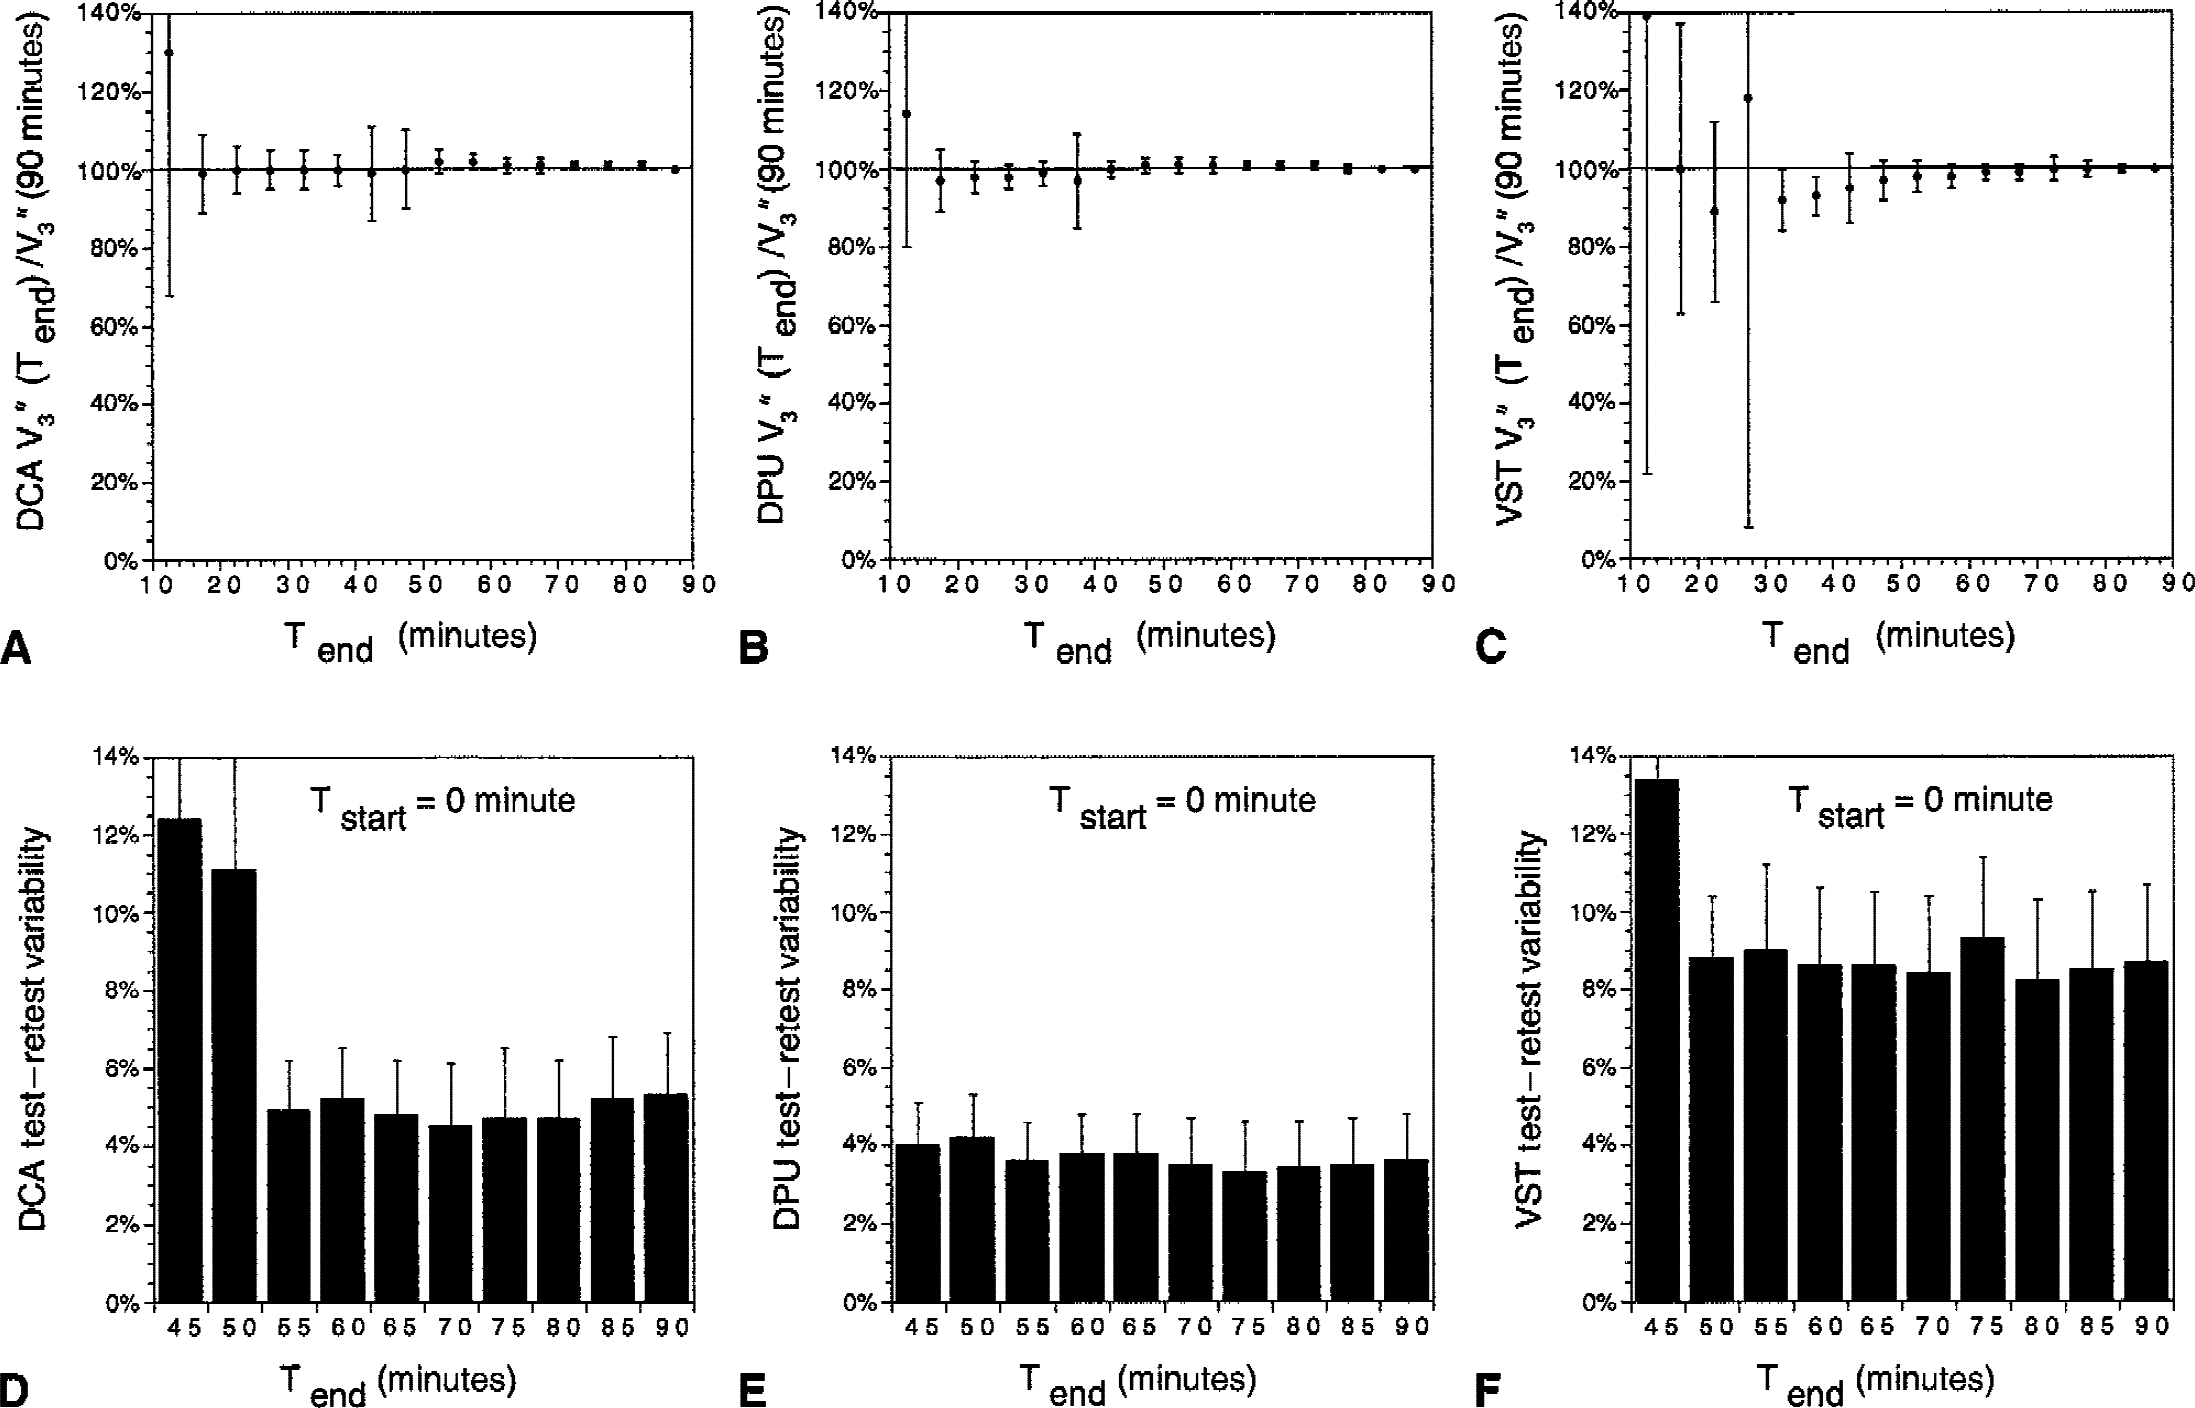
Scanning time and performance of the simplified reference tissue method (SRTM) analysis. Data were analyzed using SRTM with increasing Tend (5-minute increments from Tend = 10 minutes to Tend = 90 minutes) and keeping Tstart fixed at 0 minute. Mean ± SD of V3″ in
Reproducibility of simplified reference tissue method V3″.
Compared with equilibrium analysis, the test–retest variability of SRTM (Table 2) was significantly better in the DCA (repeated measures ANOVA with method of analysis as repeated factor, P =0.01) and DPU (P = 0.0027), but not in the VST (P = 0.57) or thalamus (P = 0.12). The effect of scanning time on test–retest variability of SRTM V3″ also was investigated for 40 minutes < Tend < 90 minutes. Taking the 3 striatal subregions together, Tend had a significant impact on test–retest variability (repeated measures ANOVA, P = 0.007). The best combined reproducibility (lowest average test–retest variability of the three regions) was achieved with Tend = 80 minutes (5.4%). In analysis by subregion, this effect reached significance in the VST (P = 0.01), but not in DCA (P = 0.24) and DPU (P = 0.47, Fig. 9E to 9F). Together, these data indicate that increasing Tend greater than 45 minutes did not provide appreciable improvement of DCA and DPU V3″ derivation with SRTM, but that the V3″ determination in the VST benefited from at least 60 minutes of data acquisition.
Plasma analysis
Total plasma activity increased during the 40-to 90-minute interval by 16% ± 23% per hour (significantly different from 0, one sample t-test, P < 0.01). The fraction of activity corresponding to the parent compound decreased over time by −10% ± 12% (P < 0.0005). The plasma parent compound concentration was stable over time (average change of −1% ± 14%, P = 0.89). The test and retest values of total activity clearance, parent fraction, total (bound and free) parent clearance, and free fraction (f1) are listed in Table 3. Measurement of the total activity, parent fraction, and total parent were very reproducible and were associated with high ICC values. In contrast, measurement of f1 (3.5% ± 0.48%) was associated with ICC values close to 0, indicating similar between-and within-subject variability (the assay failed to detect significant between-subject differences in f1 values).
Plasma analysis
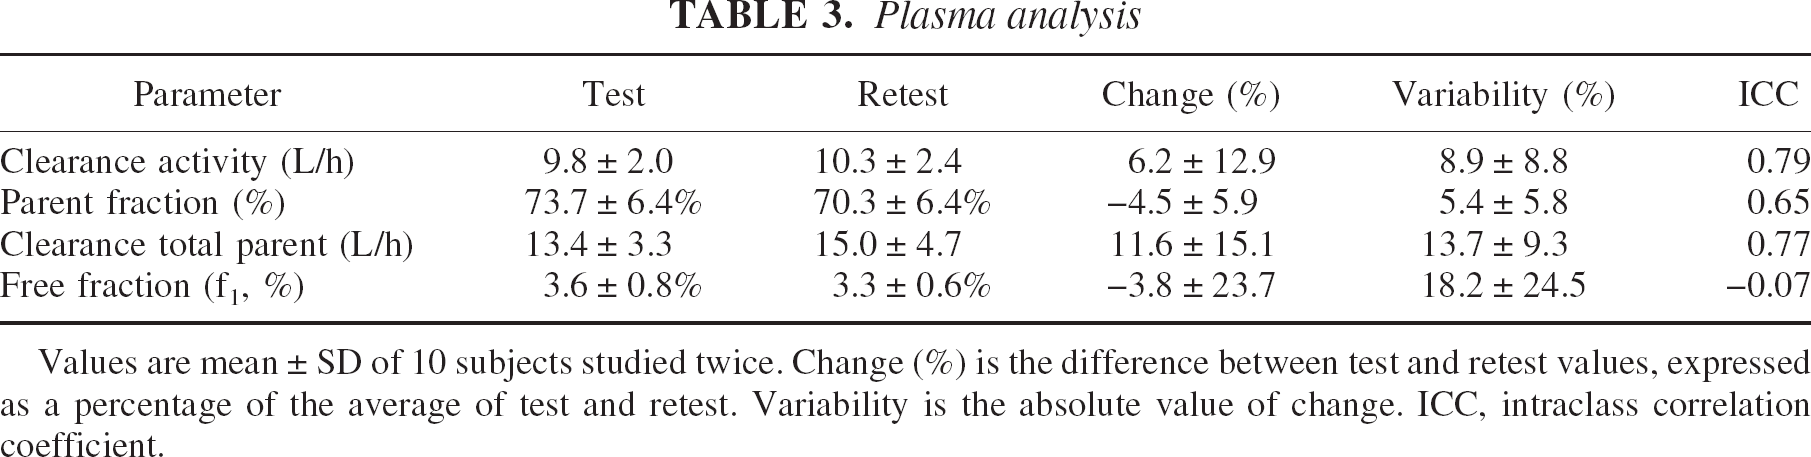
Values are mean ± SD of 10 subjects studied twice. Change (%) is the difference between test and retest values, expressed as a percentage of the average of test and retest. Variability is the absolute value of change. ICC, intraclass correlation coefficient.
Cerebellum V2
Cerebellum V2 was 0.44 ± 0.10 mL g−1 in test conditions and 0.46 ± 0.09 mL g−1 in retest conditions. No significant differences were observed in cerebellum V2 between test and retest conditions (repeated measures ANOVA, P = 0.20). The variability was ± 5.4% ± 4.8%, and the ICC was close to unity (0.95). Thus, measurement of cerebellum V2 identified reproducible between-subject differences, establishing significant between-subject differences in f1/f2 ratios. The free fraction in the cerebellum (f2), calculated as f1/V2, was 7.8% ± 1.7%.
[11C]Raclopride binding potential
Values of [11C]raclopride BP are listed in Table 4. No significant differences were observed between test and retest measurements (repeated measures ANOVA with regional [11C]raclopride BP as repeated measure, P > 0.05 for all regions). The test–retest variability of [11C]raclopride BP was not statistically different from the test–retest variability of [11C]raclopride V3″ (repeated measures ANOVA with outcome measure variability as repeated measure and region as cofactor; region:P = 0.06; outcome measure, P = 0.47; outcome × region interaction, P = 0.83). The ICCs of [11C]raclopride BP were significantly better than the ICCs of V3″ (repeated measures ANOVA, P = 0.04).
[11C]Raclopride BP in striatal subregions: reproducibility and reliability
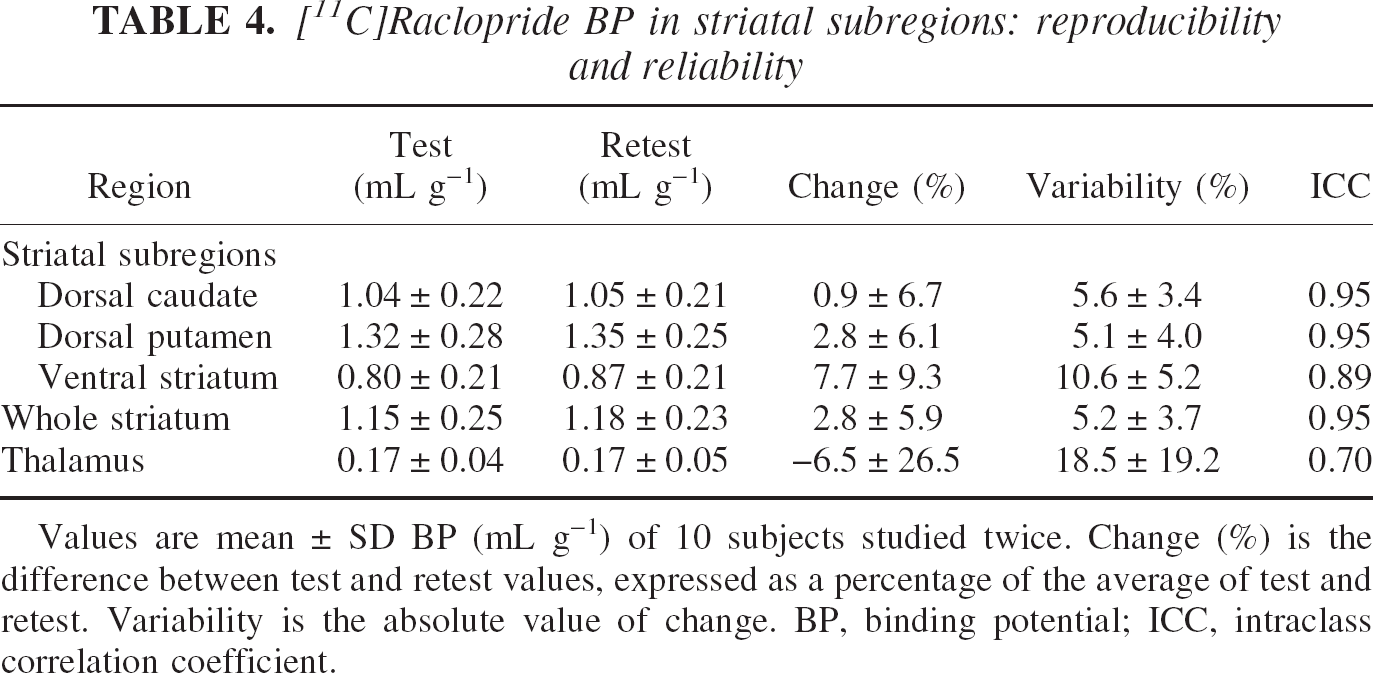
Values are mean ± SD BP (mL g−1) of 10 subjects studied twice. Change (%) is the difference between test and retest values, expressed as a percentage of the average of test and retest. Variability is the absolute value of change. BP, binding potential; ICC, intraclass correlation coefficient.
[11C]Raclopride Bmax/KD
The [11C]raclopride Bmax/KD ratio was calculated as BP/f1 (Eq. 4). Regional BP/f1 values were 32.7 ± 6.3 mL g−1 for STR, 31.4 ± 7.4 mL g−1 for DCA, 40 ± 8.9 mL g−1 for DPU, 25.0 ± 6.3 mL g−1 for VST, and 5.1 ± 2.0 mL g−1 for thalamus. As expected from the low reproducibility of the f1 measurement, the test–retest variability of BP/f1 was high (19.2% ± 51.4% in STR, 16.7% ± 48.6% in DCA, 19.4% ± 52.5% in DPU, 25.6% ± 57.1% in VST, 14.5% ± 66.1% in thalamus). All ICCs for BP/f1 were negative (−0.23 for STR, −0.24 for DCA, −0.27 for DPU, −0.05 for VST, −0.01 for thalamus). Similarly, the reproducibility of cerebellar distribution volume relative to the free parent plasma concentration V2/f1 (13.6 ± 2.5 mL g−1) was poor (variability of ± 18.6% ± 27%), with ICC of −0.06.
The main interest in calculating BP/f1 (= Bmax/KD) was to compare this value to in vitro measurements of [3H]raclopride binding in human brain. Assuming a KD for raclopride of 1 nmol/L, the value of BP/f1 in the striatum (32.7 mL g−1) would indicate a Bmax of 32.7 nmol/L, which is in the range of in vitro values (Hall et al., 1988). Accepting this KD value, the average occupancy of D2 receptors in these studies was calculated. Free concentration of [11C]raclopride (F, nmol/L), calculated as f2AREF(μCi/mL)/SA(mCi/mmol), was 0.0051 ± 0.0025 nmol/L. D2 receptor occupancy by [11C]raclopride, calculated as 100 × F/(KD + F), was negligible (1.01% ± 0.51%).
Vascular correction
Assuming a blood volume corresponding to 5% of the regional volume, activity in the vasculature contributed to 15.9% ± 2% of CER activity, 11.6% ± 1.7% of thalamus activity, 5.6% ± 0.8% of VST activity, 4.8% ± 0.8% of DCA activity, and 4.0% ± 0.5% of DPU activity. Because vasculature activity contributed more to the cerebellum signal than to the signal of other regions, regional V3″ calculated with the vascular-corrected distribution volumes were greater (DCA: 2.78 ± 0.40; DPU: 3.56 ± 0.38; VST: 2.21 ± 0.39; thalamus: 0.45 ± 0.10) than the uncorrected values (Table 1). The test–retest variability of V3″ corrected for the vascular contribution was ± 7.9% ± 5.3% in the DCA, 6.0% ± 4.8% in DPU, 8.1% ± 6.4% in VST, 6.3% ± 4.8% in STR, and 20% ± 18% in thalamus. Thus, the vascular correction had no impact on the reproducibility of the measurement (compare with Table 1). Binding potential values were unaffected by the vascular correction, because (AROI − ACER)/CSS = ((AROI − VC) − (ACER − VC))/CSS, where VC represents vascular contribution.
Partial volume effect analysis
Estimates of final image resolution.
Partial volume effect analysis was performed at three levels of resolution. The first analysis was performed at the system resolution level (FWHM at the center of FOV of 4.3 mm, with radial, transverse, and axial resolution varying in space as described in Materials and Methods). The second analysis was performed at realistic image resolution level, combining system resolution (4.3 mm), filter resolution (2.5 mm), and average length of the brain translocation vectors imposed by AIR to realign frame i to frame i-1 during the 40-to 90-minute interval (1.32 mm) to yield a FWHM at the center of the FOV of 5.1 mm. The third analysis, corresponding to a “worst case scenario,” combined the system resolution (4.3 mm), filter resolution (2.5 mm), and a motion vector equal to the average plus 2 SD of the length of the brain translocation vectors during the 40-to 90-minute interval (3.31 mm) to yield a FWHM at the center of the FOV of 6.0 mm.
Geometric transfer matrix.
At the highest resolution (FWHM of 4.3 mm), the recovery in the VST was 53% ± 5%. At FWHM of 5.1 and 6 mm, recovery in the VST was 46% ± 5% and 41% ± 5%, respectively. Activity recovery was better in the DCA (66% ± 2%, 61% ± 2%, and 56% ± 2% at FWHM of 4.1, 5.2, and 6 mm, respectively) and DPU (65% ± 1%, 61% ± 2%, and 56% ± 2% at FWHM of 4.1, 5.2, and 6 mm, respectively). The thalamus had the best recovery (75% ± 2%, 70% ± 2%, and 66% ± 2% at FWHM of 4.1, 5.2, and 6 mm, respectively). Table 5 presents the average values of the GTMs obtained assuming 5.1 mm FWHM (realistic image resolution level).
Partial volume effects correction: geometric transfer matrix
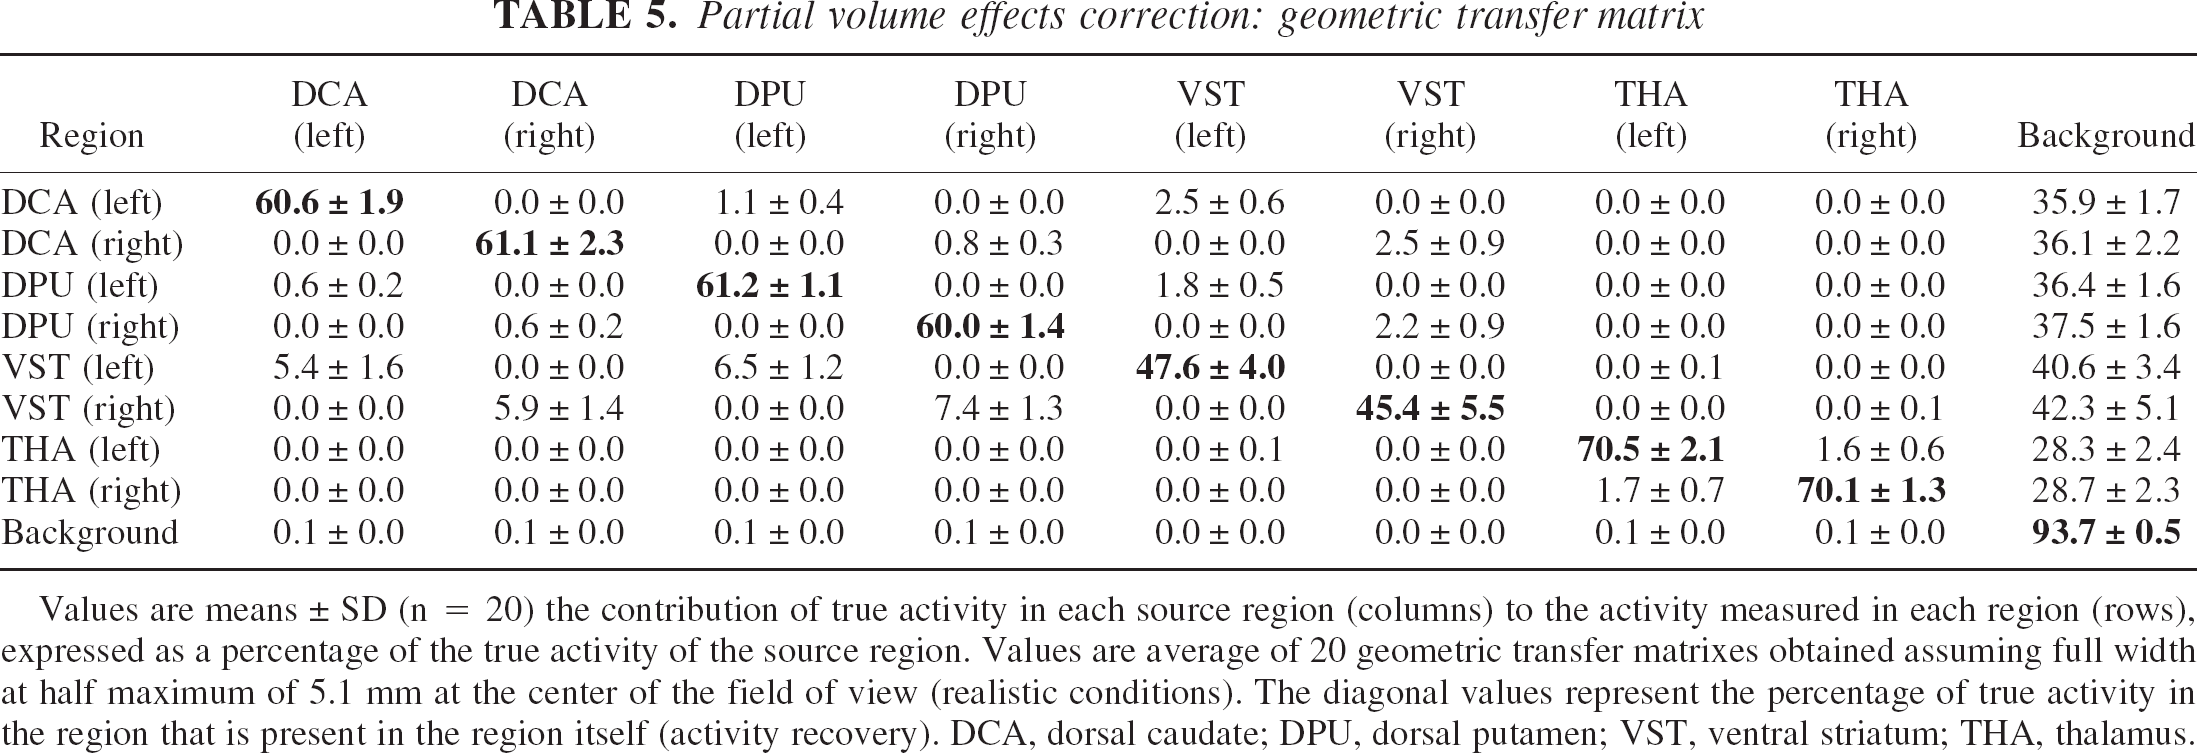
Values are means ± SD (n = 20) the contribution of true activity in each source region (columns) to the activity measured in each region (rows), expressed as a percentage of the true activity of the source region. Values are average of 20 geometric transfer matrixes obtained assuming full width at half maximum of 5.1 mm at the center of the field of view (realistic conditions). The diagonal values represent the percentage of true activity in the region that is present in the region itself (activity recovery). DCA, dorsal caudate; DPU, dorsal putamen; VST, ventral striatum; THA, thalamus.
Partial volume effect correction.
Figure 10 shows the effect of PVE correction on regional activities at the three levels of resolution studied. For the VST, correcting for the partial recovery and removing contamination of the other regions resulted in a net activity gain of 26% ± 8%, 33% ± 10%, and 40% ± 12% at FWHM of 4.3, 5.1, and 6 mm, respectively. These relative gains were greater in the DCA and DPU. Partial volume effect correction had little effect on activities in the thalamus.
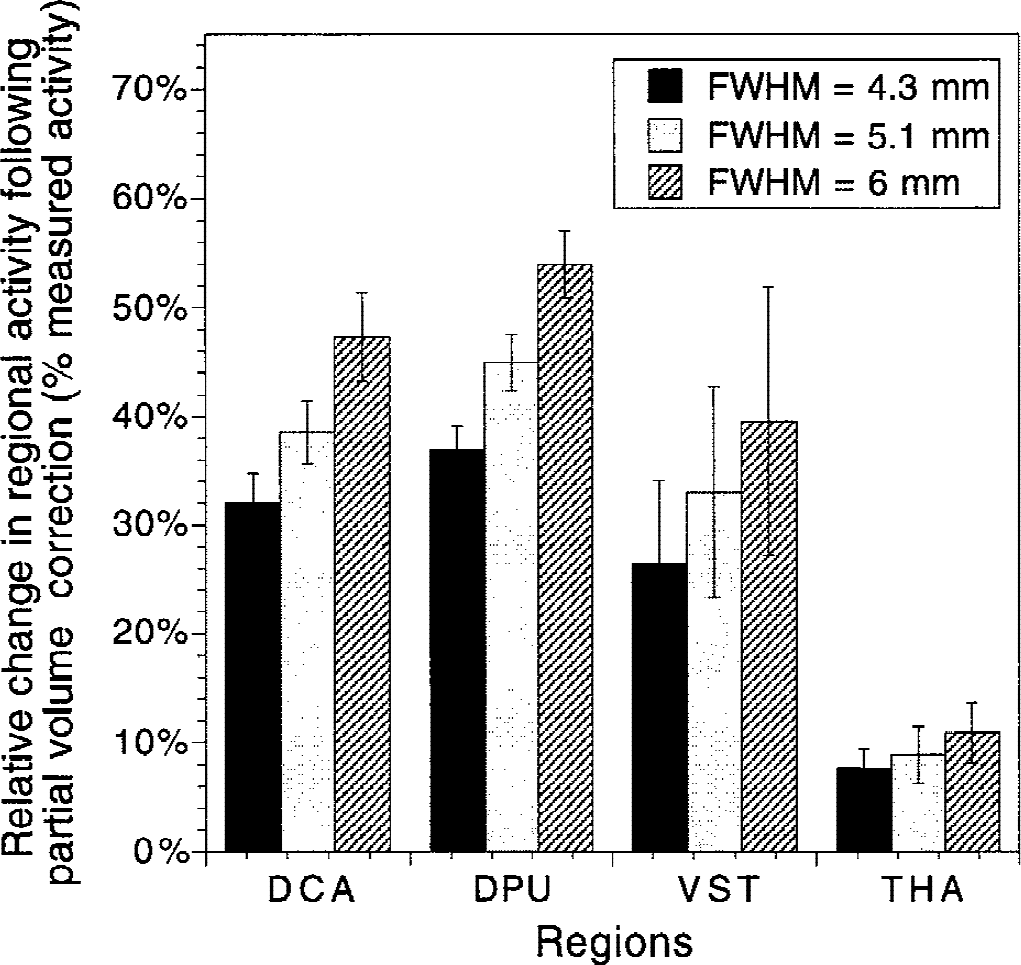
Changes in regional activities after partial volume effect (PVE) correction in the dorsal caudate (DCA), dorsal putamen (DPU), ventral striatum (VST), and thalamus (THA), using various point spread function (PSF) characterized by full width at half maximum (FWHM) at the center of the field of view of 4.1, 5.3, and 6 mm. Values are expressed in average ± SD percentage increase relative to uncorrected values. The relative increase varied as a function of the PSF. Although the VST is smaller than the DCA and DPU, the relative increase in activity after PVE correction was smaller in the VST compared with the DCA and DPU, because of removal of activity spilling over from the DCA and DPU into the VST. Because of its large size, the thalamus was only moderately affected by PVE correction.
Measured versus partial volume effect-corrected V3″ and binding potential.
Table 6 lists the measured and PVE-corrected regional values of [11C]raclopride V3″. After corrections, D2 receptor parameter values in the VST remained significantly less than those in the DPU and DCA, indicating that the lower D2 receptor availability measured in the VST compared with DPU and DCA was not caused by PVE. Between-subject variability in the relative increases in V3″ after PVE correction was larger in the VST compared with the DCA and DPU. This greater variability in the PVE correction in the VST compared with the DCA and DPU stems from the greater between-subject variability in the size of the VST.
Partial volume effects correction: comparison of measured and corrected [11C]raclopride V3″
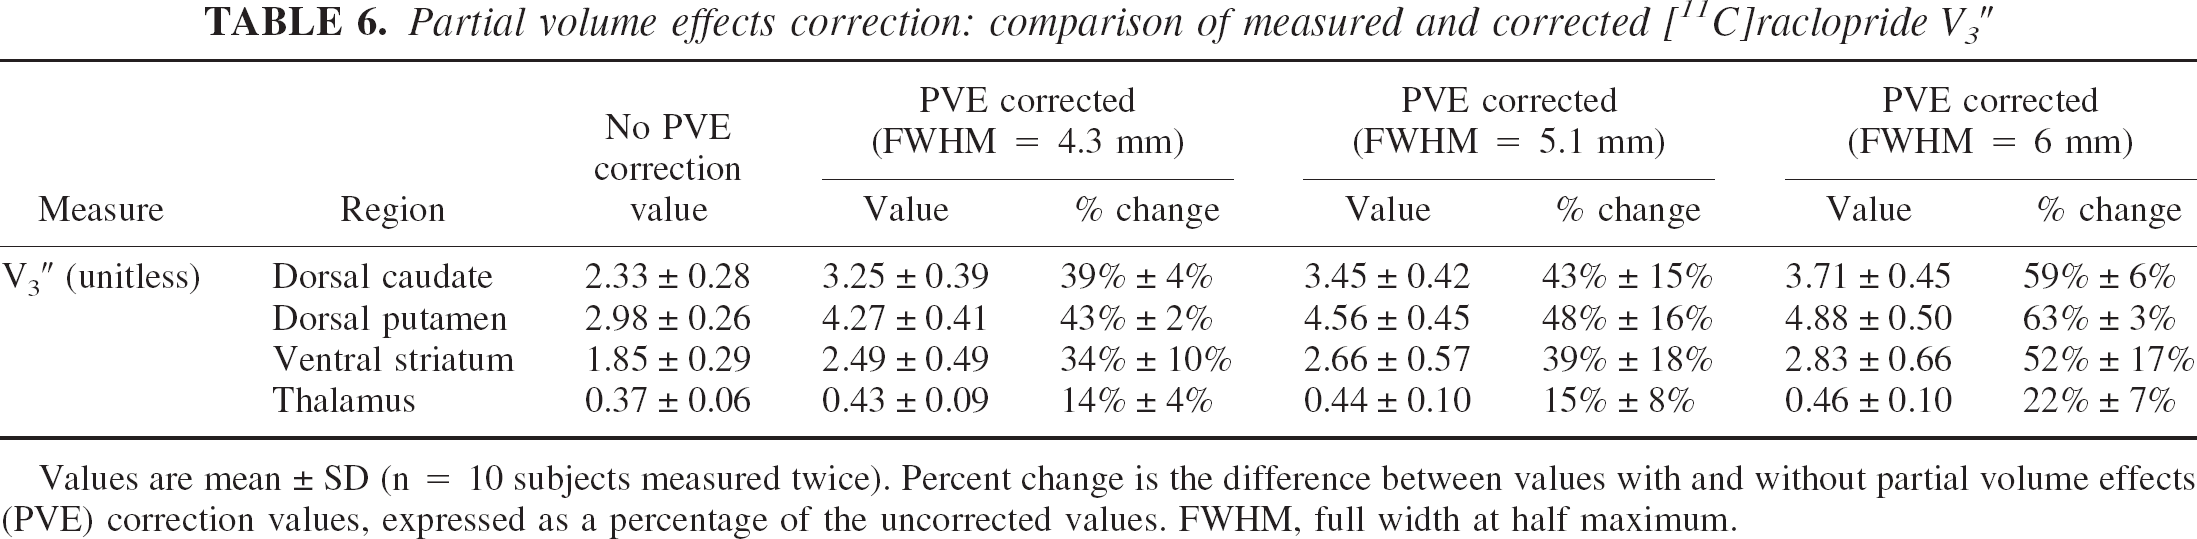
Values are mean ± SD (n = 10 subjects measured twice). Percent change is the difference between values with and without partial volume effects (PVE) correction values, expressed as a percentage of the uncorrected values. FWHM, full width at half maximum.
Regional fidelity of uncorrected images.
Table 7 provides for each target region the respective contributions of each source region to the specific binding signal, under realistic conditions (FWHM of 5.1 mm in the center of the FOV). At this resolution level, specific binding in the VST was significantly contaminated by counts spilling over from the adjacent DCA and DPU specific binding; 70% ± 5% of the specific binding measured in the VST originated from D2 receptors located in the VST, whereas 12% ± 3% and 18% ± 3% were contributed by D2 receptors in the DCA and DPU, respectively. Contamination from other regions was negligible in DCA, DPU, and thalamus (>90% of specific binding in these regions corresponded to authentic binding). In the VST, authentic specific binding corresponded to 74% ± 5% of measured specific binding at image resolution level (4.1 mm FWHM) and 66% ± 5% in the “worst case scenario” (6 mm FWHM).
Partial volume effects correction: specific binding matrix
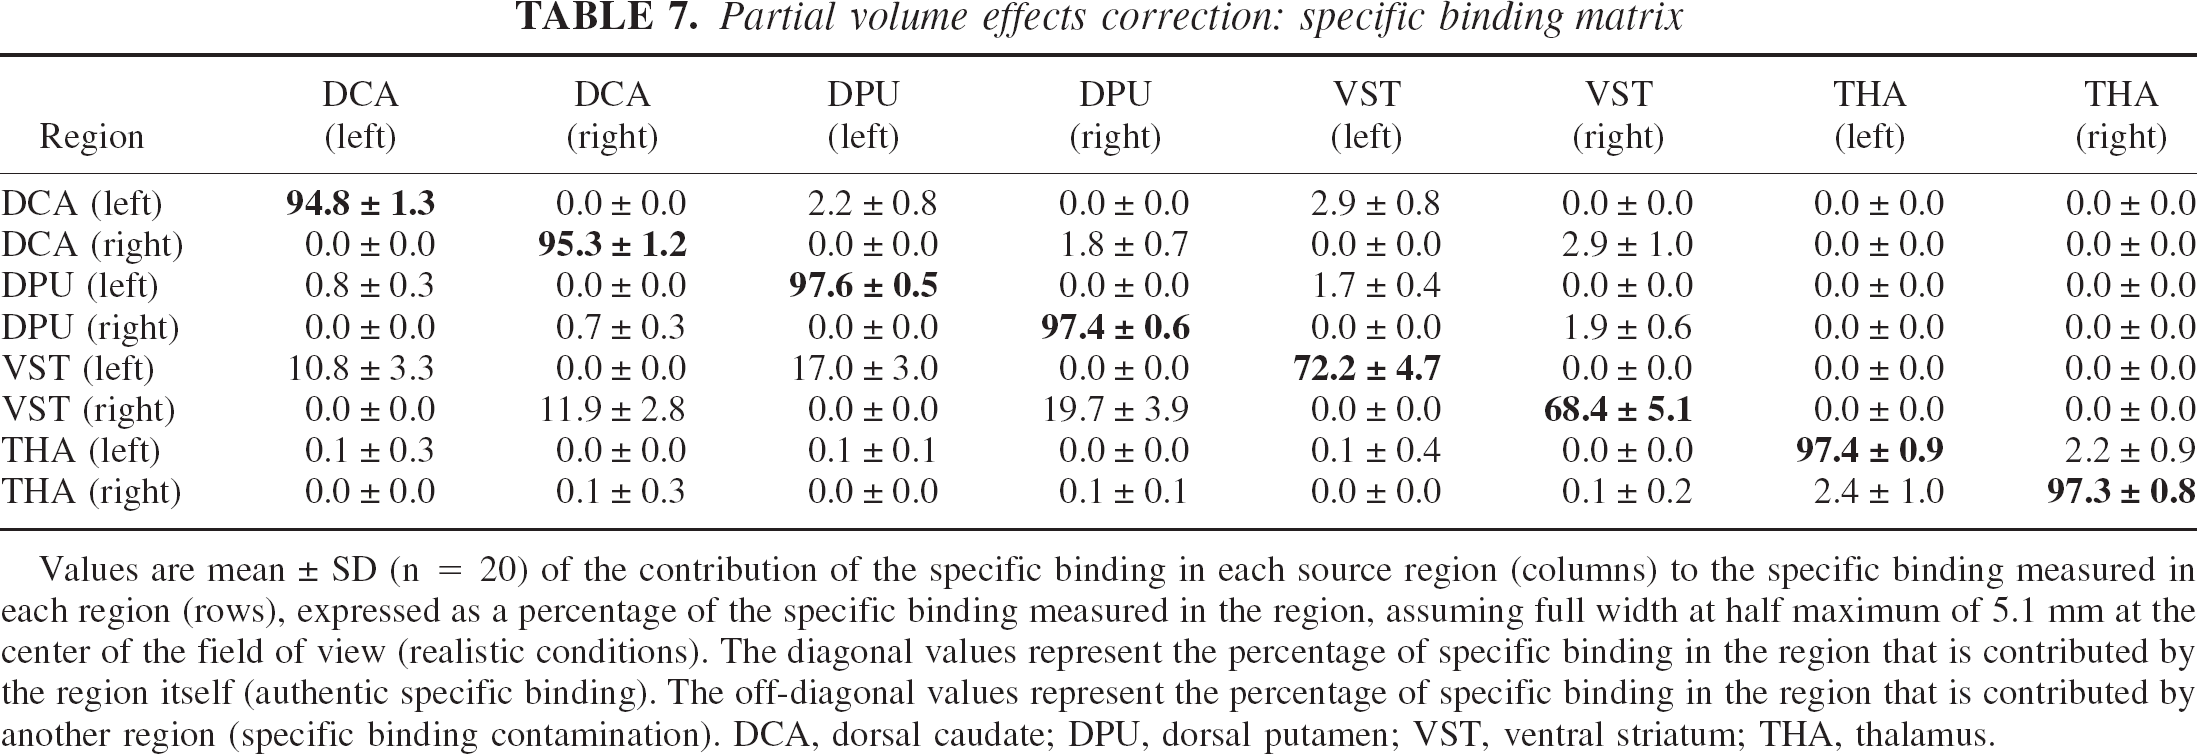
Values are mean ± SD (n = 20) of the contribution of the specific binding in each source region (columns) to the specific binding measured in each region (rows), expressed as a percentage of the specific binding measured in the region, assuming full width at half maximum of 5.1 mm at the center of the field of view (realistic conditions). The diagonal values represent the percentage of specific binding in the region that is contributed by the region itself (authentic specific binding). The off-diagonal values represent the percentage of specific binding in the region that is contributed by another region (specific binding contamination). DCA, dorsal caudate; DPU, dorsal putamen; VST, ventral striatum; THA, thalamus.
Partial volume effect correction and test–retest reproducibility.
Table 8 lists the test–retest variability of V3″ in DCA, DPU, and VST with no PVE correction and after PVE corrections using FWHM of 4.3, 5.1, and 6 mm, respectively. Partial volume effect correction resulted in no significant changes in test–retest variability in DCA, and resulted in a small but significant reduction in reproducibility in VST. Partial volume effect correction had no effect on the ICC values of the striatal subregions (P = 0.81).
Impact of PVE correction on V3″test-retest variability and reproducibility
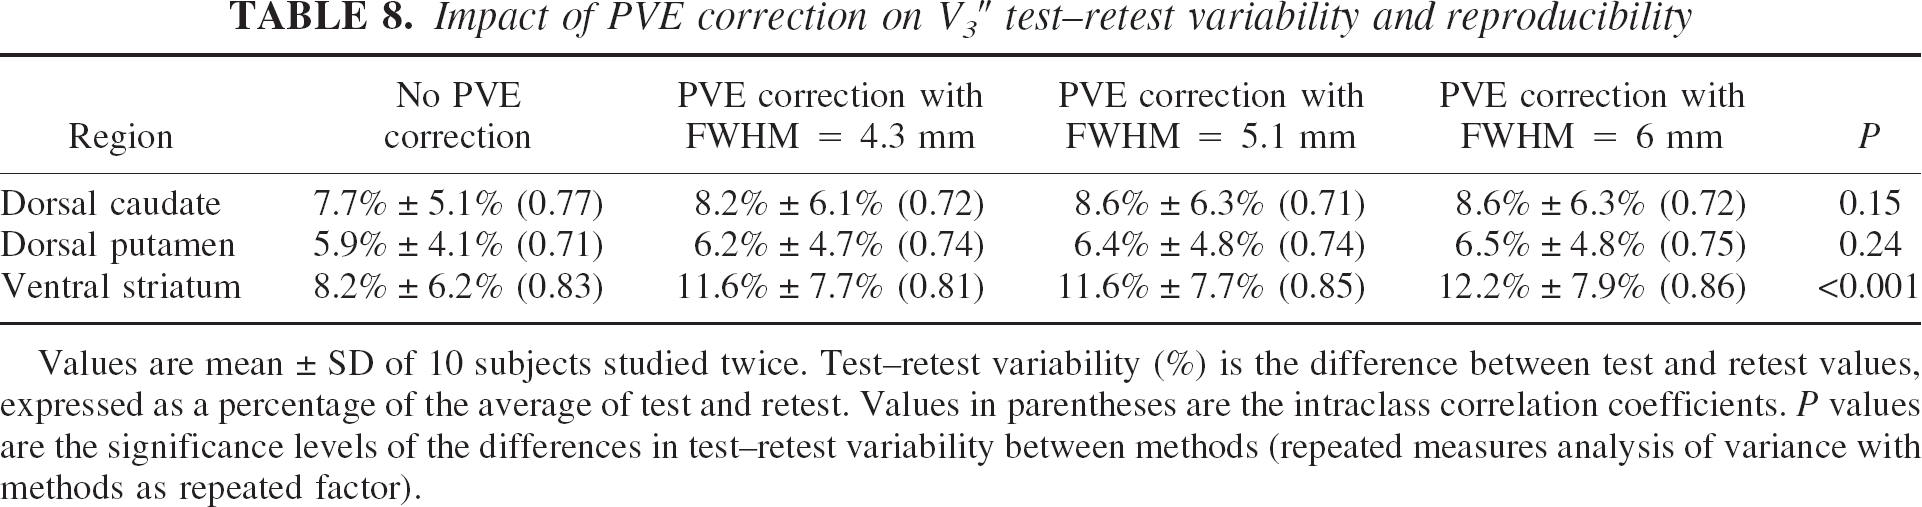
Values are mean ± SD of 10 subjects studied twice. Test–retest variability (%) is the difference between test and retest values, expressed as a percentage of the average of test and retest. Values in parentheses are the intraclass correlation coefficients. P values are the significance levels of the differences in test–retest variability between methods (repeated measures analysis of variance with methods as repeated factor).
Haloperidol studies
The first experiment was performed with an intravenous dose of haloperidol of 0.2 mg/kg. This dose reduced V3″ to 10% of its baseline value in the striatal regions, but V3″ in the thalamus was reduced by only 56% (Table 9). The two other experiments were performed with a higher dose of haloperidol (0.3 mg/kg intravenous) and produced similar results (Table 9). For example, in one subject, haloperidol reduced V3″ in the VST from 1.81 to 0.21 (89% decrease). In the same subject, V3″ in the thalamus was reduced from 0.53 to 0.27 (49% decrease). These experiments demonstrated that specific binding contributes to 90% of the difference between AROI and AREF in striatal regions, but to only 50% of this difference in the thalamus.
Haloperidol-induced decreases in [11 C]raclopride V3″
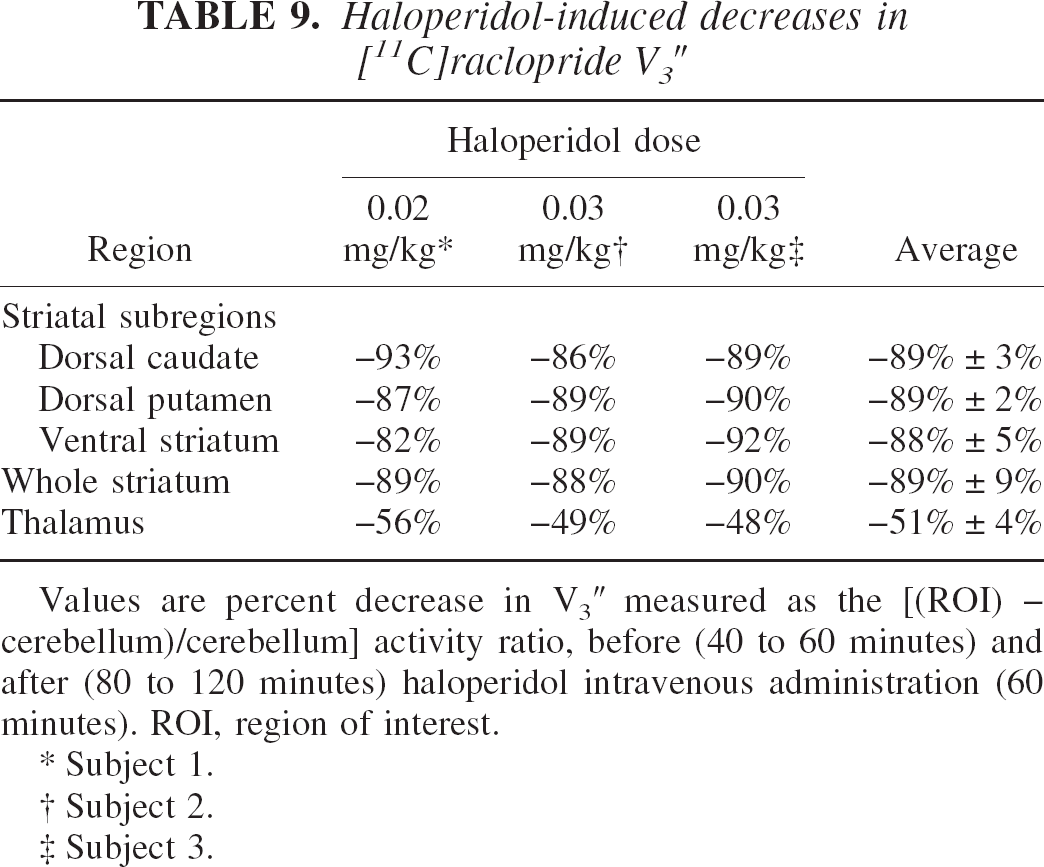
Values are percent decrease in V3″ measured as the [(ROI) – cerebellum)/cerebellum] activity ratio, before (40 to 60 minutes) and after (80 to 120 minutes) haloperidol intravenous administration (60 minutes). ROI, region of interest.
Subject 1.
Subject 2.
Subject 3.
DISCUSSION
In this study, the authors evaluated the feasibility of measuring D2 receptor parameters in the human VST with PET, the ECAT EXACT HR+, and [11C]raclopride. This investigation revealed that reliable estimates of both BP and V3″ can be obtained in the VST. The validation of this measurement was a critical prerequisite for the implementation of this method in the study of mesolimbic dopamine (DA) transmission in health and disease. However, several limitations should be acknowledged, including the challenge of obtaining conditions of sustained equilibrium with [11C]raclopride, the vulnerability of this measurement to head motion and misregistration, and, in the absence of PVE correction, the nonnegligible contamination of the signal by activities originating in the DCA and DPU.
Test–retest reproducibility
The test–retest variability of V3″ measurement in the VST was 8.2% ± 6.2%, and this variability was not significantly different from the variability of the relatively larger DCA (7.7% ± 5.1%) and DPU (6.0% ± 4.1%). Furthermore, the variabilities of these subregion measurements were similar to the variability of the striatum measured as a whole (6.3% ± 4.1%). Thus, subsampling striatal activities according to the method presented here is achieved without significant loss in measurement reliability. This test–retest variability was derived from the analysis of 10 consecutive pairs and all experiments were included in the analysis. With the exception of the ROI drawing, the analysis is completed by execution of computer scripts and is devoid of subjective intervention. The result thus is expected to represent an adequate estimate of the reliability that will be associated with clinical studies using this method.
The measurement test–retest variability observed in this study in the VST also is comparable to previously reported variability of measurements of dopamine receptor parameters in human striatum with PET. For example, Volkow et al. (1993) reported the reproducibility of [11C]raclopride measurements obtained in five subjects. Striatal ROIs were drawn directly on the summed PET scans on the two central sequential planes where the striatum was located. The percent change between test and retest was calculated as the average of the relative differences between test and retest values of STR VT to CER VT ratios and was −1.64% ± 6%. The average of the relative difference is a useful measure for evaluation of the presence of a bias between test and retest studies, which was the purpose of the Volkow et al. (1993) study. However, the actual variability in the measurement corresponds to the average of the absolute differences between test and retest. Calculated from Table 3 of Volkow et al. (1993), this variability was ± 5.25 ± 3.2%. This measure is still not comparable with the values reported in this study, because Volkow et al. (1993) reported the variability of the STR VT/CER VT ratio rather than the variability of the specific-to-nonspecific distribution volume ratio—that is, (STR VT/CER VT) − 1 or V3″. Note that the reproducibility of the STR VT/CER VT ratio is intrinsically better than the reproducibility of V3″ (Abi-Dargham et al., 2000b). Calculating V3″ reproducibility from Volkow et al. (1993) data yielded a test–retest variability of ± 7.06% ± 4.31% (n = 5), a value similar to the one reported here for the whole striatum (6.3% ± 4.1%, n = 10) and for the striatal subregions. In a study of the reproducibility of D1 receptor parameter measurements in the striatum with [11C]SCH23390, Chan et al. (1998) also reported on VT ratios rather than V3″, and reported a within-subject SD (or %CV) of 3%. When the number of repeated scans is 2, the within-subject %CV is smaller than the variability by a factor of
In this study, the test–retest variability of BP and V3″ were comparable, but the ICCs of BP were significantly better than the ICCs of V3″. This indicates that the normalization of the specific binding distribution volume (BP) to the cerebellum distribution volume (V2) to form V3″ did not markedly improve the reproducibility of the measurement and resulted in the loss of information regarding true between-subject differences. The lost information is a true (that is, reliable) between-subject difference in cerebellum V2. Because V2 is equal to f1/f2 (Eq. 7), this observation implies that subjects differed in this ratio. Whether these between-subject differences were mainly caused by differences in f1 or f2 (or both) cannot be determined with certainty. The authors failed to observe significant between-subject differences in f1 (f1 ICC was −0.07), but the reproducibility of this assay (test–retest variability of 18.2% ± 24.5%) was relatively poor, and true between-subject differences in f1 might have been undetected. The poor reproducibility of the f1 measurement was caused by the extremely low free fraction of [11C]raclopride in plasma (the average value of f1 was 3.44% ± 0.48%, which is in agreement with previously reported values, (Farde et al., 1989). Conversely, f2 is not directly measurable and is calculated from the f1/V2 ratio. As discussed in Materials and Methods, the use of V3″ or BP for between-subject comparisons implies the assumption that f2 or f1 is constant across subjects, respectively. The data reported here indicate that f2/f1 significantly differs between subjects, suggesting that one of these assumptions (and maybe both) are likely to be violated.
Bolus plus constant infusion with [11C]raclopride
The bolus plus constant infusion method was selected for this study because of several attractive features of this method (Laruelle et al., 1994a, 1994b). (1) Once equilibrium has been established, distribution volumes can be easily derived from simple activity ratios. (2) Because arterial and venous radiotracer concentrations equilibrate at steady state, this method enables derivation of brain distribution volumes relative to plasma without the need for arterial cannulation. Although several methods have been developed to derive V3″ from data obtained from single bolus injection experiments without input function measurements (Lammertsma et al., 1996; Logan et al., 1996), the derivation of BP (as defined here) from single bolus studies still requires measurement of the arterial input function. (3) Kinetic or graphic derivations of receptor parameters after single bolus studies assume that the rate constants governing the transfer of the radiotracer in and out of the brain do not change during the time frame of the experiment. This assumption might be violated in studies following pharmacologic or behavioral challenges that frequently affect rCBF in a time-dependent manner. In contrast, during a state of sustained equilibrium, there is no net transfer of radiotracer across the blood–brain barrier, and the outcome is not affected by rCBF changes during the measurement interval. (4) The bolus plus constant infusion method is attractive from the point of view of PVE correction. Because distribution volumes are directly measured on a collection of images representing static levels of activity, PVE correction can be applied once, using the mean measured activities of the frames. After single bolus injection, the constantly changing relative levels of activities in various brain regions require the PVE correction to be applied to each frame to derive PVE-corrected time-activity curves.
The bolus plus constant infusion method is ideally suited for radiotracers labeled with I-123 or F-18. Its implementation for C-11 labeled compounds is more challenging, given the need to establish equilibrium within a time frame constrained by the rapid decay of C-11. As previously discussed (Abi-Dargham et al., 1994; Watabe et al., 2000), the bolus-to-infusion rate ratio (Kbol) is a critical parameter for these experiments. Calculation of the optimal Kbol for a given subject requires a priori knowledge of the input function parameters and the brain impulse response function. Because these are unknown, the choice of Kbol is based on population parameters. The selected Kbol might be too high for some subjects (situation referred to as overshoot) or too low (undershoot) for others. If the scanning session is initiated too early, distribution volumes will be overestimated in case of overshoot and underestimated in case of undershoot. For these reasons, it is important to allow enough time between the beginning of radiotracer administration and initiation of the scanning session. Unfortunately, with [11C]raclopride, such a time-related safety margin is not available.
In the first published reports of [11C]raclopride bolus plus infusion experiments in humans, a Kbol of 135 minutes was used, and scanning was initiated at 30 minutes (Breier et al., 1997, 1998). In a limited number of subjects, these authors observed that R(t) measured over the 30-to 50-minute interval was not statistically different from R(t) measured over the 70-to 90-minute interval, an observation consistent with the assumption that equilibrium had been reached at 30 minutes (Breier et al., 1998). More recently, the same group published a refined analysis of these data, which suggested delaying the initiation of scanning to 40 minutes, and reducing Kbol to 105 minutes (Watabe et al., 2000). Analyzes of a new set of 23 experiments also suggested a Kbol of 105 minutes (Watabe et al., 2000). The authors followed these recommendations in the design of the current study. In addition, Ito et al. (1998) published a report in which [11C]raclopride Kbol values were individually optimized based on kinetic analysis of a single bolus study. In this study, Kbol varied from 52 to 91 minutes (n = 6), and R(t) during the 45-to 63-minute interval was similar to R(t) during the 63-to 81-minute interval.
In this study, the authors observed a small but significant average decrease of activity over time in ROIs. However, plasma steady state was achieved during the sampling interval, as evidenced by constant levels of unmetabolized [11C]raclopride venous concentration. Given the evidence of increased head movement, or registration errors, or both, over time (Fig. 3), the authors first entertained the possibility that the R(t) decrease over time in DCA and DPU might reflect increased misregistrations in the later frames. To test this hypothesis, data were reanalyzed using a large “striatal” ROI, whose boundaries largely exceeded the anatomic boundaries of striatal structures. In this analysis (data not shown), the authors observed a decrease of R(t) over time of the same magnitude observed in the DCA and DPU in the primary analysis. This result suggested that the decrease of R(t) over time was not caused by registration errors. Therefore, the current data supported the conclusion that a Kbol of 105 minutes might be associated with an average and moderate overshoot (Fig. 6), and that a component of the within-scan variability in R(t) was caused by imperfect equilibrium.
The SRTM represents another avenue to analyze these data that is not critically dependent on the choice of Kbol. The similarity between SRTM and equilibrium V3″ values demonstrated in this study crossvalidates both methods. Additional work is required to further establish the robustness of SRTM toward changes in rCBF taking place during the experiments. Beyond this, SRTM provided slightly but significantly better reproducibility in DCA and DPU, and equivalent reproducibility in VST and thalamus. At least 60 minutes of scanning time was required for SRTM to perform optimally.
Head motion and image registration
Measurement of activity in the VST was found to be extremely vulnerable to head motion. The VST is a small region, surrounded ventrally and medially by a colder background and dorsally and laterally by the hotter DCA and DPU (Fig. 4). Thus, any small shift of the sampled area relative to the location of the VST markedly affects the measured activity. Between-frame coregistration is a limited but nonetheless a critical step in minimizing the cumulative effects of head movement during the scanning session (90 minutes in this case). Thus, both accuracy and reproducibility of measurements in VST were critically dependent on the performance of AIR.
Automatic Image Registration aligns two images with similar count distributions by minimizing the variance of the ratios of one image to the other on a voxel-by-voxel basis. The underlying assumption that the variance ratio is minimized when the two PET images are perfectly aligned has been shown to be not strictly true, because of the random nature of radioactive decay. Thus, poor counting statistics are associated with errors in the registration process. Therefore, image smoothing before registration improves the accuracy of the registration (Woods et al., 1992). The authors previously observed that wavelet denoising of PET frames before realignment using AIR results in superior registration accuracy and makes the process largely independent from the threshold values chosen for the reslice and standard images (Mawlawi et al., 2000). In this study, the authors found that the AIR procedure applied to the denoised images was quite effective at reducing the noise in the time-activity curves in the VST (from 9.0% ± 4.9% to 6.4% ± 3.1%), improving test–retest variability in the VST (from 21.3% ± 16.9% to 8.2% ± 6.2%), and increasing the ICC in the VST (from −0.57 to 0.83). The authors also observed that AIR applied to denoised images provided superior reproducibility compared with AIR applied to original images (data not shown, see Martinez et al., 2000). Misregistration artifacts could possibly be further reduced by visual inspection of the scans and manual shift of the ROI boundaries. However, because this process involves subjective judgements, this option was a priori deemed unacceptable.
This analysis also revealed that the average brain translocation imposed by the realignment process was small (1.32 ± 0.36 mm per frame). The small head motion (1 to 2 mm) measured with this method was in agreement with head motion measured with an external tracking system (Green et al., 1994) in volunteers whose heads were embedded in the same head immobilization system (polyurethane head immobilizer) used in this study (unpublished data). The authors observed significant between-subject differences in translocation vector lengths, confirming the empirical observation that some subjects move more than others.
The length of the translocation vector also significantly increased during the scan. The authors' initial interpretation of this observation was that it reflected the fact that subjects become increasingly restless as the duration of the experiment increases. However, the poorer counting statistics of the later frames might introduce more error or randomness in the realignment process, despite the denoising step. To explore this hypothesis further, the authors performed AIR realignment of denoised [11C]raclopride frames obtained in baboons under anesthesia (n = 3 experiments). Because it is reasonable to assume that the baboon's head does not move, the expectation was that the translocation vector would be zero. In fact, the authors observed nonzero values of the translocation vector, as well as an increase of the translocation vector over time, from 0.54 ± 0.08 mm in the 20-to 30-minute frame to 1.43 ± 0.21 in the 60-to 70-minute frame. This observation confirmed the original observation of Woods et al. (1992) on phantom data, that within PET coregistration is associated with a signal-to-noise dependent error. The fact that AIR is associated with error is also suggested by the observation that in two subjects, with almost perfect reproducibility of VST in the absence of any frame-to-frame registration, the AIR procedure actually resulted in a small increase in test–retest variability (Fig. 7). Additional work is required to characterize the relation between NEC and the magnitude of this error, to introduce a threshold of the translocation vector below which the registration is omitted. Another strategy to explore would be to vary the level of smoothing as the NEC rate decreases with scan duration.
Protocol optimization
The poorer counting statistics and apparent increases in head motion observed in later frames suggested that these frames might introduce as much noise as valuable information to the measurement. Indeed, evaluation of test–retest reproducibility over different scan durations revealed that the last two frames could be deleted without any loss of reproducibility (Fig. 8, upper row), suggesting that a Tend of 80 minutes would be appropriate. In addition, a decrease in the scanning time, and therefore in the duration of [11C]raclopride infusion, will increase the fraction of activity available at the beginning of the experiment that will be injected into the subjects (less of the activity will decay while in the infusion pump). Thus, more NEC would be recorded per unit time. Computations of the total NEC collected during the scan in relation to scan and infusion duration for a fixed activity dose, with a Kbol of 105 minutes and a Tstart of 40 minutes, revealed that 101 minutes was the optimal scan duration, beyond which the total NEC recorded during the scan starts to decrease (see Appendix). Thus, scanning and infusing for 90 minutes still records more NEC than scanning and infusing for 80 minutes. Nonetheless, this analysis does not take into account the increase in head motion over time and the increasing difficulties in coregistration associated with poor counting statistics. These factors are responsible for the observation that, while infusing for 90 minutes, scanning for 80 minutes is as good as scanning for 90 minutes. Therefore, scanning for 80 minutes while infusing for 80 minutes should translate into a net gain in measurement quality.
The question of Tstart is more complicated to assess. Tstart of 40 minutes might be associated with a population average bias toward slight overestimation of V3″ (given a Kbol of 105 minutes), but analysis of the effect of Tstart on the test–retest reproducibility revealed that only the first scan could be deleted without penalty. Thus, a Tstart of 45 minutes might reduce the bias associated with lack of equilibrium, but the gain associated with this modification is not as evident as the gain associated with deleting the last 2 frames.
In this study, data were acquired continuously for the entire 90 minutes. In the clinical implementation of this protocol, it would not be required to start scanning before 40 minutes. The reduced scanning time (40 to 80 minutes instead to 0 to 90 minutes) should reduce the head motion associated with prolonged scanning sessions. Thus, the combination of a shorter scanning time (40 to 80 minutes) with increased NEC might translate into further improvement in reliability of outcome measures.
Partial volume effect correction
Postreconstruction PVE correction methods are based on the linear property of the PSF as an operator acting on the image space. This property leads to great simplification of the modeling of PVE, because each homogenous source of activity can be treated as a separate image. Based on this property, published methods essentially differ on the number and nature of “regions” that can be treated as homogenous from the point of view of activity. At one extreme, regions can be defined in terms of tissue classes (gray, white, CSF) (Meltzer et al., 1990, 1999; Muller-Gartner et al., 1992; Labbe et al., 1996). At the other extreme, each pixel could be considered as a region, although this method would be impractical and associated with large propagation of error. Between the two, the assumption of homogenous activities within anatomically defined ROIs offers an appropriate compromise, in terms of plausibility, flexibility, and feasibility (Labbe et al., 1998; Rousset et al., 1998). In this study, a modified version of the method developed by Rousset et al. was used (1998), with the main difference being in the model formation of the PSF in image space. The authors previously validated their implementation of this method in the scanner used in these studies (Slifstein et al., 2000).
The accuracy of PVE correction is highly dependent on several factors, including appropriate model formation of the PSF, proper identification of the ROIs, and correct PET to MRI coregistration. Another important factor in human studies is head motion during frame acquisition, which can be modeled as an additional blurring over and above the intrinsic blurring of the system and of the image reconstruction process. Because no external monitoring system was available in this study, estimates of head motion were derived from the brain translocation imposed by AIR on between-frame realignment. Therefore, the use of a 5.1-mm FWHM at the center of the FOV is based on a reasonable estimator of the effective final resolution, whereas the PVE correction using a 6 mm FWHM should be viewed as an upper limit.
Partial volume effect resulted in significant increases in activity in all striatal subregions. The magnitude of this increase (40% to 60%) was consistent with corrections applied to human basal ganglia phantoms (Rousset et al., 1998) and with previously published PVE corrections of striatal [18F]DOPA concentrations (Rousset et al., 2000). Interestingly, despite the smaller size of the VST compared with the DPU and DCA, the net relative increase in VST resulting from PVE correction was smaller than in the DCA and DPU (Fig. 10). The reason for this apparent paradox is that the VST is more contaminated by the other two regions, because of regional differences in size and true activities.
Enhanced quantification accuracy after PVE correction results from improved recovery and decontamination. Although all three ROIs (DCA, DPU, and VST) were affected by incomplete recovery, only the VST was significantly affected by contamination. To correct for recovery per se is important for between-subject comparisons, provided that differences in regional volumes of interest are large enough to justify the propagation of error associated with PVE correction. Partial volume effect correction might not be required for within-subject experimental design, to the extent that the conditions under study (such as changes in receptor availability) do not affect the volumes of interest and that contamination is not an issue. For example, the authors previously demonstrated both experimentally and theoretically that the estimation of the occupancy of 5-HT1A receptors by pindolol in the dorsal raphe nuclei as measured with PET and [11C]WAY 100635 is unbiased by the large PVE affecting this region, essentially because this structure is located in the middle of a large region devoid of specific binding and is not contaminated by specific binding from other regions (Martinez et al., 2001).
The PVE correction analysis reported here demonstrates that this condition is not fulfilled for the [11C]raclopride signal in the VST. During realistic conditions (FWHM = 5.1 mm), only 70% ± 5% of the specific binding measured in the VST originates from D2 receptors located in the VST, whereas 12% ± 3% and 18% ± 3% are contributed by D2 receptors in the DCA and DPU, respectively. During less favorable conditions (FWHM = 6 mm), these estimates changed to 66% ± 5%, 14% ± 3%, and 21% ± 4% for the VST, DCA, and DPU contributions, respectively. The nonnegligible contamination of the VST signal by the DPU and DCA supports the usefulness of PVE correction for the measurement of D2 receptor parameters in this region, not only between subjects, but also for within-subject designs. For example, studies comparing mesolimbic and nigrostriatal occupancies of D2 receptors by dopamine or antipsychotic drugs will gain power from PVE correction.
Another strategy for handling the contamination problem would be to optimize the size and location of the sampling area, to sample the signal in an area associated with lower contamination. The delineation of such a subsampling region could be defined on the blurred DCA and DPU MRI binary images, so as to remain less than an acceptable contamination threshold. Subsampling of the VST would also reduce vulnerability to misregistration, but would be associated with decreased counting statistics. A comparison of these two methods in terms of gain in accuracy and loss of reproducibility is warranted.
Comparison with in vitro values
The primary analysis of the images revealed significantly lower D2 receptor availability in the VST compared with the DCA and DPU. The lower [11C]raclopride uptake in the VST relative to the DCA and DPU was readily visible on the scans (Fig. 4). The lower D2 receptor availability in the VST was still present after correction for PVE (after PVE correction, the VST D2 receptor availability was equal to 77% ± 11% of the DCA value). The authors reviewed human postmortem autoradiographic studies performed with radiolabeled antagonists that provided measurements of D2 receptor densities in caudate nucleus, putamen, and nucleus accumbens (De Keyser et al., 1988; Camps et al., 1989; Joyce et al., 1991; Kessler et al., 1993; Lahti et al., 1995; Hall et al., 1996). To facilitate comparison between these studies, D2 receptor density-related measures in accumbens and putamen were expressed as percentages of values reported for the caudate nucleus (Table 10). Considerable between-study variability was noted, with accumbens D2 receptor densities ranging from 43% to 132% of the caudate nucleus values, with an average of 86% ± 30%. Therefore, the VST D2 receptor availability reported here (77% ± 11%) appears to be consistent with postmortem studies.
Relative distribution of D2 receptors in striatal subregions
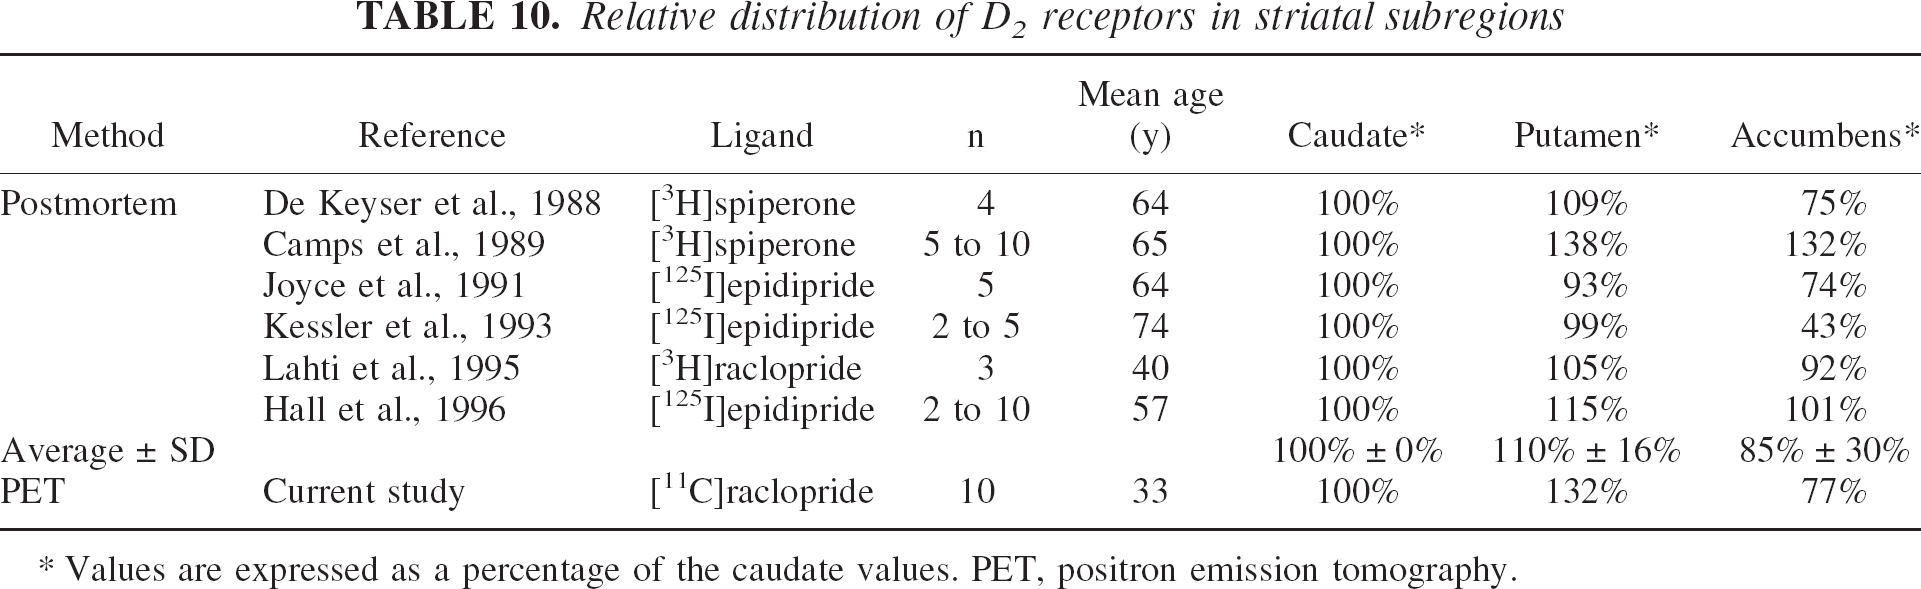
Values are expressed as a percentage of the caudate values. PET, positron emission tomography.
Several factors limit this comparison, such as differences in the anatomic boundaries of the regions studied or in subject age (subjects engaged in this study were younger than subjects included in postmortem studies). In addition, the presence of endogenous dopamine might result in a larger underestimation of D2 receptor availability in the VST compared with DCA and DPU. The ligands considered here (raclopride, epidipride, and spiperone) bind to both D2 and D3 subtypes of D2-like receptors (Levant, 1997). The relative contribution of D3 receptors to “D2-like” receptor binding is higher in the VST (33% in nucleus accumbens, 26% in ventral putamen, and 20% in ventral caudate) than in dorsal caudate (12%) and dorsal putamen (18%) (values extrapolated from Table 2 in Gurevich and Joyce, 1999). Sokoloff et al. (1990) reported dopamine affinity of 474 nmol/L and 25 nmol/L for D2 and D3 receptors, respectively, an observation replicated by several laboratories (Levant, 1997). Therefore, endogenous dopamine in vivo will be more effective at competing with [11C]raclopride in VST compared with DCA and DPU, a factor that would not affect postmortem measurements on washed slides.
[11C]Raclopride uptake in the thalamus
The presence of nonnegligible levels of D2 receptors in the human thalamus is well documented. While there is considerable heterogeneity of D2 receptor distribution among various thalamic nuclei, the average concentration of these receptors in thalamus corresponds to approximately 10% of their concentration in the DCA (Kessler et al., 1993; Hall et al., 1996; Gurevich and Joyce, 1999). The thalamic D2 receptors are readily visualized and quantified in the human thalamus with PET and the use of high affinity PET radiotracers. For example, [18F]fallypride V3″ is 2.9 ± 0.3 in the human thalamus, versus 27.3 ± 2.7 in the caudate (n = 4) (Abi-Dargham et al., 2000a). Given a [11C]raclopride V3″ in the DCA of 2.33 ± 0.28, the expected V3″ of [11C]raclopride in the thalamus would be in the 0.2 range. The observed [11C]raclopride V3″ in the thalamus was 0.37 ± 0.06, corresponding to 16% of V3″ in the DCA, which was larger than expected.
A first hypothesis to account for this difference was that the thalamic ROI might be significantly contaminated by adjacent striatal activities. However, PVE correction revealed that this contamination was negligible (<0.1%). Haloperidol displacement experiments were then performed to assess the true levels of specific binding in the thalamus. At doses that reduced the specific binding to 10% of its baseline value in the striatum, thalamic “specific binding” was reduced by only 50% (Table 9). In other words, these experiments revealed that the nondisplaceable compartment (equal to the free and nonspecific binding) is approximately 10% greater in the central gray structures of the striatum and thalamus compared with the cerebellum. Subtle regional differences in nonspecific binding are not an issue for the quantification of specific binding in the striatum. However, in the thalamus, nonspecific binding accounts for about half of the difference between thalamic and cerebellar [11C]raclopride uptake, and this observation accounted for the overestimation of measured thalamic V3″ relative to expected values. Therefore, [11C]raclopride thalamic specific binding can not be derived from the difference between thalamic and cerebellar activities, which makes the use of this ligand to quantify D2 receptor availability in the thalamus impractical. In addition, the test–retest variability of thalamic V3″ was high (± 19.2 ± 18.5%) and the ICC of thalamic uptake was poor (0.33). Thus, in the authors' opinion, [11C]raclopride is not a ligand of choice to measure D2 receptor availability in the thalamus.
Conclusion
This study demonstrated that reliable estimates of D2 receptor availability parameters can be obtained in the human VST using [11C]raclopride, the ECAT EXACT HR+PET scanner, and the bolus plus constant infusion method. Relative D2 receptor availability in the VST, DCA, and DPU measured in this study was consistent with predictions from postmortem studies. The test–retest variability associated with the measurement in the VST was comparable with the one associated with measurements of activities in DCA and DPU, and in the striatum as a whole. In contrast, the measurement of thalamic D2 receptors with [11C]raclopride was found to be unreliable and of questionable physiologic significance. Determination of D2 receptor parameters in the VST was found to be critically vulnerable to head motion and misregistration. These studies require a good head immobilization system, a good cooperation from the subjects, and an effective frame realignment algorithm. Automatic Image Registration applied to denoised frames was effective at realigning the frames and improving the precision of the VST measurement, but its performance was affected by low counts in the later frames. Reducing the scanning time from 0 to 90 minutes to 40 to 80 minutes should translate into further improvement of reproducibility, because of reduced head movement and higher counts per frame. Partial volume effect analysis revealed a significant contamination (approximately 30%) of the counts measured in the VST by counts originating from the DCA and DPU. Thus, PVE correction is desirable for both between-and within-subject experimental designs. The demonstration of an appropriate accuracy and precision of D2 receptor parameters measurements with [11C]raclopride in the VST is the first critical step toward the use of this ligand to study synaptic dopamine transmission at D2 receptors in the VST using competitive techniques (Laruelle, 2000).
Footnotes
Acknowledgments:
The authors thank Richard Carson, Ph.D. and Adrian Lammertsma, Ph.D. for sharing data and insights, and Suehee Chung, Nicole Eftychiou, Ingrid Gelbard, Bea Reig, Julie Montoya, Audrey Perez, Mali Pratap, Justine Pidcock, Richard Weiss, Kris Wolff, and the technologists of the Columbia PET Center for excellent technical assistance.
APPENDIX
The following computation was performed to find the scan duration that maximizes the total recorded noise equivalent counts (NEC) using a bolus plus constant infusion of a C-11 labeled radiotracer, with the constraints that scanning starts at 40 minutes and Kbol is fixed at 105 minutes. Let ID equal the total injected dose and α represent the fraction of ID contained in the bolus. Then Kbol satisfies the following equation:
Let Tend represent the total infusion time. Then
Assume that the peak value of the NECR curve is proportional to the bolus dose αID, say peak = a × αID. Also assume NEC rate follows a monoexponential profile starting at time p, the time of the peak, with decay constant λ = ln(2)/(half-life of 11C) = 0.034 (mean P = 4.25 ± 1.46 minutes). Then the area under the NECR curve from t = 40 to the end of the infusion is
The value of α that maximizes this expression is independent of p, a, and ID and is equal to 0.51. The associated Tend is 101 minutes.