
Abstract
We validated the use of a novel image-based method for partial volume correction (PVC), structural–functional synergistic resolution recovery (SFS-RR) for the accurate quantification of dopamine synthesis capacity measured using [18F]DOPA positron emission tomography. The bias and reliability of SFS-RR were compared with the geometric transfer matrix (GTM) method. Both methodologies were applied to the parametric maps of [18F]DOPA utilization rates (kicer). Validation was first performed by measuring repeatability on test–retest scans. The precision of the methodologies instead was quantified using simulated [18F]DOPA images. The sensitivity to the misspecification of the full-width-half-maximum (FWHM) of the scanner point-spread-function on both approaches was also assessed. In the in-vivo data, the kicer was significantly increased by application of both PVC procedures while the reliability remained high (intraclass correlation coefficients >0.85). The variability was not significantly affected by either PVC approach (<10% variability in both cases). The corrected kicer was significantly influenced by the FWHM applied in both the acquired and simulated data. This study shows that SFS-RR can effectively correct for partial volume effects to a comparable degree to GTM but with the added advantage that it enables voxelwise analyses, and that the FWHM used can affect the PVC result indicating the importance of accurately calibrating the FWHM used in the recovery model.
INTRODUCTION
Positron emission tomography (PET) is a molecular imaging technique that produces quantitatively accurate measurements of tracer concentrations in vivo. It facilitates the detection of biologic processes in health and disease, where it may be particularly useful as functional changes induced by pathology often precede structural alterations. 1 For example, in schizophrenia and dementia, functional changes are evident before the brain structural alterations become prominent, and show progressive changes, prompting great interest in functional measures and PET in particular for diagnostic and prognostic use.2–5
However, some technical limitations have proved a challenge for the study of such disorders using PET. Although PET/CT systems enable quantitative biases introduced by attenuation and scatter to be corrected, 6 partial volume effects (PVEs) remain a significant limit on data accuracy in PET. Partial volume effects in imaging studies comprise the so-called image ’blurring’, or signal spillover between regions, because of the finite spatial resolution of the imaging system. 7 Positron emission tomography is more susceptible to this than magnetic resonance imaging (MRI) because of its relatively lower spatial resolution.
Various methods have been proposed to correct for PVEs in PET imaging.8–13 These generally deconvolve the signal by the point-spread-function (PSF) of the scanner, incorporate anatomic information to correct across a given region and assume homogeneity within the tissue in the region to avoid noise amplification. 14 Thus, the correction is performed at a regional level and it provides mean values for predetermined regions but does not provide a partial volume corrected image. This is a limitation if one wishes to adopt a voxel-by-voxel level of analysis.
We have recently developed a novel image-based method for partial volume correction (PVC), structural–functional synergistic resolution recovery (SFS-RR), which seeks to address the limitations of previous approaches to PVC (Figure 1). Structural–functional synergistic resolution recovery uses a complex wavelet-transform and structural information to regularize the solution and therefore eliminates the confounding effects due to structural variability. 15 We have shown that SFS-RR has less effect on the variability of imaging data than two other image-based PVC algorithms (Lucy-Richardson and Van-Cittert methods).15,16 We are now seeking to further evaluate the SFS-RR methodology in a clinical context using as a reference the standard PVC methodology used in the field.
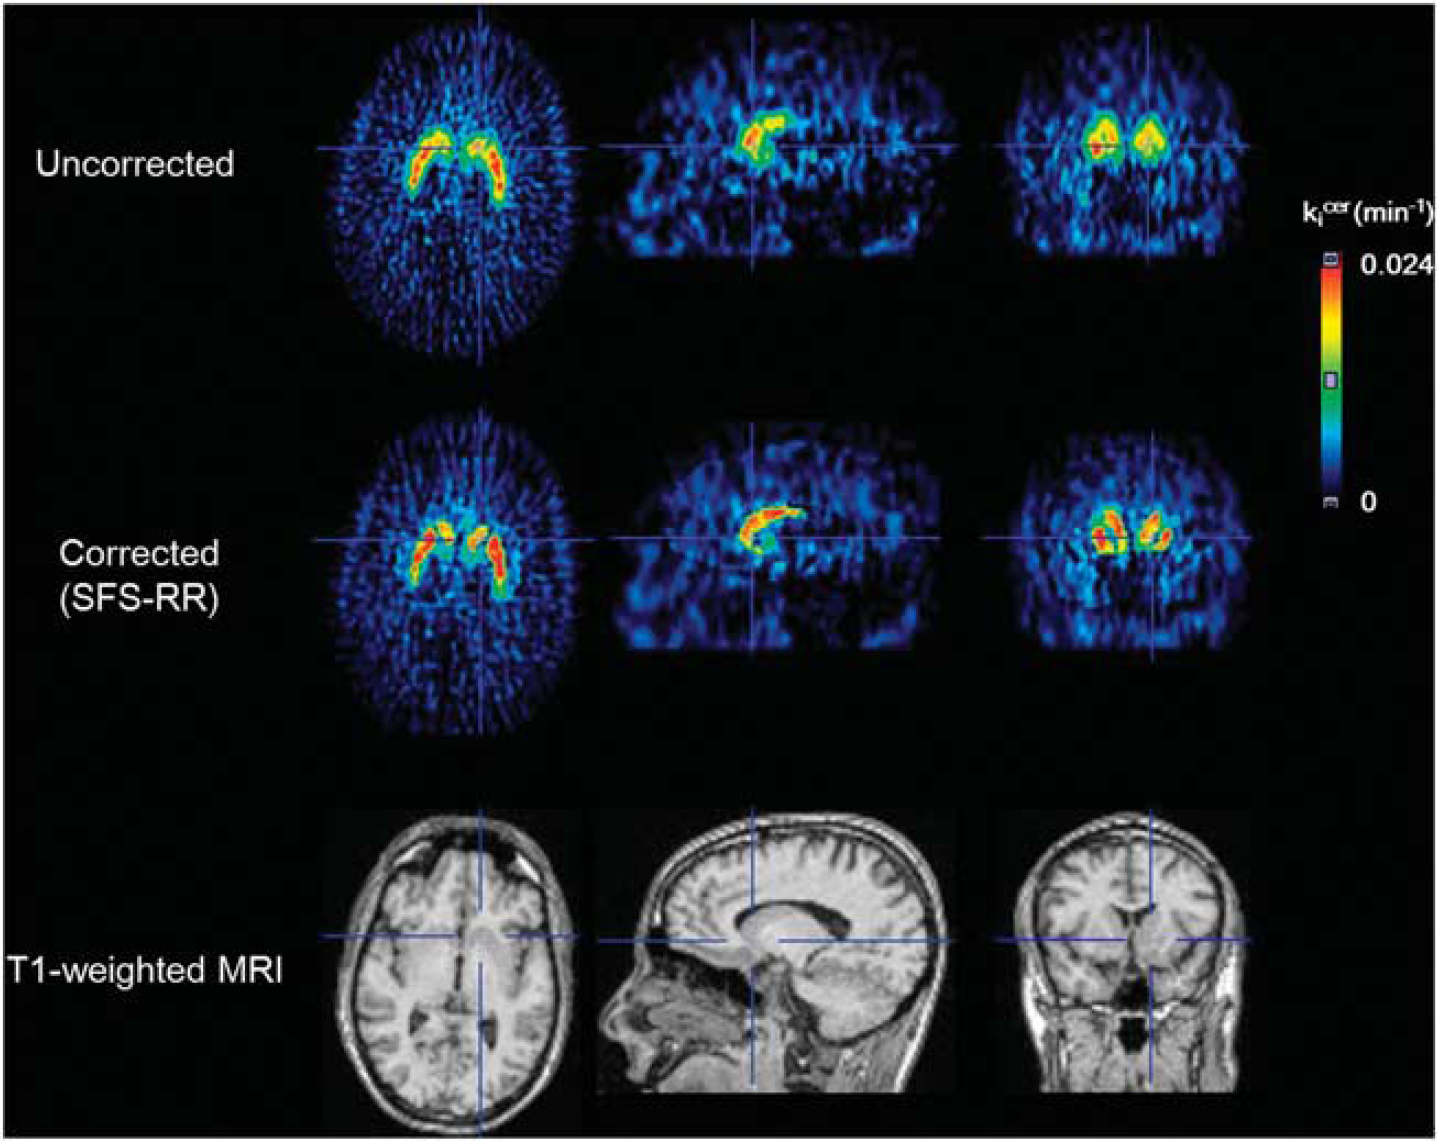
Partial volume correction using structural–functional synergistic resolution recovery (SFS-RR) in parametric images of [18F]DOPA (kicer). The first and second rows show the parametric images before and after application of SFS-RR. The last row shows the magnetic resonance image used to recover the resolution of parametric images. SFS-RR corrects partial volume effects at the voxel level. MRI, magnetic resonance imaging.
In this study, our objective was to use SFS-RR 15 to correct for PVEs in [18F]DOPA PET imaging data and compare its performance in terms of bias correction and reliability with the geometric transfer matrix method (GTM, as described by Rousset et al 17 ), one of most commonly used PVC approaches in clinical studies. Comparison was performed at the regional level because, while SFS-RR corrects whole images, GTM does not. Reliability was assessed on test–retest clinical data while the precision of both methodologies was evaluated on data recovery using simulated digital data. Since PVC methodologies require in their model a full-width-half-maximum (FWHM) to be specified for the PSF, we investigated the effect of varying FWHM values on both approaches.
MATERIALS AND METHODS
The present study was approved by the Hammersmith Hospital Research Ethics Committee. The Administration of Radioactive Substances Advisory Committee (ARSAC) granted permission to administer [18F]DOPA to healthy volunteers.
Participants
Eight healthy volunteers (mean (± s.d.) age 23.6 ± 3.5 years, range 19 to 28 years, five male) participated in the test–retest study (as described in Egerton et al 18 ). After complete description of the study to the volunteers, written informed consent was obtained. Subjects were excluded if they had a current or past history of head injury or of a neurologic or psychiatric disorder, including substance dependence, or medical condition (other than minor self-limiting conditions), or if they were taking any psychotropic medication. Subjects underwent structural MRI to exclude intracranial abnormalities and for the PVC. The structural MRI scanning was performed on a 3-tesla Philips (Best, The Netherlands) Intera scanner. A high-resolution T1-weighted turbo field echo structural scan was acquired for each participant (echo time, 4.6 ms; repetition time, 9.6 ms; flip angle, 8°; field of view, 240 mm; voxel dimensions, 0.94 × 0.94 × 1.2 mm; matrix, 208 × 256; slice thickness, 1.2 mm).
Positron Emission Tomography Data Acquisition
Each subject had two scans with at least 2 weeks apart. All PET scans were performed on an ECAT EXACT3D (Siemens/CTI, Knoxville, TN, USA) PET tomograph (spatial resolution: 4.8 ± 0.2 mm; sensitivity: 69 cps/Bq per mL). High-resolution whole-brain images (2.1 mm × 2.1 mm) were reconstructed from 95 planes with a slice spacing of 2.425 mm.
Carbidopa (150 mg) and entacapone (400 mg) were orally administered 1 hour before imaging to reduce the formation of radiolabeled [18F]DOPA metabolites, 19 increasing the signal-to-noise ratio. 20 Subjects were positioned with the orbitomeatal line parallel to the transaxial plane of the tomograph, and head position was marked and monitored via laser crosshairs and a camera. Head movement was minimized by a molded head rest and light straps. Before injection of the radiotracer, transmission scanning was conducted using a 150-MBq cesium 137 rotating point source to correct for attenuation and scatter. The emission scans over 95 minutes were performed after a bolus intravenous injection of 150MBq of [18F]DOPA and the acquired data were rebinned into 26 time frames (comprising a 30-second background frame, four 60-second frames, three 120-second frames, three 180-second frames, and finally fifteen 300-second frames), and reconstructed using a three-dimensional reprojection algorithm.
Kinetic Analysis
To correct for head movement during the scan, non-attenuation-corrected dynamic images were denoised using a level 2, order 64 Battle-Lemarie wavelet filter, 21 and individual frames were realigned to a single frame acquired 8 minutes after [18F]DOPA injection using a mutual information algorithm. 22 The transformation parameters were then applied to the corresponding attenuation-corrected frames, and the realigned frames were combined to create a movement-corrected dynamic image for analysis. The [18F]DOPA utilization was determined relative to uptake in the cerebellum, 23 to give the influx rate constant, kicer (where ki indicates it is the influx constant and cer denotes that the cerebellum was used as the reference region)—denoted as ki in some previous publications. 24
Voxel-based kicer parametric images of the brain were created from movement-corrected images using a wavelet-based Patlak approach. 25
Standardized regions-of-interest (ROIs) for calculating kicer were defined in the cerebellum (the reference region) and bilaterally in the caudate nucleus and putamen, using the Hammersmith atlas, a probabilistic anatomic atlas derived from MRI images. 26 To generate these standardized ROIs, the subject's MRI image was first segmented using SPM5 according to the Unified Segmentation method. 27 Then, the segmented gray matter with <50% of white matter probability and the Hammersmith atlas, 26 which was normalized to the subject's MRI space using SPM5, were overlapped. Finally, the individualized Hammersmith atlas in MRI space was transformed into PET space, using the weighted summation PET image (frames 1 to 26) as a reference image for the PET space to facilitate accurate registration.
Partial Volume Correction Algorithms
In this study, two PVC algorithms, SFS-RR and GTM methods, were performed for both clinical and simulated [18F]DOPA parametric images.
The GTM method is a regional mean value correction algorithm for nonoverlapping regions (denoted as D, where D indicates tissue domain assumed for homogeneous activity distribution) covering the brain.10,17 The algorithm assumes that the observed activity concentration tj within a region Dj can be simply expressed as follows:

where N is the total number of D's, Ti represents the true activity concentration of Di, and the weighting factors ω ij represent the contribution of spillover from Di into Dj, which in turn can be expressed as;
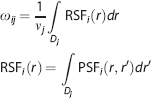
where nj represents the total volume of Dj. The RSF of a given Di is regional-spread function defined by PSF. The oij factors make up a matrix of regional geometric transfer coefficients (GTM). Partial volume-corrected concentrations are obtained by GTM inversion and multiplication by the set of observed values in region D.
Structural–functional synergistic resolution recovery is an image-based algorithm that achieves accurate PVC by incorporating external information that can be provided by a coregistered CT, MRI, or an anatomic atlas to provide additional structural information. The resolution recovery process is performed by the accurate weighting of the functional versus structural information in the wavelet space. 15 Since the finite spatial resolution of PET blurs the distribution of signal in the image, the SFS-RR algorithm replaces the high-resolution component of PET image with those of the structural image, which has superior spatial resolution, to recover the resolution of PET image. The algorithm is based on the multiresolution property of the wavelet transform. The amount of structural input is weighted by the difference in spatial resolution between the two images as follows;

where the high-resolution component (named as wavelet coefficients) of the PET image is djPET, djana is the corresponding anatomic components, and djcorr is the resolution recovered wavelet coefficient. djPET is replaced in part with djana using three scaling parameters (αj, βj, and γj). Parameter αj is the global ratio between djPET and djana at each resolution level j and multiplies djana to compensate for the difference in intensity between the anatomic and the PET images. Parameter γj is a statistical branching factor, the sum over the regional squared deviations of djPET is divided by the sum of the global deviations of djPET, and weights the anatomic versus the functional information.
A brain mask (connected component analysis with threshold 0.1%) was used to restrict the estimation of γi to voxels within the brain. Parameter βj is the SFS-RR coefficient, which accounts for the different resolution of the target PET and reference structural images. Note that βj is obtained as the ratio of djana of the original anatomic image to a ’filtered version of djana’ (i.e., with a 3D Gaussian filter to match the PET image resolution). Therefore, a predefined FWHM value for the PSF is necessary to derive βj.
Application of Partial Volume Correction
The application of GTM and SFS-RR algorithms to [18F]DOPA parametric images was performed for each of the eight subjects.
For the GTM method, three types of region D definitions, derived from the Hammersmith atlas 26 and segmented gray/white matter images transformed into the subject's PET space, were used. These comprised of (1) whole striatum, gray matter, white matter, cerebellum and other brain regions (N = 5), (2) whole caudate, whole nucleus accumbens, whole putamen, gray matter, white matter, cerebellum, and other brain regions (N = 7), and (3) left/right caudate, left/right nucleus accumbens, left/right putamen, gray matter, white matter, and other brain regions (N = 9).
For the SFS-RR method, the structural image was also generated from the Hammersmith atlas 26 and segmented gray/white matter images transformed into the subject's PET space. Briefly, segmented gray/white matter images and the individualized Hammersmith atlas transformed into the subject's native MRI space were combined and then transformed into the PET space. In the PET space, the average of each segmented-anatomic region on the parametric image was assigned to the intensity values of structural image for each region. 28 To reduce the noise of the parametric maps, a 3D Gaussian filter with 4 mm FWHM was applied before entering it into the SFS-RR method. Because present data sets were reconstructed by the same algorithm and parameters with the previous data set, which optimize the parameters for SFS-RR, the parameters used (resolution level j , threshold for brain masking) and the scaling factors (αj, βj, and γj) were the same as those adopted previously16,29 except for the FWHM used for the scaling factor βj.
Both the GTM and the SFS-RR algorithms require the specification of the PSF of the measuring device obtained with the same correction, reconstruction, and postprocessing settings adopted for the clinical data. For scanners in 3D mode, the resolution varies spatially. In practice, to simplify the computational procedure a Gaussian PSF with a fixed FWHM has been used in PVC. 10 In the GTM method, the Gaussian function is used to model the PSF of PET scanner in equation 2, whereas in the SFS-RR, the Gaussian function is used to account for the difference in resolution between the target PET and reference structural images (i.e., to define the scaling factor βj) in wavelet space. To test the sensitivity of both methodologies to misspecification of the FWHM, two different FWHM values (3 or 4 mm) were evaluated.
The GTM and SFS-RR methods were run in MATLAB (The MathWorks Inc., Natick, MA, USA) and the ’lsqnonneg’ function was used for GTM inversion.
Simulation of Partial Volume Effects
The [18F]DOPA intensity values measured in one of two motion-corrected real dynamic PET images were assigned to the individualized Hammersmith atlas regions of individual virtual images from the summation images, and eight synthetic [18F]DOPA volume images with 26 time frames were created. These values were used for the simulation set-up as ’ideal’ dynamic data providing an approximate indication of the real dynamic [18F]DOPA concentration.
A fast analytic PET scanner simulation toolkit was then used to generate realistic dynamic projection data for the ECAT EXACT3D PET tomograph, following the method described in Tsoumpas et al.30,31 This simulation is based on the Software for Tomographic Image Reconstruction Release 2 (STIR) package, 32 derived from the concept first described by Ma et al.33,34 A recent study using this approach has shown that the most important cause of bias in the accuracy of kinetic parameters was PVEs. 35
Attenuation coefficient projection data were derived using the measured transmission data. As scattered and random coincidences are usually fairly well corrected in brain studies, they were not modeled in the simulation set-up. Poisson noise was introduced to simulate the level of noise seen in real dynamic acquisitions. Image reconstruction of the simulated data was performed using the three-dimensional reprojection algorithm (3DRP) implemented in STIR. All simulated dynamic images were reconstructed on the same grid as the acquired images. Then, the kicer values with simulated PVEs were calculated and the parametric maps of kicer were generated. All the procedures for PVC using the SFS-RR and GTM method and calculation of regional kicer values were applied to the parametric maps in the same way as described in the ’Kinetic Analysis’ and ’Application of Partial Volume Correction’ sections.
Statistical Analysis
We determined the test–retest reliability between kicer values from the two scan sessions using the intraclass correlation coefficient (ICC) as described by Shrout and Fleiss. 36 The ICC was calculated using a two-way random effects model as the kicer values were ordered into two sessions (test or retest scan) and the two-way random model additionally accounts for systematic sources of variance associated with session effects.
A mixed effects model was used in a repeated measures analysis to test the effect of PVEs on kicer and its recovery by PVC. For real data, we tested it with the mixed effect models fitted with the PVC (PVC; modeled as a dummy variable: 1 = without PVC, 2 = with PVC) and the ROI (Region; modeled as a dummy variable: 1 = left caudate, 2 = right caudate, 3 = left putamen, 4 = right putamen) as fixed effects and subjects as random effects. After testing the effect of PVC, we tested whether the corrected kicer value differs depending on the method (GTM or SFS-RR) and the FWHM (3 or 4 mm) applied. The mixed effects model for the test was fitted with the method (Method; modeled as a dummy variable: 1 = GTM, 2 = SFS-RR), the FWHM (FWHM; modeled as a dummy variable: 3 = 3 mm, 4 = 4 mm) and the ROI (Region; modeled as above) as fixed effects and subjects as random effects. For simulated data, the PVE on the kicer value and its correction was examined using a mixed effects model with the PVC (PVC; modeled as a dummy variable: 1 = ideal, 2 = with PVE without PVC, 3 = with GTM (FWHM: 3 mm), 4 = with GTM (FWHM: 4 mm), 5 = with SFS-RR (FWHM: 3 mm), 6 = SFS-RR (FWHM: 4 mm)) and the ROI (Region; modeled as above) as fixed effects and subjects as random effects.
We defined the variability of the kicer values from real data as follows;

The variability was examined using a mixed effects model, with the PVC (PVC; modeled as a dummy variable: 1 = without PVC, 2 = with GTM (FWHM: 3 mm), 3 = with GTM (FWHM: 4 mm), 4 = with SFS-RR (FWHM: 3 mm), 5 = SFS-RR (FWHM: 4 mm)) and the ROI (Region; modeled as above) as fixed effects and subjects as random effects.
Effect size was calculated using Cohen's formulation as follows:
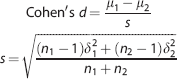
where μ, δ, and n indicate means, standard deviations, and sample sizes for each group.
RESULTS
Table 1 shows the kicer values calculated from the real data. There was a significant effect of PVC and region on kicer values (PVC: df = 1,143.598, F = 235.625, P < 0.001; Region: df = 3,109.818, F = 32.165, P < 0.001). There was a significant effect of method (GTM or SFS-RR) and the FWHM (3 or 4 mm) applied on the corrected kicer values but there was no interaction between the method and the FWHM (Method: df = 1,196.053, F = 6.852, P = 0.010; FWHM: df = 1,197.885, F = 42.911, P < 0.001; Method × FWHM: df = 1,197.847, F = 0.800, P = 0.372; Region: df = 3,109.601, F = 26.340, P < 0.001). The effect sizes (Cohen's d) of the data recovery (increase in ki cer values) using PVC were 1.24 for GTM with 3 mm FWHM, 1.85 for GTM with 4 mm FWHM, 1.40 for SFS-RR with 3 mm FWHM, and 1.98 for SFS-RR with 4 mm FWHM, respectively.
[18F]DOPA kicer values and volumes of region-of-interest estimated from the real data (n = 8 subjects × 2 scans)
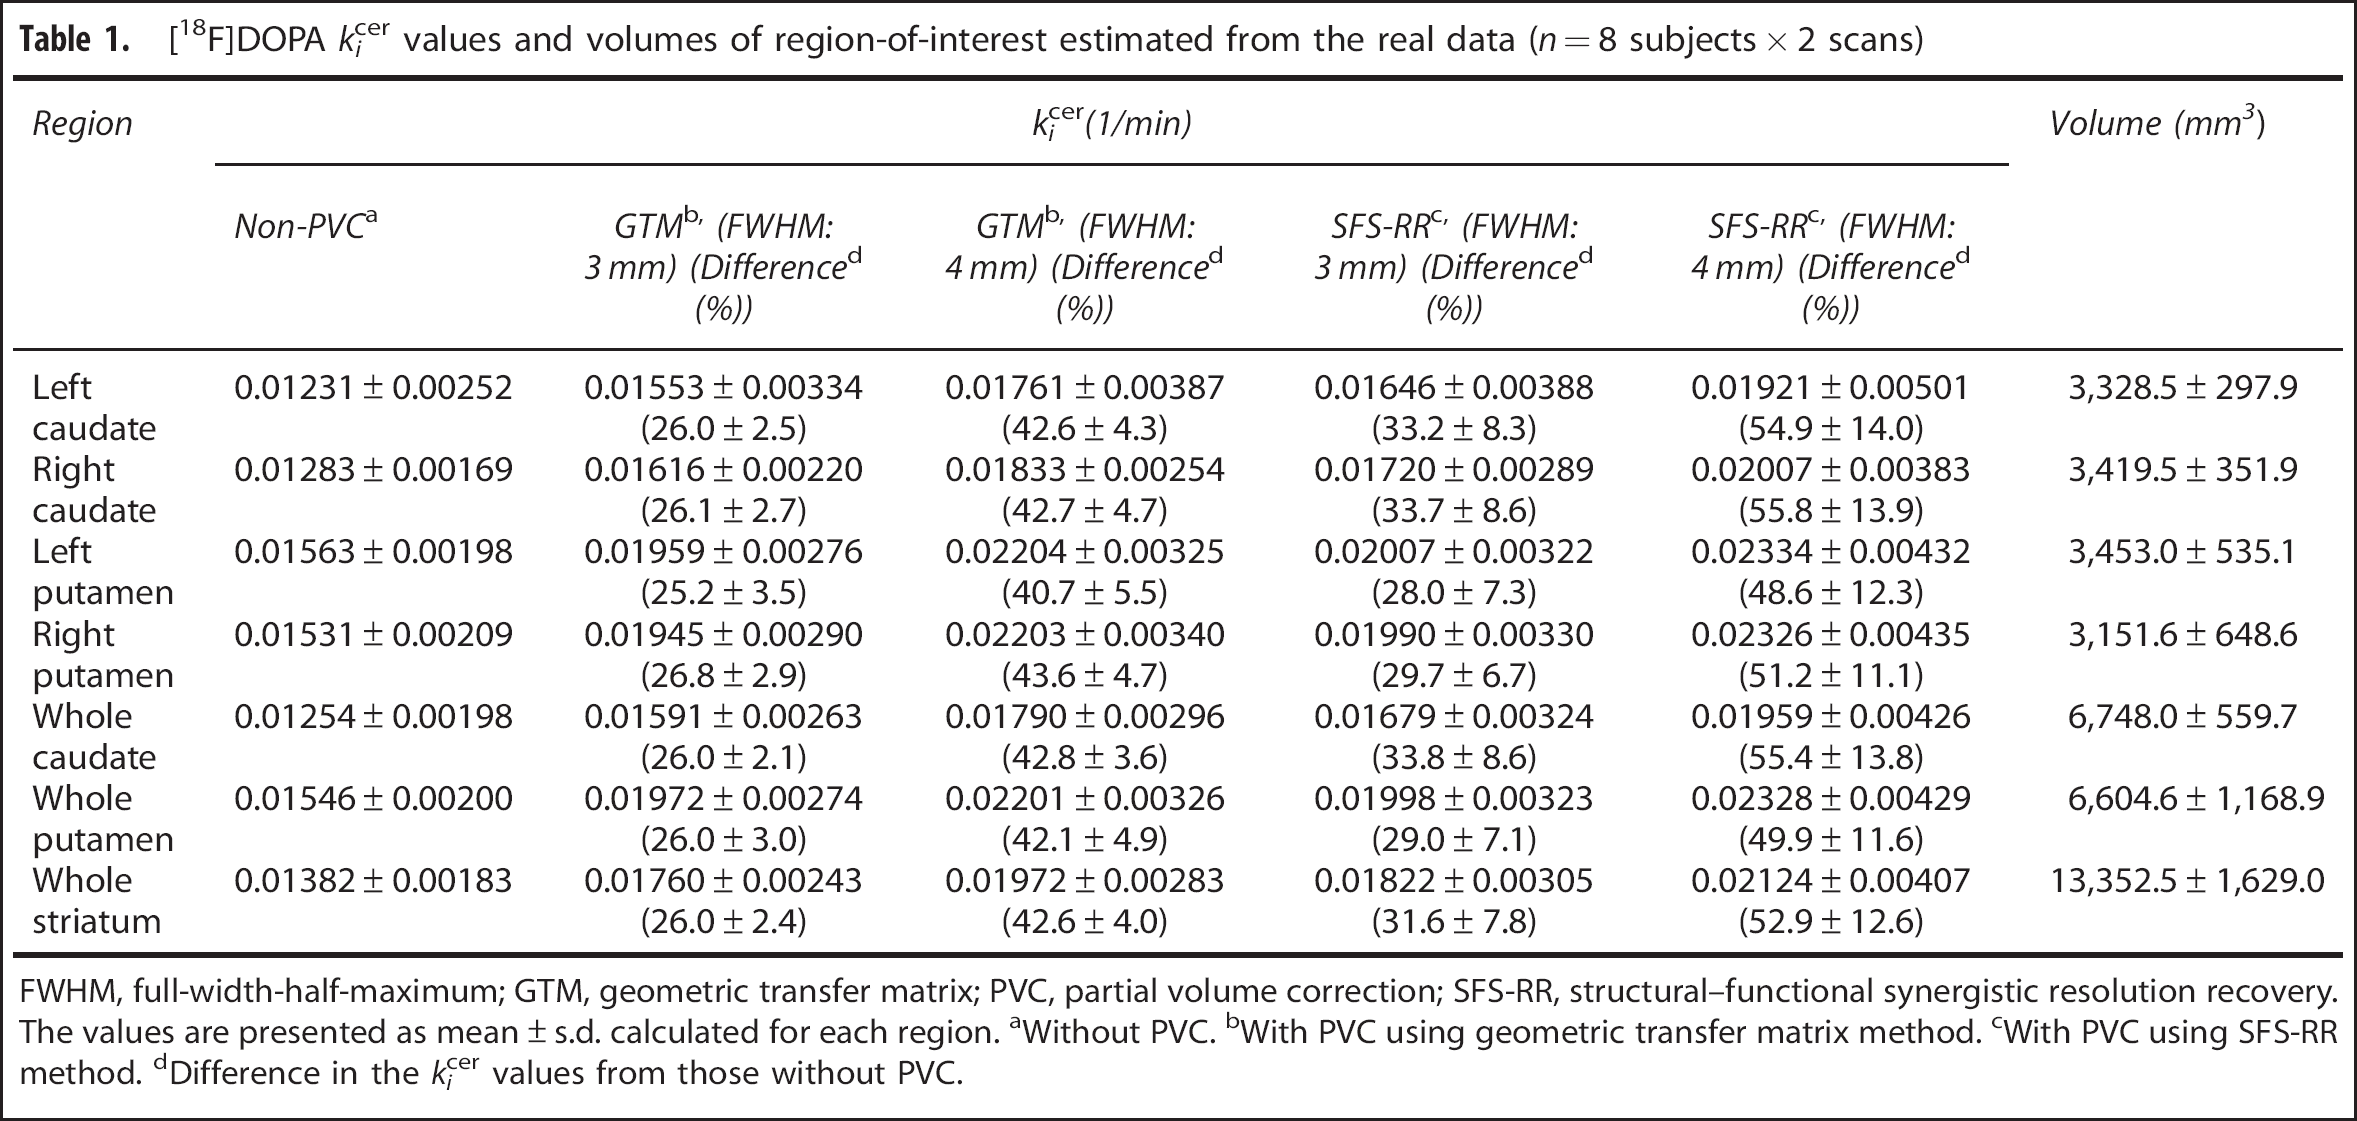
FWHM, full-width-half-maximum; GTM, geometric transfer matrix; PVC, partial volume correction; SFS-RR, structural–functional synergistic resolution recovery. The values are presented as mean ± s.d. calculated for each region. aWithout PVC. bWith PVC using geometric transfer matrix method. cWith PVC using SFS-RR method. dDifference in the kicer values from those without PVC.
The ICCs are presented in Table 2. The variability of the kicer value was not significantly affected by either of the PVC procedures (Non-PVC: 7.7%, GTM with 3 mm FWHM: 8.0%, GTM with 4 mm FWHM: 8.3%, SFS-RR with 3 mm FWHM: 8.8%, SFS-RR with 4 mm FWHM: 9.8%) (PVC: df = 4,46.934, F = 0.367, P = 0.831; Region: df = 3,67.420, F = 0.964, P = 0.415) (Figure 2).
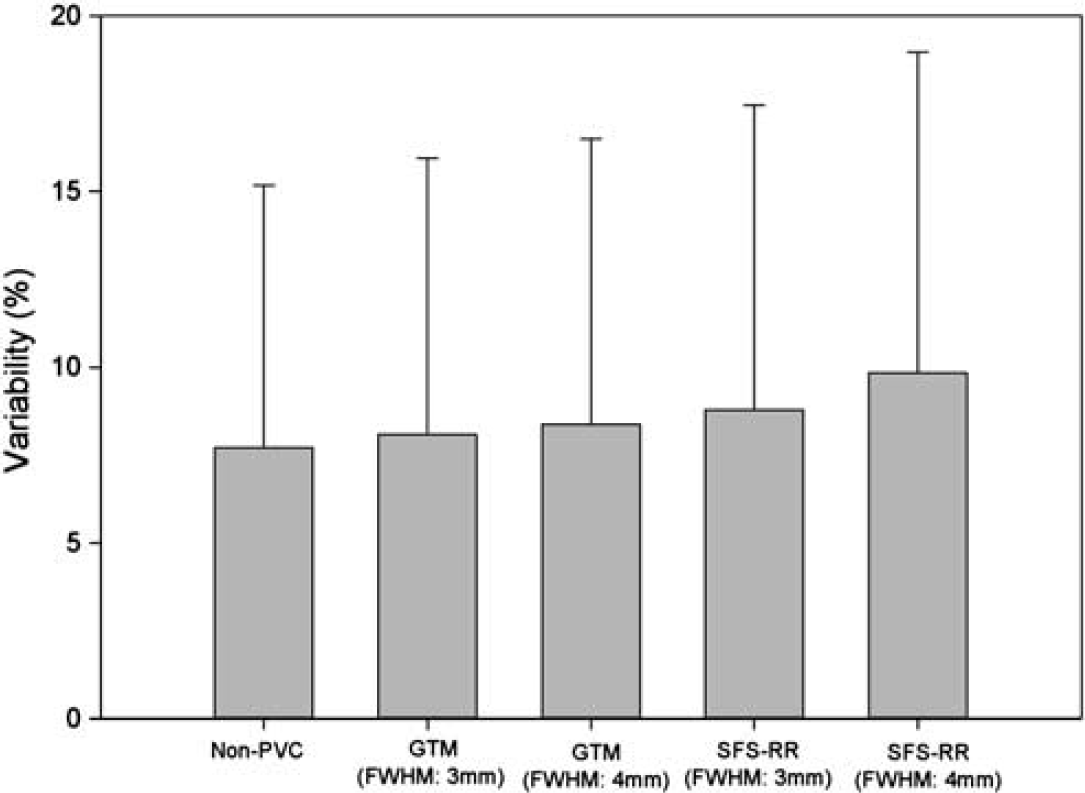
Showing the variability of [18F]DOPA kicer values for each partial volume correction (PVC) method used. Non-PVC indicates the variability when PVC was not applied. Geometric transfer matrix (GTM) and structural–functional synergistic resolution recovery (SFS-RR) denote the variability after PVC using GTM or SFS-RR method was applied, respectively. FWHM denotes full-width at half maximum employed for each procedure. The error bar indicates standard deviation. The variability was not affected by any of the PVC procedures (PVC: df = 4,46.934, F = 0.367, P = 0.831; Region: df = 3,67.420, F = 0.964, P = 0.415).
Intraclass correlation coefficient (ICC) between [18F]DOPA kicer values from two scans
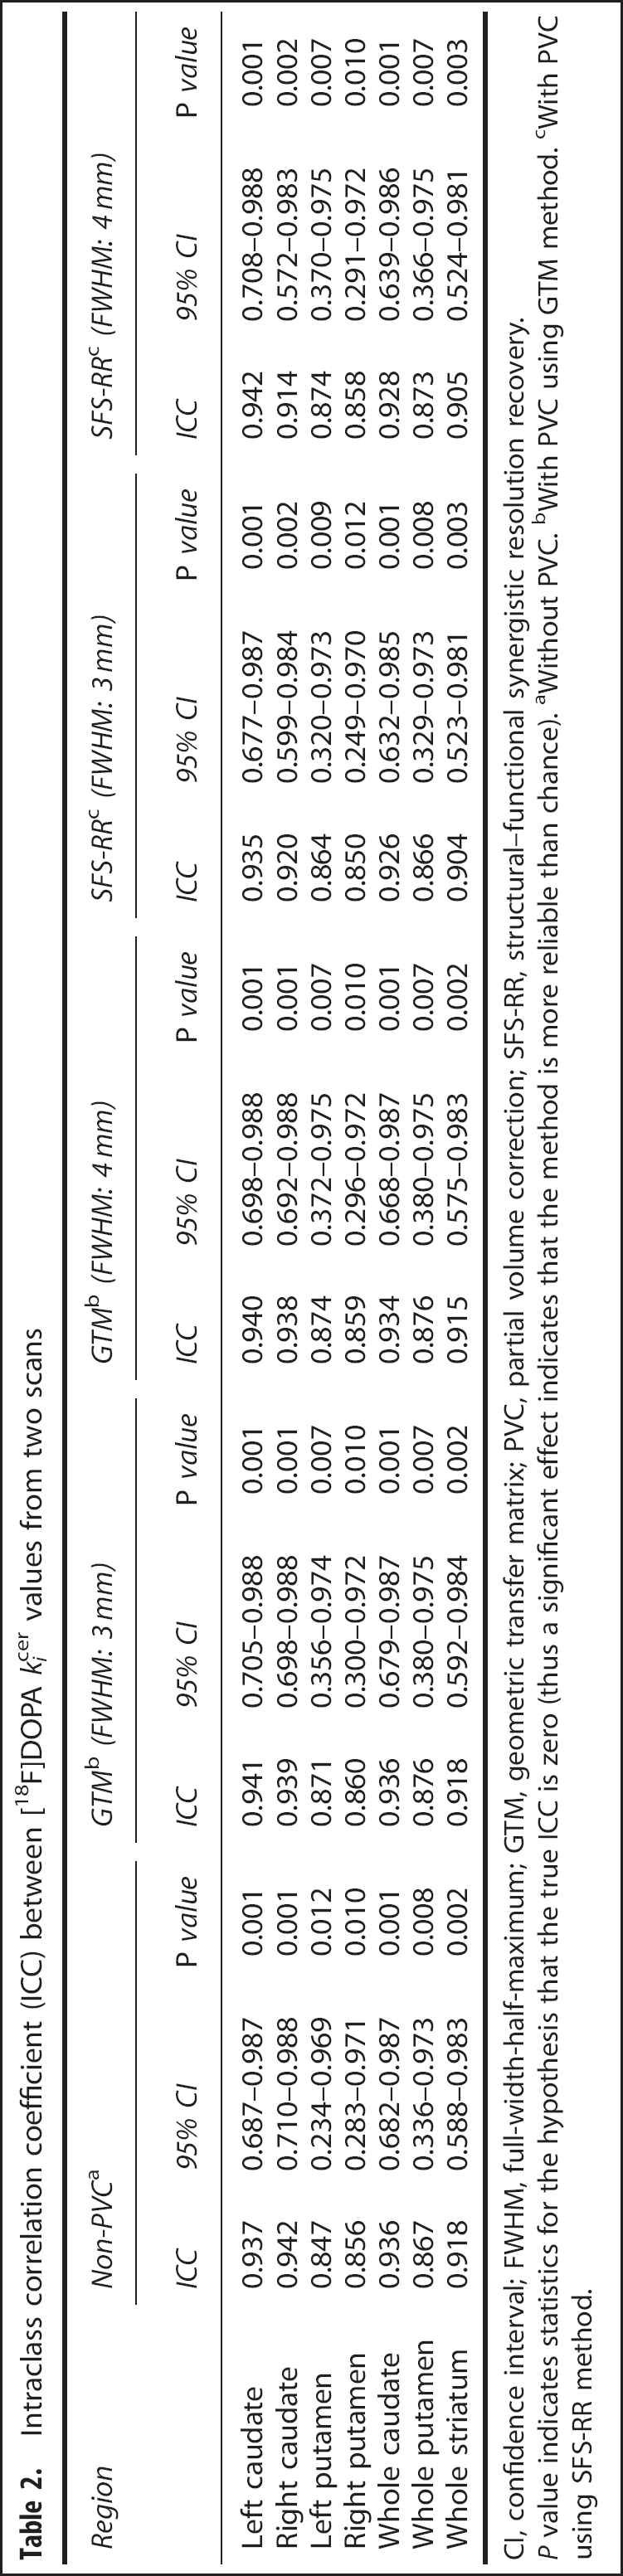
CI, confidence interval; FWHM, full-width-half-maximum; GTM, geometric transfer matrix; PVC, partial volume correction; SFS-RR, structural-functional synergistic resolution recovery.
P value indicates statistics for the hypothesis that the true ICC is zero (thus a significant effect indicates that the method is more reliable than chance). aWithout PVC. bWith PVC using GTM method. cWith PVC using SFS-RR method.
Table 3 shows the kicer values calculated from the simulated data. As in the results from the real data, the kicer values were significantly different according to whether the PVC was applied or not, and the region examined (PVC: df = 5,25.295, F = 144.308, P < 0.001; Region: df = 3,42.246, F = 317.442, P < 0.001). In the pairwise comparison, the kicer values from both SFS-RR and GTM with 3 mm FWHM were not different from ideal ones (SFS-RR: mean difference = −0.00022, standard error (s.e.) = 0.00014, df = 70.252, P = 0.118; GTM: mean difference = 0.00003, s.e. = 0.00013, df = 33.947, P = 0.805; Cohen's d = −0.16 for SFS-RR and 0.11 for GTM) and kicer values from SFS-RR and GTM with 3 mm FWHM were not different from each other (mean difference = 0.00019, s.e. = 0.00015, df = 20.080, P = 0.215). However, both SFS-RR and GTM with 4 mm FWHM resulted in overcorrected kicer values in comparison with ideal ones (SFS-RR: mean difference = 0.00225, s.e. = 0.00025, df = 11.201, P < 0.001; GTM: mean difference = 0.00181, s.e. = 0.00014, df = 71.364, P < 0.001; Cohen's d = 0.77 for SFS-RR and 0.90 for GTM; Figure 3).
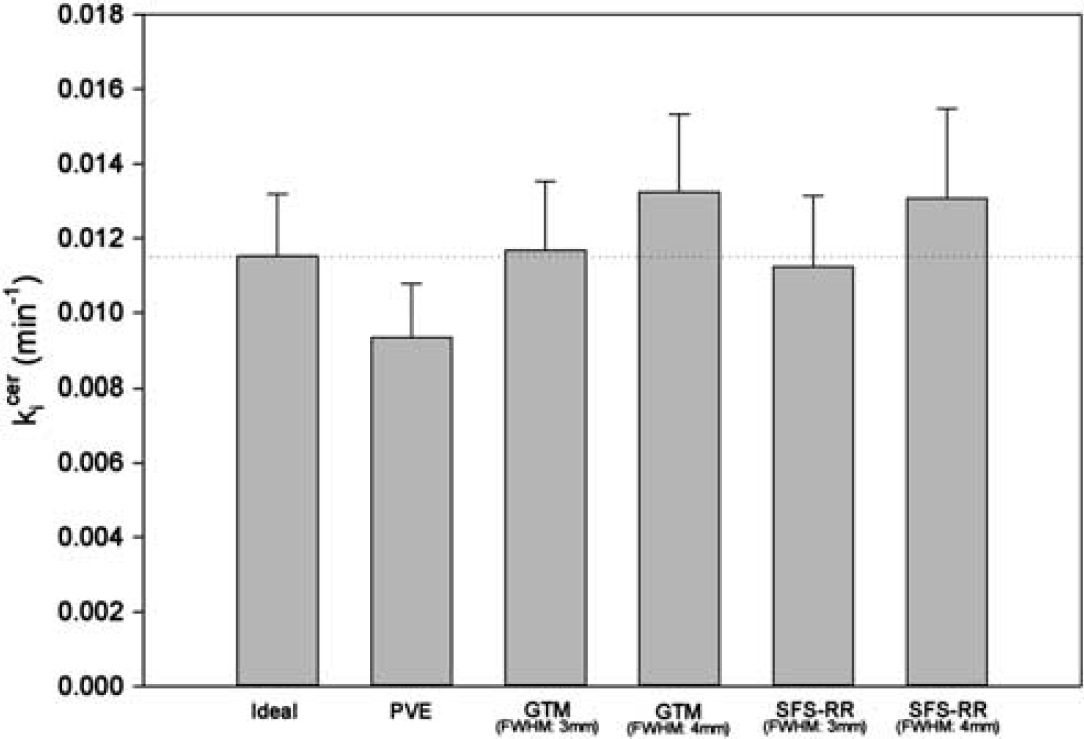
Showing the simulation of partial volume effect (PVE) on [18F]DOPA kicer values and the recovery of data by PVC. The error bar indicates standard deviation. Ideal is from ideal image data, which is not affected by PVE. Non-PVC, geometric transfer matrix (GTM), and structural-functional synergistic resolution recovery (SFS-RR) use the same image data as the ideal, but after simulation of PVEs. Non-PVC indicates the values without PVC. GTM and SFS-RR denote the values with PVC using the GTM or the SFS-RR method, respectively. FWHM denotes full-width at half maximum employed for each procedure. The kicer values were significantly different according to whether the PVC was applied or not (PVC: df = 525.295, F = 144.308, P < 0.001; Region: df = 342.246, F = 317.442, P < 0.001). The values corrected by SFS-RR and GTM with 3 mm FWHM were not different from ideal ones (SFS-RR: mean difference = −0.00022, standard error (s.e.) = 0.00014, df = 70.252, P = 0.118; GTM: mean difference = 0.00003, s.e. = 0.00013, df = 33.947, P = 0.805). Those by SFS-RR and GTM with 4 mm FWHM were significantly larger than ideal ones (SFS-RR: mean difference = 0.00225, s.e. = 0.00025, df = 11.201, P < 0.001; GTM: mean difference = 0.00181, s.e. = 0.00014, df = 71.364, P < 0.001).
[18F]DOPA kicer values estimated from the data generated for eight subjects in the simulation study
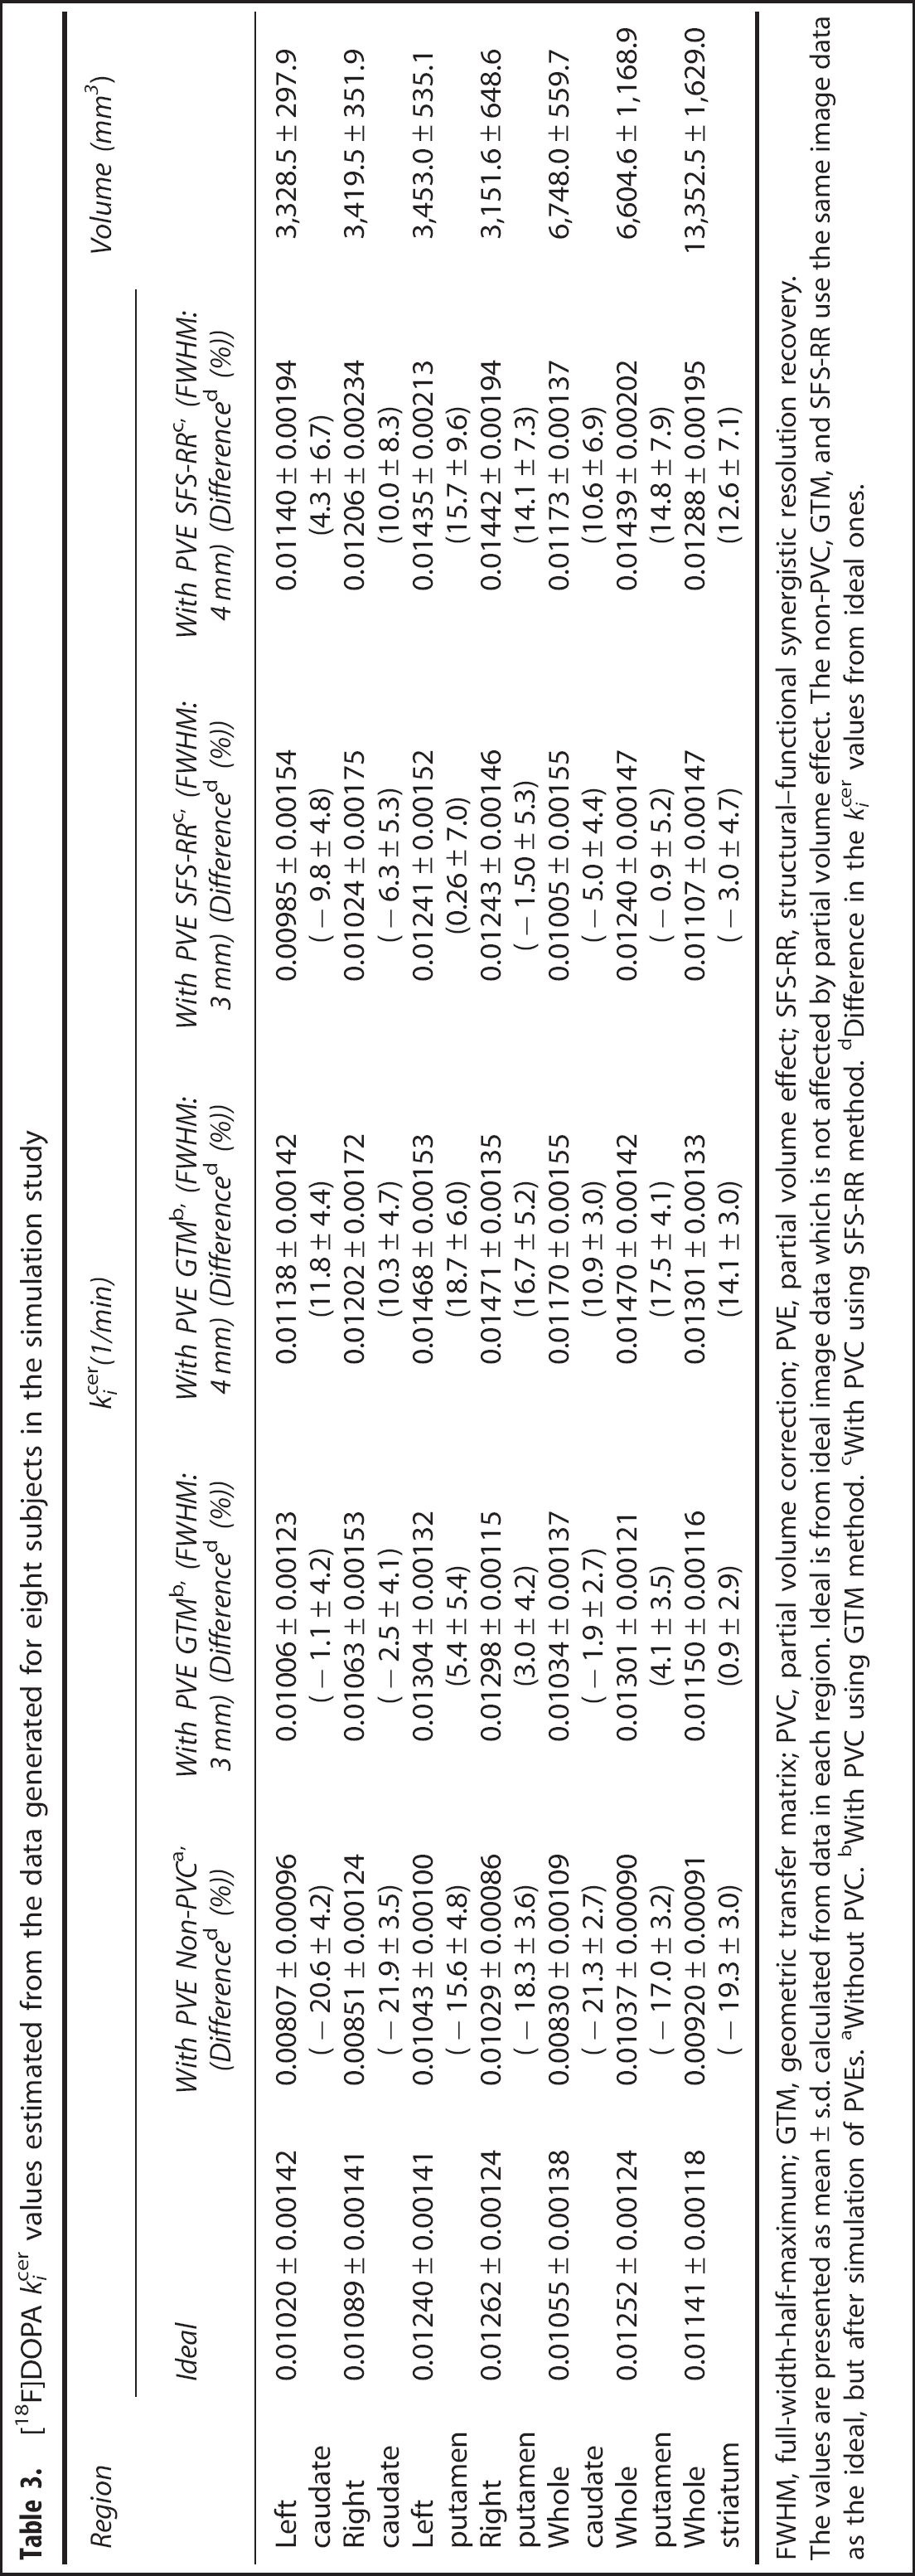
FWHM, full-width-half-maximum; GTM, geometric transfer matrix; PVC, partial volume correction; PVE, partial volume effect; SFS-RR, structural-functional synergistic resolution recovery.
The values are presented as mean ± s.d. calculated from data in each region. Ideal is from ideal image data which is not affected by partial volume effect. The non-PVC, GTM, and SFS-RR use the same image data as the ideal, but after simulation of PVEs. aWithout PVC. bWith PVC using GTM method. cWith PVC using SFS-RR method. dDifference in the kicer values from ideal ones.
DISCUSSION
This study sought to determine if bias in imaging (voxel-by-voxel) measures of the rate of [18F]DOPA utilization (kicer) in the striatum due to PVEs can be corrected by the novel image-based approach to PVC, SFS-RR. The second objective was to compare the performance of SFS-RR with a commonly used conventional approach to PVC, the GTM approach. Since GTM does not operate at the voxel level, the comparison was done at the regional level.
Our main findings are that PVEs lead to 15% to 20% lower values on average, and that the novel image-based approach to signal recovery performs as well as the conventional approach, recovering most of this ‘lost’ signal when tested at the regional level with a small and nonsignificant increase in variability. The kicer value recovery by both SFS-RR and GTM was found to be susceptible to the shape of PSF assumed. Importantly, both PVC procedures did not have a significant effect on the variability of the kicer value and the reliability remained high after the PVC.
We evaluated test-retest reliability in terms of ICCs. As compared with the ICCs without PVC, the ICCs were not influenced by either PVC procedure used. Furthermore, the ICCs with PVC were all above 0.85, which indicates high reliability between the kicer values from the two scans (Table 2). 37 This suggests that there is little cost in terms of reliability for the gain in accuracy introduced by either SFS-RR or GTM approaches to PVC, at least in terms of [18F]DOPA PET imaging studies. However, there seems to be a trend of greater coefficient of variation with SFS-RR, indicating increased interindividual variability of the kicer values (e.g., average coefficient of variations were 14.6% without PVC, 15.5% for GTM with 3 mm FWHM and 17.9% for SFS-RR with 3 mm FWHM in the real data). Since PVC solves an inverse problem, the increased variability is inevitable although, for the optimal parameter (FWHM = 3 mm), this is very mild (from 14.6% to 17.9%). This translates into a negligible loss of power. However, when the resolution parameter is overestimated, the recovery will be bigger than necessary and so the inflation in error variance. This suggests that, in uncertainty, one should stay on the conservative side (e.g., small FWHM) when estimating the scanner resolution.
Though the PVC procedures did not affect the data reliability, the shape of PSF characterized by FWHM did significantly influence the corrected kicer values. The difference in the kicer values observed from the real data before and after PVC was obviously larger when a 4-mm FWHM was used (Table 1). This was also observed in the simulation study such that the corrected kicer values by both SFS-RR and GTM with 4 mm FWHM were significantly greater than ideal values whereas the values estimated with 3 mm FWHM were not different from ideal ones (Table 3; Figure 3). This shows the known sensitivities of PVC methodologies to misspecifications of the PSF. Accurate measurement of the PSF and digital modeling of the PSF is therefore necessary to tailor the procedures to the scanner specifications as well as to the resolution effects introduced by corrections, reconstructions, and postprocessing. However, do note that in PVC procedures the PSF is applied to structural information (MRI in this case) that has finite resolution (say ~1 mm). So insertion of the measured PSF from a linear source can in fact produce an overestimation of the ’correct’ FWHM. Therefore, calibration of the procedure over accurate digital simulation of scanner data is recommended. Generally, full optimization of the procedure should consider not only the PSF but also other parameters for SFS-RR, such as resolution level j. However, we found them extremely stable across a wide range of tracers, reconstructions, and noise conditions.
We validated the SFS-RR at the regional level to compare with the GTM. Since SFS-RR corrects whole images, the validation of SFS-RR is required at both voxel and kinetic levels. It is worth mentioning that we are planning to integrate the SFS-RR method with an iterative algorithm that includes kinetics in the reconstruction. 38
Conclusion
Partial volume effects can result in substantial inaccuracies in imaging data. A novel approach to PVC, SFS-RR, was found to effectively correct for PVEs with low cost in terms of reproducibility that is comparable to a conventional approach working at the ROI level but has the advantage of enabling voxelwise analysis.
DISCLOSURE/CONFLICT OF INTEREST
Dr Euitae Kim was supported by grant of the Korea Healthcare Technology R&D Project, Ministry of Health and Welfare, Republic of Korea (A070001). Dr Oliver Howes is funded by grant U.1200.04.007.00001.01 from the Medical Research Council (MRC) UK. Dr Federico E. Turkheimer is funded by the PET Methodology programme grant from the Medical Research Council (MRC) UK (Ref. G1100809/1). Dr Charalampos Tsoumpas is supported by SUBLIMA (www.sublima-pet-mr.eu), an European Union funded project under the seventh framework program (No: 241711).