
Abstract
The authors characterized effects of late recombinant tissue plasminogen activator (rt-PA) administration in a rat embolic stroke model with magnetic resonance imaging (MRI), to assess potential MRI correlates, or predictors, or both, of rt-PA–induced hemorrhage. Diffusion-, perfusion-, and postcontrast T1 -weighted MRI were performed between 4 and 9 hours and at 24 hours after embolic stroke in spontaneously hypertensive rats. Treatment with either rt-PA or saline was started 6 hours after stroke. A spectrophotometric hemoglobin assay quantified hemorrhage severity. Before treatment, relative cerebral blood flow index (rCBFi) and apparent diffusion coefficient (ADC) in the ischemic territory were 30% ± 23% and 60% ± 5% (of contralateral), respectively, which increased to 45% ± 39% and 68% ± 4% 2 hours after rt-PA. After 24 hours, rCBFi and ADC were 27% ± 27% and 59 ± 5%. Hemorrhage volume after 24 hours was significantly greater in rt-PA–treated animals than in controls (8.7 ± 3.7 μL vs. 5.1 ± 2.4 μL, P < 0.05). Before rt-PA administration, clear postcontrast T1 -weighted signal intensity enhancement was evident in areas of subsequent bleeding. These areas had lower rCBFi levels than regions without hemorrhage (23% ± 22% vs. 36% ± 29%, P < 0.05). In conclusion, late thrombolytic therapy does not necessarily lead to successful reperfusion. Hemorrhage emerged in areas with relatively low perfusion levels and early blood–brain barrier damage. Magnetic resonance imaging may be useful for quantifying effects of thrombolytic therapy and predicting risks of hemorrhagic transformation.
Thrombolytic therapy with recombinant tissue plasminogen activator (rt-PA) has been shown to be effective after acute clinical ischemic stroke when applied within 3 hours after onset of symptoms (The NINDS rt-PA Stroke Study Group, 1995). However, the majority of acute stroke patients are first evaluated later than 3 hours after stroke onset. Although patients may potentially benefit from rt-PA treatment after 3 hours, delayed treatment with rt-PA leads to increased risk of hemorrhagic transformation (that is, bleeding into an area with preexisting ischemic tissue damage) and can result in enhancement of brain injury (The NINDS rt-PA Stroke Study Group, 1995 The NINDS rt-PA Stroke Study Group, 1997; Hacke et al., 1995, 1998; Clark et al., 1999). In agreement with an earlier study (Brinker et al., 1999), the authors have previously shown that in rodent models of embolic stroke, rt-PA delivery after 3 to 6 hours results in a significant increase in the incidence and volume of intracerebral hemorrhage (Asahi et al., 2000; Kano et al., 2000). Some experimental stroke studies reported a reduced mean infarct volume (Overgaard et al., 1994; Kano et al., 2000) and a trend for neurologic improvement after delayed rt-PA therapy (Overgaard et al., 1994; Brinker et al., 1999), whereas in another study late rt-PA administration clearly exacerbated brain injury and neurologic deficits (Asahi et al., 2000). Hence, early identification of risks of bleeding and secondary damage is important for the selection of patients who are likely to benefit from thrombolytic therapy, especially when treatment is started after the 3-hour time window.
In recent years, magnetic resonance imaging (MRI) has become an important tool in the diagnosis of clinical and experimental stroke. Conventional T1 – (T1 WI) and T2 -weighted imaging (T2 WI) and diffusion- (DWI) and perfusion-weighted (PWI) MRI techniques enable a comprehensive and noninvasive assessment of acute ischemic tissue damage and perfusion deficits (Baird and Warach, 1998). Recently, these techniques have been used to assess the efficacy of rt-PA treatment in stroke patients (Marks et al., 1999; Kidwell et al., 2000; Schellinger et al., 2000). Reversal of PWI and DWI abnormalities was shown in stroke subjects who received acute intraarterial rt-PA therapy (Kidwell et al., 2000). In rat embolic stroke models, MRI demonstrated that rt-PA administration within 1 hour after stroke improves CBF and reduces ischemic tissue damage (Busch et al., 1998; Jiang et al., 1998). Delayed rt-PA treatment (4 hours after stroke), however, did not significantly alter MRI parameters (Jiang et al., 2000).
The main objective of this study was to assess the relation between ischemic brain damage before and after delayed rt-PA therapy, and the development of intracerebral hemorrhage, to identify risk factors for hemorrhagic transformation. To that end, the authors used different MRI techniques to characterize the effects of late rt-PA administration in a rat embolic stroke model, which they correlated with hemorrhagic transformation.
MATERIALS AND METHODS
Animal model
Experimental protocols were institutionally approved in accordance with the NIH Guide for the Care and Use of Laboratory Animals. Unilateral stroke was induced in male spontaneously hypertensive rats (300 to 350 g; Taconic, Germantown, NY, U.S.A.) by embolic occlusion of the right middle cerebral artery (MCA), as previously described (Asahi et al., 2000). Animals were anesthetized with halothane (1% to 1.5%) in O2:N2 O (1:2) under spontaneous respiration. Body temperature was maintained at 37°C to 38°C. A modified PE-50 catheter with a 50-mm-long homologous blood clot was inserted into the right external carotid artery and advanced into the internal carotid artery until the tip was positioned just proximal to the origin of the MCA. Next, the clot was carefully injected into the internal carotid artery. After 5 minutes, the catheter was withdrawn from the external carotid artery. To confirm immediate successful MCA occlusion, regional blood flow in the somatosensory area of the frontoparietal cortex, which was exposed by a trepanation (with intact dura), was measured by laser–Doppler flowmetry (PeriFlux System 5000; Perimed, Stockholm, Sweden) from 5 minutes before up to 30 minutes after MCA occlusion in most animals. Animals then were allowed to recover.
Approximately 1 hour before MRI experiments, animals were reanesthetized, and the right femoral artery was catheterized for monitoring of arterial blood pressure, PCO2, PO2, and pH. The right femoral vein and jugular vein were cannulated for administration of therapeutic agent and nuclear magnetic resonance contrast agent, respectively. In addition, animals were tracheotomized with a 14 G endotracheal tube. For MRI experiments, animals were immobilized in a specially designed head frame with ear plugs and tooth bar (David Kopf Instruments, Fremont, CA, U.S.A.), placed in a plastic cradle, and mechanically ventilated with 1% halothane in O 2:N2 O (1:2). Body temperature was maintained at 37°C to 38°C with 2 water-heated blankets. The rat's head was covered with toothpaste to reduce magnetic susceptibility artifacts arising from air–tissue interface, and a 30-mm surface coil for signal transmission and detection was placed on the rat's head. Next, the animal was positioned in the nuclear magnetic resonance scanner. During MRI experiments, blood pressure and rectal temperature were continuously recorded, and blood gases were frequently analyzed. When necessary, respiratory adjustments were made to maintain arterial blood gas tensions at normal values.
Six hours after MCA occlusion (approximately 2 hours after onset of MRI experiments), human rt-PA (Genentech, San Francisco, CA, U.S.A.) was intravenously administered (10 mg/kg of a solution containing 2 mg/mL; 10% bolus and the remainder continuously infused over 20 minutes). Control animals received saline.
Magnetic resonance imaging
Magnetic resonance imaging experiments were performed using a 2 T NMR spectrometer (Varian Instruments, Palo Alto, CA, U.S.A.).
Perfusion-weighted magnetic resonance imaging.
Single-slice dynamic susceptibility contrast-enhanced MRI (single-shot gradient recalled echo planar imaging (EPI); repetition time (TR)/echo time (TE) = 175/22 milliseconds; field of view (FOV) = 25 × 25 mm2; 32 × 32 data matrix; slice thickness = 1.5 mm; 1000 consecutive images) was performed in combination with an intravenous bolus injection of Gd_DTPA (0.5 mmol/mL; 0.5 mL/kg; Berlex Laboratories, Wayne, NJ, U.S.A.). The authors performed perfusion-weighted MRI (PWI) of a brain slice encompassing a relatively large portion of the MCA territory, at approximately 1 mm posterior to bregma according to Paxinos and Watson (1997). The selected slice matched with slice number six in the multislice MRI experiments (see below). From the dynamic susceptibility contrast-enhanced images, concentration-versus-time curves were calculated on a voxel-by-voxel basis using the linear relation between changes in transverse relaxation and concentration of contrast agent (Rosen et al., 1990). Relative regional cerebral blood volume (rCBV) values then were obtained for each voxel by numerically integrating the concentration-versus-time curve (Rosen et al., 1990). Relative cerebral blood flow index (rCBFi) values were obtained for each voxel as the height of the deconvolved residue function with an arterial input function, using singular value decomposition (Østergaard et al., 1996). Arterial input data were obtained directly from the susceptibility contrast-enhanced images in two voxels in the left nonoccluded internal carotid artery, as the flow through the right internal carotid artery was obstructed by the inserted blood clot, which hampered the assessment of an arterial input function.
Diffusion-and T2 -weighted magnetic resonance imaging.
The authors performed multislice diffusion-weighted MRI (DWI) with the use of a spin-echo sequence (TR/TE = 2000/40 milliseconds; FOV = 25 × 25 mm2; 64 × 64 data matrix; 9 contiguous 1.5 mm slices), with 3 b values (150, 850, 1550 s/mm2). To optimize lesion delineation, DWI was performed with the diffusion-encoding gradients in x, y and z direction, allowing calculation of direction-independent mean trace ADC maps (Lythgoe et al., 1997). In addition, purely T2 -weighted MR images with no diffusion weighting (b = 0 s/mm2) were calculated by extrapolation.
Postcontrast T1 -weighted magnetic resonance imaging.
Multislice T1 -weighted MRI (T1 WI) (TR/TE = 550/19 milliseconds; FOV = 25 × 25 mm2; 64 × 64 data matrix; 9 contiguous 1.5 mm slices) was performed before and after contrast agent administration. Postcontrast T1 -weighted MR difference images were calculated by subtracting T1 -weighted images before contrast agent delivery from T1 -weighted images obtained after injection of Gd_DTPA.
Spectrophotometry
After the MRI experiments, rats were killed by a lethal overdose of sodium pentobarbital and were transcardially perfused with phosphate-buffered saline to wash out intravascular blood before spectrophotometry. Brains were removed and cut in 2-mm coronal sections. Intracerebral hemorrhage, identified as blood evident at a macroscopic level, was evaluated on the unstained brain sections. Next, brain sections were stained with 2% 2,3,5-triphenyltetrazolium chloride (TTC; 30 minutes) to qualitatively assess the anatomic distribution of the ischemic lesion.
Intracerebral hemorrhage was quantified with a spectrophotometric assay modified from Choudhri et al. (1997), as described by Asahi et al. (2000). Briefly, hemispheric brain tissue was homogenized in phosphate-buffered saline (total volume = 3 mL) for 30 seconds, followed by 1-minute sonication on ice, and 30-minute centrifugation (13,000 g). Next, 1.6-mL Drabkin's reagent (Sigma, St. Louis, MO, U.S.A.) was added to 0.4 mL aliquots. After 15 minutes, optical density was measured at 540 nm with a spectrophotometer (Spectronix 3000; Milton-Roy, Rochester, NY, U.S.A.). The hemorrhage volume can then be calculated from the linear relation between the optical density and hemoglobin concentration (Choudhri et al., 1997; Asahi et al., 2000). These measurements can be performed after TTC staining, because TTC staining does not affect the spectrophotometric hemoglobin assay (Choudhri et al., 1997; Asahi et al., 2000).
Experimental protocol
Magnetic resonance data collection was performed from 2 hours before up to 3 hours after administration of rt-PA (n = 9) or saline (n = 6). In two separate groups of animals, MRI was performed 24 hours after treatment with rt-PA (n = 7) or saline (n = 6). All MRI experiments included 2 consecutive PWI experiments (with 5-minute interval) acquired at approximately 1 hour before, and 0.5 and 1.5 hours after rt-PA/saline injection. T1 WI was performed 5 minutes before and 20 minutes after the second of the 2 consecutive Gd_DTPA bolus injections. Finally, DWI was performed at approximately 0.5 hour before, and 1 and 2 hours after rt-PA/saline injection. Immediately after MRI, brains were removed for morphologic analysis and spectrophotometric assay of intracerebral hemorrhage. In one rt-PA–treated animal that was imaged acutely, spectrophotometry was performed after 24 hours.
Data analysis
Magnetic resonance images were analyzed in regions of interest (ROIs), using the image analysis software package Alice (Hayden Image Processing Group, Boulder, CO, U.S.A.).
The lesion volume, calculated from the multislice ADC data sets, was defined as the volume in the ipsilateral, ischemic hemisphere with ADC values less than 70% of the mean ADC in the contralateral hemisphere. An ADC threshold of 70% of contralateral was chosen as it has been previously shown that ischemic lesion volume determined by an interhemispheric difference in ADC values ≥29% highly correlates with postmortem infarct size (Takano et al., 1996).
Regions of interest that anatomically matched areas where clear accumulation of extravascular blood was detected on the unstained brain sections and that were confined to the lesion area (as evident from the TTC-stained sections) were outlined on T2 -weighted images (these images showed greatest anatomic detail and did not reveal signs of bleeding). Regions of interest with no hemorrhagic transformation were defined as the lesion area minus the ROI with hemorrhagic transformation. In addition, the authors outlined anatomically corresponding ROIs in the contralateral hemisphere. To correlate all MR parameters, the authors used slice six—that is, the single imaged slice in the PWI experiments—for the ROI analysis.
All values are expressed as mean ± SD. Statistical comparisons were performed using one-or two-way analysis of variance with post hoc Student Newman–Keuls test (for all pairwise comparison of groups) or Bonferroni t-test (for comparison with a control group), paired Student's t-test, and linear regression analysis. P < 0.05 was considered significant.
RESULTS
During the MRI experiments, systemic parameters in all groups remained within normal range. Hypertension was evident from the relatively high mean arterial blood pressure (120 to 160 mm Hg).
Apparent diffusion coefficient changes
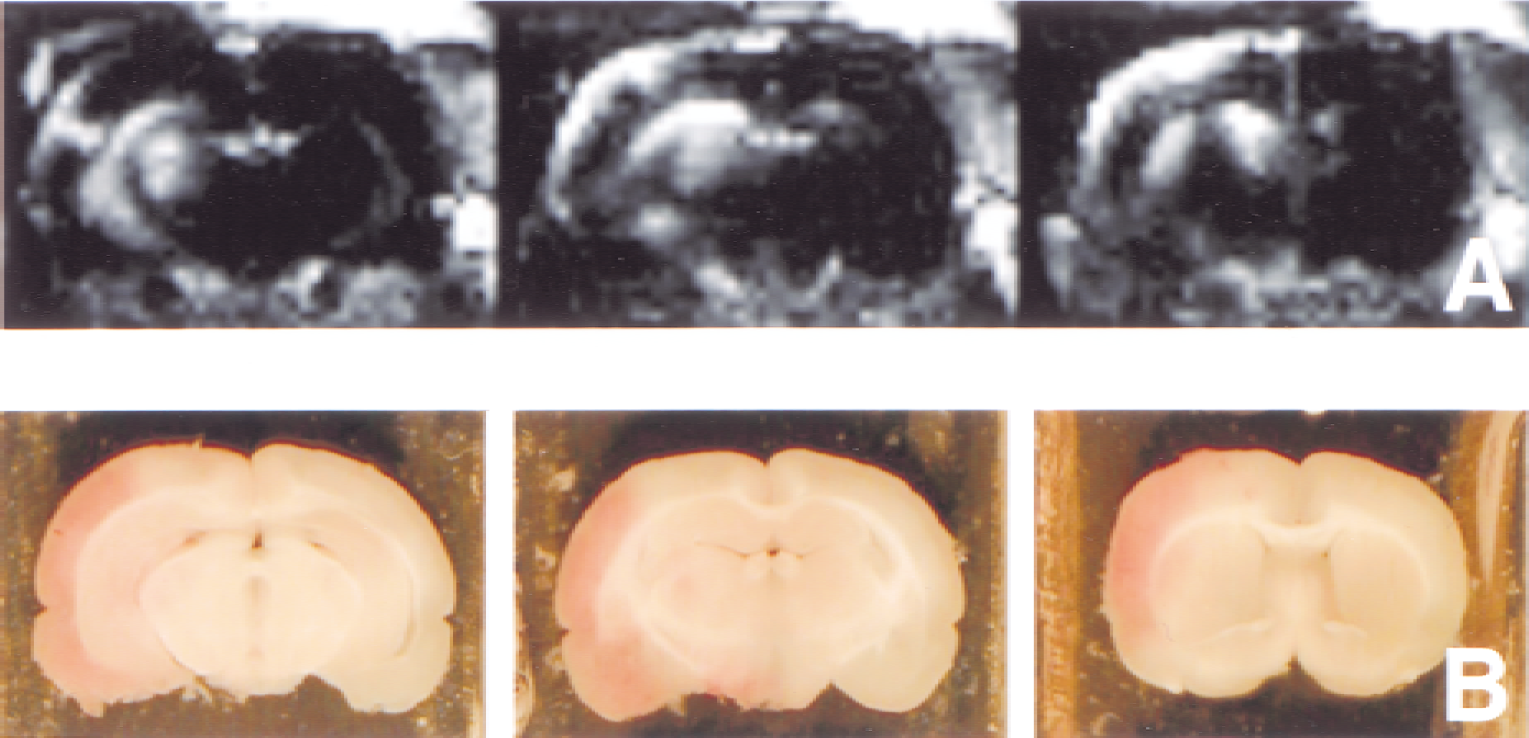
Occlusion of the right MCA was confirmed by a drop of laser–Doppler flow to less than 15% of baseline. The acute ischemic lesion was characterized by a reduced tissue water ADC and an increased T2 -weighted signal intensity (Fig. 1A and 1B), which corresponded with the area with loss of TTC staining on the brain sections after the MRI experiments. Apparent diffusion coefficient lesion volumes at 0.5 hour before treatment were 237 ± 119 mm3(n = 9) and 263 ± 58 mm3(n = 6) in the rt-PA–treated and saline-treated groups, respectively. After 24 hours, the lesion size was significantly increased (P < 0.05) as compared with the acute stages, in both the rt-PA–treated and control animals (380 ± 117 mm3(n = 7) and 499 ± 120 mm3(n = 6), respectively). There was no significant difference in lesion size between rt-PA–treated and saline-treated groups.
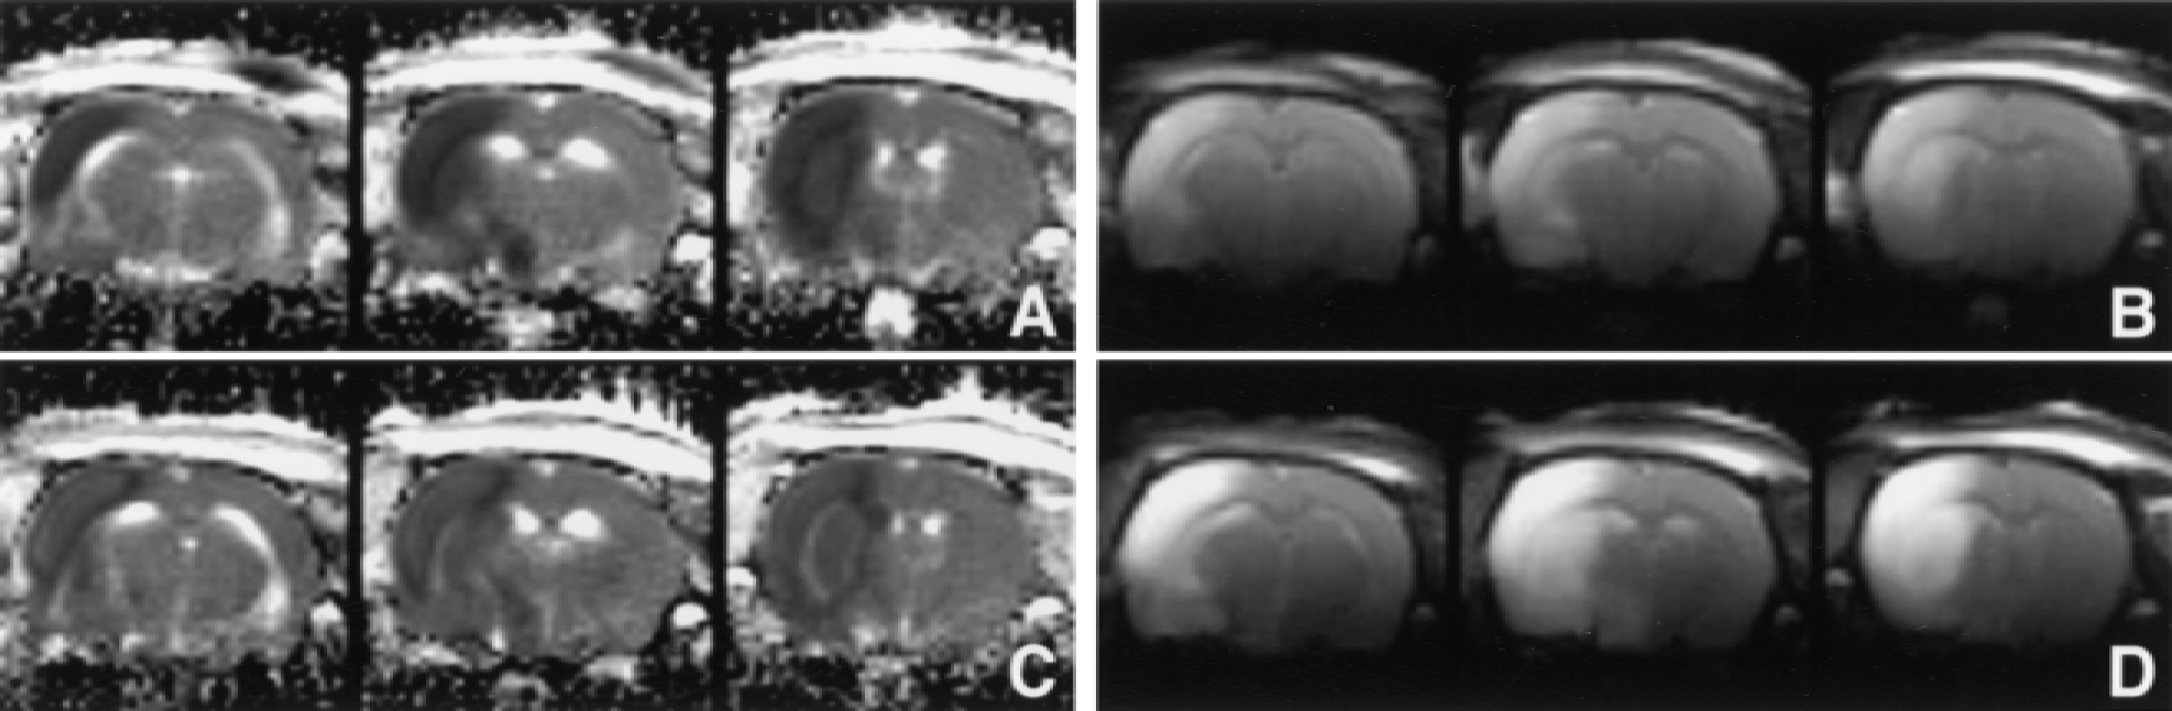
Trace apparent diffusion coefficient maps
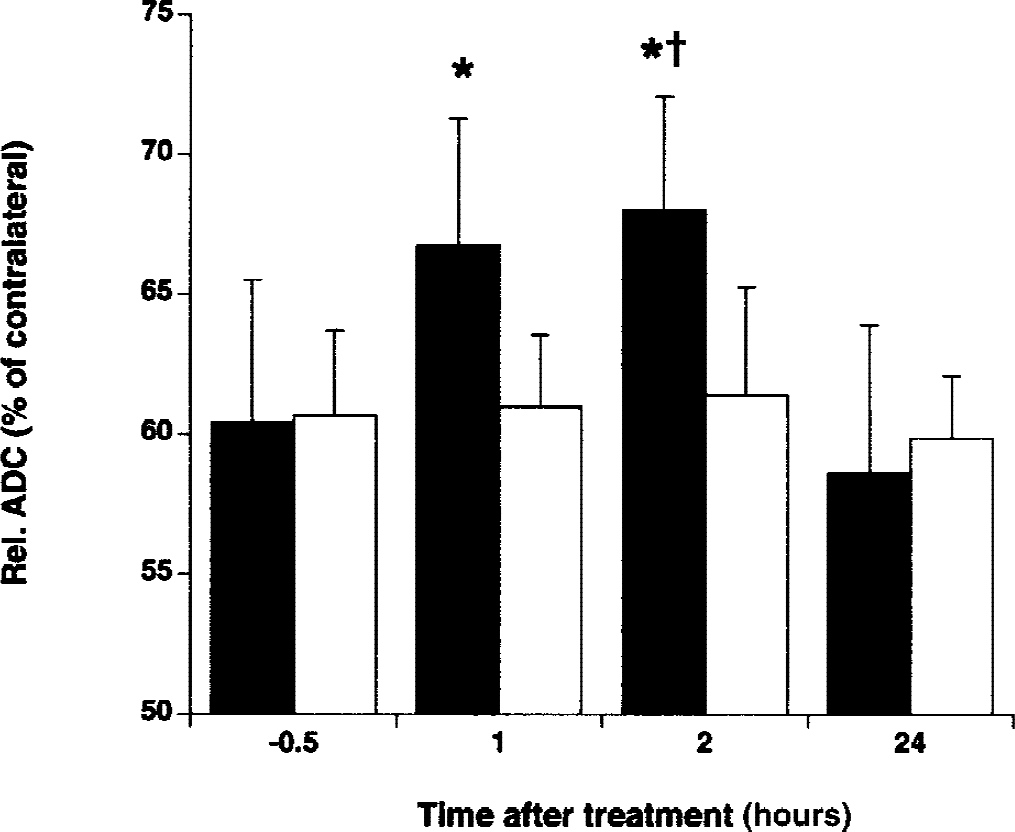
Relative apparent diffusion coefficient (ADC) (% of contralateral) in the lesion area versus time after administration of rt-PA (black bars) and saline (white bars). * P < 0.05 versus before treatment. †P < 0.05 versus saline treatment.
Within 1 to 2 hours after rt-PA administration, the mean ADC in the lesion area significantly increased compared with pretreatment values (P < 0.05) (Figs. 1C and 2). The ADC increase was paralleled by an increase of the T2 -weighted signal intensity (relative to pre rt-PA values) (r = 0.812, P < 0.05) (Fig. 1D). However, at 24 hours, the ADC was reduced once again. The ADC value in the ischemic lesion remained unchanged in control animals (Fig. 2).
Perfusion changes
Hemodynamic parameter maps demonstrated reduced perfusion levels in the right MCA territory before treatment (Fig. 3A). A tendency of blood flow improvement in the ischemic lesion was apparent early after rt-PA delivery (Fig. 3B). However, perfusion changes were highly variable among animals (Fig. 4). In fact, rt-PA had no effect at all in three out of nine rats. After 24 hours perfusion levels were still reduced. The rCBFi in the lesion area remained relatively unchanged as a function of time in control animals. Overall rCBFi was significantly greater in rt-PA–treated rats as compared with saline-treated rats (P < 0.05). Cerebral blood volume values in the lesion area were not significantly different, both between treatment groups and between time points (Fig. 4B).
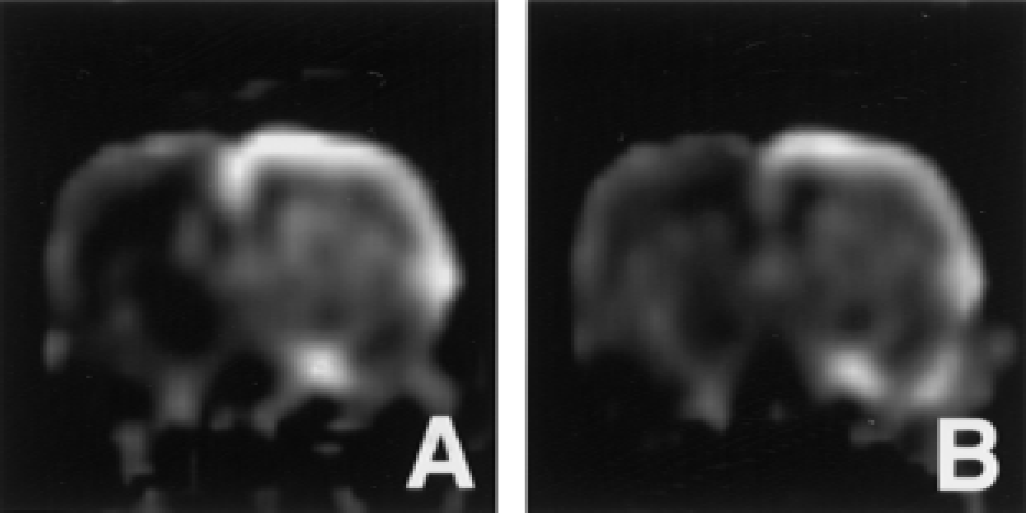
Maps of the relative cerebral blood flow index at 1 hour before
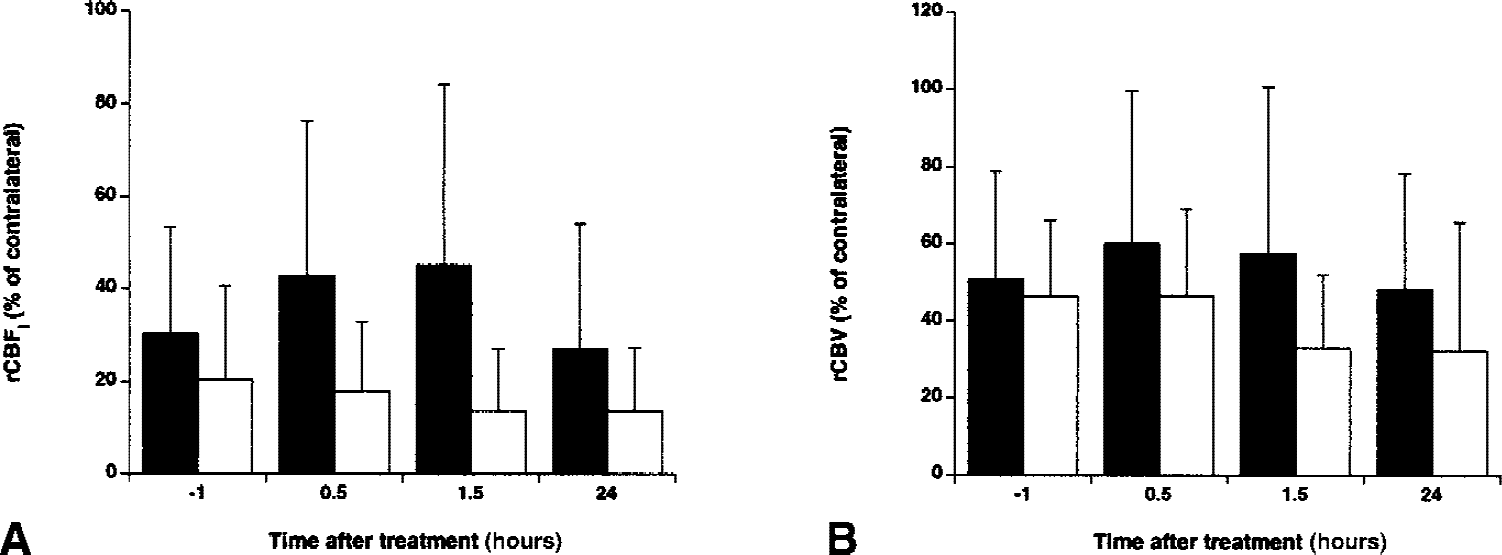
Relative cerebral blood flow index (rCBFi, % of contralateral)
Hemorrhagic transformation
Excised brain sections after the MRI experiments demonstrated hemorrhagic transformation in all nine animals that received rt-PA. Widespread hemorrhage was regularly observed in central striatal and cortical zones of the ischemic lesion. The mean hemorrhage volume in the ischemic hemisphere was 5.6 ± 3.5 μL at 3 hours after rt-PA (n = 8). Hemorrhagic transformation was present in four of the six control animals and was less extensive (mean hemorrhage volume = 2.8 ± 2.0 μL), but this difference was not statistically significant. After 24 hours, hemorrhage volume in the rt-PA–treated group was significantly greater than in the saline-treated group (8.7 ± 3.7 μL (n = 7) vs. 5.1 ± 2.4 μL (n = 6), P < 0.05).
The authors found a significant correlation between ADC lesion size before treatment and hemorrhage volume after treatment, both in rt-PA–treated (r = 0.754, P < 0.05) and saline-treated animals (r = 0.929, P < 0.05). In addition, the hemorrhage volume was inversely correlated with the rCBFi in the ipsilateral hemisphere after treatment (r = 0.863, P < 0.05 in rt-PA-treated rats;r = 0.642, P < 0.05 in saline-treated rats), but not with the pre–rt-PA rCBFi (r = 0.410, P = 0.313).
Signs of bleeding were not unequivocally detected on the MR images. In three rats, the authors observed a clear hypointensity on the raw MR images in areas of hemorrhagic transformation. These cases involved rt-PA–treated animals after 24 hours with a severe focal hemorrhage.
Post-Gd_DTPA T1 -weighted difference images that were acquired approximately 1 hour before rt-PA treatment (that is, 5 hours after MCA occlusion) displayed signal intensity enhancement throughout the entire lesion area (Fig. 5). In general, contrast enhancement was particularly notable in regions where hemorrhage emerged at later stages. However, areas with maximal contrast enhancement did not always match with areas with most severe intracerebral hemorrhage, consistent with the known heterogeneous nature of hemorrhagic transformation. Nevertheless, ROI analysis showed that regions that revealed hemorrhage on excised brain sections overall had significantly increased postcontrast T1 -weighted signal intensity enhancement before rt-PA therapy as compared with ipsi-and contralateral areas in which there was no apparent hemorrhagic transformation (Fig. 6). Also after 24 hours, postcontrast T1 -weighted signal intensity enhancement in regions with intracerebral hemorrhage was significantly greater than in areas without hemorrhagic transformation.
Post-Gd_DTPA T1 -weighted difference images of coronal brain slices 1 hour before rt-PA treatment (that is, 5 hours after middle cerebral artery occlusion)
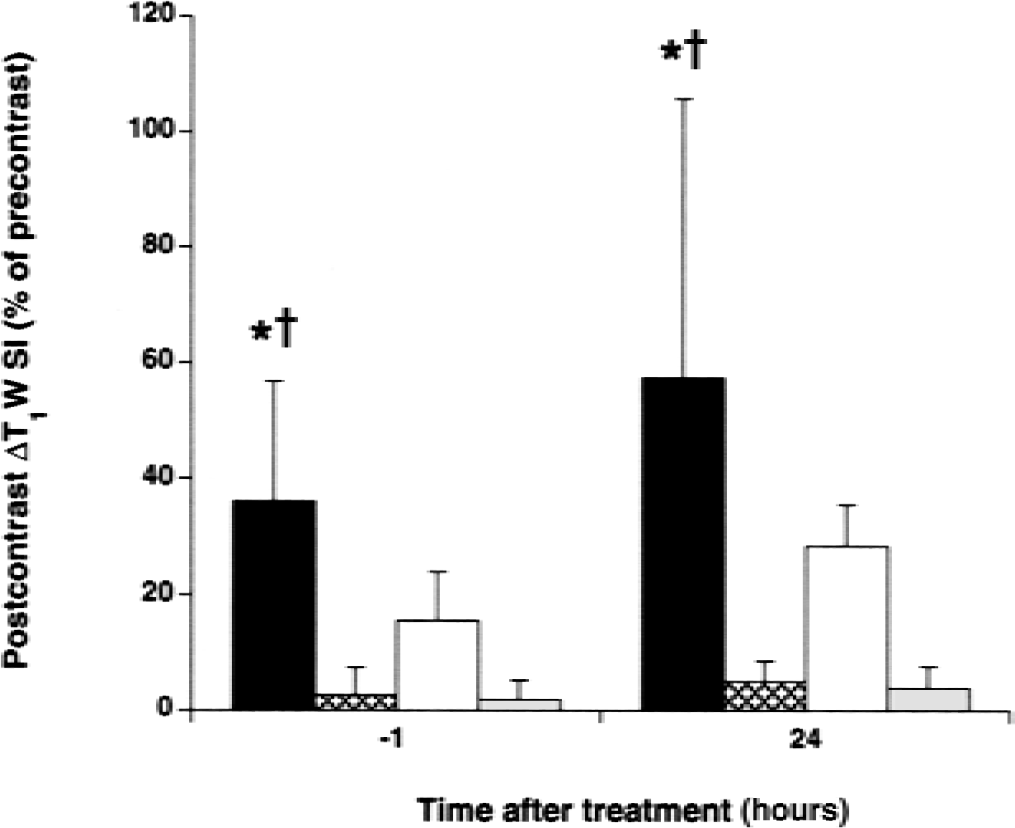
Postcontrast T1 -weighted signal intensity enhancement (postcontrast ΔT1 W SI) in regions of subsequent hemorrhagic transformation (black bars), in regions without hemorrhagic transformation (white bars), and in corresponding contralateral regions (dotted bars) as a function of time after rt-PA administration. * P < 0.05 versus contralateral. †P < 0.05 versus nonhemorrhagic.
Analysis of other MRI parameters in areas with subsequent hemorrhage showed that rCBFi levels were lower in regions of hemorrhagic transformation than in areas in which there was no detectable bleeding (P < 0.05). Pairwise comparison demonstrated a significantly lower rCBFi before rt-PA administration in regions with impending hemorrhage as compared with nonhemorrhagic regions (Fig. 7A). Finally, the authors found that after rt-PA administration, ADC levels increased significantly in areas of hemorrhagic transformation (Fig. 7B).
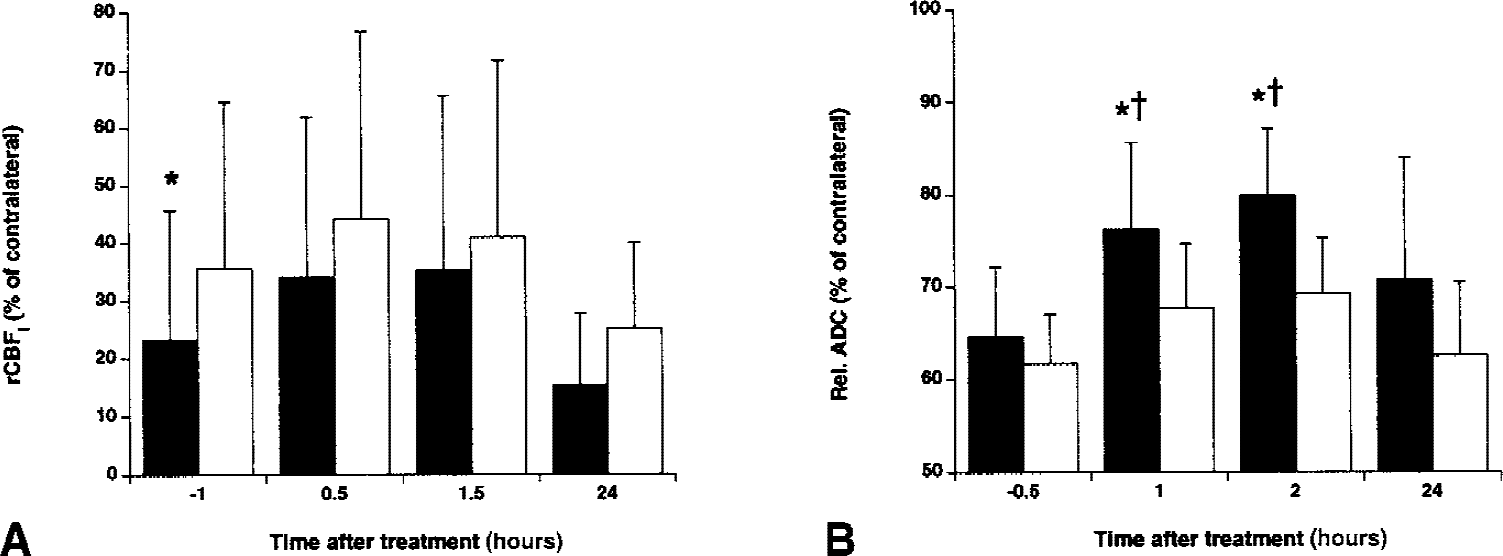
Relative cerebral blood flow index (rCBFI)
DISCUSSION
In this study, the authors used various MRI techniques to assess the relation between ischemic cerebral damage and intracerebral hemorrhage after delayed thrombolytic therapy with rt-PA in a rat embolic stroke model. The authors were particularly interested in the potential of MRI to predict risks of hemorrhagic transformation. Administration of rt-PA at 6 hours after MCA occlusion resulted in highly variable and incomplete perfusion recovery in the ischemic lesion. The lesion ADC increased significantly, in parallel with the T2 -weighted signal intensity. Intracerebral hemorrhage developed in all rt-PA-treated animals, and hemorrhage volume was related to the ischemic lesion size. Before rt-PA administration, clear postcontrast T1 -weighted signal intensity enhancement was evident in areas where hemorrhage emerged at later stages. Moreover, areas with later hemorrhage had significantly lower rCBFi levels as compared with areas with no apparent bleeding.
Although thrombolytic therapy with rt-PA has been demonstrated to be effective and beneficial after acute stroke, rt-PA administration is associated with increased risk of bleeding and may enhance ischemic brain injury. Hemorrhagic transformation naturally occurs in developing cerebral infarctions in up to 65% of the stroke patients (Fisher and Adams, 1951) and leads to increased mortality and morbidity. Hemorrhage risk factors include age and hypertension (Simoons et al., 1993). To mimic the clinical situation, the authors used an embolic stroke model with spontaneously hypertensive rats. In accordance with earlier studies (Brinker et al., 1999; Asahi et al., 2000), the current data demonstrate that embolic stroke in spontaneously hypertensive rats results in a high incidence of hemorrhagic transformation, and that hemorrhage volume significantly increases after rt-PA treatment. The authors found a positive correlation between severity of hemorrhage and lesion size (in both control and rt-PA–treated animals), which indicates that stroke severity affects the degree of hemorrhagic transformation.
Despite the increased risk of bleeding, some patients may still benefit from rt-PA therapy beyond 3 hours after stroke onset. In the current study, the authors monitored the effect of late rt-PA administration on the evolution of ischemic damage. Acute cerebral ischemia leads to a reduction of the ADC of brain tissue water, which supposedly reflects development of cytotoxic edema (that is, cell swelling) (Moseley et al., 1990; Verheul et al., 1994). Earlier studies have reported ADC recovery after rt-PA–induced thrombolysis (Busch et al., 1998; Jiang et al., 1998, 2000) and mechanically induced reperfusion (Dijkhuizen et al., 1998; Hasegawa et al., 1994; Li et al., 1999; van Lookeren Campagne et al., 1999), suggesting normalization of cell volume and reversal of initial ischemic tissue damage. In the current study, an increase of the water ADC in the brain was detected early after rt-PA injection. This ADC increase was accompanied by an elevation of T2 -weighted signal intensity. Beside dissolution of cytotoxic edema, the increase in ADC, parallel with T2 prolongation, also could involve an increase in interstitial, more freely diffusable brain water, that is, vasogenic edema. Vasogenic edema develops when the blood–brain barrier (BBB) is disrupted and can no longer withstand the hydrostatic pressure in the brain vasculature. The postcontrast T1 -weighted signal intensity enhancement and elevated T2 -weighted signal intensity before rt-PA administration were indicative of a leaky BBB and initial development of vasogenic edema, respectively. Thus, the rt-PA–induced increased brain tissue water ADC may not be solely associated with resolution of cytotoxic edema, but is possibly partly caused by enhanced extravasation of water through a damaged BBB. After 24 hours, the lesion size was significantly larger than at the acute stages, and the mean ADC in the lesion was decreased to pre–rt-PA levels. A secondary ADC drop and DWI lesion volume increase were reported in 3 of 6 patients who received intraarterial rt-PA within 6 hours after stroke (Kidwell et al., 2000). Secondary decline of the tissue water ADC has been described in transient cerebral ischemia models and was associated with delayed irreversible tissue damage (Dijkhuizen et al., 1998; Li et al., 1999; van Lookeren Campagne et al., 1999). Clearly, these results do not support a manifest beneficial treatment effect of late rt-PA administration.
Effective thrombolytic therapy requires lysis of the thromboembolic clot enabling reperfusion of ischemic tissue. In the current study, intravenous rt-PA delivery 6 hours after stroke onset did not invariably lead to successful reperfusion. It is possible that further recanalization may have occurred after the last PWI measurement (that is, 1.5 hours after rt-PA injection). However, after 24 hours, the mean rCBFi level in rt-PA–treated animals was still reduced and not significantly greater than in untreated controls. In principle, incomplete and delayed reperfusion after thrombolysis may be caused by migration of fractionally lysed clots, occluding more distal arteries. Confined reperfusion may also be related to severe cell swelling causing compression of the microvasculature. Finally, other mechanisms, such as interference of rt-PA with the endogenous hemostatic system and evolving blood clot–induced microvascular alterations, may contribute to variable restoration of perfusion.
Intracerebral hemorrhage was not explicitly detected on the MR images. Occasionally, the authors observed a local signal intensity loss, caused by the magnetic susceptibility effect of deoxygenated blood, but this was only found when hemorrhage was dense. The detection of mild to moderate hemorrhage may have been partially hampered by the ubiquitous high lesion T2 as a result of vasogenic edema (hyperintense on T2 /T2 *-weighted images). To assess the potential of MRI to predict impending intracerebral hemorrhage, the authors analyzed the ADC, rCBFi, and post-Gd_DTPA T1 -weighted signal intensity in areas of subsequent hemorrhagic transformation. Hemorrhage developed in areas with significantly reduced rCBFi and increased postcontrast T1 -weighted signal intensity enhancement. Using the intraluminal filament technique in rats, Knight et al. (1998) detected Gd_DTPA tissue enhancement in areas with subsequent bleeding early after reperfusion. Busch et al. (1997) detected widespread Gd_DTPA enhancement after early rt-PA administration in rats with embolic stroke, which was correlated with increased BBB disturbance. In the authors' model of embolic stroke in spontaneously hypertensive rats, leakage of contrast agent appeared before rt-PA–induced thrombolysis. Although contrast enhancement was evident throughout the entire lesion area and requires residual perfusion for contrast agent delivery, postcontrast T1 -weighted signal intensity increase was generally greater in ischemic areas where hemorrhage developed. Despite this apparent relation between contrast enhancement and hemorrhagic transformation, in accordance with Franke et al. (2000), the degrees of contrast enhancement and intracerebral hemorrhage were not invariably correlated. This could be explained by local variations in the distribution of Gd_DTPA because of nonuniform perfusion. Still, the current data indicate that hemorrhage largely emerges in areas with relatively low perfusion levels and early, serious BBB damage. Severe ischemia will lead to progressive damage to the microvasculature, a leaky BBB, and breakdown of the basal lamina, which eventually can lead to bleeding (del Zoppo et al., 1998). The correlation between hemorrhage volume and rCBFi after rt-PA treatment suggests that improvement of microcirculation may ameliorate further damage to the BBB and may prevent hemorrhagic transformation. Conversely, administration of rt-PA may aggravate degradation of microvascular barriers. Activation of the plasminogen-plasmin system by rt-PA not only induces fibrinolysis, but also may lead to proteolysis of extracellular matrix components, through activation of matrix metalloproteinases, which can result in intracerebral hemorrhage (Rosenberg and Navratil, 1997). After rt-PA administration, the ADC significantly increased in areas of hemorrhagic transformation, which may be explained by augmented efflux of vascular fluid. Collectively, these findings indicate that despite its potential to reverse cerebral ischemia, late intravenous rt-PA delivery seriously contributes to BBB breakdown, hemorrhagic transformation, and secondary edema formation.
The current study has shown that multiparametric MRI provides significant details on the acute effects of thrombolytic therapy and may help assess risks of impending intracerebral hemorrhage. Further research is required to clarify how this prognostic information actually correlates with long-term neurologic outcome. Nevertheless, stroke patients who could potentially benefit from rt-PA administration may be selected based on these prognostic criteria, which can be readily assessed with multiparametric MRI. This could improve the rate of successful treatment and may enlarge the population of stroke patients eligible for rt-PA therapy.